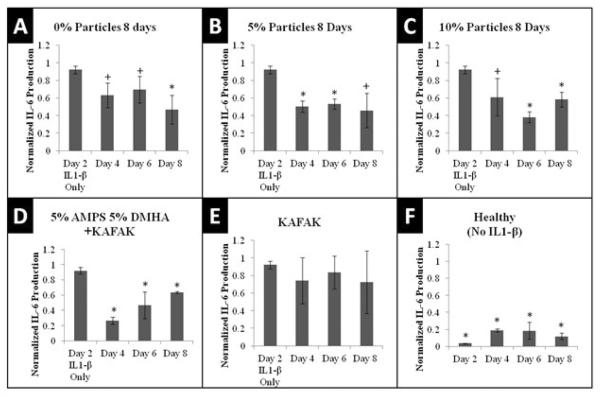
Figure 4.
IL-6 Production in Cartilage Plugs when dosed with 50μg nanoparticles loaded with KAFAK. Plots A–E represents aggrecan depleted plugs dosed with IL-1β. Plot F represents plugs with intact aggrecan and no IL-1β stimulation. Plots are normalized to individual plug weight and IL-6 production from the negative control and represent average ± SEM (N=4). *P<.05 or 0.05<+P<0.10 with respect to IL-1β only treatment

