Abstract
Current methods of protein detection are insensitive to detecting subtle changes in oncoprotein activation that underlie critical cancer signaling processes. The requirement for large numbers of cells precludes serial tumor sampling for assessing a response to therapeutics. Therefore, we have developed a nano-fluidic proteomic immunoassay (NIA) to quantify total and low abundance protein isoforms in 4 nanoliters of lysate. Our method could quantify levels of MYC and BCL2 proteins in Burkitt’s versus follicular lymphoma; identify changes in activation of ERK1/2, MEK1, STAT3/5, JNK and caspase 3 in imatinib-treated chronic myelogeneous leukemia (CML) cells; measure a novel change in phosphorylation of an ERK2 isomer in CML patients who responded to imatinib; and detect a decrease in STAT3/5 phosphorylation in lymphoma patients treated with atorvastatin. Therefore, we have described a novel and highly sensitive method for interrogating oncoprotein expression and phosphorylation in clinical specimens for the development of new therapeutics for cancer.
Introduction
Cancer is frequently associated with the abnormal expression and phosphorylation of oncogenes1–4. Specific hematopoietic tumors are frequently characterized by the discrete activation of specific oncogenes such as MYC5–7. BCL28,9 and BCR-ABL10–13. Targeted inactivation of oncoproteins is emerging as a specific and effective therapy for cancer14,15. The best known example of a targeted therapy is imatinib mesylate, a small molecule that inactivates several tyrosine kinases including the BCR-ABL tyrosine kinase in CML16–18. Imatinib treatment results in tumor cell signaling changes in vitro, leading to cell death19,20. In general, the ability to detect specific oncoproteins and their activation state is likely to be highly useful towards the development of new therapeutics as well as monitoring the effectiveness of these treatments, and evaluating apparent therapeutic resistance13,21.
In order to accurately measure oncoprotein expression and activation in limited clinical specimens, we have developed a nano-fluidic proteomic immunoassay detection method (NIA) that combines isoelectric protein focusing and antibody detection. Here we demonstrate that we can use this new technique to quantitate oncoprotein expression and phosphorylation in clinical specimens to precisely measure specific changes in phospho-isomers of oncoproteins in vitro and in vivo.
Results
NIA Detection of Oncoprotein Expression in Clinical Specimens
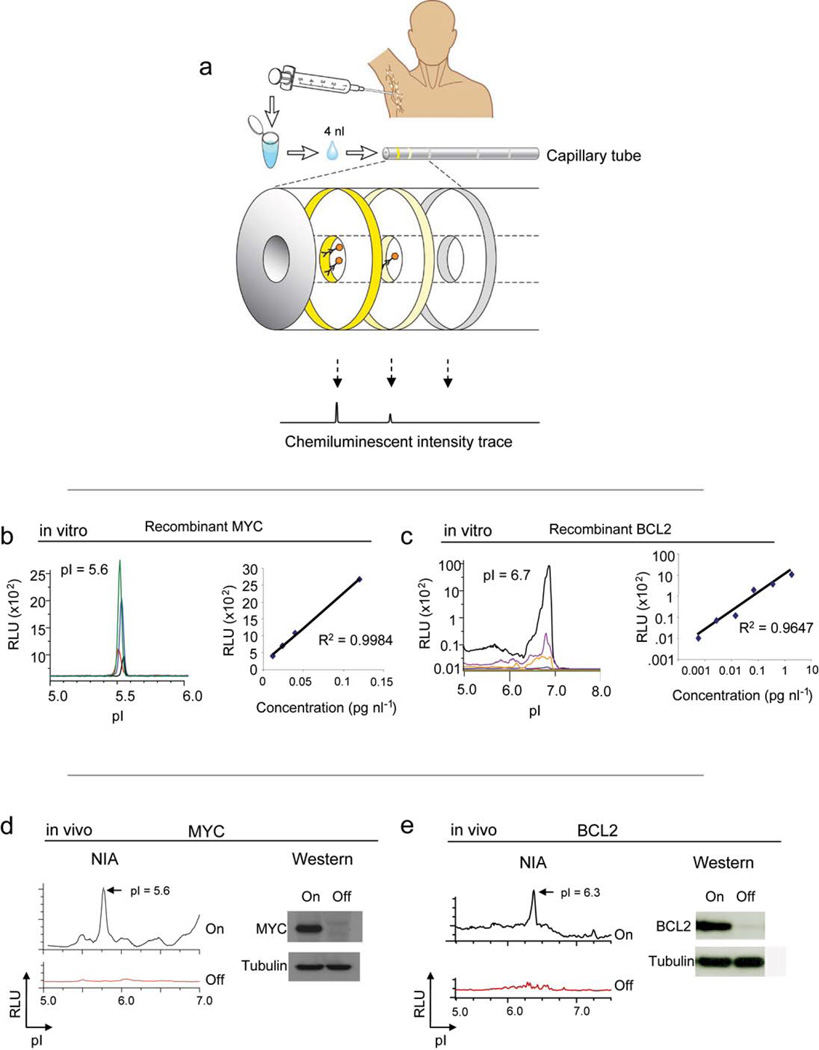
NIA incorporates isoelectric focusing of proteins, followed by antibody detection of specific epitopes with chemiluminescence22. The chemiluminescent signal is rendered as a chemiluminescence isoelectropherogram (trace) of “relative luminescence units (RLU)” on the y-axis vs. isoelectric point (pI) on the x-axis (figure 1a). As little as 2 picograms of MYC could be detected using 4 nanoliters of recombinant protein per capillary (final capillary concentration 0.004– 0.12 pg/nl) at the expected isoelectric point (pI) of 5.6 with a linear response (figure 1b, R2 = 0.9984). Concentrations of BCL2 could be detected over up to a 3-log dynamic range at pI 6.7 (figure 1c, R2 = 0.9647). Therefore, NIA is highly quantitative and sensitive over a large dynamic range.
Figure 1. NIA for the quantitative analysis of oncoproteins.
(a) Schema of the use of NIA for the measurement of oncoproteins from clinical specimens. NIA can be used to measure oncoprotein expression and phosphorylation in clinical specimens. NIA incorporates charge-based separation coupled with antibody detection. (b–c) Detection of recombinant MYC or BCL2 oncoproteins by NIA. Representative NIA traces of MYC (black= 0.004 pg/nl, red= 0.012 pg/nl, blue = 0.04 pg/nl, green= 0.12 pg/nl) or BCL2 (green=0.0019 pg/nl, red=0.0075 pg/nl, blue= 0.03 pg/nl, orange= 0.12 pg/nl, purple=0.47 pg/nl, black = 1.8 pg/nl) are shown. The data is represented as the normalized peak area versus protein concentration. The calculated correlation coefficients are shown. (d–e) NIA could be used to detect oncoproteins in transgenic mouse tumors obtained from serial FNAs. Serial FNA’s were obtained from subcutaneous tumors in mice before and after the suppression of expression of MYC or BCL2. Corresponding Western analysis is also shown. Data is represented as peak areas detected by NIA; mean of three replicates per sample +/− the standard error.
Next, we assessed the ability to detect oncoproteins in tumor cell lines both in vitro and in vivo. Previously, we have described the generation of a conditional transgenic lymphoma model that uses the Tet-off system to regulate oncoprotein expression23–25. In our tumor derived cell lines, MYC and BCL2 were readily detected by NIA, comparable to Western analysis (supplementary figure 1 online). Each oncoprotein measurement from these tumor lysates exhibited a characteristic peak profile defined by how post-translational modifications influence its isoelectric point. The profile obtained from mouse tumor lines was different from the recombinant BCL2 described above because NIA is exquisitely sensitive to the cationic charge associated with the histidine tag of the recombinant protein. Our results elaborate how NIA can distinguish and measure oncoprotein expression from tumor cell lines.
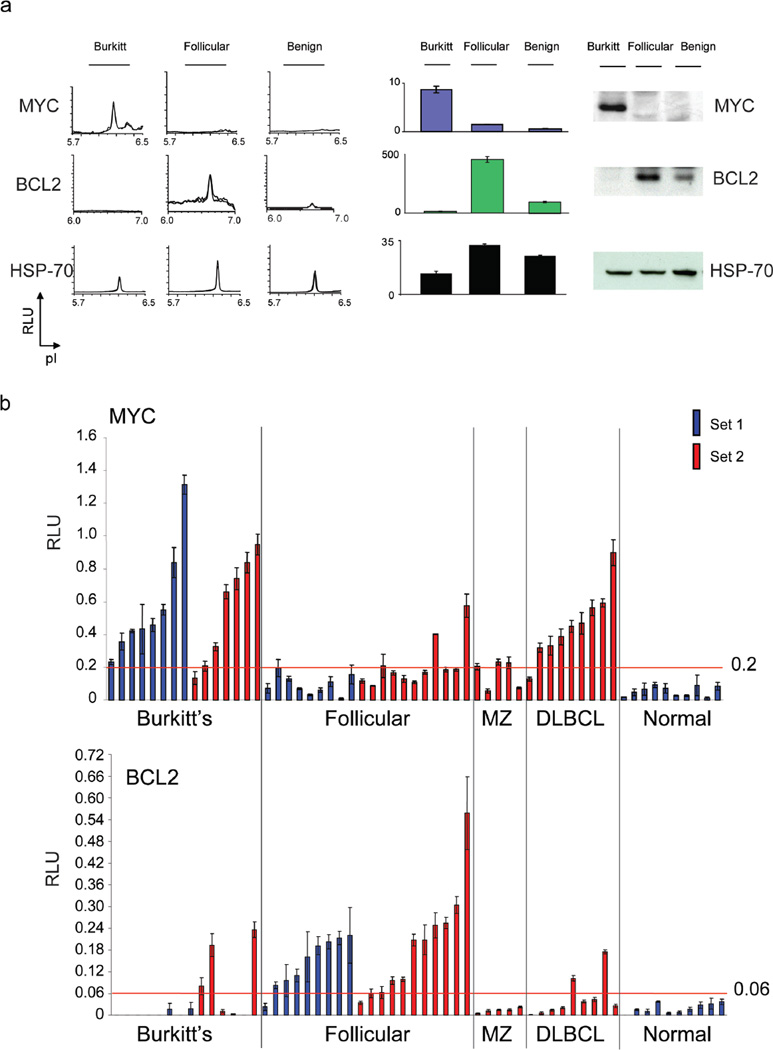
To evaluate if we could quantitatively detect oncoprotein expression in vivo, conditional mouse tumor-derived cell lines were inoculated into syngeneic mice. Examination of serial tumor samples by fine needle aspiration (FNA) confirmed that both MYC and BCL2 expression could be readily detected and quantitated in vivo by NIA with results comparable to Western analysis (figure 1d, e). To measure oncoprotein expression in human tumors, MYC and BCL2 levels were measured in four lymphomas and two benign lymph nodes. High levels of MYC protein commonly associated with Burkitt’s lymphoma and high levels of BCL2 characteristic of follicular lymphoma were detected (figure 2a). Thus, NIA can reproducibly detect changes in oncoprotein expression even from limited clinical biopsy specimens in mouse or human tumor specimens both in vitro and in vivo.
Figure 2. NIA for the detection of oncoproteins in human cancer specimens.
(a) NIA was performed on six clinical biopsy specimens for MYC, BCL2 and HSP 70. Representative traces are shown (left). Bar graph data is represented as peak areas detected by NIA; mean of four replicates per sample +/− the standard error (center). Western blot was also performed (right). (b) NIA was used for the prospective analysis of MYC and BCL2 oncoprotein expression in two sets of patient specimens. Normalized NIA data is graphed. Set 1 included 8 Burkitt’s lymphoma, 9 follicular lymphoma, and 10 normal samples (the first 4 normal specimens were benign lymph nodes and the last 6 normal specimens were control peripheral mononuclear cell samples). Set 2 included 7 Burkitt’s lymphoma, 11 follicular lymphoma, 5 marginal zone lymphoma and 9 diffuse large B cell lymphoma specimens. Data is represented as the normalized peak areas detected by NIA; mean of four replicates per sample +/− the standard error.
Our results suggested that we may be able to precisely quantify levels of oncoproteins in clinical specimens. Analysis was performed on a set of 27 human specimens that included Burkitt’s lymphoma, follicular lymphoma, benign lymph nodes, or normal peripheral blood mononuclear cells (PBMC’s) (set 1, figure 2b, c). In our first series (set 1), Burkitt’s lymphoma samples expressed MYC at a level higher than all of the other sample groups (Mann Whitney test, p<0.0001). All Burkitt’s lymphoma specimens had a MYC level greater than 0.2 RLU, compared with 11% of follicular lymphoma. Follicular lymphoma samples expressed significantly higher BCL2 than all other sample groups (Mann Whitney test, p<0.0001); 89% of follicular lymphoma patients had a BCL2 level higher than 0.06 RLU, compared with none of the Burkitt’s patients. BCL2 was detectable and quantifiable even in normal specimens. NIA was quantitative enough to distinguish statistically significant differences in oncoprotein expression between lymphomas.
To validate our results, we next quantified MYC and BCL2 in a new series of clinical specimens including seven Burkitt’s lymphoma, 11 follicular lymphoma, nine diffuse large B cell lymphoma (DLBCL) and five marginal zone lymphoma (MZ) specimens (figure 2b, c, set 2). We confirmed that the MYC threshold of 0.2 RLU and the BCL2 threshold of 0.06 RLU were statistically significant for distinguishing Burkitt’s from follicular lymphoma (Fisher’s exact test, two tailed: p= 0.0498 and 0.0474, respectively). We observed that two of nine DLBCL tumors overexpressed BCL2 and many tumors expressed high increased levels of MYC. In contrast, marginal zone lymphomas expressed a low mean level of 0.18 RLU MYC. Hence, we found different levels of MYC and BCL2 expression in 44 of 49 tumor specimens when compared with normal controls.
NIA Measurement of Oncoprotein Phosphorylation in Clinical Specimens
An important feature of NIA is that it can be used to identify phosphorylated isoforms of a protein22. ERK and distinct patterns of phospho-isomers were detected in the normal and lymphoma specimens (supplementary figure 2a online). Next, we identified MEK 1 and MEK 2 isomers (supplementary figures 2b and 3 online). Experiments were performed in quadruplicate and were highly reproducible. We could detect as little as a 10% difference in phosphorylated ERK and MEK. Our results show that NIA is highly sensitive, reproducible and quantitative.
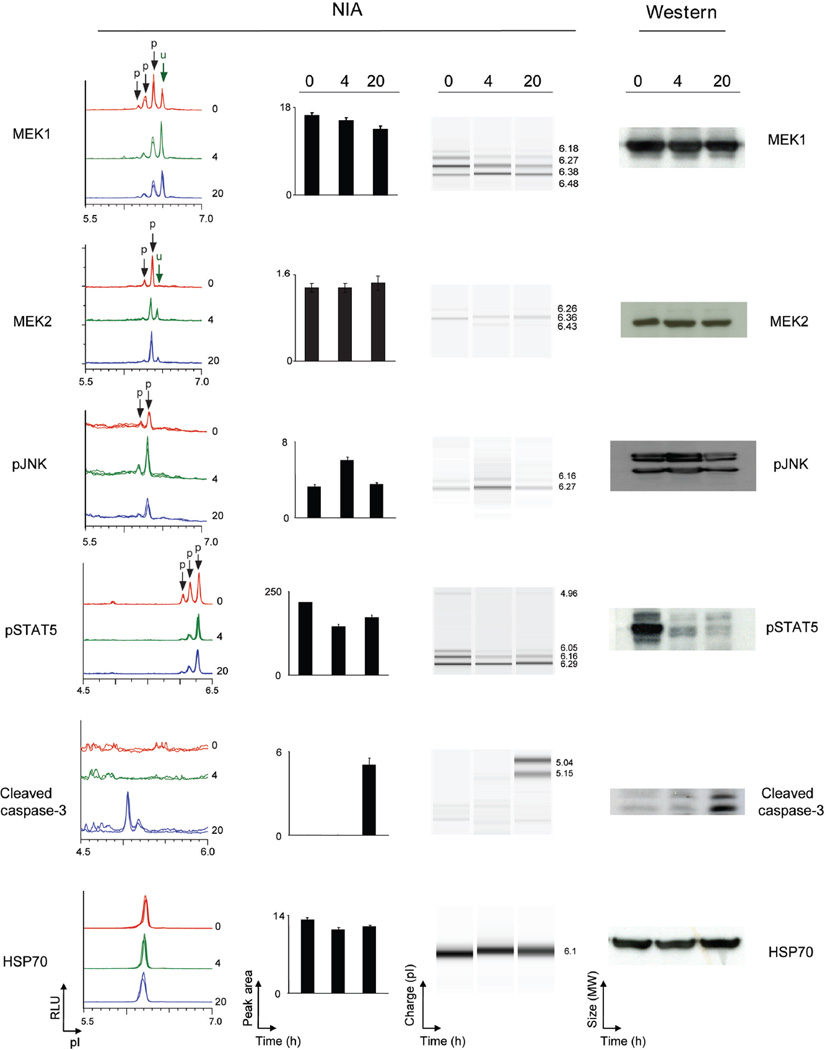
Next, we evaluated if we could detect specific protein signaling changes in human tumors in response to targeted therapy. Treatment of the K562 human CML cell line with imatinib in vitro resulted in changes in phosphorylation of STAT3/5, JNK, MEK1 and MEK2 and an expected increase in activated caspase-3 associated with apoptosis (figure 3, supplementary figure 4 online). To facilitate comparison with Western blot results, data was converted into a “pseudo-blot” representation. In a pseudo-blot, the area under each NIA peak is represented as a band at the corresponding isoelectric point. By visualizing different isoforms we were able to identify that imatinib treatment was associated with a decrease in a specific ERK2 phospho-isomer (supplementary figure 5a online). Thus, NIA appeared to detect a unique signaling change in response to the targeted therapeutic agent, imatinib.
Figure 3. NIA detection of changes in oncoprotein activation in CML cells treated with imatinib.
NIA was used to quantify proteomic changes in the K562 cell line in response to imatinib in vitro in K-562 cell line was treated with imatinib in vitro for 0, 4, and 20 hours. MEK1, MEK2, pJNK, pSTAT5 and activated caspase 3 were detected by NIA (from left to right: representative traces for the protein of interest, bar graph of NIA quantification for each protein, NIA pseudoblot representation, and Western Blot data). Peaks on the traces that represent phosphorylated isoforms are indicated with black arrows. All measurements were performed in six replicates and bar graph data is represented as the mean peak area +/− standard error.
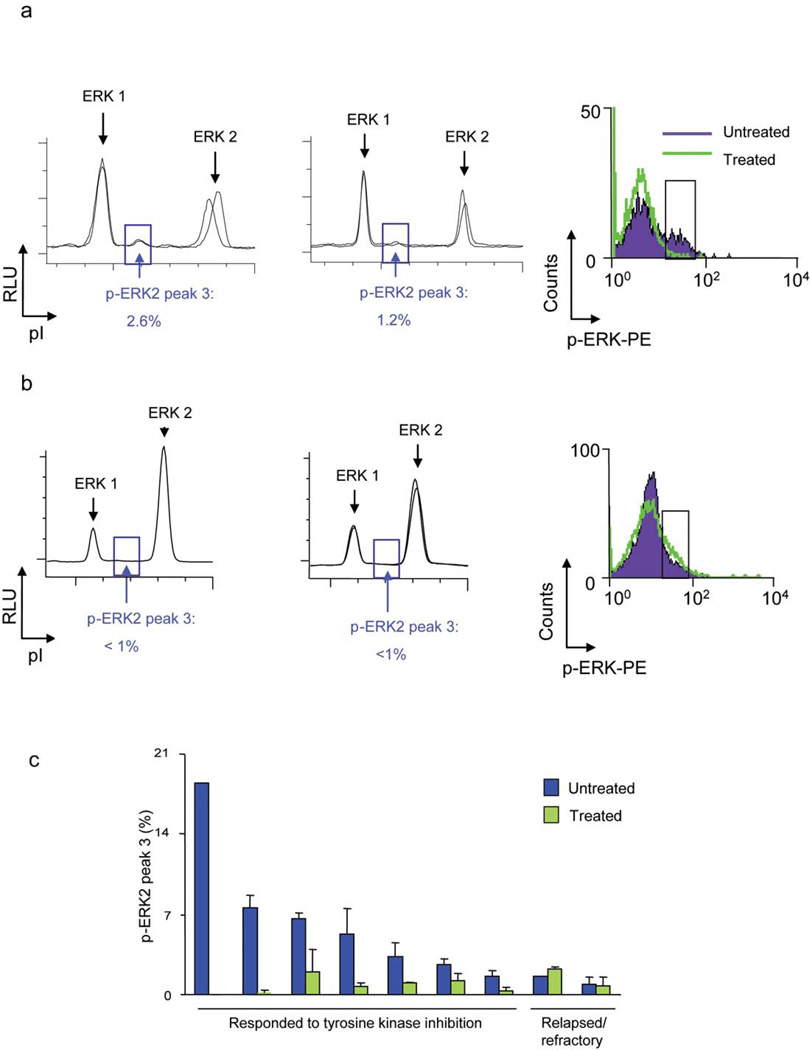
To evaluate if we could identify changes in protein signaling in vivo in clinical specimens, we measured changes in oncoprotein signaling in the tumor cells in the peripheral blood of CML patients treated with tyrosine kinase inhibitors. All seven patients that responded to tyrosine kinase inhibitor therapy exhibited a 54–100% decrease in a mono-phosphorylated ERK2 isoform (note peak 3; figure 4a and supplementary figures 5b, c), whereas two patients that were resistant to tyrosine kinase inhibitor therapy did not (figure 4c, supplementary table 1 online). Although basal ERK2 expression was not different (supplementary figure 6 online), the relative fold-change in ERK2 phosphorylation was different between CML patients that respond versus those that did not (unpaired t-test, 2 tailed = 0.0007). Thus, NIA may have identified a specific change in ERK phosphorylation that appears to be associated with a clinical response to effective therapy.
Figure 4. NIA detected changes in phospho-ERK in CML patients who responded to imatinib treatment.
(a) Representative NIA traces of total ERK are shown for a patient who responded to treatment. Traces before initiating treatment (left) and and during treatment (center) are shown. Note specific change in abundance of phospho-ERK2 (peak 3) as highlighted by the blue box. Similar results were obtained by FACS analysis of clinical specimens (right). Phospho-ERK changes detected by FACS are highlighted by a black box. (b) Representative NIA traces of total ERK are shown for a patient for a patient who failed to respond to treatment. (c) Phospho-ERK2 decreased in response to imatinib. Quantification of NIA phospho-ERK2 peak 3 analysis of 8 patients before and after initiating treatment is shown. Results are represented as the percentage of phospho-ERK2 peak 3 divided by the sum of total phospho- and unphosphorylated ERK peaks. Experiments were performed in triplicate.
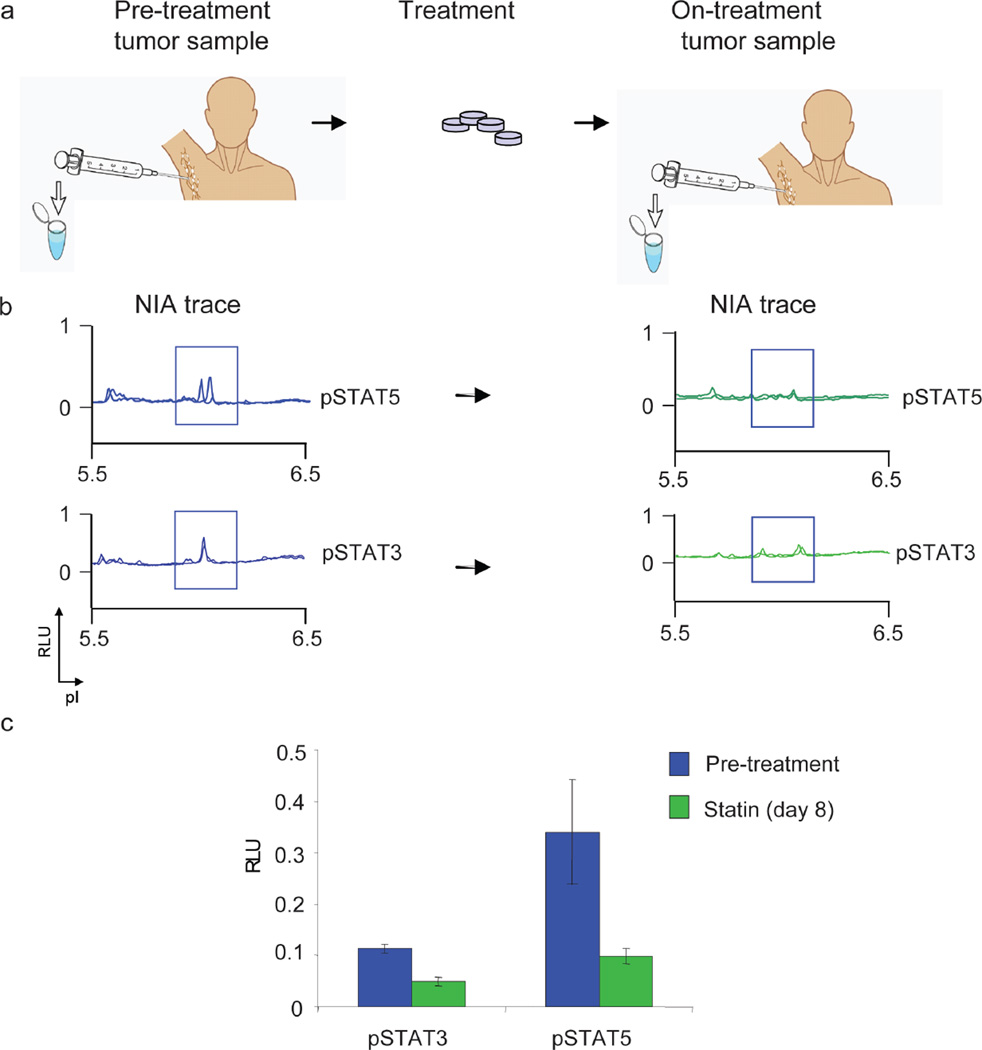
Finally, we interrogated if NIA could be used to serially monitor the response of a patient’s tumor to a potential biologic response modifier in vivo. Recently, we described that atorvastatin treatment causes tumor regression associated with specific changes in oncoprotein signaling in a mouse model of lymphoma26. We have investigated if atorvastatin has biological activity in human patients with lymphoma. We could demonstrate that patients treated with atorvastatin exhibited detectable decreases in phosphorylation of STAT3/5 after eight days of treatment (figure 7). Thus, we found that atorvastatin has unanticipated in vivo biologic activity against human lymphoma cells.
Discussion
We have developed a highly sensitive and reproducible nanoscale technology to measure oncoprotein expression and phosphorylation and to identify the biological response to therapeutics. Our method detected as little as 2 picograms of protein in as few as 4 nanoliters of material over a 3-log dynamic range. We quantified MYC and BCL2 oncoproteins as well as changes in cancer signaling proteins including ERK, MEK, JNK, STAT3/5 and apoptotic proteins such as caspase 3. The requirement of only a small amount of material enabled us to analyze serial samples of the same tumor in vivo, as we demonstrated in mouse models of lymphoma and in human tumor specimens; oncoprotein phosphorylation decreased in patient samples obtained before and after initiating treatment with imatinib or atorvastatin. We have demonstrated that our method may have utility both for pre-clinical and clinical studies.
Our method enables the analysis of solid tissue specimens such as from tumor biopsies, as we illustrate through the analysis of lymphoma specimens. Thus we could quantify differences in MYC and BCL2 oncoprotein expression in normal lymph tissue and different non-Hodgkin’s lymphoma subtypes, including Burkitt’s and Follicular lymphomas. DLBCL and marginal zone lymphomas were not as readily distinguished, underlining that lymphomas can have complex patterns of oncoprotein overexpression and single proteomic measurements are not sufficient to distinguish most subtypes.27–38. The pathological diagnosis of lymphoma as well as other tumor subtypes requires the combination of a number of analytical methods including histological, biochemical and genetic techniques. Our approach has unique features that may complement these existing methodologies.
We could precisely measure oncoprotein isoforms that may be useful in the analysis of the therapeutic response in clinical tumor specimens. Previously, in vitro studies had suggested that treatment of CML tumor lines with imatinib results in decreased ERK phosphorylation19,20. Using our approach, we were able to identify specific and rare ERK isoforms in vivo in patients with CML that would only be detectable with large amounts of tumor tissue for alternate techniques of 2-D blots or mass spectrometry. Charge-based separation via isoelectric focusing of each protein isoform based upon its unique pI allowed simultaneous quantification of multiple isoforms of the same protein in relative proportions that could not have been detected a priori by Western or FACS techniques. Our results would have been missed by conventional immunoassay or flow cytometric (FACS) techniques since commercially available immunoreagents for activated ERK are raised against the dual phospho-ERK epitopes. Unlike FACS, our samples did not require processing into a single cell suspension, fixation or permeabilization. Furthermore, decreased ERK2 phosphorylation correlated with the clinical response to TK inhibitors. Future studies will determine if ERK2 phosphorylation will identify the 15% of patients that eventually fail imatinib.
In addition, we were able to serially sample tumors in patients with lymphoma for a biologic response to a therapeutic agent, atorvastatin. Our observations are consistent with our previous description that atorvastatin decreases STAT3/5 phosphorylation in mouse models of lymphoma26. We proposed as an explanation for these findings that atorvastatin leads to the inhibition and inactivation of signaling molecules, as evidenced by dephosphorylation of signaling pathways26. Our observations illustrate that NIA could be similarly used to interrogate the protein signature of and identify biomarkers for response to known and novel therapeutic agents.
Our results demonstrate how a nanoscale proteomic technology can be used to uncover unanticipated changes in protein signaling in vivo. Small perturbations in the equilibrium between active and inactive protein isoforms may have dramatic effects on the biologic state of a cell39. Our approach provides a new technique that could be incorporated into pre-clinical and clinical studies to evaluate subtle shifts in protein abundance and modification that may be useful for the discovery of new drugs that target protein pathways and the identification of biomarkers of therapeutic efficacy.
Methods
Nano-fluidic proteomic immunoassay (NIA)
The NIA experiments were performed using a Firefly™ instrument (Cell Biosciences)22. Briefly, for each capillary analysis, 4 nanoliters of 10 mg/ml lysate were diluted to 0.2 mg/ml in 200 nanoliters HNG [20mM Hepes pH 7.5, 25mM NaCl, 0.1%, 10% glycerol, Sigma Phosphatase Inhibitor Cocktail 1, Calbiochem Protease Inhibitor]. 200 nanoliters sample mix containing internal pI standards were added. The Firefly system first performed a charge-based separation (isoelectric focusing) in a 5 cm long, 100 micron inner-diameter capillary. Predicted pI’s were calculated using Scansite40. Each sample was run on a panel of different pH gradients (3–10, 5–9) to optimize the resolution of different peak patterns. After separation and photo-activated in-capillary immobilization, proteins were detected with antibodies: MYC protein expression was detected using the C-19 rabbit polyclonal antibody that recognizes mouse and human MYC (Santa Cruz Biotechnology). BCL2 protein expression was detected using the clone 124 mouse monoclonal antibody that recognizes human BCL2 (Dako Laboratories). Total ERK1/2 protein expression was detected using a rabbit polyclonal antibody that recognizes mouse and human ERK1/2 (Upstate). Phospho-ERK 1/2 protein expression was detected using a mouse monoclonal antibody that recognizes both mouse and human pERK 1/2 (Cell Signaling). Additional antibodies used were: activated caspase 3 (Cell Signaling), MEK1 (Upstate), pMEK1 (Novus), MEK2 (Abcam), pSTAT3 (Cell Signaling), pSTAT5 (Cell Signaling), pJNK (Cell Signaling), HSP70 (Novus).
NIA peak area quantitation
Quantitation of the peaks is performed using peak analysis software. The start and end of each peak, and a flat baseline were manually selected. The area of each peak was calculated by dropping verticals to the baseline at the peak start and end, and summing the area between the start and endpoints. NIA has been shown to be able to discriminate between and quantitate phosphorylated and unphosphorylated isoforms of ERK in a single sample, using a total ERK antibody22. The areas under different peaks within a single tracing represented various ERK isoforms. To calculate the percentage p-ERK2 peak 3, the area under peak 3 was divided by the sum of the area under the total ERK peaks. Samples were run in duplicate.
NIA pseudo-blot generation
The pseudo-blots were created by a linear mapping of the signal intensity to a grayscale image. Each pseudo-blot lane is representative of a single capillary and consists of horizontal bands corresponding proportionally to the signal present. Absence of signal is white, while increasing signal is seen as an increasing dark band. It should be noted that what is seen as a single band of protein in a size-based western, can appear as a single band by NIA or multiple bands when multiple charged isomers of the protein are present.
Human tumor samples
Tissues were obtained and banked from patients per Stanford University IRB- approved protocols. Informed consent was obtained from all subjects. Burkitt lymphomas and T-ALL tissues were frozen in OTC blocks. Follicular lymphomas were dissociated into single cell suspension and stored in heat inactivated FBS +10% DMSO in liquid nitrogen. CML and CLL cells were isolated from total blood by ficoll separation, resuspended in heat inactivated FBS +10% DMSO, and stored in liquid nitrogen. Tumor cells stored in liquid nitrogen were thawed at 37°C into pre-warmed PBS and washed once in PBS immediately before use.
Data and statistical analysis
NIA Multipeak fitting and peak area calculations were done with Peak Fit v4.11 (Systat Software), using Gaussian peaks with variable widths, as previously described22. To obtain R2 correlation coefficients, the best fit line was calculated by linear regression with IGOR Pro version 5.03 (Wavemetrics). NIA quantitations of MYC and BCL2 were compared to the relative intensity of respective quantified Western Blot bands using Pearson correlation. Paired t-test (two-tailed) was used to analyze percent of p-ERK2 peak 3 before and during treatment. Mann Whitney Rank sum test was performed on the panels of patient specimens using Prism v4.0 (GraphPad). Prism v4.0 (GraphPad) was also used for Fisher’s exact test (2 tailed) analysis of contingency table data for MYC and BCL2.
Normalization of NIA data
Normalization of NIA data was performed in a similar fashion as traditional western blots or other molecular biology assays. HSP70 was used as a “housekeeping” protein for NIA normalization. Relative luminescent units (RLU) were calculated by dividing the measured peak area for protein of interest by the measured peak area of HSP-70 and expressed as a percentage. Across different experiments, a standardized lysate control was used for calibration of instruments and runs.
Supplementary Material
Figure 5. NIA Detected Decrease in Oncoproteins upon Treatment with Biologic Response Modifying Therapeutic Agent.
(a) Schema for the use of NIA to assess proteomic changes in clinical tumor specimens. Patients undergo pre-treatment tumor sampling at baseline and again after 8 days of treatment with atorvastatin. (b) Tumor cells were analyzed by NIA for changes in pSTAT3/5. (c) NIA quantification of pSTAT3/5 +/− SEM. Samples were run in triplicate.
Acknowledgements
This manuscript is dedicated to the memory of Roger O’Neill. This work was supported, in part, by the NCI grants CA89305, CA034233, Burroughs Welcome Fund, the Damon Runyon Foundation (DWF), and the Leukemia and Lymphoma Society (ACF). We thank the members of the Felsher laboratory for their helpful suggestions. Dr. Wen-Kai Weng, Stanford Bone Marrow Transplantation Division, for providing access to previously banked tumor samples and the Stanford Hematology Division Tissue Bank for use of samples.
References
- 1.Futreal PA, et al. Cancer and genomics. Nature. 2001;409:850–852. doi: 10.1038/35057046. [DOI] [PubMed] [Google Scholar]
- 2.Harris H. Tumour suppression: putting on the brakes. Nature. 2004;427:201. doi: 10.1038/427201a. [DOI] [PubMed] [Google Scholar]
- 3.Sharpless NE, DePinho RA. Cancer: crime and punishment. Nature. 2005;436:636–637. doi: 10.1038/436636a. [DOI] [PubMed] [Google Scholar]
- 4.Vogelstein B, Kinzler KW. Cancer genes and the pathways they control. Nat Med. 2004;10:789–799. doi: 10.1038/nm1087. [DOI] [PubMed] [Google Scholar]
- 5.Dalla-Favera R, et al. Human c-myc onc gene is located on the region of chromosome 8 that is translocated in Burkitt lymphoma cells. Proc Natl Acad Sci U S A. 1982;79:7824–7827. doi: 10.1073/pnas.79.24.7824. [DOI] [PMC free article] [PubMed] [Google Scholar]
- 6.Ferry JA. Burkitt's lymphoma: clinicopathologic features and differential diagnosis. Oncologist. 2006;11:375–383. doi: 10.1634/theoncologist.11-4-375. [DOI] [PubMed] [Google Scholar]
- 7.Dang CV, O'Donnell KA, Juopperi T. The great MYC escape in tumorigenesis. Cancer Cell. 2005;8:177–178. doi: 10.1016/j.ccr.2005.08.005. [DOI] [PubMed] [Google Scholar]
- 8.Tsujimoto Y, Cossman J, Jaffe E, Croce CM. Involvement of the bcl-2 gene in human follicular lymphoma. Science. 1985;228:1440–1443. doi: 10.1126/science.3874430. [DOI] [PubMed] [Google Scholar]
- 9.Bordeleau L, Berinstein NL. Molecular diagnostics in follicular non-Hodgkin's lymphoma: a review. Semin Oncol. 2000;27:42–52. [PubMed] [Google Scholar]
- 10.Lugo TG, Pendergast AM, Muller AJ, Witte ON. Tyrosine kinase activity and transformation potency of bcr-abl oncogene products. Science (New York, N.Y. 1990;247:1079–1082. doi: 10.1126/science.2408149. [DOI] [PubMed] [Google Scholar]
- 11.Melo JV, Barnes DJ. Chronic myeloid leukaemia as a model of disease evolution in human cancer. Nat Rev Cancer. 2007;7:441–453. doi: 10.1038/nrc2147. [DOI] [PubMed] [Google Scholar]
- 12.Weisberg E, Manley PW, Cowan-Jacob SW, Hochhaus A, Griffin JD. Second generation inhibitors of BCR-ABL for the treatment of imatinib-resistant chronic myeloid leukaemia. Nat Rev Cancer. 2007;7:345–356. doi: 10.1038/nrc2126. [DOI] [PubMed] [Google Scholar]
- 13.Ghaffari S, Daley GQ, Lodish HF. Growth factor independence and BCR/ABL transformation: promise and pitfalls of murine model systems and assays. Leukemia. 1999;13:1200–1206. doi: 10.1038/sj.leu.2401467. [DOI] [PubMed] [Google Scholar]
- 14.Felsher DW. Cancer revoked: oncogenes as therapeutic targets. Nat Rev Cancer. 2003;3:375–380. doi: 10.1038/nrc1070. [DOI] [PubMed] [Google Scholar]
- 15.Giuriato S, Rabin K, Fan AC, Shachaf CM, Felsher DW. Conditional animal models: a strategy to define when oncogenes will be effective targets to treat cancer. Semin Cancer Biol. 2004;14:3–11. doi: 10.1016/j.semcancer.2003.11.002. [DOI] [PubMed] [Google Scholar]
- 16.Druker BJ, et al. Efficacy and safety of a specific inhibitor of the BCR-ABL tyrosine kinase in chronic myeloid leukemia. The New England journal of medicine. 2001;344:1031–1037. doi: 10.1056/NEJM200104053441401. [DOI] [PubMed] [Google Scholar]
- 17.Kantarjian H, et al. Hematologic and cytogenetic responses to imatinib mesylate in chronic myelogenous leukemia. The New England journal of medicine. 2002;346:645–652. doi: 10.1056/NEJMoa011573. [DOI] [PubMed] [Google Scholar]
- 18.Weisberg E, et al. Characterization of AMN107, a selective inhibitor of native and mutant Bcr-Abl. Cancer Cell. 2005;7:129–141. doi: 10.1016/j.ccr.2005.01.007. [DOI] [PubMed] [Google Scholar]
- 19.Brozik A, et al. Reduction of Bcr-Abl function leads to erythroid differentiation of K562 cells via downregulation of ERK. Ann N Y Acad Sci. 2006;1090:344–354. doi: 10.1196/annals.1378.038. [DOI] [PubMed] [Google Scholar]
- 20.Kohmura K, Miyakawa Y, Kawai Y, Ikeda Y, Kizaki M. Different roles of p38 MAPK and ERK in STI571-induced multi-lineage differentiation of K562 cells. J Cell Physiol. 2004;198:370–376. doi: 10.1002/jcp.10426. [DOI] [PubMed] [Google Scholar]
- 21.Solit DB, et al. BRAF mutation predicts sensitivity to MEK inhibition. Nature. 2006;439:358–362. doi: 10.1038/nature04304. [DOI] [PMC free article] [PubMed] [Google Scholar]
- 22.O'Neill RA, et al. Isoelectric focusing technology quantifies protein signaling in 25 cells. Proc Natl Acad Sci U S A. 2006;103:16153–16158. doi: 10.1073/pnas.0607973103. [DOI] [PMC free article] [PubMed] [Google Scholar]
- 23.Felsher DW, Bishop JM. Reversible tumorigenesis by MYC in hematopoietic lineages. Mol Cell. 1999;4:199–207. doi: 10.1016/s1097-2765(00)80367-6. [DOI] [PubMed] [Google Scholar]
- 24.Karlsson A, et al. Genomically complex lymphomas undergo sustained tumor regression upon MYC inactivation unless they acquire novel chromosomal translocations. Blood. 2003;101:2797–2803. doi: 10.1182/blood-2002-10-3091. [DOI] [PubMed] [Google Scholar]
- 25.Giuriato S, et al. Sustained regression of tumors upon MYC inactivation requires p53 or thrombospondin-1 to reverse the angiogenic switch. Proc Natl Acad Sci U S A. 2006;103:16266–16271. doi: 10.1073/pnas.0608017103. [DOI] [PMC free article] [PubMed] [Google Scholar]
- 26.Shachaf CM, et al. Inhibition of HMGcoA reductase by atorvastatin prevents and reverses MYC-induced lymphomagenesis. Blood. 2007;110:2674–2684. doi: 10.1182/blood-2006-09-048033. [DOI] [PMC free article] [PubMed] [Google Scholar]
- 27.Mitani S, Sugawara I, Shiku H, Mori S. Expression of c-myc oncogene product and ras family oncogene products in various human malignant lymphomas defined by immunohistochemical techniques. Cancer. 1988;62:2085–2093. doi: 10.1002/1097-0142(19881115)62:10<2085::aid-cncr2820621003>3.0.co;2-r. [DOI] [PubMed] [Google Scholar]
- 28.Wennborg AD, Altiok E, Moore JP, Ernberg I, Klein G. Differential c-myc protein expression in Burkitt's lymphomas and EBV-transformed lymphoblastoid lines. European journal of cancer. 1991;27:1643–1645. doi: 10.1016/0277-5379(91)90436-h. [DOI] [PubMed] [Google Scholar]
- 29.Johnson NA, et al. Prognostic significance of secondary cytogenetic alterations in follicular lymphomas. Genes, chromosomes & cancer. 2008 doi: 10.1002/gcc.20606. [DOI] [PubMed] [Google Scholar]
- 30.Hann SR, Eisenman RN. Proteins encoded by the human c-myc oncogene: differential expression in neoplastic cells. Molecular and cellular biology. 1984;4:2486–2497. doi: 10.1128/mcb.4.11.2486. [DOI] [PMC free article] [PubMed] [Google Scholar]
- 31.Ramsay G, Evan GI, Bishop JM. The protein encoded by the human proto-oncogene c-myc. Proceedings of the National Academy of Sciences of the United States of America. 1984;81:7742–7746. doi: 10.1073/pnas.81.24.7742. [DOI] [PMC free article] [PubMed] [Google Scholar]
- 32.Barrans SL, et al. Germinal center phenotype and bcl-2 expression combined with the International Prognostic Index improves patient risk stratification in diffuse large B-cell lymphoma. Blood. 2002;99:1136–1143. doi: 10.1182/blood.v99.4.1136. [DOI] [PubMed] [Google Scholar]
- 33.Colomo L, et al. Clinical impact of the differentiation profile assessed by immunophenotyping in patients with diffuse large B-cell lymphoma. Blood. 2003;101:78–84. doi: 10.1182/blood-2002-04-1286. [DOI] [PubMed] [Google Scholar]
- 34.Gascoyne RD, et al. Prognostic Significance of Bcl-2 Protein Expression and Bcl-2 Gene Rearrangement in Diffuse Aggressive Non-Hodgkin's Lymphoma. Blood. 1997;90:244–251. [PubMed] [Google Scholar]
- 35.Calvo KR, et al. IL-4 protein expression and basal activation of Erk in vivo in follicular lymphoma. Blood. 2008 doi: 10.1182/blood-2008-02-138933. [DOI] [PMC free article] [PubMed] [Google Scholar]
- 36.Camacho FI, et al. Nodal marginal zone lymphoma: a heterogeneous tumor: a comprehensive analysis of a series of 27 cases. The American journal of surgical pathology. 2003;27:762–771. doi: 10.1097/00000478-200306000-00006. [DOI] [PubMed] [Google Scholar]
- 37.Dierlamm J, et al. Marginal zone B-cell lymphomas of different sites share similar cytogenetic and morphologic features. Blood. 1996;87:299–307. [PubMed] [Google Scholar]
- 38.Irish JM, Czerwinski DK, Nolan GP, Levy R. Altered B-cell receptor signaling kinetics distinguish human follicular lymphoma B cells from tumor-infiltrating nonmalignant B cells. Blood. 2006;108:3135–3142. doi: 10.1182/blood-2006-02-003921. [DOI] [PMC free article] [PubMed] [Google Scholar]
- 39.Lee T, Yao G, Nevins J, You L. Sensing and integration of Erk and PI3K signals by Myc. PLoS Computational Biology. 2008;4:e1000013–e1000013. doi: 10.1371/journal.pcbi.1000013. [DOI] [PMC free article] [PubMed] [Google Scholar]
- 40.Obenauer JC, Cantley LC, Yaffe MB. Scansite 2.0: Proteome-wide prediction of cell signaling interactions using short sequence motifs. Nucleic Acids Res. 2003;31:3635–3641. doi: 10.1093/nar/gkg584. [DOI] [PMC free article] [PubMed] [Google Scholar]
Associated Data
This section collects any data citations, data availability statements, or supplementary materials included in this article.


