Abstract
Biliary atresia is the most common cholangiopathy of childhood. During infancy, an idiopathic activation of the neonatal immune system targets the biliary epithelium, obstructs bile ducts, and disrupts the anatomic continuity between the liver and the intestine. Here, we use a model of virus-induced biliary atresia in newborn mice to trace the initiating pathogenic disease mechanisms to resident plasmacytoid (pDCs) and conventional (cDCs) dendritic cells. We found pDCs to be the most abundant DC population in the livers of newborn mice, and we observed pDCs in the livers of infants at the time of diagnosis. In the livers of newborn mice, cDCs spontaneously overexpressed the costimulatory molecule CD80 soon after birth, and pDCs produced the cytokine interleukin-15 (IL-15) in response to a virus insult. Both subtypes of primed DCs were required for the proliferation of T lymphocytes and the activation of natural killer cells. Disruption of this cellular network by depletion of pDCs or blockade of IL-15 signaling in mice in vivo prevented epithelial injury, maintained anatomic continuity of the bile duct, and promoted long-term survival. These findings identify cellular triggers of biliary injury and have implications for future therapies to block the progression of biliary atresia and liver disease.
INTRODUCTION
Biliary atresia is a rapidly progressive cholangiopathy (disease of the bile ducts) of infants that disrupts bile flow from the liver to the intestine. It results from an inflammatory and fibrosing obstruction of extrahepatic bile ducts of unknown etiology. Without ways to block effectors of biliary injury, the liver disease progresses rapidly to end-stage cirrhosis in most children, at which time liver transplantation is the only hope for long-term survival. Therefore, mechanisms of pathogenesis need to be elucidated to identify new therapeutic targets for treating liver disease progression. In earlier studies, analyses of liver gene expression and cell phenotypes shortly after the onset of symptoms uncovered a prominent proinflammatory signature, with an overexpression of T helper 1 (TH1) cytokines and infiltration by activated lymphocytes and macrophages (1, 2).
A mechanistic role for lymphocytes in disease pathogenesis has been demonstrated in a mouse model of rotavirus-induced biliary atresia. In this model, a single virus inoculation soon after birth results in obstruction of extrahepatic bile ducts within 7 to 10 days, manifested by the presence of acholic stools (gray-colored feces due to absence of bile) and growth failure (3, 4). In these mice, transplantation of virus-primed T lymphocytes targets the biliary epithelium and induces cholangitis (inflammation of the bile ducts) (5, 6). In cell depletion studies, cytotoxic CD8+ T cells and natural killer (NK) cells were shown to specifically target cholangiocyte cells along the epithelium of neonatal bile ducts and to be responsible for the obstructive phenotype induced by rotavirus (6–8). Collectively, these studies show the ability of the neonatal immune system to injure biliary epithelial cells soon after birth. However, the mechanisms by which the neonatal immune system triggers early phases of epithelial injury are largely undefined. On the basis of the critical role of dendritic cells (DCs) in priming innate and adaptive immunity (9–11), we investigated their potential involvement in the initiation of bile duct injury in a mouse model of biliary atresia. DCs form a family of relatively rare immune cell subtypes broadly separated into plasmacytoid (pDC), myeloid (mDC), and lymphoid (LyDC) lineages based on cell surface markers. These cell subtypes establish unique cellular networks and produce distinct cytokine signals with complementary functions in antigen sensing and activation of T lymphocytes. In mechanistic studies using rotavirus-induced biliary atresia in neonatal mice, we found that non-pDCs [collectively grouped as conventional DCs (cDCs)] in the neonatal mouse liver spontaneously express high levels of CD80 soon after birth and that pDCs serve as cellular targets for the rotavirus. Both cell types were required for the proliferation of CD8+ T lymphocytes and the activation of NK cells in cell culture assays. In neonatal mice exposed to rotavirus, the disruption of the cellular network by depletion of pDCs or blockade of interleukin-15 (IL-15) signaling prevented bile duct injury and obstruction and fostered long-term survival of mice with experimental biliary atresia.
RESULTS
DC populations in experimental biliary atresia
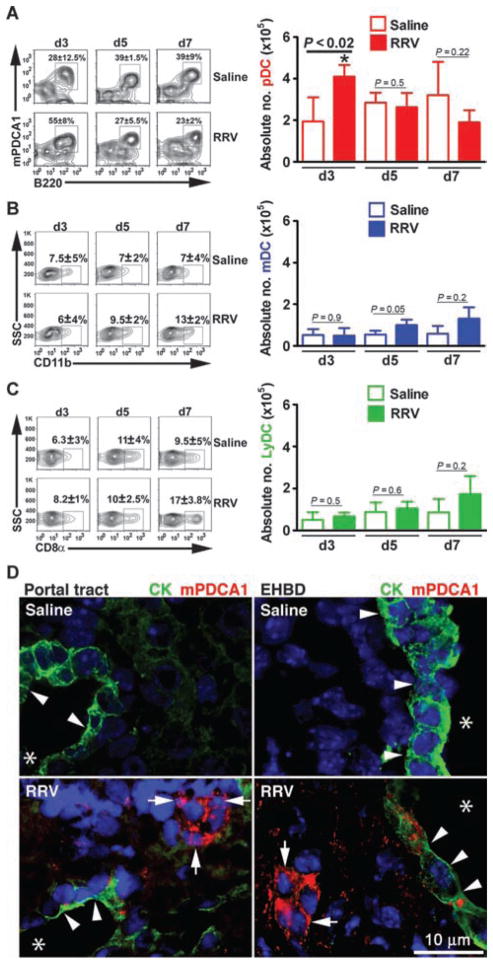
On the basis of the prominent populations of T lymphocytes and NK cells in the liver and extrahepatic bile ducts of neonatal mice infected with rotavirus postnatally (6, 7), we explored the potential role of DCs in the pathogenesis of biliary injury. First, we quantified DC subtypes by flow cytometry using mononuclear cells isolated from livers at early stages of bile duct injury (day 3) and at the time of obstruction (day 7) after the intraperitoneal administration of a single dose of Rhesus rotavirus type A [RRV; 1.5 × 10⁶ focus-forming units (ffu)] or saline to BALB/c mice in the first 2 days of life. More than 90% of newborn mice developed acholic stools, jaundice, and obstruction of bile ducts by day 7, as reported previously (3, 4, 6, 7). Flow cytometric analysis of hepatic mononuclear cells revealed an increase in the number of pDCs (CD11c+PDCA1+B220+CD11b−) in early stages of injury (3 days after RRV treatment; Fig. 1A) compared to saline controls (saline: 2 × 10⁵ ± 0.8 cells, RRV: 4.1 × 10⁵ ± 0.5 cells; P < 0.02). In contrast, mDCs (CD11c+CD11b+) and LyDCs (CD11c+CD8α+) remained unchanged (Fig. 1, B and C). The increase in pDCs was also observed using different gating strategies and staining for Siglec-H (sialic acid–binding immunoglobulin-like lectin) (CD11c+Siglec-H+, saline: 0.19 ± 0.03%, RRV: 0.36 ± 0.06%, P = 0.01; B220+Siglec-H+, saline: 0.17 ± 0.02%, RRV: 0.31 ± 0.08%, P = 0.04; fig. S1, A and B). Quantification of other cells with potential antigen-presenting properties showed a mild but statistically significant decrease in the population of B cells at day 7 (CD19+; fig. S2A) and a 2.5-fold increase in macrophages (F4/80+CD11b+) but only at the time of duct obstruction (7 days; fig. S2B). Using anti-PDCA1 antibodies in situ, we rarely detected pDCs in the livers of healthy control newborn mice. However, 3 days after RRV challenge, pDCs populated the vicinity of cholangiocytes of portal tracts (within the liver) and the submucosal compartment of extrahepatic ducts (Fig. 1D). The selective increase in pDCs in the liver at early stages of injury and their anatomical proximity to the duct epithelium suggest a potential role for these cells in the initiation of the inflammatory response in bile ducts that results in biliary atresia in this mouse model.
Fig. 1.
DC populations in neonatal mouse liver after RRV infection. Flow cytometric analyses of hepatic mononuclear cells from neonatal mice infected with RRV or saline control 24 hours after birth. (A to C) Analyses included an initial size gating, exclusion of 7-aminoactinomycin D–positive (7AAD+) cells, gating on CD11c+ cells, and then gating for pDCs (PDCA1+CD11b−B220+) (A), mDCs (CD11b+) (B), or LyDCs (CD8α+CD11b−) (C) at days 3 (d3), 5 (d5), and 7 (d7) after birth. The percentage of CD11c+-gated cells is shown in contour profiles in the left panels, whereas the absolute number from each liver is shown as graphs in the right panels (n = 4 to 7 livers per group per time point; shown as means ± SD of three experiments; *P < 0.02 at day 3 by Mann-Whitney test). (D) DCs are identified by immunostaining sections of livers and extrahepatic bile ducts (EHBD) 3 days after RRV challenge or saline injection in newborn mice. Sections were incubated with antibodies to cytokeratin (CK, green) to detect cholangiocytes and PDCA1 (red) to detect pDCs; nucleus is counterstained with 4′,6-diamidino-2-phenylindole (DAPI) (blue). Arrows point to pDCs, arrowheads point to cholangiocytes in the portal tract of the bile duct and extrahepatic bile ducts, and asterisks denote the lumen of bile ducts.
pDC populations in the liver of infants with biliary atresia
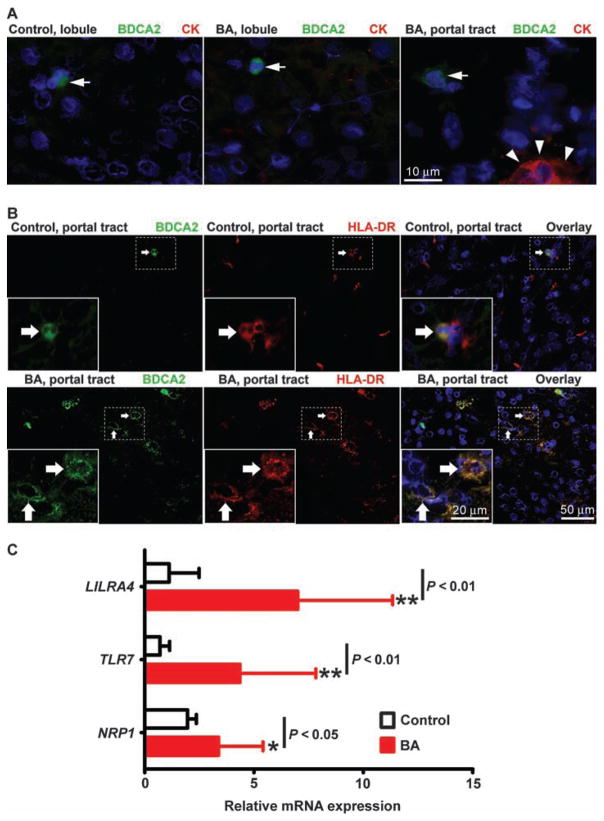
Before performing mechanistic experiments to determine the role of pDCs in biliary injury and obstruction, we examined human livers for activation of pDCs. This was done by staining liver sections obtained from infants at the time of biliary atresia diagnosis (at age 1 to 3 months) with anti-BDCA2 antibody; liver biopsies from transplant donor children (ages 2.5 to 3 years) acted as controls. DCs were present at a low frequency within the hepatic lobule of control livers and livers from children with biliary atresia (Fig. 2A), representing <1% of hepatic nuclei in both groups. A similar pattern was seen in portal tracts of control livers, whereas small clusters of BDCA2-stained cells populated the portal tracts of livers from children with biliary atresia (Fig. 2B, left). Costaining of control livers with antibodies against human leukocyte antigen (HLA)–DR to assess pDC activation revealed only occasional cells costained with BDCA2 and a dimly diffuse HLA-DR signal (Fig. 2B, top panel). In contrast, most BDCA2-positive cells in biliary atresia livers displayed a bright membrane signal for HLA-DR (Fig. 2B, bottom panel), indicative of mature, activated pDCs (12). Searching for additional evidence of an increase in the numbers of hepatic pDCs, we quantified the hepatic mRNA expression for LILRA4, TLR7, and NRP1 genes, which are most highly expressed in pDCs (LILRA4 and NRP1 are also indicative of activated pDCs), using real-time polymerase chain reaction (PCR) of total RNA isolated from livers of 47 infants with biliary atresia and 7 healthy age-matched control children (13–15). We found that the expression levels for all three genes were higher in livers of infants with biliary atresia when compared to controls [Fig. 2C; LILRA4 (relative expression units for control: 1.1 ± 1.4, biliary atresia: 7.0 ± 4.3; P < 0.0001), TLR7 (control: 0.7 ± 0.4, biliary atresia: 4.4 ± 3.4; P < 0.0001), and NRP1 (control: 1.9 ± 0.4, biliary atresia: 3.4 ± 2.0; P = 0.02)]. Together, these data point to an increased population of pDCs in livers of infants with biliary atresia, with qualitative features of activation (as indicated by HLA-DR expression). To explore whether pDCs are involved in the pathogenesis of biliary injury, we examined the activation of DCs in our neonatal mouse model before and after RRV challenge.
Fig. 2.
pDCs in the livers of infants with biliary atresia. (A) Identification of pDCs by immunostaining liver sections from healthy control infants and infants at the time of diagnosis of biliary atresia (BA). pDCs are stained with antibodies against cytokeratin (CK, red) to detect cholangiocytes and CD303 (BDCA2, green) to detect pDCs. Nuclei are counterstained with DAPI (blue). Arrows indicate DCs in lobular region (left and middle panels) and portal tract (right panel) of liver, and arrowheads indicate CK staining. (B) Immunostaining of liver sections with antibodies against HLA-DR followed by secondary anti-mouse IgG antibody (red), and then stained with conjugated primary anti-BDCA2 antibody (green) and DAPI (blue). Arrows point to cells that have BDCA2 and/or HLA-DR staining. (C) LILRA4, TLR7, and NRP1 mRNA expression by real-time PCR (expressed relative to GAPDH) in liver tissue from normal control subjects (n = 7) and from infants with biliary atresia (n = 47). Data represent means ± SD. *P < 0.05; **P < 0.01 by Mann-Whitney test.
CD80 (B7-1) expression by cDCs and virus targeting of pDCs in livers of newborn mice
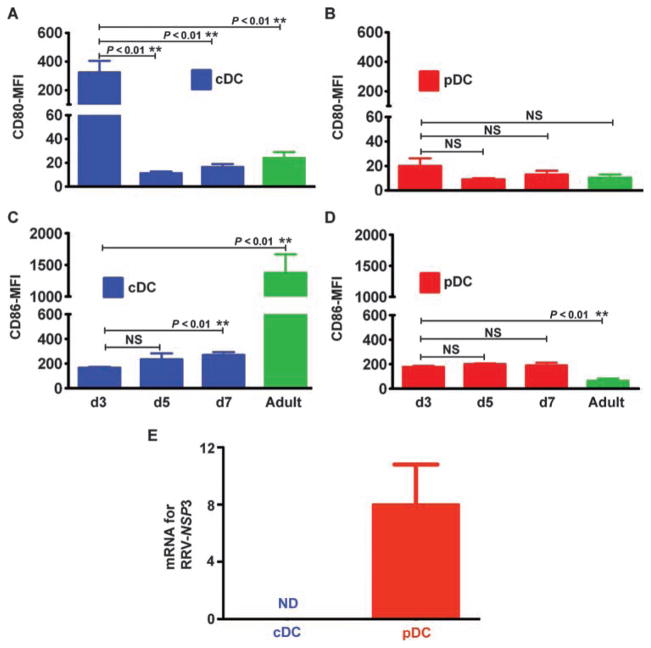
To begin exploring the potential mechanisms by which DCs regulate the inflammatory response to neonatal RRV infection, we divided DCs into two populations: pDCs (CD11c+CD11b−PDCA1+B220+) and cDCs (CD11c+PDCA1−), considered to be a single group on the basis of the similar behavior of mDCs and LyDCs after RRV. Then, we measured the expression of the costimulatory molecules CD80 (B7-1) and CD86 (B7-2) on these two liver DC populations at 3, 5, and 7 days after birth and in adult mice. For cDCs, the expression of CD80 was ~15- to 29-fold higher at 3 days of age [mean fluorescence intensity (MFI): 324 ± 80] compared to expression at 5 days (MFI: 11.3 ± 1.5; P = 0.002) and 7 days (MFI: 16.5 ± 2.5; P = 0.0005) of age and in adults (MFI: 24 ± 5; P = 0.0006) (Fig. 3A), whereas CD86 expression by cDCs was highest in adult livers (Fig. 3C). In view of this unanticipated increase at 3 days of age, we examined CD80 expression soon after birth (first day of life) and observed a similar increase in expression by cDCs (fig. S3A). In contrast, CD80 expression by pDCs did not change at these different ages (Fig. 3B); CD86 expression by pDCs at 3, 5, and 7 days of age was ~2.8-fold higher than that in adult mice (P = 0.0002) (Fig. 3D). The pattern of low CD80 and CD86 expression by pDCs did not change significantly after RRV infection of neonatal mice (fig. S3, B to E). The same was true for cDCs, except for a lower expression of CD80 at 3 days after RRV infection; despite this decrease, CD80 expression remained higher in day 3 mice than in day 5 or 7 mice or adults (fig. S3B). These data suggested that cDCs may be skewed toward a TH1 immune phenotype in the first 3 days after birth (16).
Fig. 3.
Expression of costimulatory receptors by DCs, and DC susceptibility to virus. (A to D) MFI of 7AAD− hepatic mononuclear cells for quantifying the expression of the costimulatory markers CD80 and CD86 by different DC populations. pDCs (CD11c+CD11b−PDCA1+B220+) and cDCs (CD11c+PDCA1−) at days 3 (d3), 5 (d5), and 7 (d7) after birth and in adult BALB/c mice were analyzed by flow cytometry. Data are shown as means ± SD of three separate experiments; n = 4 to 7 livers per group per time point. (E) mRNA for the gene encoding the RRV nonstructural protein NSP3 is detected in hepatic pDCs but not in cDCs 3 days after virus infection. NSP3 mRNA is shown as a ratio to GAPDH mRNA. ** P < 0.01 by Mann-Whitney test. NS, nonsignificant; ND, nondetectable.
To determine whether DCs are targeted by RRV directly, we searched for the virus in purified populations of cDCs and pDCs. We found that pDCs were targeted by RRV, as supported by the expression of mRNA for the gene encoding the viral nonstructural protein NSP3 (Fig. 3E). The recovery of 3000 RRV ffu from 1 × 10⁶ hepatic pDCs isolated from livers 3 days after RRV challenge and of 1 × 10⁶ RRV ffu per milligram of total liver lysate suggested a lower level of viral replication in pDCs when compared to published data in hepatocytes and cholangiocytes (7). In contrast, neither NSP3 mRNA nor live virus could be obtained from cDCs (Fig. 3E). Thus, the spontaneous overexpression of CD80 by cDCs in the first 3 days of life and the targeting of pDCs by RRV identified different biological behaviors of the neonatal DC subtypes and suggested that both cell types may work collaboratively to orchestrate the inflammatory response to RRV infection in newborn mice.
Expansion of hepatic T lymphocytes by RRV-primed DCs
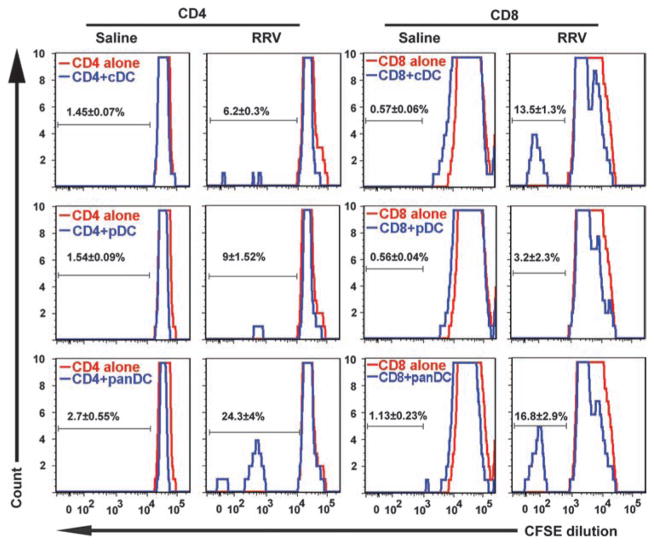
To directly examine whether the seemingly different biological behaviors of DCs are important in our experimental model of biliary atresia, we determined the ability of individual DC subtypes to induce proliferation of hepatic T cells. In these experiments, virus-naïve hepatic CD4+ or CD8+ T lymphocytes were cocultured with hepatic cDCs, pDCs, or both (panDCs) isolated from livers of RRV-injected mice (or saline for controls). The degree of CD4+ lymphocyte proliferation when cultured with RRV-primed cDCs or pDCs separately was only 3- to 4-fold above that of saline-treated CD4+ T lymphocytes, but increased ~10-fold when T cells were cultured with RRV-primed panDCs (Fig. 4). For CD8+ lymphocytes, the proliferation induced by RRV-primed pDCs was only ~6-fold higher than that of saline controls, whereas coculture with RRV-primed cDCs or panDCs resulted in an increase of 15- to 20-fold (Fig. 4). CD4+ and CD8+ T cell proliferation profiles induced by RRV-primed panDCs (and by cDCs alone for CD8+ cells) are consistent with the activating properties of DCs, a function previously attributed to cholangiocytes in livers from infants with biliary atresia (7, 17, 18). In view of recent work questioning this property of cholangiocytes (19), we cocultured a BALB/c-derived cholangiocyte cell line (mCL) infected with RRV with hepatic CD4+ or CD8+ T lymphocytes purified from control mice by means of a similar experimental strategy used for DCs. We found that cholangiocytes were unable to stimulate proliferation in lymphocytes (fig. S4). Together, these data support a role for DCs in the induction of T lymphocyte proliferation after neonatal infection, with an apparent synergy between pDCs and cDCs, and raise the possibility that they may also provide stimulatory signals to cells of the innate immune system.
Fig. 4.
Neonatal T lymphocyte proliferation induced by pDCs, cDCs, and panDCs. Hepatic CD4+ and CD8+ T lymphocytes were isolated from 3-day-old control mice or 3 days after injection of newborn mice with RRV or saline. Proliferation of hepatic CD4+ and CD8+ T lymphocytes was measured by flow cytometry after 48 hours of culture with hepatic cDCs, pDCs, or panDCs (pDCs + cDCs). DCs from saline-injected mice did not induce proliferation of CD4+ or CD8+ T cells (measured by dilution of CFSE, a fluorescent cell-staining dye). Proliferation increased when RRV-primed cDCs were cocultured with CD8+ T cells, or when CD4+ or CD8+ T cells were cocultured with RRV-primed panDCs. Twenty thousand (7AAD− gated) cells were used for flow cytometry analysis; values within each histogram indicate mean percent ± SD of proliferating T cells from three similar experiments.
Overexpression of IL-15 by pDCs and activation of hepatic NK cells
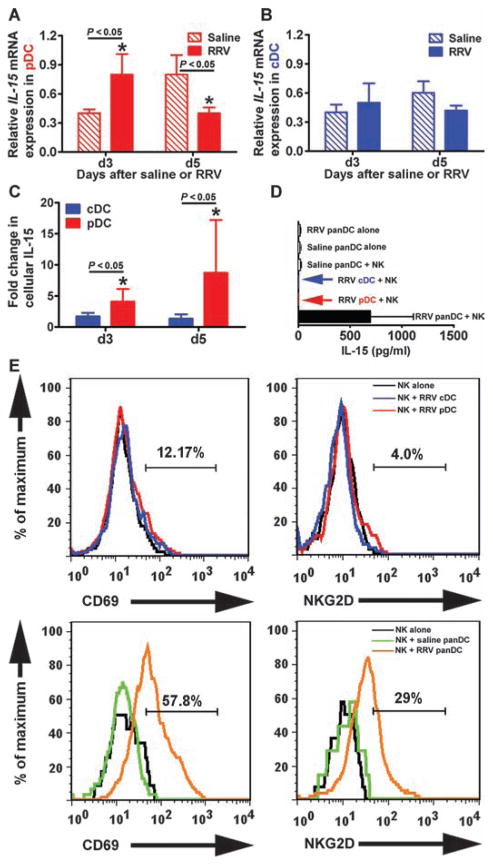
On the basis of the role of NK cells as effectors of early injury to the duct epithelium in experimental biliary atresia (8) and on the proposed role of cDCs as producers of IL-15, a cytokine that activates NK cells (20, 21), we quantified the hepatic expression of this cytokine after RRV infection of DCs. At 3 days of age, expression of IL-15 increased in pDCs at the mRNA (relative expression units for saline: 0.4 ± 0.04, RRV: 0.8 ± 0.21; P < 0.05; Fig. 5A) and protein (MFI for cDC: 1.7 ± 0.45, pDC: 4.1 ± 1.7; P < 0.05; Fig. 5C) levels but not in cDCs (Fig. 5, B and C). At 5 days of age, mRNA IL-15 expression by pDCs decreased, but IL-15 protein expression remained high, perhaps as a secondary event due to more stable expression of the IL-15R/IL-15 complex (22). The expression of IL-15 by individual RRV-primed DC subtypes was lost after 48 hours of coculture with hepatic NK cells, but it was maintained if pDCs and cDCs (panDCs) were present in the coculture system simultaneously; RRV-primed panDCs alone (that is, without NK cells) did not express IL-15 after 48 hours of culture (Fig. 5D). Consistent with this finding, NK cells expressed the activation markers CD69 and NKG2D only when co-cultured with panDCs from RRV-infected mice, but not saline-injected controls (Fig. 5E). These data suggested that primed pDCs release IL-15, but they require synergy with cDCs to maintain IL-15 expression and activate NK cells. To determine the relevance of these findings to disease pathogenesis, we investigated the impact of the loss of pDCs on the phenotype of our biliary atresia mouse model.
Fig. 5.
Cytokine expression by DC subtypes after RRV infection. (A and B) Expression of IL-15 mRNA (depicted as a ratio to GAPDH mRNA) by pDCs and cDCs isolated from livers of newborn mice 3 and 5 days after RRV or saline injection. (C) Intracellular staining for IL-15 in hepatic pDCs and cDCs after RRV using flow cytometric analysis. Data are shown as fold change from saline controls; hepatic mononuclear cells were pooled from four to six livers for each group and time point. (D) IL-15 concentration (mean ± SD) was measured in conditioned medium after 24 hours of coculture of hepatic NK cells with RRV-primed pDCs, cDCs, and panDCs. Arrows indicate low or nondetectable cytokine levels at the indicated culture condition; all assays were run in duplicate. (E) Expression of CD69 and NKG2D by RRV-naïve NK cells after 2 days of coculture with hepatic cDCs, pDCs, or panDCs (pDCs + cDCs) isolated 3 days after injection of RRV or saline into newborn mice (data are representative of two similar experiments and each group contains cell pools isolated from 5 to 10 livers). Values within each histogram indicate mean percent NK cells positive for CD69 or NKG2D after saline or RRV injection. *P < 0.05 by Mann-Whitney test.
Regulation of epithelial injury by pDCs
To directly examine the requirements for pDCs in the inflammatory response after mice were exposed to virus in the immediate postnatal period, we administered anti-PDCA1 antibodies or immunoglobulin G (IgG) isotype antibody control intraperitoneally to newborn BALB/c mice within 24 hours of birth, followed by the administration of RRV 24 hours later. Then, antibodies were administered every other day for three additional doses. Flow cytometric analysis of hepatic mono-nuclear cells in control newborn mice showed that the administration of anti-PDCA1 antibody resulted in a persistent loss of pDCs in neonatal mouse livers to ≤10% of the original hepatic pDC population (fig. S5A). In contrast, treatment with the control IgG isotype had no effect on the numbers of DCs in the livers of virus-treated neonatal mice. Anti-PDCA1 antibody did induce a small decrease in the number of CD4+ T cells, but did not change the number of effector CD8+ T cells or NK cells in the liver as determined by flow cytometric analysis (fig. S5B). To exclude the possibility that the administration of anti-PDCA1 antibody resulted in recognition of other cell types that may promiscuously express this antigen after exposure to the virus (23), we quantified the expression of PDCA1 in hepatic CD4+, CD8+, and NK cells after RRV infection. We found that <4% of these cells expressed PDCA1 when compared to saline controls (fig. S5C). Because RRV was inoculated 1 day after the first dose of antibody, we also tested whether anti-PDCA1 might have interfered with the ability of RRV to infect cells. This was done by incubating RRV with clone MA104 cells (a Rhesus monkey kidney cell line) in the presence of different concentrations of anti-PDCA1 antibody, as described previously (8). The different titers of antibodies did not change the virus yield from MA104 cells, even at high concentrations (fig. S5D). To directly assess the influence of anti-PDCA1 antibody on the ability of RRV to infect the tissue, we quantified live virus from livers 7 days after infection. We recovered 1 ± 0.88 × 10⁶ ffu of RRV per 10 mg of liver from mice infected with RRV and not receiving anti-PDCA1 antibody, which was similar to the values obtained for infected mice that received anti-PDCA1 antibody (0.91 ± 0.13 × 10⁶ ffu).
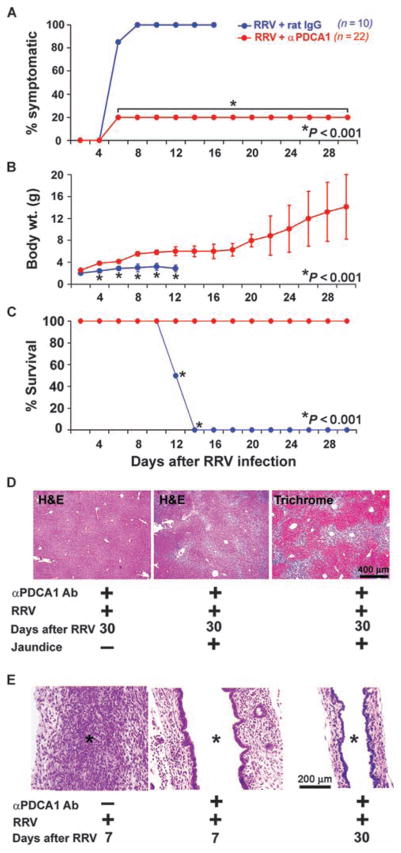
In newborn, RRV-infected mice, administration of anti-PDCA1 antibody reduced the incidence of acholic stools and jaundice by 80% (compared to 0% for infected mice receiving IgG isotype control antibody). Newborn infected mice treated with anti-PDCA1 antibody also showed improved weight gain and survival into adulthood unlike control mice treated with IgG isotype antibody (Fig. 6, A to C; average weights: anti-PDCA1, 7.5 ± 3.4 g; IgG, 2.7 ± 0.5 g; P < 0.001). In mice treated with anti-PDCA1 antibody, liver lobules showed normal histological features (Fig. 6D, left panel); 20% of mice with symptoms of cholestasis had portal tract expansion due to inflammation and fibrosis by 4 weeks of age (Fig. 6D). Examination of extrahepatic bile ducts revealed that the lumen remained patent despite RRV administration in all mice, with no disruption of the epithelial lining (Fig. 6E). These data show that depletion of pDCs prevented injury to the duct epithelium and duct obstruction induced by RRV infection and substantially improved long-term outcome and survival.
Fig. 6.
Prevention of biliary atresia by depletion of pDCs. (A to C) Improvements in symptoms (A), weight gain (B), and survival (C) for RRV-infected neonatal mice receiving anti-PDCA1 antibody (Ab) (red) (n = 22) or IgG isotype control antibody (blue) (n = 10). (D) Liver sections stained with hematoxylin and eosin (H&E) show that mice with symptoms had portal expansion and inflammation (middle panel) with collagen deposition (right panel), whereas asymptomatic mice had normal liver histology (left panel). (E) H&E staining of longitudinal sections of extrahepatic bile duct shows lumenal obstruction by inflammatory cells in mice receiving IgG isotype antibody (asterisks). In contrast, mice receiving anti-PDCA1 antibody demonstrate a lack of lumenal inflammation and intact bile duct epithelium.
Molecular crosstalk between DCs and NK cells
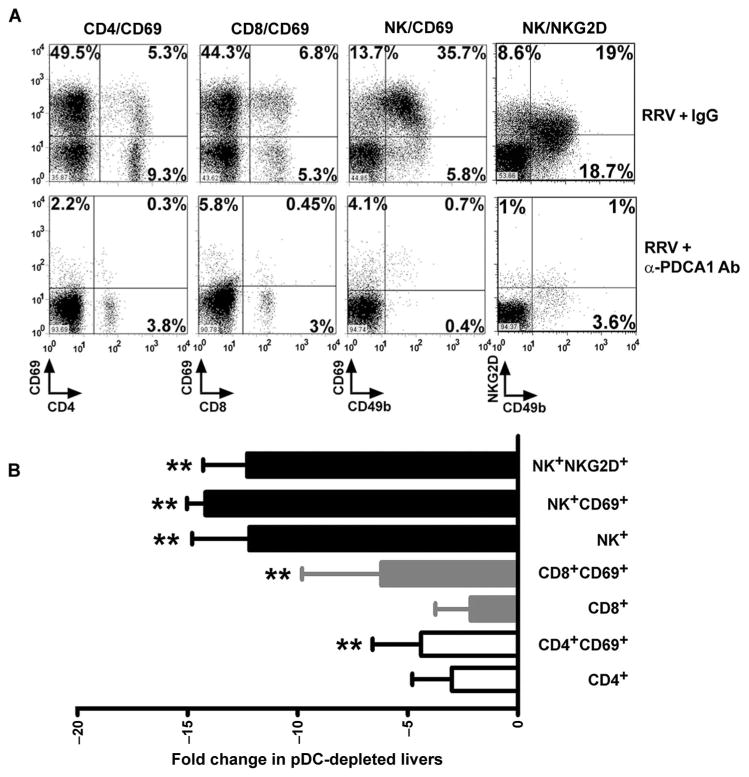
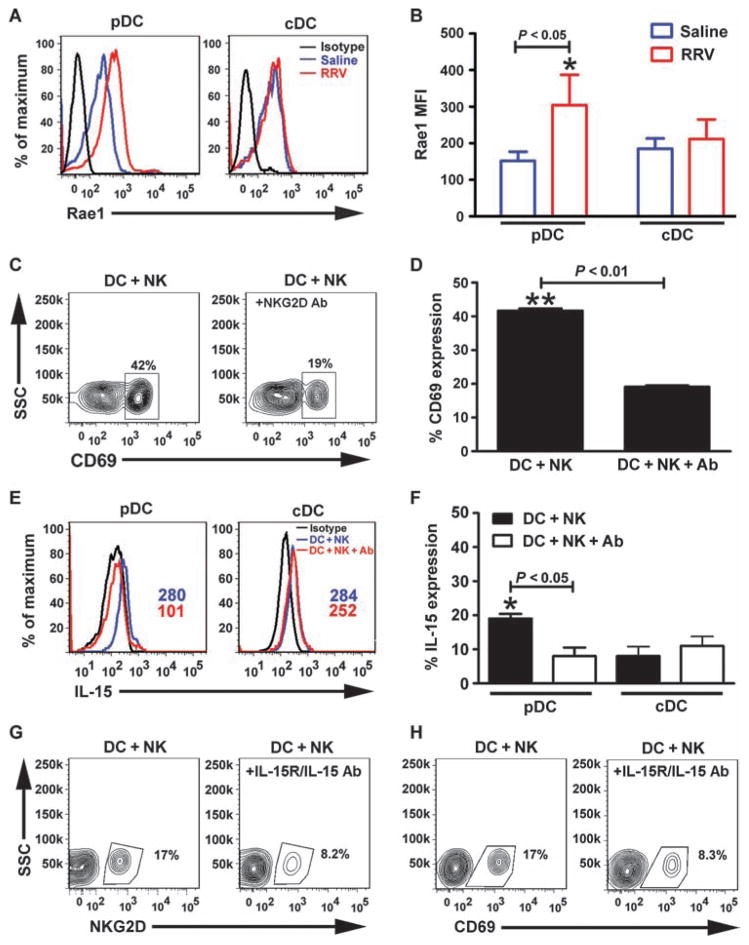
To elucidate potential mechanisms by which pDCs may regulate inflammatory injury to the duct epithelium, we quantified the population of mononuclear cells in liver by flow cytometric analysis in RRV-infected mice depleted of pDCs. Administration of anti-PDCA1 antibody blunted the increase in the hepatic population of CD4+ (anti-PDCA1: 8.3 ± 6.0%, IgG: 15.0 ± 5.0%; P = 0.2) and CD8+ (anti-PDCA1: 8.2 ± 9.5%, IgG: 13.0 ± 1.5%; P = 0.2) T lymphocytes by 1- to 2-fold and NK cells (anti-PDCA1: 3.1 ± 1.0%, IgG: 37.0 ± 2.0%; P = 0.0003) by ~13-fold in RRV-infected mice compared to controls, as well as the expression of typical NK cell activation markers (NK+NKG2D+: anti-PDCA1, 1.7 ± 0.5%; IgG, 19.5 ± 4.6%; P < 0.01; NK+CD69+: anti-PDCA1, 2.3 ± 0.1%; IgG, 32.4 ± 1.6%; P < 0.01) (Fig. 7, A and B). On the basis of the pronounced decrease in the number of NKG2D-bearing NK cells and on a previous report demonstrating that NKG2D is required by NK cells to injure cholangiocytes in vitro and in vivo (8), we quantified the expression of Rae1 (the ligand for NKG2D) in hepatic DCs after RRV or saline administration. Rae1 expression increased only in pDCs and only at 3 days after RRV infection (Fig. 8, A and B; MFI for Rae1: saline, 152.0 ± 25.0; RRV, 304.0 ± 83.0; P = 0.04), followed by a rapid return to baseline at 5 to 7 days after RRV infection (fig. S6). To examine the role of the Rae1-NKG2D interaction in DC-mediated activation of NK cells, we cocultured RRV-primed hepatic panDCs with naïve hepatic NK cells in medium containing anti-NKG2D antibodies. The presence of antibodies decreased the activation of NK cells (antibody-treated: 19.1 ± 0.4%; control: 41.6 ± 0.6%; P < 0.01; Fig. 8, C and D) and the production of IL-15 by pDCs (antibody-treated: 8.0 ± 2.5%; control: 19.1 ± 0.4%; P < 0.01; Fig. 8, E and F). On the basis of the requirements for IL-15 in mediating the properties of DCs as a primer of NK cells and in the inflammatory response (11, 22), we determined the impact of blocking IL-15 on NK cell activation. Using a similar coculture protocol, we preincu-bated RRV-primed panDCs with an antibody that recognizes the IL-15 receptor/IL-15 complex (IL-15R/IL-15) followed by coculture for 48 hours. Blocking of IL-15R/IL-15 suppressed NK cell activation by 50% (Fig. 8, G and H).
Fig. 7.
Decreased hepatic lymphocytes in RRV-infected mice in response to pDC depletion. Flow cytometric analyses of activation markers of CD4+, CD8+, and NK cells 7 days after the injection of RRV (with and without injections of anti-PDCA1 antibodies) into newborn mice. (A) Representative dot plots; values in each quadrant represent percent cells positive for respective cell surface markers. (B) Fold change for expression of activation markers by individual populations of hepatic lymphocytes from mice infected with RRV and injected with either anti-PDCA1 antibody or IgG isotype antibody control. Data are representative results of three experiments. **P < 0.01 (Mann-Whitney test) when compared to isotype control.
Fig. 8.
Interaction between DCs and NK cells via Rae1-NKG2D. (A) Flow cytometric histograms show an increase in expression of Rae1 in hepatic pDCs 3 days after RRV or saline injection into newborn mice; cDCs show no change in expression of Rae1. (B) Increase in Rae1 expression reached statistical significance (MFI ± SD, *P < 0.05). Data are representative of two similar experiments, and each group contains cell pools from 5 to 10 livers. (C) Contour plots show a decrease in the expression of CD69 by hepatic NK cells when anti-NKG2D antibodies were added to the medium of a 48-hour coculture of NK cells with RRV-primed hepatic panDCs. (D) Percent of NK cells expressing CD69. (E and F) Surface staining for IL-15 in pDCs and cDCs in the same experimental setting. (G and H) Contour plots show a decrease in the expression of NKG2D or CD69 after hepatic NK cells are cocultured with panDCs in the presence of anti–IL-15R/IL-15 antibodies. *P < 0.05; **P < 0.01 by Mann-Whitney test.
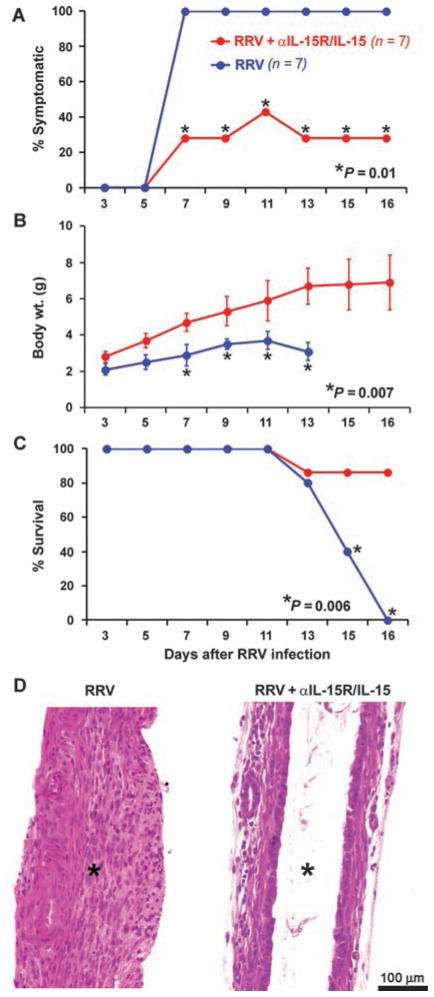
To determine whether the suppression of NK cells induced by blockade of IL-15R/IL-15 is important for the biliary atresia phenotype, we injected 50 μg of anti–IL-15R/IL-15 antibody intraperitoneally within 24 hours of birth, followed by RRV administration 24 hours later, and then every other day for a total of three additional doses of the antibody. Daily examination of infected mice receiving antibody showed decreased incidence of cholestatic symptoms (antibody-treated: 28%, control: 100%; P = 0.01), improved weight gain (antibody-treated: 5.4 ± 1.5 g, control: 3.0 ± 0.6 g; P = 0.007), and increased survival (86% of the mice survived beyond 16 days of age compared to zero survival at this time point for control infected mice that did not receive antibody) (Fig. 9, A to C; n = 7 mice per treatment group; P = 0.006). Analysis of extrahepatic bile ducts revealed them to be patent, with intact epithelium and few inflammatory cells within the duct wall at 16 days (Fig. 9D). Collectively, these data point to the use of Rae1 by pDCs to establish contact with NKG2D of NK cells and produce IL-15 in the early phases of pathogenesis in experimental biliary atresia.
Fig. 9.
Improved clinical and histological outcomes by blocking IL-15R/IL-15. (A to C) Decreased incidence of symptoms (A), improved weight gain (B), and better survival (C) of RRV-infected mice receiving anti–IL-15R/IL-15 antibodies (red) (n = 7) compared to control mice not receiving antibody (blue) (RRV only; n = 7). (D) H&E staining of longitudinal sections of extrahepatic bile ducts shows lumenal obstruction in control mice (RRV only), whereas antibody-injected infected mice had patent bile ducts with an intact epithelial lining despite RRV infection. Asterisks depict obstructed (left) or patent (right) bile duct lumens.
DISCUSSION
We identified an increased population of pDCs in the liver of newborn mice exposed to RRV soon after birth in an experimental model of biliary atresia. This pDC population exists before the animals develop any symptoms of biliary injury and becomes localized to bile ducts after RRV infection. The increase in hepatic pDCs is short-lived but important, as demonstrated by recovery of the virus from hepatic pDCs and by a suppression of RRV-induced epithelial injury, decrease in cholestasis, and improved survival in mice depleted of pDCs. Experiments to dissect the mechanisms of cellular injury to the duct epithelium showed that pDCs do not work alone; instead, they work in concert with cDCs to produce IL-15 and stimulate proliferation of CD4+ and CD8+T cells and activation of effector NK cells. Notably, immunostaining of liver sections from infants with biliary atresia identified activated pDCs in portal tracts of hepatic lobules. Together, these data support a role for DCs in the early phases of pathogenesis of biliary injury in early infancy.
The availability of the experimental mouse model greatly facilitates mechanistic studies of biliary atresia by enabling investigations of the precise roles for individual cell types and gene products in epithelial cell recognition, bile duct injury, and disease phenotype. Infection of neonatal mice by rotavirus in the first 2 days of life produces lesions in extrahepatic bile ducts that are similar histologically to the diseased bile ducts of young infants with biliary atresia. However, there are limitations to this mouse model including less fibrosis in bile ducts and in the portal tracts of hepatic lobules, which contrasts with the excessive fibrosis of bile ducts in infants with biliary atresia. Furthermore, the high mortality among rotavirus-infected mice by 2 weeks of life prevents investigation of liver disease progression to end-stage cirrhosis in these mice. These features limit the use of the mouse model to studies of early events in disease pathogenesis and require validation of experimental findings in tissues from biliary atresia patients to take into account the different stages of disease at diagnosis and the phenotypic heterogeneity that is typical of the human disease.
When considering viruses as triggers of injury to bile ducts in neonates, α2β1 integrins regulate RRV infection of cholangiocytes, an event that has been long viewed as key to the release of inflammatory signals and induction of lymphocyte proliferation (19, 24, 25). Contrary to this view, we did not find evidence for induction of lymphocyte proliferation by a cholangiocyte cell line infected with RRV. Further, we reported recently that infection of cholangiocytes alone is not sufficient for the biliary atresia phenotype, as evidenced by the lack of epithelial injury despite ongoing RRV infection when mice are depleted of NK cells (8). This indicated that cholangiocyte-independent cell circuits might trigger the inflammatory response that targets the duct epithelium. Here, we provide evidence for an alternate possibility that hepatic DCs are cellular targets of RRV and induce proliferation and activation of CD8+ T cells and NK cells, both of which have been shown to injure infected cholangiocytes and damage the duct epithelium in vivo. These results do not exclude a potential participation of cholangiocytes in attracting lymphocytes or myeloid cells after RRV infection, but experiments to quantify this response revealed relatively low levels of cytokines and chemokines in RRV-infected cholangiocytes (25, 26). Our data also do not exclude a potential role for cholangiocytes in the promotion of T cell proliferation in vivo when aided by other cells (for example, NK cells) in response to RRV infection. These possibilities, notwithstanding the data from our coculture and in vivo experiments, support an important role for DCs in the expansion of cells of the innate and adaptive immune systems as the mouse mounts a response to clear infected cells, resulting in the atresia phenotype as a secondary event.
DCs are uniquely fitted to sense pathogens and to orchestrate an immune response by establishing intercellular circuits among themselves and with other cells (20, 26, 27). In adult mice, cDCs are the major source of IL-15 production in response to CpG oligonucleotides but require accessory signals from pDCs for appropriate responses, perhaps mediated by CD40L (20). Our data show that this crosstalk is already functional early after birth, but the production of IL-15 derives primarily from pDCs (instead of cDCs). IL-15 is a pleiotropic cytokine that regulates the development and function of NK and NKT cells, intestinal T cell receptor–γδ–positive cells, and DCs (21). Its production by pDCs, however, remains closely linked to cDCs, as supported by the loss of IL-15 production when pDCs are cultured without cDCs. In vivo, our findings that depletion of pDCs or blockade of the IL-15R/IL-15 complex improved symptoms and survival of neonatal mice infected with RRV (with a concomitant improvement in the morphology of extrahepatic bile ducts) provide evidence for a functional interdependence among DC subtypes and for their requirement to promote epithelial injury and bile duct obstruction. The blocking of the IL-15R/IL-15 complex after RRV infection does not directly imply that activation of NK cells is a key to pathogenesis in our experimental model of biliary atresia. However, given the known requirements for NK and CD8 T cells in mediating experimental biliary atresia (8), it is likely that the improvement in bile duct injury induced by the loss of IL-15 signaling is secondary to the loss of an important survival factor for NK (and CD8 T) cells after RRV infection.
The biological behavior of naïve DCs in newborn mice before and after exposure to RRV provides insight into a potential mechanism restricting the susceptibility of biliary injury to the first 3 postnatal days in this model (4). A similar temporal susceptibility is recapitulated in humans, where the onset of disease is restricted to the first 3 to 4 months of life. Our experiments examining the expression of cost-imulatory molecules in the first week of life revealed that hepatic cDCs from healthy newborn mice express unexpectedly high levels of CD80 in the first 3 days of life, followed by a decline back to baseline by 5 and 7 days of age. A paucity of regulatory T (Treg) cells in the livers of newborn mice has also been linked to pathogenesis of disease (28). Here, a Treg cell response was nearly absent in the first 3 days of life (time of disease susceptibility), and newborn mice displayed less symptoms of cholestasis if they were transplanted with T lymphocytes soon after birth (28). Together, these data suggest that the innate proinflammatory priming of neonatal DCs and the paucity of Treg cells make mouse pups prone to mount a substantial inflammatory response to RRV challenge.
In summary, our search for the earliest signals that orchestrate pathogenic mechanisms of bile duct injury in biliary atresia uncovered a dual role for DCs as targets of virus (pDCs) and as resident cells (cDCs) that are spontaneously primed to activate the immune system. Although pDCs and cDCs can mediate low levels of lymphocyte activation independently, the effect of both sets of DCs is much greater than the simple addition of each individual effect in cell culture systems. Our data suggest a working biological model in which in response to RRV infection, NK cells and cDCs are required for production of IL-15 by pDCs. It appears that pDCs may be responsible for presenting IL-15 to NK cells, promoting NK cell survival, proliferation, and activation. Given that they are infected by RRV, pDCs also express Rae1 and become a potential target for NKG2D-mediated NK cell killing in the liver. However, the persistence of pDCs in the liver as the biliary injury progresses suggests that they mount a self-defense mechanism, perhaps by the prompt down-regulation of Rae1, which enables their persistence in the tissue, providing signals that foster ongoing tissue inflammation. A potential extension to the human disease would explain, at least in part, the finding of increased hepatic expression of pDC-related genes and HLA-DR in the livers of infants with biliary atresia even after the complete obstruction of extrahepatic bile ducts. In this context, IL-15 and pDCs may constitute new therapeutic targets that if blocked could lead to suppression of ongoing tissue injury after surgical treatment, promoting long-term biliary drainage and the alleviation of symptoms.
MATERIALS AND METHODS
Mouse model of biliary atresia
Experimental biliary atresia and phenotyping are described in the Supplementary Material. For in vivo depletion of pDCs, 50 μg of anti-PDCA1 antibodies (clone JF05-1C2.4.1, Miltenyi Biotec) was injected intraperitoneally within 24 hours of birth, followed by RRV administration 24 hours later and then every other day for a total of three additional doses (20). Depletion of pDCs was confirmed by flow cyto-metric staining of liver cells with Gr1 and B220 markers. A similar protocol was applied for blocking of IL-15 signaling with 50 μg of antibody that neutralizes the IL-15R/IL-15 complex (clone GRW15PLZ, eBiosciences); control consisted of IgG isotypes at the same time points. The Institutional Animal Care and Use Committee of Cincinnati Children’s Hospital Medical Center approved all animal protocols.
Immunostaining and flow cytometric analysis
Protocols for immunostaining in human liver sections at diagnosis of biliary atresia or in murine livers and extrahepatic bile ducts were described previously and outlined in detail in the Supplementary Material (7). Methods for the isolation of hepatic mononuclear cells, the antibodies used for flow cytometry, and analytical approaches are described in the Supplementary Material.
DC and lymphocyte coculture
Experimental protocols for the coculture of hepatic DCs, T cells, and NK cells, including antibody-mediated blocking of NKG2D or IL-15 signals, are described in the Supplementary Material (29).
Protein and gene expression
Culture supernatants were analyzed for concentration of IL-15 with Milliplex Multiplex kits (Millipore) according to the manufacturer’s protocol. For intracellular IL-15 staining on DCs, cells were mixed with GolgiPlug (BD Biosciences) for 5 hours and then surface-stained with anti-mouse PDCA1 antibody. After surface staining, cells were permeabilized and stained with biotinylated anti-mouse IL-15 and then with phycoerythrin-streptavidin. For surface IL-15 staining, the permeabilization step was not performed. Quantification of gene expression in magnetic-activated cell sorting (MACS)–purified cells was done as described previously, with primers listed in table S1 (30).
RRV titer and cholangiocytes in proliferation assays
RRV titer assays are described in the Supplementary Material. To study antigen-presenting properties, we cocultured an RRV-infected cholangiocyte cell line (mCL) derived from BALB/c mice with hepatic CD4+ and CD8+ lymphocytes labeled with carboxyfluorescein suc-cinimidyl ester (CFSE) at a 1:1 ratio. After 48 hours, proliferation of T cells was measured by CFSE dilution with a FACSCanto flow cytometer (30).
Human livers
Liver biopsies were obtained from 2- to 3-month-old infants at the time of intraoperative cholangiogram and portoenterostomy for the diagnosis of biliary atresia at Cincinnati Children’s Hospital Medical Center. Biopsies were also obtained from livers of deceased donors aged 2 to 3.5 years being used for transplantation at Children’s Memorial Hospital (Chicago, IL) (provided by P. Whitington, site investigator). Liver biopsies were used for immunostaining and for gene expression studies. Use of the liver biopsies was approved by the institutional review boards of both institutions, and written informed consent was obtained from the patients’ guardians.
Statistical analysis
All in vitro experiments were performed in triplicate. The numbers of mice or tissues used in each experiment are presented in the text or figure legends. Values are expressed as means ± SD, and statistical significance was determined by Mann-Whitney U test and one-way analysis of variance (ANOVA), with a significance set at P < 0.05. Survival curves were created with the method of Kaplan and Meier using GraphPad Prism (GraphPad Software).
Supplementary Material
Acknowledgments
We thank N. Sanger for technical assistance with immunohisto-chemistry and B. Donnely for the assay to quantify RRV titer.
Funding: This work was funded by the following grants from the NIH: DK083781 and DK062497 (to J.A.B.) and DK078392 (Gene Expression and Sequencing Core, Bioinformatics Core, and Integrative Morphology Core of the Digestive Disease Research Core Center in Cincinnati).
Footnotes
www.sciencetranslationalmedicine.org/cgi/content/full/3/102/102ra94/DC1
Materials and Methods
Fig. S1. Quantification of hepatic pDCs after RRV challenge.
Fig. S2. Quantification of hepatic B cells and macrophages after RRV challenge.
Fig. S3. Expression of costimulatory markers in hepatic DCs.
Fig. S4. Effect of cholangiocytes on proliferation of CD4+ and CD8+ cells.
Fig. S5. Depletion of pDCs by anti-PDCA1 antibody.
Fig. S6. Rae1 expression in hepatic pDCs.
Table S1. Oligonucleotide primer sequences and PCR product sizes.
References
Author contributions: V.S. performed most of the experiments, analyzed the data, and helped draft the manuscript. P.S., G.S., and R.M. performed tissue phenotyping, immunostaining, data analysis, and drafting of the manuscript. C.C. helped with data analysis, provided insight into critical flow cytometric experiments, and helped write the manuscript. J.A.B. provided oversight to all experiments, analyzed the data, and drafted the manuscript.
Competing interests: The authors declare that they have no competing interests.
REFERENCES AND NOTES
- 1.Bezerra JA, Tiao G, Ryckman FC, Alonso M, Sabla GE, Shneider B, Sokol RJ, Aronow BJ. Genetic induction of proinflammatory immunity in children with biliary atresia. Lancet. 2002;360:1653–1659. doi: 10.1016/S0140-6736(02)11603-5. [DOI] [PubMed] [Google Scholar]
- 2.Mack CL, Tucker RM, Sokol RJ, Karrer FM, Kotzin BL, Whitington PF, Miller SD. Biliary atresia is associated with CD4+ Th1 cell-mediated portal tract inflammation. Pediatr Res. 2004;56:79–87. doi: 10.1203/01.PDR.0000130480.51066.FB. [DOI] [PMC free article] [PubMed] [Google Scholar]
- 3.Petersen C, Biermanns D, Kuske M, Schäkel K, Meyer-Junghänel L, Mildenberger H. New aspects in a murine model for extrahepatic biliary atresia. J Pediatr Surg. 1997;32:1190–1195. doi: 10.1016/s0022-3468(97)90680-1. [DOI] [PubMed] [Google Scholar]
- 4.Riepenhoff-Talty M, Schaekel K, Clark HF, Mueller W, Uhnoo I, Rossi T, Fisher J, Ogra PL. Group A rotaviruses produce extrahepatic biliary obstruction in orally inoculated newborn mice. Pediatr Res. 1993;33:394–399. doi: 10.1203/00006450-199304000-00016. [DOI] [PubMed] [Google Scholar]
- 5.Mack CL, Tucker RM, Lu BR, Sokol RJ, Fontenot AP, Ueno Y, Gill RG. Cellular and humoral autoimmunity directed at bile duct epithelia in murine biliary atresia. Hepatology. 2006;44:1231–1239. doi: 10.1002/hep.21366. [DOI] [PMC free article] [PubMed] [Google Scholar]
- 6.Shivakumar P, Sabla G, Mohanty S, McNeal M, Ward R, Stringer K, Caldwell C, Chougnet C, Bezerra JA. Effector role of neonatal hepatic CD8+ lymphocytes in epithelial injury and autoimmunity in experimental biliary atresia. Gastroenterology. 2007;133:268–277. doi: 10.1053/j.gastro.2007.04.031. [DOI] [PMC free article] [PubMed] [Google Scholar]
- 7.Shivakumar P, Campbell KM, Sabla GE, Miethke A, Tiao G, McNeal MM, Ward RL, Bezerra JA. Obstruction of extrahepatic bile ducts by lymphocytes is regulated by IFN-γ in experimental biliary atresia. J Clin Invest. 2004;114:322–329. doi: 10.1172/JCI21153. [DOI] [PMC free article] [PubMed] [Google Scholar]
- 8.Shivakumar P, Sabla GE, Whitington P, Chougnet CA, Bezerra JA. Neonatal NK cells target the mouse duct epithelium via Nkg2d and drive tissue-specific injury in experimental biliary atresia. J Clin Invest. 2009;119:2281–2290. doi: 10.1172/JCI38879. [DOI] [PMC free article] [PubMed] [Google Scholar]
- 9.Fernandez NC, Lozier A, Flament C, Ricciardi-Castagnoli P, Bellet D, Suter M, Perricaudet M, Tursz T, Maraskovsky E, Zitvogel L. Dendritic cells directly trigger NK cell functions: Cross-talk relevant in innate anti-tumor immune responses in vivo. Nat Med. 1999;5:405–411. doi: 10.1038/7403. [DOI] [PubMed] [Google Scholar]
- 10.Gerosa F, Gobbi A, Zorzi P, Burg S, Briere F, Carra G, Trinchieri G. The reciprocal interaction of NK cells with plasmacytoid or myeloid dendritic cells profoundly affects innate resistance functions. J Immunol. 2005;174:727–734. doi: 10.4049/jimmunol.174.2.727. [DOI] [PubMed] [Google Scholar]
- 11.Lucas M, Schachterle W, Oberle K, Aichele P, Diefenbach A. Dendritic cells prime natural killer cells by trans-presenting interleukin 15. Immunity. 2007;26:503–517. doi: 10.1016/j.immuni.2007.03.006. [DOI] [PMC free article] [PubMed] [Google Scholar]
- 12.Drénou B, Amiot L, Setterblad N, Taque S, Guilloux V, Charron D, Fauchet R, Mooney N. MHC class II signaling function is regulated during maturation of plasmacytoid dendritic cells. J Leukoc Biol. 2005;77:560–567. doi: 10.1189/jlb.0704423. [DOI] [PubMed] [Google Scholar]
- 13.Cho M, Ishida K, Chen J, Ohkawa J, Chen W, Namiki S, Kotaki A, Arai N, Arai K, Kamogawa-Schifter Y. SAGE library screening reveals ILT7 as a specific plasmacytoid dendritic cell marker that regulates type I IFN production. Int Immunol. 2008;20:155–164. doi: 10.1093/intimm/dxm127. [DOI] [PubMed] [Google Scholar]
- 14.Diebold SS, Kaisho T, Hemmi H, Akira S, Reis e Sousa C. Innate antiviral responses by means of TLR7-mediated recognition of single-stranded RNA. Science. 2004;303:1529–1531. doi: 10.1126/science.1093616. [DOI] [PubMed] [Google Scholar]
- 15.Dzionek A, Fuchs A, Schmidt P, Cremer S, Zysk M, Miltenyi S, Buck DW, Schmitz J. BDCA-2, BDCA-3, and BDCA-4: Three markers for distinct subsets of dendritic cells in human peripheral blood. J Immunol. 2000;165:6037–6046. doi: 10.4049/jimmunol.165.11.6037. [DOI] [PubMed] [Google Scholar]
- 16.Kuchroo VK, Das MP, Brown JA, Ranger AM, Zamvil SS, Sobel RA, Weiner HL, Nabavi N, Glimcher LH. B7-1 and B7-2 costimulatory molecules activate differentially the Th1/Th2 developmental pathways: Application to autoimmune disease therapy. Cell. 1995;80:707–718. doi: 10.1016/0092-8674(95)90349-6. [DOI] [PubMed] [Google Scholar]
- 17.Allen SR, Jafri M, Donnelly B, McNeal M, Witte D, Bezerra J, Ward R, Tiao GM. Effect of rotavirus strain on the murine model of biliary atresia. J Virol. 2007;81:1671–1679. doi: 10.1128/JVI.02094-06. [DOI] [PMC free article] [PubMed] [Google Scholar]
- 18.Mack CL. The pathogenesis of biliary atresia: Evidence for a virus-induced autoimmune disease. Semin Liver Dis. 2007;27:233–242. doi: 10.1055/s-2007-985068. [DOI] [PMC free article] [PubMed] [Google Scholar]
- 19.Barnes BH, Tucker RM, Wehrmann F, Mack DG, Ueno Y, Mack CL. Cholangiocytes as immune modulators in rotavirus-induced murine biliary atresia. Liver Int. 2009;29:1253–1261. doi: 10.1111/j.1478-3231.2008.01921.x. [DOI] [PMC free article] [PubMed] [Google Scholar]
- 20.Kuwajima S, Sato T, Ishida K, Tada H, Tezuka H, Ohteki T. Interleukin 15–dependent crosstalk between conventional and plasmacytoid dendritic cells is essential for CpG-induced immune activation. Nat Immunol. 2006;7:740–746. doi: 10.1038/ni1348. [DOI] [PubMed] [Google Scholar]
- 21.Pulendran B. Division of labor and cooperation between dendritic cells. Nat Immunol. 2006;7:699–700. doi: 10.1038/ni0706-699. [DOI] [PubMed] [Google Scholar]
- 22.Ohteki T, Tada H, Ishida K, Sato T, Maki C, Yamada T, Hamuro J, Koyasu S. Essential roles of DC-derived IL-15 as a mediator of inflammatory responses in vivo. J Exp Med. 2006;203:2329–2338. doi: 10.1084/jem.20061297. [DOI] [PMC free article] [PubMed] [Google Scholar]
- 23.Blasius AL, Giurisato E, Cella M, Schreiber RD, Shaw AS, Colonna M. Bone marrow stromal cell antigen 2 is a specific marker of type I IFN-producing cells in the naive mouse, but a promiscuous cell surface antigen following IFN stimulation. J Immunol. 2006;177:3260–3265. doi: 10.4049/jimmunol.177.5.3260. [DOI] [PubMed] [Google Scholar]
- 24.Jafri M, Donnelly B, Allen S, Bondoc A, McNeal M, Rennert PD, Weinreb PH, Ward R, Tiao G. Cholangiocyte expression of α2β1-integrin confers susceptibility to rotavirus- induced experimental biliary atresia. Am J Physiol Gastrointest Liver Physiol. 2008;295:G16–G26. doi: 10.1152/ajpgi.00442.2007. [DOI] [PMC free article] [PubMed] [Google Scholar]
- 25.Jafri M, Donnelly B, Bondoc A, Allen S, Tiao G. Cholangiocyte secretion of chemokines in experimental biliary atresia. J Pediatr Surg. 2009;44:500–507. doi: 10.1016/j.jpedsurg.2008.07.007. [DOI] [PMC free article] [PubMed] [Google Scholar]
- 26.Mohanty SK, Ivantes CA, Mourya R, Pacheco C, Bezerra JA. Macrophages are targeted by rotavirus in experimental biliary atresia and induce neutrophil chemotaxis by Mip2/Cxcl2. Pediatr Res. 2010;67:345–351. doi: 10.1203/PDR.0b013e3181d22a73. [DOI] [PMC free article] [PubMed] [Google Scholar]
- 27.Sun CM, Fiette L, Tanguy M, Leclerc C, Lo-Man R. Ontogeny and innate properties of neonatal dendritic cells. Blood. 2003;102:585–591. doi: 10.1182/blood-2002-09-2966. [DOI] [PubMed] [Google Scholar]
- 28.Miethke AG, Saxena V, Shivakumar P, Sabla GE, Simmons J, Chougnet CA. Post-natal paucity of regulatory T cells and control of NK cell activation in experimental biliary atresia. J Hepatol. 2010;52:718–726. doi: 10.1016/j.jhep.2009.12.027. [DOI] [PMC free article] [PubMed] [Google Scholar]
- 29.Ge Q, Palliser D, Eisen HN, Chen J. Homeostatic T cell proliferation in a T cell-dendritic cell coculture system. Proc Natl Acad Sci USA. 2002;99:2983–2988. doi: 10.1073/pnas.052714199. [DOI] [PMC free article] [PubMed] [Google Scholar]
- 30.Shivakumar P, Bezerra JA. Biliary atresia and Th1 function: Linking lymphocytes and bile ducts: Commentary on the article by Mack et al. on page 79. Pediatr Res. 2004;56:9–10. doi: 10.1203/01.PDR.0000129655.02381.F0. [DOI] [PubMed] [Google Scholar]
Associated Data
This section collects any data citations, data availability statements, or supplementary materials included in this article.


