

Abstract
Lipin-1 deficiency is associated with massive rhabdomyolysis episodes in humans, precipitated by febrile illnesses. Despite well-known roles of lipin-1 in lipid biosynthesis and transcriptional regulation, the pathogenic mechanisms leading to rhabdomyolysis remain unknown. Here we show that primary myoblasts from lipin-1-deficient patients exhibit a dramatic decrease in LPIN1 expression and phosphatidic acid phosphatase 1 activity, and a significant accumulation of lipid droplets (LD). The expression levels of LPIN1-target genes [peroxisome proliferator-activated receptors delta and alpha (PPARδ, PPARα), peroxisome proliferator-activated receptor gamma coactivator 1-alpha (PGC-1α), acyl-coenzyme A dehydrogenase, very long (ACADVL), carnitine palmitoyltransferase IB and 2 (CPT1B and CPT2)] were not affected while lipin-2 protein level, a closely related member of the family, was increased. Microarray analysis of patients’ myotubes identified 19 down-regulated and 51 up-regulated genes, indicating pleiotropic effects of lipin-1 deficiency. Special attention was paid to the up-regulated ACACB (acetyl-CoA carboxylase beta), a key enzyme in the fatty acid synthesis/oxidation balance. We demonstrated that overexpression of ACACB was associated with free fatty acid accumulation in patients’ myoblasts whereas malonyl-carnitine (as a measure of malonyl-CoA) and CPT1 activity were in the normal range in basal conditions accordingly to the normal daily activity reported by the patients. Remarkably ACACB invalidation in patients’ myoblasts decreased LD number and size while LPIN1 invalidation in controls induced LD accumulation. Further, pro-inflammatory treatments tumor necrosis factor alpha + Interleukin-1beta(TNF1α + IL-1β) designed to mimic febrile illness, resulted in increased malonyl-carnitine levels, reduced CPT1 activity and enhanced LD accumulation, a phenomenon reversed by dexamethasone and TNFα or IL-1β inhibitors. Our data suggest that the pathogenic mechanism of rhabdomyolysis in lipin-1-deficient patients combines the predisposing constitutive impairment of lipid metabolism and its exacerbation by pro-inflammatory cytokines.
Keywords: Rhabdomyolysis, Lipin-1, PAP1, ACACB, Lipid droplet, Inflammation
1. Introduction
Lipin-1 deficiency is a major cause of severe myoglobinuria in early childhood [1,2]. Despite well-known physiological roles of lipin-1 in lipid biosynthesis and transcriptional regulation in the adipocyte and liver, the pathogenic mechanisms leading to muscle lysis still remain to be elucidated. The few reports have been published for this disease in humans, are mainly limited to the clinical and genetic description of the patients. Lipin-1 (phosphatidic acid phosphatase 1, PAP1, EC 3.1.3.4) dephosphorylates phosphatidic acid (PA) to diacylglycerol (DAG), a common precursor for triglycerides (TAG) and phospholipids (PL) synthesis [3–5]. It also has transcriptional coregulator activity which, through association with PPARα, PGC-1α, SREBP1 or NFATc4, regulates lipid metabolism and mitochondrial respiratory chain (mRC) [6–10]. Lipin-1 is most abundant in adipocytes, skeletal muscle fibers, liver [11] and myocardium [7], and is subject to regulation by phosphorylation/dephosphorylation by mTOR. The mammalian family of lipins includes two other closely related members, lipin-2 and lipin-3, encoded by distinct genes and sharing 44–48% overall identity with high homology in their C-terminal moiety (C-LIP domain). Motifs for PAP1 activity (DXDXT) and interaction with transcriptional factors (LXXIL) are conserved, and the three lipins exhibit PAP1 activity and can complement each other when coexpressed [11–13]. PAP1 activity can modulate circulating TAG and fatty acid (FA) levels in mouse and, in this respect, fatty acid oxidation (FAO) appears correlated to efficient storage of FA in TAG [14]. As a whole, the dual function of lipin-1 confers this protein a unique pivotal role in FA metabolism, oxidative phosphorylation and lipid-dependent energy metabolism.
Evidence for transcriptional activity of lipin-1 in the liver and adipocytes was obtained by gene expression studies documenting lipin-1 binding to PPARα and PGC-1 and subsequent regulation of genes encoding FAO enzymes and PPARα itself [9,15,16]. Accordingly, lipin-1-deficient mice (fld) exhibit reduced expression of PPAR-regulated genes and impaired FAO activity [17]. These mice display signs of lipodystrophy and poor adipocyte differentiation. Reciprocally, overexpression of PPARγ in fld mouse pre-adipocytes rescues their ability to differentiate [18]. Finally, overexpression of lipin-1 in the skeletal muscle of transgenic mice dramatically affects energy balance [19] and modulation of FA metabolism in the heart alters lipin-1 response [7]. Interestingly, the mitochondria from Drosophila deleted for the lipin-1 ortholog have altered morphology [4] and human patients accumulate lipid droplets in the skeletal muscles along with occasional ragged-red fibers [20]. Therefore, lipin-1 might regulate energetic pathways towards oxidative metabolism and lipid utilization [21]. In humans, episodes of myoglobinuria are mostly precipitated by febrile illnesses [20], suggesting a critical role of inflammatory stress response.
Here we study for the first time the consequences of lipin-1 deficiency in human myoblasts and myotubes, and show that it alters lipid metabolism at least in part, through the up-regulation of the gene encoding acetyl-CoA carboxylase 2 (ACC2), a key enzyme in the fatty acid synthesis/FAO balance. On this basis we propose a physiopathological mechanism for acute rhabdomyolysis episodes, associating genetic and environmental components.
2. Materials and methods
2.1. Human subjects
Experiments were conducted on the skeletal muscle, myoblasts and myotubes obtained from 3 patients carrying two recessively-inherited mutations in LPIN1 gene and 3 age and sex-matched controls. This work has been approved by our institutional ethical committee after declaration to the Département de la Recherche Clinique et du Développement and informed consent was obtained from the parents. The 3 patients were previously described [1]: P1, a boy aged 8 years old (p.Asp316LeufsX26 and p.Glu766_Ser838del), P2, a girl aged 3 years old (p.Ser315X and p.Arg388X), and P3, a girl aged 10 years old (p.Asn417LysfsX22 and p.Glu766_Ser838del).
2.2. Muscle biopsies and primary human myoblasts and myotubes
Human primary myoblasts were isolated and grown as described [22]. CD56+ myoblasts were isolated by flow cytometry cell sorting using an anti CD56-APC conjugated antibody (Biosciences ref. 555518). Myotubes were derived from confluent myoblast cultures after replacing HamF10 medium by DMEM supplemented with 1% horse serum, 100 μg/mL human apotransferrine, 10 μg/mL insulin, and myotubes were used after 10 days of differentiation. Myoblasts were subjected to various stress conditions to mimic those believed to trigger episodes of rhabdomyolysis, such as pro-inflammatory cytokines (TNFα, IL-1β, R&D Systems) and poly(I:C) a synthetic inducer of the antiviral response, alone or combined and for various periods of time. The two following pro-inflammatory conditions were retained for further investigations i.e. the association of TNFα and IL-1β (10 ng/mL each), and poly(I:C) (25 μg/mL, Invivogen). 50% confluent cell cultures were synchronized by 12 h serum starvation before being submitted to the stress in regular HamF10 medium for the indicated times. Cells were trypsinized and immediately used or stored at −80 °C before being processed. All experiments were repeated at least three times. The efficacy of pro-inflammatory stimulations was confirmed by measuring IL6 release in culture medium with an immunoradiometric assay kit (Immunotopics) as previously described [23]. Cytokine inhibitors anakinra (antagonist of IL-1β receptor, 1 μg/mL) and ab9635 (anti TNFα antibody, 1 μg/mL, abcam), or the synthetic glucocorticoid dexamethasone (0.2 μM, Dex, Sigma), were further added in the culture medium respectively 1 h or 12 h prior to the 24 h-incubation with TNFα + IL-1β.
2.3. Oil red O staining
Cells were washed 5 times with PBS buffer then fixed in Baker’s fixative for 30 min and rinsed with water. Prior to use, Oil red O solution (Sigma-Aldrich) aggregates were eliminated by filtration on 0.22 μm membrane. The number of cells displaying small, large and aggregated LDs were counted in at least 4 randomly selected fields. LD aggregates were defined as intensely stained areas of irregular shape evocative of juxtaposed LDs.
2.4. Gene expression studies
2.4.1. Real-time quantitative RT-PCR
Total RNA was extracted from skeletal muscle samples, myoblasts and myotubes using the Trizol reagent (Invitrogen) and RNeasy Mini Kit (Qiagen). Single-stranded cDNA was synthesized from 2 μg of total RNA using the High Capacity RNA-to-cDNA Kit (Applied biosystems). Real-time quantitative reverse transcription PCR (qPCR) was performed using an ABI PRISM 7300 Sequence Detection System instrument and TaqMan Universal PCR Master Mix (Applied Biosystems). Reactions were performed in triplicate using commercially available Taqman kits (Applied Biosystems). Target gene expression was normalized to POLR2A mRNA level.
2.4.2. Affymetrix microarray study
DNA microarray analyses using Affymetrix Human Genome chips HG-U133plus2.0 were performed on myotubes from the three patients and the three controls with or without TNFα plus IL-1β stimulation for 24 h. Total RNA was extracted and used for genome-wide transcription analysis. Data analysis was performed using Affymetrix Microarray Suite 5.0 software to generate an absolute analysis for each chip. Each chip was scaled globally to a target intensity value of 800 to allow for inter-array comparisons. All image files and cell intensity files corresponding to each expression profile are available (the microarray data related to this paper have been submitted to the Array Express data repository at the European Bioinformatics Institute (http://www.ebi.ac.uk/arrayexpress/) under the accession number: Username: Review-er_E-MEXP-3761; Password: iysugop4r).
2.5. Immunoblotting
Myoblast proteins were obtained after lysis in ice-cold RIPA buffer supplemented with a cocktail of protease inhibitors (Sigma-Aldrich) according to standard protocols. Primary antibodies (Lipin-1 (RD, AF3885), lipin-2 (Santa Cruz, sc-134433), ACACB (Cell signal Technology, 3662) [24], Malonyldecarboxylase (abcdm, ab95945) and β-Actin (Santa cruz, sc-81178)) were detected by appropriate HRP-conjugated secondary antibody followed by ECL detection.
2.6. Biochemical investigations
2.6.1. PA phosphatase activity
PA phosphatase activity was measured at 37 °C for 20 min as previously described [5]. Total PAP activity was measured in the presence of 1 mM MgCl2. PAP2 activity (Mg2+-independent) was measured in the same conditions except that MgCl2 was chelated by 2 mM EDTA. The Mg2+-dependent PAP1 activity was calculated by subtracting PAP2 activity from total enzyme activity. One unit of PAP activity was defined as the amount of enzyme that catalyzed the formation of 1 nmol of product/min. Specific activity was defined as units/mg protein.
2.6.2. Total free fatty acid (FFA), phospholipid and triacylglycerol content
Total free fatty acid (FFA), phospholipid and triacylglycerol content were analyzed by gas chromatography as previously described [25]. Lipids were first separated by thin layer chromatography and the silica matrix zones corresponding to total FFA, PL and TAG were scrapped from the plate and quantified by GC-flame ionization detector.
2.6.3. Carnitine palmitoyltransferase I (CPT1) activity and malonyl-carnitine
Carnitine palmitoyltransferase I (CPT1) activity and malonyl-carnitine content were determined as described [26]. The assay was based on the production of deuterated [D5]-acylcarnitines by intact cells incubated with deuterated palmitate ([16-2H3, 15-2H2]–[D5]-palmitate) and excess of L-carnitine. CPT1 activity was assessed by initial rates of acylcarnitines over the first 6 min of incubation thus taking into account the potential catabolism of D5-palmitate through FAO. Acylcarnitines were analyzed by ESI/MS–MS [26,27]. Specificity of ESI/MS–MS analysis was obtained through selection of compounds generating the m/z 85 ion, the molecular weight of selected compounds further identifying the acylcarnitine. Malonyl-carnitine sample content was determined by the ratio between butylated malonyl-carnitine and its internal standard (i.e. butylated deuterated propionyl-carnitine). Myoblasts (106 cells/mL) were incubated in the buffers used for CPT1 assays on whole blood [27]. Myoblast pellets were resuspended in the buffer used for respiration measurements [28] without inclusion of malate.
2.6.4. Fatty acid oxidation
Fatty acid oxidation was measured in patients’ and controls’ myoblasts by the quantification of 3[H]-H2O production from (9,10-3H)-palmitate as previously described [22]. The oxidation rates were expressed as nanomoles of 3H fatty acid oxidized/h/mg of protein.
2.6.5. ATP levels
ATP levels were determined with the bioluminescence assay kit HSII (Roche Applied Science, Indianapolis, IN, USA) according to the manufacturer’s instruction. Cells seeded in triplicate were washed in warm PBS. Lysates were combined with luciferase and the resulting light emission was quantified by a microplate-format luminometer. Proteins were also quantified using the Bradford kit (Sigma) and the values of luminescence were corrected to the protein level.
2.7. Endoplasmic reticulum (ER) stress
ER stress was evaluated by studying the expression of several target genes of the ER stress response by PCR such as BIP, HERP, GRP94, and EDEM, or the integrated stress response such as ASNS, GADD34, ATF3, and CHOP.
2.8. siRNA transfections
Myoblasts were transfected using the jetPRIME® transfection reagent (polyplus) according to the supplier’s recommendations, with 25 nM siRNA of mission esiRNA ACB (EHU 138011, Sigma) targeting human ACACB, or siRNA targeting human LPIN1 (siGenome duplex # 2, D-017427-0 Dharmacon). The non targeting siRNA #2 (Dharmacon) was used as negative control. All experiments were performed in triplicate.
2.9. Cell cycle analysis
Myoblasts cultured with or without TNFα plus IL-1β (10 ng/mL each) were collected, fixed in 70% ethanol 1 h at 4 °C and stained with 40 μg/mL of propidium iodide and 100 ug/mL of RNAse. Samples were analyzed by flow cytometry at 488 nm excitation and 630 nm emission.
2.10. Statistical analysis
Gene expression and biochemical data were expressed as mean ± SD or SEM as indicated. Differences between control and deficient cells were analyzed by one-way analysis of variance and Student’s t test.
3. Results
3.1. LPIN1 mutations result in reduced LPIN1 mRNA, protein and enzyme activity
We determined LPIN1 gene expression and protein levels in isolated primary myoblasts derived from 3 patients and 3 age and sex-matched controls (Fig. 1). LPIN1 mRNA was reduced about 3 fold in patients’ myoblasts compared with controls (Fig. 1B). The mutated lipin-1 proteins were truncated before the site of antibody recognition (residues 448–574, Fig. 1A) and could not be detected by immunoblotting analysis (Fig. 1C). Surprisingly lipin-1 was not detectable in patients P1 and P3 carrying the p.Glu766_Ser838del LPIN1 allele generating an in-frame truncation in the C-LIP domain suggesting that the protein resulting from this frequent mutation is unstable. Compared with control myoblasts, a protein with a slightly higher molecular weight was detected in a control skeletal muscle sample (Fig. 1C) which may reflect different degrees of post-translational modifications of lipin-1 between muscle tissue and cultured myoblasts as lipin-1 is known to be subjected to SUMOylation and multiple phosphorylation [12,28]. Accordingly, PAP1 activity was dramatically decreased in patients’ myoblasts although not totally abolished whereas PAP2 activity (i.e. the Mg2+-independent activity) remained unchanged compared with controls (Fig. 1D).
Fig. 1.

Lipin-1 expression and activity. A: Schematic representation of Lipin-1 protein showing the mutations of each patient. The region deleted by the in-frame C-terminal deletion of patients P1 and P3 is shown by the thick black bar. The region recognized by the antibody AF3885 is indicated by vertical arrows. NLS: nuclear localisation signal, PAP: catalytic site for PAP1 activity, Coactivator: transcriptional coactivator binding motif. B: LPIN1 mRNA expression in basal culture conditions measured by real-time RT-PCR and normalized by POLR2A expression. C: Immunoblot analysis of lipin-1 and lipin-2 expression in myoblasts in basal conditions. P: Patients, C: Controls, Sm: skeletal muscle. D: PAP1 and PAP2 activity in myoblasts. from controls (C) and patients (P) grown in basal conditions. Results are shown as mean ± SD from three independent experiments.
3.2. Lipin-2 is up-regulated in lipin-1-deficient myoblasts
Because lipin family proteins share large sequence identity and exhibit similar activities, lipin-2 and lipin-3 proteins were studied. Unexpectedly, lipin-2 protein was specifically induced in the mutated cells while it was barely detectable in control myoblasts and muscle (Fig. 1C). However, lipin-2 mRNA levels were not significantly elevated in patient cells as indicated by the transcriptomic study suggesting that post-transcriptional mechanisms underlie lipin-2 up-regulation in the patients. Lipin-3 protein could not be detected in both patients and control myoblasts.
3.3. Lipid droplet content is increased in patients’ myoblasts
Oil red O staining showed the presence of LDs in the cytoplasm of 17% ± 2% of the controls’ myoblasts in basal condition which essentially composed of small LDs (93% ± 5%, Fig. 2). In contrast, most patients’ myoblasts showed an accumulation of LDs (77 ± 10%, 95 ± 5% and 72.5 ± 7% for P1, P2 and P3 respectively), which mostly composed of large LDs.
Fig. 2.
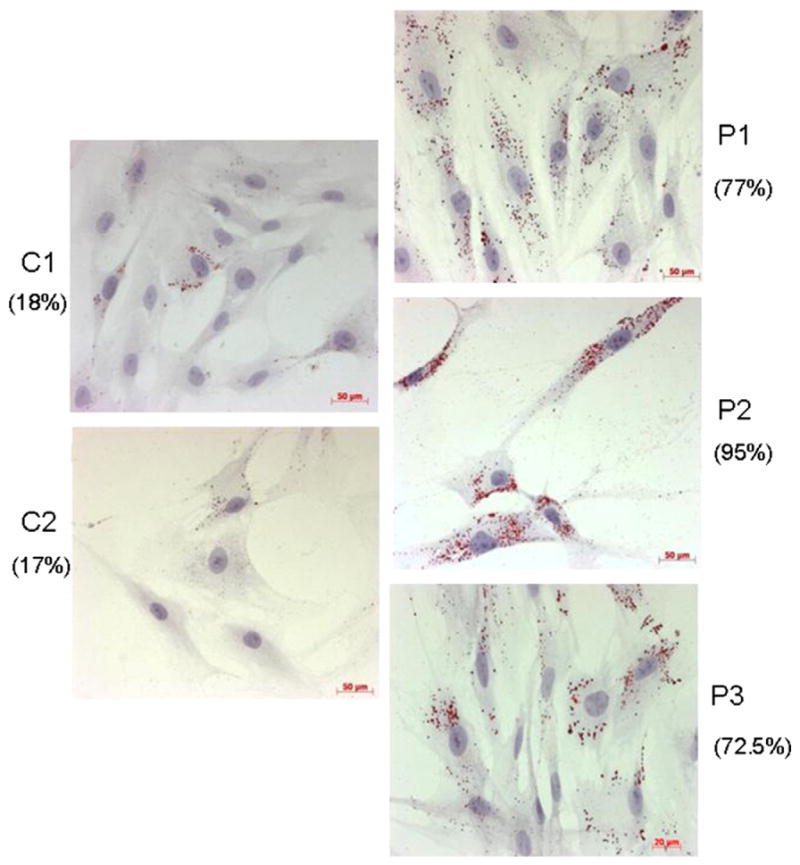
Representative histological oil red O staining of myoblasts from controls (left panels, C1, C2) and patients (right panels, P1, P2 and P3). LDs appear as red circular vacuoles in the cytoplasm. Numbers in parentheses indicate the percentage of LD positive cells.
Free fatty acid (FFA) content was dramatically increased in patients’ myoblasts compared to controls while total phospholipids and TAG contents were not significantly modified (Fig. 3A and B, Table 1). No significant change was detected in FA composition, as well as in the length and level of unsaturation of acyl chains in phosphatidic acid and phospholipids.
Fig. 3.
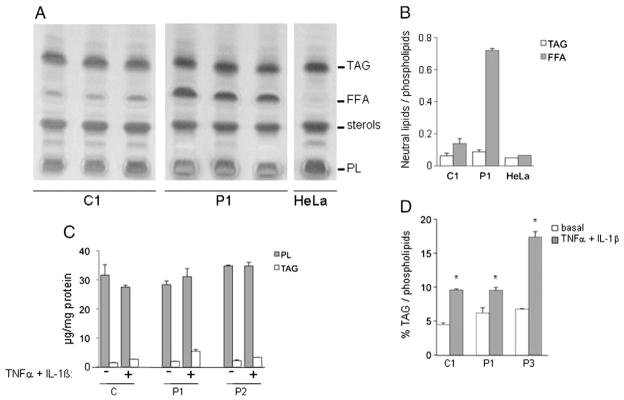
Lipid analysis in myoblasts. A: Lipids from 3.106 myoblasts from lipin-1-deficient patient (P1) and control (C1) grown in basal condition were extracted and analyzed by thin layer chromatography. Results are from three independent experiments. Hela cells extract, essentially devoid of free fatty acids are used as a control for lipid extraction. B: Quantification of TAG and FFA relative to PL content. C: Comparison of TAG and PL contents (μg) in myoblasts treated or not with TNFα + IL-1β. D: Comparison of the TAG content relative to PL content in myoblasts treated or not with TNFα + IL-1β. Results are presented as mean ± SD.
Table 1.
Phospholipid and triacylglyceride (TAG) contents in myoblasts of lipin-1-deficient patients and controls grown in basal and pro-inflammatory stress conditions (TNFα + IL-1β). Stress increases triacylglycerides content. P: patients, C: control. Data are expressed as mean ± SD (n = 3), *: p < 0.05 compared to respective basal condition.
| Sample | Stimulation | Phospholipids (μg) | Triacylglycerols (μg) | % TAG |
|---|---|---|---|---|
| P1 | Basal | 28.31 ± 1.30 | 1.89 ± 0.07 | 6.67 |
| TNFα + IL-1β | 31.07 ± 2.77 | 5.40 ± 0.60 | 17.38* | |
| P2 | Basal | 34.81 ± 0.30 | 2.15 ± 0.27 | 6.17 |
| TNFα + IL-1β | 34.76 ± 1.25 | 3.30 ± 0.08 | 9.49* | |
| C1 | Basal | 31.58 ± 3.64 | 1.42 ± 0.14 | 4.50 |
| TNFα + IL-1β | 27.47 ± 0.62 | 2.63 ± 0.07 | 9.57* |
Stress increases TAG content. Phospholipid and triacylglycerol contents in myoblasts of lipin-1-deficient patients and controls grown in basal and pro-inflammatory stress conditions (TNFα + IL-1β). P: Patients, C: Control. Data are expressed as mean ± SD (n = 3),
: p < 0.05.
3.4. The expression of known lipin-1 regulated genes involved in energy metabolism is not altered by lipin-1 deficiency
Quantitative real-time PCR analysis showed that basal expression levels of genes such as PPARδ, PPARα, and PGC-1α, described as lipin-1-transcriptionally modulated genes in the liver and adipocytes, and genes encoding enzymes of energetic pathways, like ACADVL (VLCAD), CPT1b and CPT2 [9,15,16] were not significantly different between patients’ and controls’ myoblasts (Table 2).
Table 2.
Genes differentially expressed in myoblasts from patients and controls in basal culture condition. Results are presented as mean ± SD. No significant difference was observed between patients and controls.
| Controls | Patients | |
|---|---|---|
| PPARα | 0.0523 ± 0.0019 | 0.0600 ± 0.0129 |
| PPARδ | 0.8406 ± 0.0750 | 0.8051 ± 0.1400 |
| PGC-1α | 0.0008 ± 0.0005 | 0.0006 ± 0.0003 |
| ACADVL | 0,1020 ± 0.0081 | 0.0817 ± 0.0175 |
| CPT1b | 0.0214 ± 0.0127 | 0.0262 ± 0.0084 |
| CPT2 | 0.7355 ± 0.2724 | 0.6070 ± 0.0596 |
3.5. Lipin-1 deficiency is not associated with ER stress
Because disturbance of ER homeostasis, suggested by the increased formation of LDs, contributes to metabolic dysfunction, we assessed by RT-PCR the expression of genes induced during ER stress response such as BIP, HERP, GRP94, and EDEM, or markers of the integrated stress response such as ASNS, GADD34, ATF3, and CHOP [29]. Comparison of myoblasts from two patients and one control failed to identify a specific pattern in lipin-1-deficient cells (data not shown), suggesting that ER stress is not a common feature in this pathology. Furthermore, neither altered nuclear or ER morphology nor membrane remodeling was observed by electronic microscopy in the myoblasts of any patients whereas it confirmed the constitutive presence of LDs in lipin-1-deficient myoblasts (data not shown).
3.6. Lipin-1 deficiency up-regulates ACACB in both myotubes and myoblasts
In order to identify genes modulated (directly or indirectly) by lipin-1 deficiency we conducted microarray experiments using myotubes derived from 3 patients and 3 controls (Fig. S1A). Applying a two-fold selection filter we identified 19 down-regulated and 51 up-regulated genes in lipin-1-deficient myotubes maintained in basal medium (Fig. S1B, Tables S1 and S2). Down-regulated genes included LPIN1 (4 fold), PPAP2B encoding one of the enzymes with PAP2 activity and several members of the HOXC cluster. Up-regulated genes contained several members of the HOXA cluster, CAPN6, HOPX (7 fold) involved in cardiomyocyte development, PIPOX (8 fold), CXCR4 (13 fold), CXCL13 (19 fold) and ACACB (2–3 fold). Microarray study confirmed that none of the genes previously reported as modulated by lipin-1 in the liver and adipocytes were detected [7,8,30]. The expression of some of these target genes was further measured by qPCR confirming it was unchanged despite lipin-1 deficiency. Interestingly, ACACB expression, encoding acetyl-CoA carboxylase (ACC) beta (or ACC2), the main ACC isoform in skeletal muscle was increased. This enzyme catalyzes the carboxylation of acetyl-CoA to generate malonyl-CoA, the rate-limiting step in fatty acid synthesis [31]. Because of this role, the up-regulation of this gene in the patients’ myotubes was further studied. ACACB up-regulation was directly confirmed in the patients’ myotubes by real-time PCR (Fig. 4A) and protein immunoblotting (Fig. 4B).
Fig. 4.

Analysis of ACACB expression and activity and CPT1 activity in myoblasts. A: mRNA level of ACACB measured by real-time RT-PCR in myotubes. The mean ± SD of controls (C) and patients (P) measures are shown. *: p < 0.01 P3 vs respective C; ◇ : p < 0.01 C basal vs TNFα + IL-1β. B: Immunoblotting of ACACB protein in myotubes, C: malonyl-carnitine content in myoblasts. Results are presented as mean ± SD. *: p < 0.001 C(TNFα + IL-1β) vs P (TNFα + IL-1β). D: CPT1 activity in myoblasts. CPT1 was assayed by initial rates of deuterated palmitoylcarnitine production by myoblasts incubated with deuterated palmitate. Each bar represents the mean value of two separate determinations obtained with myoblasts originating from one patient and one control.
3.7. MalonylCoA content is not changed by ACACB up-regulation
ACACB activity was indirectly assessed in myoblasts from patients and their cognate controls by the measure of malonyl-carnitine which under excess L-carnitine reflects malonyl-CoA concentration. In basal culture conditions malonyl-carnitine content was not significantly changed in any patient and appeared comparable to its control (Fig. 4C showing the data of patient 3 and its control: 40.63 ± 7.37, control 26.62 ± 4.83 pmol/mg protein, p = 0.187; data of patients 1 and 2, performed only once due to limited availability of primary myoblasts are similar (not shown). ACC phosphorylation, known to inhibit its carboxylase activity, was not modified in lipin-1-deficient patients (data not shown). However the strong cross-reaction of the antibody with phosphorylated ACC1, due to the complete identity with ACC2 in this region did not allow us to distinguish the level of phospho-Ser179 ACC2.
ACACA and ACACB encode the cytosolic (ACC1) and mitochondrial (ACC2) acetyl-CoA carboxylase isoforms, respectively. In contrast to ACC1 which directly contributes to FA synthesis, mitochondrial ACC2-driven malonyl-CoA production plays a major role in the regulation of mitochondrial FAO by inhibiting CPT1 activity, the rate-limiting step in mitochondrial FAO. Deuterated acylcarnitine production was measured as an index of CPT1 enzymatic activity (Fig. 4D). It was changed only in patient’s 1 cells compared to its control 1, and not in patients’ 2 and 3 cells compared to their controls. In agreement with the previous results, FAO flux in P3 myoblasts was also comparable to controls (data not shown).
However, a significant ~15% reduction of ATP content was measured in the myoblasts from two patients suggesting an impairment of the energetic metabolism in some patients (Fig. S2).
3.8. LPIN1 and ACACB expression modify lipid droplet content
Lipin-1 siRNA transfection of control myoblasts (Fig. 5A) reduced lipin-1 expression to levels similar to patient’s cells (Fig. 5A and B). Remarkably, it induced an accumulation of LDs relatively to off-target (control) siRNA (Fig. 5C, G and H). Reciprocally, reduction of ACACB expression in patient’s myoblasts to levels similar to controls (Fig. 5D and E) decreased LD number and size compared to off-target siRNA (Fig. 5F, G and H) confirming the link between LDs, lipin-1 deficiency and ACACB overexpression. In addition, CPT1 activity was increased in patients’ cells transfected with siRNA ACACB (Fig. 5I) further supporting the inverse relationship between ACACB overexpression and alteration of lipid metabolism.
Fig. 5.

Lipin-1 and ACACB expression, regulate malonyl-carnitine content, CPT1 activity and LD accumulation. Control’s myoblasts were transfected with either of target siRNA (ct) or lipin-1 siRNA and patient’s myoblasts with the same ct siRNA or ACACB siRNA as indicated. A: mRNA level measured by real-time RT-PCR in myotubes. The name of the samples is indicated at the bottom (C: control P3, patient 3), B: Lipin-1 protein expression, C: oil red O staining of C3 myoblasts (magnification 20×), D: ACACB mRNA expression, E: ACC2 protein expression, F: oil red O staining of P3 myoblasts (magnification 20×), G: percentage of cells showing LD accumulation, H: distribution of LDs according to their size, I: CPT1 activity after ACACB siRNA transfection (gray bars) expressed in % of activity in appropriate control myoblasts. Results are presented as mean ± SD excepted for panels H and I.
3.9. Pro-inflammatory cytokines enhance lipid metabolism defect in human lipin-1-deficient myoblasts
Myoblasts were then submitted to two paradigms of pro-inflammatory stress, poly(I:C) treatment (25 μg/mL, mimicking viral infection) and a combination of TNFα and IL-1β (10 ng/mL each), expecting to elicit an inflammatory stress and partially mimic conditions potentially triggering the acute metabolic decompensations in the patients. As expected, myoblasts from the patients and controls responded to pro-inflammatory stress by a robust IL6 secretion (Fig. 6A) reaching its maximum around 10 h after TNFα + IL-1β stimulation and between 3 and 6 h post stimulation with poly(I:C) (not shown). The response was much stronger in TNFα + IL-1β-stimulated myoblasts (mean 200–300,000 pg/mL) compared to poly(I:C) (mean 2–4000 pg/mL) indicating that poly(I:C) induced a weaker inflammatory response. IL6 release reached similar levels in control and lipin-1-deficient cells under each treatment (Fig. 6A).
Fig. 6.
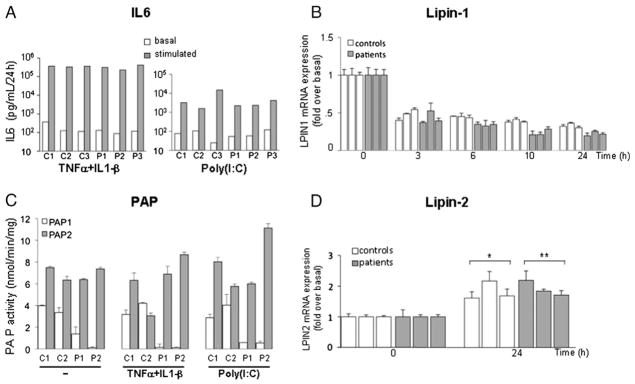
Inflammatory stress response. A: representative IL6 secretion from controls and patients after TNFα + IL-1β (left) or poly(I:C) (right) treatment. B: Time course analysis of lipin-1 mRNA expression under TNFα + IL-1β stimulation. Results are represented as fold variation over basal level. C: PAP activity after TNFα + IL-1β and poly(I:C) stimulation. D: LPIN2 mRNA expression measured by real-time RT-PCR (Brackets indicate that, considered as a group, patients or controls were significantly different from basal conditions * p < 0.05, ** p < 0.01). Results are presented relatively to basal culture condition value. Data are shown as mean ± SD excepted for panel A.
Cell proliferation was analyzed by cell cycle phase distribution of cells at G2/M by flow cytometry. Cell cycle distribution was analyzed at 24 h. In basal condition control’s and patient’s cells in G2M were 25.5% and 21.2 respectively. No significant difference was observed after 24 h of TNFα + IL-1β stimulation compared to basal values.
3.9.1. LPIN1 mRNA expression and activity
TNFα + IL-1β treatment resulted in a prolonged two-fold down-regulation of LPIN1 mRNA expression in the patients and control myoblasts (Fig. 6B), while poly(I:C) treatment led to a transient twofold decrease in the patients’ cells which appeared milder in controls and returned to basal levels after 24 h of treatment (data not shown). PAP1 and PAP2 activities were unchanged by inflammation conditions in patients’ and controls’ myoblasts except for myoblasts from patient P2 which displayed a moderate PAP2 activity increase after inflammatory stress (Fig. 6C). Lipin-1 protein level was unaffected by inflammatory condition in the control’s myoblasts (not shown) suggesting that lipin-1 protein has a relatively long half-life. TNFα + IL-1β (Fig. 6D) and poly(I:C) (data not shown) similarly induced a 2 fold stimulation of LPIN2 expression in the patient’s and control’s cells (Fig. 6D). However, despite this up-regulation, lipin-2 was unable to fully compensate for lipin-1 deficiency during inflammation as PAP1 activity remained unchanged.
3.9.2. Lipid metabolism anomalies are enhanced upon inflammatory stimuli
TNFα + IL-1β and to a lesser extent poly(I:C) treatments (Fig. 7B and C) induced a massive accumulation of LDs and aggregated LDs in the cytoplasm of the patient’s myoblasts compared to basal condition (Fig. 7A), with 98% of positive cells with TNFα + IL-1β and 67% with poly(I:C). LDs in control myoblasts were also increased after TNFα + IL-1β stimulation, but these LDs were of smaller size and less abundant than in the patients’ cells under the same condition (70% of positive cells with TNFα + IL-1β and 53% with poly(I:C)). Co-treatment with anti-inflammatory agents such as cytokine inhibitors (Fig. 7D) and the synthetic glucocorticoid dexamethasone (Fig. 7E and F) dramatically decreased the number of LDs in the patients’ myoblasts (85% decrease with dexamethasone and 50% with the combined anti TNFα and anakinra).
Fig. 7.

Representative histological oil red O staining of myoblasts from patients (right panel, P3) and controls (left panel, C3). Culture conditions are indicated on the right. A: basal, B: TNFα + IL-1β, C: PolyIC, D: TNFα + IL-1β combined with inhibitors of TNFα (ab9635) and IL-1β (anakinra), E: TNFα + IL-1β combined with Dexamethasone, F: Dexamethasone (dex). Magnification 20×, the scale bar is shown in the right bottom panel. Similar results were obtained in several independent experiments.
Total PL and TAG contents were determined in basal and pro-inflammatory conditions. As shown in Table 1 and Fig. 3C, PL content did not significantly vary under TNFα + IL-1β stimulation. In contrast, the TAG content was significantly higher in all myoblasts under pro-inflammatory stress compared to basal conditions (Fig. 3D). When reported to PL content, TAG content from P1, P3 and control increased by 2.1, 1.5 and 2.6 fold respectively, compared to the basal condition. The TAG increase was not associated with changes in the overall fatty acid composition nor did it modify proliferation rate of myoblasts (data not shown).
Altogether, these results show that cytokines and poly(I:C) dramatically alter lipid storage in myoblasts, particularly in the absence of functional lipin-1.
Microarray analysis (see Tables S1 and S3), real-time PCR and immunoblot analysis (Fig. 4A and B) showed that the up-regulation of ACACB observed in the patients’ myotubes and myoblasts was not modified by TNFα + IL-1β treatment. By contrast, the malonyl-carnitine content of the patients’ myoblasts was further increased by TNFα + IL-1β treatment compared to controls (60.44 ± 4.89 vs 16.82 ± 1.19 pmol/mg protein respectively, p < 0.01, Fig. 4C). Concomitantly, the CPT1 activity in all patients’ myoblasts was decreased by pro-inflammatory treatment while CPT1 activity increased in all controls’ myoblasts (Fig. 4D). ATP concentration which was lower in the patients’ myoblasts compared to controls in the basal condition further decreased after TNFα + IL-1β treatment in patient P1 and controls’ myoblasts but not in patient P2 (Fig. S2).
3.9.3. Expression of known lipin-1 regulated genes and transcriptomic studies in TNFα + IL-1β condition
TNFα + IL-1β treatment induced a sustained up-regulation of mRNA levels of ACADVL and CPT2 in both patient’s and control’s myoblasts (Fig. 8) while the expression of CPT1b and PPARδ was transiently stimulated and PPARα was transiently slightly decreased. The expression of PGC-1α was not significantly modified although there was a trend for up-regulation (Fig. 8).
Fig. 8.

Time course analysis of selected Lipin-1 target genes mRNA expression in myoblasts stimulated with TNFα + IL-1β. Gene expression was measured by real-time RT-PCR and normalized by POLR2A expression. Results are presented relatively to basal culture condition value. Data are shown as mean ± SD. The names of mRNA measured are indicated at the top of each panel and time (hours) at the bottom. Brackets indicate that when considered as a group patients or controls were significantly different from corresponding untreated conditions (*: p < 0.05, ** p < 0.001). Samples follow the same order–C1, C2, C3, P1, P2, P3- in all panels. Results are shown as mean ± SD from three independent experiments.
Gene expression analyses were also performed on myotubes derived from lipin-1-deficient patients and controls subjected to TNFα + IL-1β stimulation for 24 h (Fig. S1A).
The set of genes regulated by the pro-inflammatory treatment in both lipin-1-deficient and control myotubes was largely similar sharing numerous up-regulated (>300) and down-regulated (88) genes (Fig. S1B and C, Tables S2 and S3). The majority of these modulated genes belonged to the TNFα + IL-1β signaling pathways or were related to stress response (SOD2, metallothioneins), indicating that the lipin-1-deficient myotubes were able to build an apparently normal inflammatory response. The set of inflammation-modulated genes found in both controls’ and patients’ myotubes also included genes encoding metabolic enzymes of energetic pathways (e.g. glycolysis: PGK1, PGAM1, ENO2, PFKFB3, and GPD2) and lipid metabolism (e.g.: APOL1, APOL3, FAPB5, and CH25H). Consistent with our quantitative real-time PCR studies in the myoblasts (see Fig. 1B), LPIN1 expression was lower in the patients’ myotubes compared to controls. Most of the genes differentially expressed under basal culture condition were unaffected by pro-inflammatory treatment (Table S2) excepted CAPN6, PIPOX, and HOPX (increased) and CXCR4 (decreased). Finally a limited number of genes displayed a differential induction specifically after TNFα + IL-1β (Table S3) among which very few are known to participate to the immune response, again suggesting that the immune response is not grossly affected in lipin-1-deficient myotubes.
4. Discussion
Cellular lipid metabolism is regulated by a coordinated fine-tuning of lipogenesis (FA and TAG synthesis) and lipolysis (FAO activity). Here we show that both metabolic pathways are altered in lipin-1-deficient myoblasts, at least in part as a consequence of PAP1 deficiency and increased ACACB expression [32], with subsequent LD and FFA accumulation. Biochemical analyses and molecular biology experiments indicated that basal lipid metabolism was not significantly modified in lipin-1-deficient myoblasts apart from ACACB. Yet, lipid synthesis and storage were profoundly affected as indicated by increased free fatty acid content and accumulation of lipid droplets supporting our previous proposition to classify LPIN1-dependent rhabdomyolysis as a novel form of lipid myopathy [20]. siRNA experiments further demonstrated the inverse relationships between LPIN1 or ACACB expression, CPT1 activity and LD accumulation. Finally, pro-inflammatory stress induced by TNFα + IL-1β or poly(I:C) exacerbated LD accumulation, decreased CPT1 activity and increased triacylglycerol content, highlighting a crucial role of inflammation in the pathogenesis of lipin-1 deficiency. Altogether these results support a role of inflammation as a potential triggering factor of rhabdomyolysis.
LDs are formed by neutral lipids, mainly TAG and to a lesser extent cholesterol esters, and are key storage compartments for the response to increased energetic demand [33]. Their accumulation in LPIN1 mutated cells, mostly observed in inflammatory conditions, was unexpected considering the major role of lipin-1 in TAG synthesis and the importance of TAG synthesis in facilitating LD expansion [34]. Nevertheless, intracellular accumulation of lipids is a common feature in lipin-1-deficient models [35,36]. The up-regulation of lipin-2 in the patients’ myoblasts, also reported in the liver and heart from lipin-1-deficient mouse models [11,13,37], may account for the residual PAP1 activity, allowing a limited synthesis of TAG. Furthermore, it was shown that long-chain fatty acids display an unexpected high pKa value leading to the hypothesis that FFA could accumulate in a cell mainly in an undissociated form [38]. Accordingly, it is well known that lipids accumulate mainly in the form of FFA and TAG in the oleaginous yeast Yarrowia lipolytica [39]. Interestingly, in Y. lipolytica complete inhibition of FAO leads to a large increase in FFA content resulting in larger LDs [40]. Since the neutral lipid fraction of the patient cells contains about 90% FFA, we hypothesize that accumulated FFA could be stored in an inert, non-toxic, form in the hydrophobic core of LD, together with the neutral lipids steryl esters and TAG. Indeed, the increase of TAG content in the patient myoblasts induced by inflammatory conditions, is unlikely to explain alone the large increase of LD number and size. Interestingly lipin-1 is directly linked to LD biogenesis and expansion, as it catalyzes a critical step of adipogenesis and colocalizes with LDs in various species [3,41,42] while in our model, lipin-1 is lacking. In vitro, this “LD phenotype” was strongly attenuated by anti-inflammatory agents such as anti-TNFα and anti-IL-1β and to a higher extent by dexamethasone. Such treatments might blunt or interfere with the cascade of events leading to the dramatic skeletal muscle lysis in the patients and hence may prove useful to prevent muscle lysis or reduce its severity. In this view it is worth noting that corticoids are known to affect both lipogenesis and lipolysis and to induce ACACB and LPIN1 expression [43,44].
Lipin-1 is also the main isoform in the cardiac muscle [7,21], a tissue strongly dependent on FFA as energetic substrates. In contrast with studies in mouse liver [11], Kok et al. [37] reported that although PAP1 activity was dramatically reduced in the heart of fld mice, triglyceride synthesis and FAO flux appeared unaffected. However the measure of FAO activity is known to have a limited sensitivity and may not detect a moderate inhibition [45].
Altered transcriptional activity of lipin-1 may also contribute to the phenotype of lipin-1-deficient myoblasts. However, in contrast to the liver, loss of lipin-1 expression did not change the expression of FAO genes in the myotubes. Similarly, none of the target genes of PGC1a, SREBP1 or NFATc4, the transcription factors or cofactors modulated by lipin-1, was induced or repressed in our transcriptomic study with the notable exception of ACACB [46]. It is possible that muscle specific mechanisms compensate for lipin-1 deficiency or that the transcriptional function of lipin-1 is less important for the expression of these genes in the muscle cells. Nevertheless, the absence of obvious metabolic and the limited transcriptional consequences of lipin-1 deficiency in normal culture conditions are in agreement with the apparent absence of symptoms between rhabdomyolysis episodes. Consistent with the decreased heart function in fld mice in vivo, we previously reported gross alterations of the cardiac muscle with massive accumulation of lipids in a patient who died during a rhabdomyolysis episode [47], suggesting some heart metabolic dysfunction in this disease. Clinicians should be aware that a defective heart function due to intra-cardiac accumulation of lipids should be considered in this disease [48].
Because DAG, the product of PAP1 activity, is also the precursor of several membrane phospholipids [49,50], altered cell membrane composition and hence increased fragility or sensitivity to breakdown injuries have been hypothesized [2]. However, skeletal muscle and myoblast phospholipid contents appeared unchanged, and pro-inflammatory stimuli did not significantly affect phospholipid metabolism in the myoblasts. Accordingly we did not observe gross alteration in nuclear or ER morphology, nor apparent membrane remodeling.
Our results point to inflammation as a condition worsening pre-existent alterations of lipid metabolism in lipin-1-deficient myoblasts and are consistent with its role as a trigger of the sudden rhabdomyolysis episodes. Remarkably the expression of LPIN1 and genes involved in energy metabolism are repressed by various inflammatory inducers and pro-inflammatory cytokines [51,52]. Indeed, the patients’ myoblasts also displayed a lower ATP content suggesting that the energetic metabolism is decreased in basal culture condition despite our inability to demonstrate significant biochemical changes. This decrease was further enhanced by pro-inflammatory stimulation, supporting our hypothesis of a triggering role of inflammation. Prolonged exercise and excess of circulating FFAs also induce a mild state of inflammation. In these situations, the muscles secrete various cytokines and chemokines which may amplify immune response in a paracrine/autocrine fashion [53,54]. Notably, as suggested by our transcriptomic study, these cytokines induce the mobilization of endogenous fuel stores to maintain energy homeostasis through transcriptional modulation of genes governing many aspects of glucose and lipid metabolism [55], even if in our experiments major regulators such as PGC1α were not or barely modulated. In the other way, lipin-1 regulates adipose tissue inflammatory response by repressing transcriptional activity of the nuclear factor of activated T cells c4 (NFATc4), which has an important role in the activation of pro-inflammatory cytokine expression [10]. Suppression of lipin-1 also increases expression and chemotactic activity of monocyte chemoattractant protein-1 (MCP-1) which is involved in monocyte/macrophage chemotaxis and adipose inflammation in obesity [56], and in triggering LD biogenesis [57]. Both abilities of lipin-1 to repress NFATc4 activity and MCP-1 activity may influence macrophage recruitment to the fat tissue and inhibit secretion of inflammatory factors. Interestingly, the excess of ACACB has also been shown to increase pro-inflammatory cytokine expression in the epithelial cells [58]. Inversely, we observed that the inflammatory stress induced by TNFα and IL-1β in lipin-1-deficient myoblasts did not further up-regulate ACACB expression, yet increased malonyl-carnitine, used as a surrogate of malonyl-CoA, the product of ACC2 activity. The phosphorylation state of ACC2 is known to regulate its activity but could not be determined due to technical issues and further analyses are needed to understand the mechanisms underlying this increase in response to pro-inflammatory stress specifically in lipin-1-deficient myoblasts. Altogether our results suggest that in basal conditions lipin-1 deficiency results only in modest alteration of lipid metabolism, consistent with the normal daily activities reported by the patients. The up-regulation of lipin-2 suggests that compensatory mechanisms may take place allowing a normal balance of lipogenesis and lipolysis. Our results support a pathogenic mechanism of rhabdomyolysis episodes triggered by inflammation, increasing lipid synthesis and affecting CPT1 activity and possibly FFA catabolism, thus translating in an imbalance beyond adaptation capabilities. However the variability between patients and their medical history suggests that inflammation is likely not the sole possible trigger. In vitro IL6 release and expression of inflammatory response genes were quite similar in patient and control myotubes and myoblasts and, histological analysis of muscle biopsies of the patients outside of myolysis bouts repeatedly failed to reveal signs of chronic inflammation such as macrophage infiltration. In this respect, lipin-2, which is involved in the Majeed syndrome, an auto-inflammatory disorder with recurrent fever [59], exhibits anti-inflammatory properties that control TAG synthesis, JNK/AP-1 pathway activation and ultimately the up-regulation of pro-inflammatory genes under palmitic stimulation [60]. Each lipin isoform might thus exert tissue-specific regulation of inflammatory pathways, underlining the potential critical role of inflammation as a trigger of rhabdomyolysis. One may hypothesize that under normal physiological conditions, the residual PAP1 activity, likely resulting from compensation by lipin-2 up-regulation, would allow adequate lipid metabolism to sustain normal muscle function and integrity. By contrast, lipin-2 compensation would not be strong enough to support efficient adaptation to increased energetic demand, particularly with respect to lipid catabolism induced by various inflammatory stresses.
In conclusion, we show that PAP1 activity is severely decreased in lipin-1-deficient muscle cells and is associated with ACACB up-regulation, which may explain the accumulation of lipid droplets and free fatty acids in the patients’ cells. Remarkably pro-inflammatory stress increases lipid metabolism alterations, decreased CPT1 activity and appears to favor lipid synthesis and storage over oxidation. Thus, the pathogenic mechanism of lipin-1 rhabdomyolysis episodes would associate genetic and environmental components, a combination likely to drive acute metabolic decompensation episodes in other inborn errors of metabolism. Finally, anti-inflammatory agents may present interesting therapeutic opportunities in the prevention of the devastating muscle lysis episodes.
Supplementary Material
Acknowledgments
Funding
This work was supported by the Association Française contre les Myopathies [grant numbers 13988, 15947]; Fondation pour la Recherche Médicale [Master to MC]; INSERM [poste d’accueil to MC]; Fondation Bettencourt [post-doctorant to MA]; Fondation de l’Avenir [grant number 09071]; Connaître les Syndromes Cérébelleux [post-doctorant to MA]; Fondation Lejeune [grant 2011–2012], and the National Institutes of Health [grant number GM-28140 to GMC].
We thank Michele Pelosi for his scientific expertise, Patrick Nusbaum and Jamel Chelly for the myoblast cultures, Corinne Cordier and François-Xavier Mauvais for expert help with cell sorting and FACS analysis, Christine Bole-Feysot and Nicolas Cagnard for transcriptomic studies and analysis, Frederic Vaz for his lipid expertise, and Anne Lombès for advice on ATP measurements. We acknowledge the Métabolome-Lipidome-Fluxome facility of Bordeaux for contribution to lipid analysis (https://www.bordeaux.inra.fr/umr619/RMN_index.htm).
Abbreviations
- ACACB
acetyl-coenzyme A carboxylase beta
- PA
phosphatidic acid
- PAP
phosphatidic acid phosphatase
- DAG
diacylglycerol
- TAG
triacylglycerides
- PL
phospholipids
- FAO
fatty acid oxidation
- FFA
free fatty acid
- CPT
carnitine palmitoyl transferase
- TNFα
tumor necrosis factor alpha
- IL-1β
Interleukin-1beta
- Poly(I:C)
polyinosinic-polycytidylic acid
- mRC
mitochondrial respiratory chain
- LD
lipid droplets
Footnotes
Supplementary data to this article can be found online at http://dx.doi.org/10.1016/j.bbadis.2013.07.021.
Conflict of interest statement
The authors have no conflicting financial interests.
References
- 1.Michot C, Hubert L, Brivet M, De Meirleir L, Valayannopoulos V, Muller-Felber W, Venkateswaran R, Ogier H, Desguerre I, Altuzarra C, Thompson E, Smitka M, Huebner A, Husson M, Horvath R, Chinnery P, Vaz FM, Munnich A, Elpeleg O, Delahodde A, de Keyzer Y, de Lonlay P. LPIN1 gene mutations: a major cause of severe rhabdomyolysis in early childhood. Hum Mutat. 2010;31:E1564–E1573. doi: 10.1002/humu.21282. [DOI] [PubMed] [Google Scholar]
- 2.Zeharia A, Shaag A, Houtkooper RH, Hindi T, de Lonlay P, Erez G, Hubert L, Saada A, de Keyzer Y, Eshel G, Vaz FM, Pines O, Elpeleg O. Mutations in LPIN1 cause recurrent acute myoglobinuria in childhood. Am J Hum Genet. 2008;83:489–494. doi: 10.1016/j.ajhg.2008.09.002. [DOI] [PMC free article] [PubMed] [Google Scholar]
- 3.Harris TE, Finck BN. Dual function lipin proteins and glycerolipid metabolism. Trends Endocrinol Metab. 2011;22:226–233. doi: 10.1016/j.tem.2011.02.006. [DOI] [PMC free article] [PubMed] [Google Scholar]
- 4.Ugrankar R, Liu Y, Provaznik J, Schmitt S, Lehmann M. Lipin is a central regulator of adipose tissue development and function in Drosophila melanogaster. Mol Cell Biol. 2011;31:1646–1656. doi: 10.1128/MCB.01335-10. [DOI] [PMC free article] [PubMed] [Google Scholar]
- 5.Han GS, Carman GM. Characterization of the human LPIN1-encoded phosphatidate phosphatase isoforms. J Biol Chem. 2010;285:14628–14638. doi: 10.1074/jbc.M110.117747. [DOI] [PMC free article] [PubMed] [Google Scholar]
- 6.Sugden MC, Caton PW, Holness MJ. PPAR control: it’s SIRTainly as easy as PGC. J Endocrinol. 2010;204:93–104. doi: 10.1677/JOE-09-0359. [DOI] [PubMed] [Google Scholar]
- 7.Mitra MS, Schilling JD, Wang X, Jay PY, Huss JM, Su X, Finck BN. Cardiac lipin 1 expression is regulated by the peroxisome proliferator activated receptor gamma coactivator 1alpha/estrogen related receptor axis. J Mol Cell Cardiol. 2011;51:120–128. doi: 10.1016/j.yjmcc.2011.04.009. [DOI] [PMC free article] [PubMed] [Google Scholar]
- 8.Peterson TR, Sengupta SS, Harris TE, Carmack AE, Kang SA, Balderas E, Guertin DA, Madden KL, Carpenter AE, Finck BN, Sabatini DM. mTOR complex 1 regulates lipin 1 localization to control the SREBP pathway. Cell. 2011;146:408–420. doi: 10.1016/j.cell.2011.06.034. [DOI] [PMC free article] [PubMed] [Google Scholar]
- 9.Finck BN, Gropler MC, Chen Z, Leone TC, Croce MA, Harris TE, Lawrence JC, Jr, Kelly DP. Lipin 1 is an inducible amplifier of the hepatic PGC-1alpha/PPARalpha regulatory pathway. Cell Metab. 2006;4:199–210. doi: 10.1016/j.cmet.2006.08.005. [DOI] [PubMed] [Google Scholar]
- 10.Kim HB, Kumar A, Wang L, Liu GH, Keller SR, Lawrence JC, Jr, Finck BN, Harris TE. Lipin 1 represses NFATc4 transcriptional activity in adipocytes to inhibit secretion of inflammatory factors. Mol Cell Biol. 2010;30:3126–3139. doi: 10.1128/MCB.01671-09. [DOI] [PMC free article] [PubMed] [Google Scholar]
- 11.Donkor J, Sariahmetoglu M, Dewald J, Brindley DN, Reue K. Three mammalian lipins act as phosphatidate phosphatases with distinct tissue expression patterns. J Biol Chem. 2007;282:3450–3457. doi: 10.1074/jbc.M610745200. [DOI] [PubMed] [Google Scholar]
- 12.Harris TE, Huffman TA, Chi A, Shabanowitz J, Hunt DF, Kumar A, Lawrence JC., Jr Insulin controls subcellular localization and multisite phosphorylation of the phosphatidic acid phosphatase, lipin 1. J Biol Chem. 2007;282:277–286. doi: 10.1074/jbc.M609537200. [DOI] [PubMed] [Google Scholar]
- 13.Dwyer JR, Donkor J, Zhang P, Csaki LS, Vergnes L, Lee JM, Dewald J, Brindley DN, Atti E, Tetradis S, Yoshinaga Y, De Jong PJ, Fong LG, Young SG, Reue K. Mouse lipin-1 and lipin-2 cooperate to maintain glycerolipid homeostasis in liver and aging cerebellum. Proc Natl Acad Sci U S A. 2012;109(37):E2486–E2495. doi: 10.1073/pnas.1205221109. [DOI] [PMC free article] [PubMed] [Google Scholar]
- 14.Liu L, Shi X, Choi CS, Shulman GI, Klaus K, Nair KS, Schwartz GJ, Zhang Y, Goldberg IJ, Yu YH. Paradoxical coupling of triglyceride synthesis and fatty acid oxidation in skeletal muscle overexpressing DGAT1. Diabetes. 2009;58:2516–2524. doi: 10.2337/db08-1096. [DOI] [PMC free article] [PubMed] [Google Scholar]
- 15.Yao-Borengasser A, Rasouli N, Varma V, Miles LM, Phanavanh B, Starks TN, Phan J, Spencer HJ, III, McGehee RE, Jr, Reue K, Kern PA. Lipin expression is attenuated in adipose tissue of insulin-resistant human subjects and increases with peroxisome proliferator-activated receptor gamma activation. Diabetes. 2006;55:2811–2818. doi: 10.2337/db05-1688. [DOI] [PubMed] [Google Scholar]
- 16.Donkor J, Sparks LM, Xie H, Smith SR, Reue K. Adipose tissue lipin-1 expression is correlated with peroxisome proliferator-activated receptor alpha gene expression and insulin sensitivity in healthy young men. J Clin Endocrinol Metab. 2008;93:233–239. doi: 10.1210/jc.2007-1535. [DOI] [PMC free article] [PubMed] [Google Scholar]
- 17.Rehnmark S, Giometti CS, Slavin BG, Doolittle MH, Reue K. The fatty liver dystrophy mutant mouse: microvesicular steatosis associated with altered expression levels of peroxisome proliferator-regulated proteins. J Lipid Res. 1998;39:2209–2217. [PubMed] [Google Scholar]
- 18.Phan J, Peterfy M, Reue K. Lipin expression preceding peroxisome proliferator-activated receptor-gamma is critical for adipogenesis in vivo and in vitro. J Biol Chem. 2004;279:29558–29564. doi: 10.1074/jbc.M403506200. [DOI] [PubMed] [Google Scholar]
- 19.Phan J, Reue K. Lipin, a lipodystrophy and obesity gene. Cell Metab. 2005;1:73–83. doi: 10.1016/j.cmet.2004.12.002. [DOI] [PubMed] [Google Scholar]
- 20.Michot C, Hubert L, Romero NB, Gouda A, Mamoune A, Mathew S, Kirk E, Viollet L, Rahman S, Bekri S, Peters H, McGill J, Glamuzina E, Farrar M, von der Hagen M, Alexander IE, Kirmse B, Barth M, Laforet P, Benlian P, Munnich A, Jeanpierre M, Elpeleg O, Pines O, Delahodde A, de Keyzer Y, de Lonlay P. Study of LPIN1, LPIN2 and LPIN3 in rhabdomyolysis and exercise-induced myalgia. J Inherit Metab Dis. 2012;35(6):1119–1128. doi: 10.1007/s10545-012-9461-6. [DOI] [PubMed] [Google Scholar]
- 21.Higashida K, Higuchi M, Terada S. Potential role of lipin-1 in exercise-induced mitochondrial biogenesis. Biochem Biophys Res Commun. 2008;374:587–591. doi: 10.1016/j.bbrc.2008.07.079. [DOI] [PubMed] [Google Scholar]
- 22.Djouadi F, Aubey F, Schlemmer D, Bastin J. Peroxisome proliferator activated receptor delta (PPARdelta) agonist but not PPARalpha corrects carnitine palmitoyl transferase 2 deficiency in human muscle cells. J Clin Endocrinol Metab. 2005;90:1791–1797. doi: 10.1210/jc.2004-1936. [DOI] [PubMed] [Google Scholar]
- 23.Gallucci S, Provenzano C, Mazzarelli P, Scuderi F, Bartoccioni E. Myoblasts produce IL-6 in response to inflammatory stimuli. Int Immunol. 1998;10:267–273. doi: 10.1093/intimm/10.3.267. [DOI] [PubMed] [Google Scholar]
- 24.Castle JC, Hara Y, Raymond CK, Garrett-Engele P, Ohwaki K, Kan Z, Kusunoki J, Johnson JM. ACC2 is expressed at high levels in human white adipose and has an isoform with a novel N-terminus [corrected] PLoS One. 2009;4:e4369. doi: 10.1371/journal.pone.0004369. [DOI] [PMC free article] [PubMed] [Google Scholar]
- 25.Testet E, Laroche-Traineau J, Noubhani A, Coulon D, Bunoust O, Camougrand N, Manon S, Lessire R, Bessoule JJ. Ypr140wp, ‘the yeast tafazzin’, displays a mitochondrial lysophosphatidylcholine (lyso-PC) acyltransferase activity related to triacyl-glycerol and mitochondrial lipid synthesis. Biochem J. 2005;387:617–626. doi: 10.1042/BJ20041491. [DOI] [PMC free article] [PubMed] [Google Scholar]
- 26.Fontaine M, Dessein AF, Douillard C, Dobbelaere D, Brivet M, Boutron A, Zater M, Mention-Mulliez K, Martin-Ponthieu A, Vianey-Saban C, Briand G, Porchet N, Vamecq J. A novel mutation in CPT1A resulting in hepatic CPT deficiency. J Inherit Metab Dis Rep. 2012;1:7–14. doi: 10.1007/8904_2011_94. [DOI] [PMC free article] [PubMed] [Google Scholar]
- 27.Dessein AF, Fontaine M, Dobbelaere D, Mention-Mulliez K, Martin-Ponthieu A, Briand G, Vamecq J. Deuterated palmitate-driven acylcarnitine formation by whole-blood samples for a rapid diagnostic exploration of mitochondrial fatty acid oxidation disorders. Clin Chim Acta. 2009;406:23–26. doi: 10.1016/j.cca.2009.04.026. [DOI] [PubMed] [Google Scholar]
- 28.Liu GH, Gerace L. Sumoylation regulates nuclear localization of lipin-1alpha in neuronal cells. PLoS One. 2009;4:e7031. doi: 10.1371/journal.pone.0007031. [DOI] [PMC free article] [PubMed] [Google Scholar]
- 29.Fu S, Watkins SM, Hotamisligil GS. The role of endoplasmic reticulum in hepatic lipid homeostasis and stress signaling. Cell Metab. 2012;15:623–634. doi: 10.1016/j.cmet.2012.03.007. [DOI] [PubMed] [Google Scholar]
- 30.Smale ST. Selective transcription in response to an inflammatory stimulus. Cell. 2010;140:833–844. doi: 10.1016/j.cell.2010.01.037. [DOI] [PMC free article] [PubMed] [Google Scholar]
- 31.Saggerson D. Malonyl-CoA, a key signaling molecule in mammalian cells. Annu Rev Nutr. 2008;28:253–272. doi: 10.1146/annurev.nutr.28.061807.155434. [DOI] [PubMed] [Google Scholar]
- 32.Abu-Elheiga L, Oh W, Kordari P, Wakil SJ. Acetyl-CoA carboxylase 2 mutant mice are protected against obesity and diabetes induced by high-fat/high-carbohydrate diets. Proc Natl Acad Sci U S A. 2003;100:10207–10212. doi: 10.1073/pnas.1733877100. [DOI] [PMC free article] [PubMed] [Google Scholar]
- 33.Farese RV, Jr, Walther TC. Lipid droplets finally get a little R-E-S-P-E-C-T. Cell. 2009;139:855–860. doi: 10.1016/j.cell.2009.11.005. [DOI] [PMC free article] [PubMed] [Google Scholar]
- 34.Xu N, Zhang SO, Cole RA, McKinney SA, Guo F, Haas JT, Bobba S, Farese RV, Jr, Mak HY. The FATP1–DGAT2 complex facilitates lipid droplet expansion at the ER-lipid droplet interface. J Cell Biol. 2012;198:895–911. doi: 10.1083/jcb.201201139. [DOI] [PMC free article] [PubMed] [Google Scholar]
- 35.Peterfy M, Phan J, Xu P, Reue K. Lipodystrophy in the fld mouse results from mutation of a new gene encoding a nuclear protein, lipin. Nat Genet. 2001;27:121–124. doi: 10.1038/83685. [DOI] [PubMed] [Google Scholar]
- 36.Hu M, Yin H, Mitra MS, Liang X, Ajmo JM, Nadra K, Chrast R, Finck BN, You M. Hepatic-specific lipin-1 deficiency exacerbates experimental alcohol-induced steatohepatitis in mice. Hepatology. 2013 doi: 10.1002/hep.26589. (Electronic publication ahead of print, 20th of June) [DOI] [PMC free article] [PubMed] [Google Scholar]
- 37.Kok BP, Kienesberger PC, Dyck JR, Brindley DN. Relationship of glucose and oleate metabolism to cardiac function in lipin-1 deficient (fld) mice. J Lipid Res. 2012;53:105–118. doi: 10.1194/jlr.M019430. [DOI] [PMC free article] [PubMed] [Google Scholar]
- 38.Kanicky JR, Shah DO. Effect of degree, type, and position of unsaturation on the pKa of long-chain fatty acids. J Colloid Interface Sci. 2002;256:201–207. doi: 10.1006/jcis.2001.8009. [DOI] [PubMed] [Google Scholar]
- 39.Beopoulos A, Nicaud JM, Gaillardin C. An overview of lipid metabolism in yeasts and its impact on biotechnological processes. Appl Microbiol Biotechnol. 2011;90:1193–1206. doi: 10.1007/s00253-011-3212-8. [DOI] [PubMed] [Google Scholar]
- 40.Beopoulos A, Mrozova Z, Thevenieau F, Le Dall MT, Hapala I, Papanikolaou S, Chardot T, Nicaud JM. Control of lipid accumulation in the yeast Yarrowia lipolytica. Appl Environ Microbiol. 2008;74:7779–7789. doi: 10.1128/AEM.01412-08. [DOI] [PMC free article] [PubMed] [Google Scholar]
- 41.Adeyo O, Horn PJ, Lee S, Binns DD, Chandrahas A, Chapman KD, Goodman JM. The yeast lipin orthologue Pah1p is important for biogenesis of lipid droplets. J Cell Biol. 2011;192:1043–1055. doi: 10.1083/jcb.201010111. [DOI] [PMC free article] [PubMed] [Google Scholar]
- 42.Valdearcos M, Esquinas E, Meana C, Gilde-Gomez L, Guijas C, Balsinde J, Balboa MA. Subcellular localization and role of lipin-1 in human macrophages. J Immunol. 2011;186:6004–6013. doi: 10.4049/jimmunol.1003279. [DOI] [PubMed] [Google Scholar]
- 43.Gathercole LL, Morgan SA, Bujalska IJ, Hauton D, Stewart PM, Tomlinson JW. Regulation of lipogenesis by glucocorticoids and insulin in human adipose tissue. PLoS One. 2011;6:e26223. doi: 10.1371/journal.pone.0026223. [DOI] [PMC free article] [PubMed] [Google Scholar]
- 44.Manmontri B, Sariahmetoglu M, Donkor J, Bou Khalil M, Sundaram M, Yao Z, Reue K, Lehner R, Brindley DN. Glucocorticoids and cyclic AMP selectively increase hepatic lipin-1 expression, and insulin acts antagonistically. J Lipid Res. 2008;49:1056–1067. doi: 10.1194/jlr.M800013-JLR200. [DOI] [PMC free article] [PubMed] [Google Scholar]
- 45.Law LK, Tang NL, Hui J, Ho CS, Ruiter J, Fok TF, Wanders RJ, Lam CW. A novel functional assay for simultaneous determination of total fatty acid beta-oxidation flux and acylcarnitine profiling in human skin fibroblasts using (2)H(31)-palmitate by isotope ratio mass spectrometry and electrospray tandem mass spectrometry. Clin Chim Acta. 2007;382:25–30. doi: 10.1016/j.cca.2007.03.011. [DOI] [PubMed] [Google Scholar]
- 46.Zhao LF, Iwasaki Y, Zhe W, Nishiyama M, Taguchi T, Tsugita M, Kambayashi M, Hashimoto K, Terada Y. Hormonal regulation of acetyl-CoA carboxylase isoenzyme gene transcription. Endocr J. 2010;57:317–324. doi: 10.1507/endocrj.k09e-298. [DOI] [PubMed] [Google Scholar]
- 47.Bergounioux J, Brassier A, Rambaud C, Bustarret O, Michot C, Hubert L, Arnoux JB, Laquerriere A, Bekri S, Galene-Gromez S, Bonnet D, Hubert P, de Lonlay P. Fatal rhabdomyolysis in 2 children with LPIN1 mutations. J Pediatr. 2012;160:1052–1054. doi: 10.1016/j.jpeds.2012.02.033. [DOI] [PubMed] [Google Scholar]
- 48.Sharma S, Adrogue JV, Golfman L, Uray I, Lemm J, Youker K, Noon GP, Frazier OH, Taegtmeyer H. Intramyocardial lipid accumulation in the failing human heart resembles the lipotoxic rat heart. FASEB J. 2004;18:1692–1700. doi: 10.1096/fj.04-2263com. [DOI] [PubMed] [Google Scholar]
- 49.Santos-Rosa H, Leung J, Grimsey N, Peak-Chew S, Siniossoglou S. The yeast lipin Smp2 couples phospholipid biosynthesis to nuclear membrane growth. EMBO J. 2005;24:1931–1941. doi: 10.1038/sj.emboj.7600672. [DOI] [PMC free article] [PubMed] [Google Scholar]
- 50.Golden A, Liu J, Cohen-Fix O. Inactivation of the C. elegans lipin homolog leads to ER disorganization and to defects in the breakdown and reassembly of the nuclear envelope. J Cell Sci. 2009;122:1970–1978. doi: 10.1242/jcs.044743. [DOI] [PMC free article] [PubMed] [Google Scholar]
- 51.Lu B, Lu Y, Moser AH, Shigenaga JK, Grunfeld C, Feingold KR. LPS and proinflammatory cytokines decrease lipin-1 in mouse adipose tissue and 3T3-L1 adipocytes. Am J Physiol Endocrinol Metab. 2008;295:E1502–E1509. doi: 10.1152/ajpendo.90323.2008. [DOI] [PMC free article] [PubMed] [Google Scholar]
- 52.Feingold KR, Moser A, Patzek SM, Shigenaga JK, Grunfeld C. Infection decreases fatty acid oxidation and nuclear hormone receptors in the diaphragm. J Lipid Res. 2009;50:2055–2063. doi: 10.1194/jlr.M800655-JLR200. [DOI] [PMC free article] [PubMed] [Google Scholar]
- 53.Spate U, Schulze PC. Proinflammatory cytokines and skeletal muscle. Curr Opin Clin Nutr Metab Care. 2004;7:265–269. doi: 10.1097/00075197-200405000-00005. [DOI] [PubMed] [Google Scholar]
- 54.Ostrowski K, Rohde T, Asp S, Schjerling P, Pedersen BK. Chemokines are elevated in plasma after strenuous exercise in humans. Eur J Appl Physiol. 2001;84:244–245. doi: 10.1007/s004210170012. [DOI] [PubMed] [Google Scholar]
- 55.Chen X, Xun K, Chen L, Wang Y. TNF-alpha, a potent lipid metabolism regulator. Cell Biochem Funct. 2009;27:407–416. doi: 10.1002/cbf.1596. [DOI] [PubMed] [Google Scholar]
- 56.Kanda H, Tateya S, Tamori Y, Kotani K, Hiasa K, Kitazawa R, Kitazawa S, Miyachi H, Maeda S, Egashira K, Kasuga M. MCP-1 contributes to macrophage infiltration into adipose tissue, insulin resistance, and hepatic steatosis in obesity. J Clin Invest. 2006;116:1494–1505. doi: 10.1172/JCI26498. [DOI] [PMC free article] [PubMed] [Google Scholar]
- 57.Pacheco P, Vieira-de-Abreu A, Gomes RN, Barbosa-Lima G, Wermelinger LB, Maya-Monteiro CM, Silva AR, Bozza MT, Castro-Faria-Neto HC, Bandeira-Melo C, Bozza PT. Monocyte chemoattractant protein-1/CC chemokine ligand 2 controls microtubule-driven biogenesis and leukotriene B4-synthesizing function of macrophage lipid bodies elicited by innate immune response. J Immunol. 2007;179:8500–8508. doi: 10.4049/jimmunol.179.12.8500. [DOI] [PubMed] [Google Scholar]
- 58.Kobayashi MA, Watada H, Kawamori R, Maeda S. Overexpression of acetyl-coenzyme A carboxylase beta increases proinflammatory cytokines in cultured human renal proximal tubular epithelial cells. Clin Exp Nephrol. 2010;14:315–324. doi: 10.1007/s10157-010-0296-x. [DOI] [PubMed] [Google Scholar]
- 59.Ferguson PJ, Chen S, Tayeh MK, Ochoa L, Leal SM, Pelet A, Munnich A, Lyonnet S, Majeed HA, El-Shanti H. Homozygous mutations in LPIN2 are responsible for the syndrome of chronic recurrent multifocal osteomyelitis and congenital dyserythropoietic anaemia (Majeed syndrome) J Med Genet. 2005;42:551–557. doi: 10.1136/jmg.2005.030759. [DOI] [PMC free article] [PubMed] [Google Scholar]
- 60.Valdearcos M, Esquinas E, Meana C, Pena L, Gilde-Gomez L, Balsinde J, Balboa MA. Lipin-2 reduces proinflammatory signaling induced by saturated fatty acids in macrophages. J Biol Chem. 2012;287:10894–10904. doi: 10.1074/jbc.M112.342915. [DOI] [PMC free article] [PubMed] [Google Scholar]
Associated Data
This section collects any data citations, data availability statements, or supplementary materials included in this article.