Abstract
Objectives
The aim of this study was to test the hypothesis that cross-polarization optical coherence tomography (CP-OCT) can be used to longitudinally monitor demineralization peripheral to orthodontic brackets in an extended clinical study.
Methods
A high-speed CP-OCT system was used to acquire 3D volumetric images of the area at the base of orthodontic brackets over a period of 12-months after placement. The reflectivity was measured at 3-month intervals for 12-months to determine if there was increased demineralization. Two teeth were monitored on twenty test subjects and the brackets were bonded using two types of adhesives This was a randomized controlled clinical study with a split mouth design such that each subject served as his or her own control. On one side, the control premolar was bonded with a bonding agent (Adper Scotchbond from 3M ESPE, St. Paul, MN) and composite (Transbond XT from 3M Unitek, Monrovia, CA) that lacked fluoride. On the other side, the experimental premolar was bonded with a fluoride releasing glass ionomer cement (GC Fuji Ortho LC from GC America, Alsip, IL).
Results
There was a small but significant increase in the calculated lesion depth and integrated reflectivity over that depth (Δ R) for both adhesive types (p<0.0001) indicating increasing demineralization with time. There was no significant difference in the lesion depth (p=0.22) and Δ R (p=0.91) between the groups with the fluoride releasing glass ionomer cement and the conventional composite.
Conclusions
CP-OCT was able to measure a significant increase in demineralization (P<0.0001) at the base of orthodontic brackets over a period of 12-months.
Keywords: optical coherence tomography, cross-polarization, dental caries, fluoride
1. Introduction
Several in vitro studies have demonstrated the potential of optical coherence tomography and polarization sensitive OCT (PS-OCT) for nondestructive measurement of the severity of early demineralization on enamel surfaces. (1–6) (7) Clinical validation of OCT for the early detection of surface and subsurface demineralization will enable in vivo monitoring of early caries formation and its subsequent prevention by providing a means for the nondestructive testing of anti-caries agents. The specific hypothesis that was tested was whether CP-OCT can be used to longitudinally monitor demineralization in the high risk areas peripheral to orthodontic brackets over a period of 12 months. The null hypothesis was that CP-OCT would not measure any significant increase in the integrated reflectivity in these areas after 12 months.
During orthodontic treatment, patients are often at an elevated risk of developing areas of enamel decalcification, and subsequent dental caries. (8)–(9) Demineralization typically occurs adjacent to the base of the bracket where it is difficult to prevent plaque accumulation. Some studies have shown that fluoride-releasing glass ionomer cements are successful in releasing the incorporated fluoride and inhibiting demineralization around orthodontic brackets. (10–15) Therefore, we chose to also measure demineralization around two types of adhesives, a fluoride releasing glass ionomer cement and a conventional composite to determine if CP-OCT can measure differences in the degree of demineralization.
PS-OCT or CP-OCT has significant advantages over conventional OCT for quantitative measurements of lesion severity. In PS-OCT, images of both orthogonal polarization states are acquired, i.e., the cross-polarization and the co-polarization images. It is only necessary to acquire the cross polarization image since only the CP-OCT image is used for analysis. Areas of demineralization can rapidly depolarize/scramble the polarization of the incident polarized light and provide improved contrast of carious lesions. In addition, the confounding influence of the strong specular reflection from the tooth surface is reduced in CP-OCT images. It has been shown that the integrated reflectivity with lesion depth (ΔR) in the CP-OCT image correlates with the mineral loss with depth (ΔZ) calculated from transverse microradiography (TMR) for enamel and dentin. (3), (16) Therefore, Δ R measured using CP-OCT can be used to represent the lesion severity. Using this approach CP-OCT can be used to monitor demineralization (1, 2, 6, 17–21) and remineralization (19, 22, 23).
The first clinical study using PS-OCT to monitor demineralization was completed in 2010. (16) Orthodontic bands with a buccal window were cemented on premolars and small incisions were produced on occlusal surfaces to serve as sites for plaque retention for enhanced demineralization. Bands were removed after 30 days and PS-OCT scans were acquired in vivo of occlusal and buccal areas and Δ R was calculated from the CP-OCT images of the lesion areas. Teeth were extracted, serially sectioned and analyzed using PLM and TMR for comparison with the CP-OCT images.
PS-OCT was able to non-destructively measure significant increases in demineralization on both the buccal and occlusal surfaces. Difficulties in matching PS-OCT b-scans to the histological thin sections suggested that to use PS-OCT most effectively in future studies, entire tomographic images (3D images) encompassing the entire lesion area should be acquired.
In the present study, we employed a high-speed swept-source (SS) based CP-OCT scanning system that is capable of acquiring 6 × 6 × 7 mm images encompassing an entire orthodontic bracket and the area beneath it. This system uses a swept laser source that is capable of operating at very high scan rates without a marked loss in the signal to noise ratio. Previous studies have shown that high quality OCT images of caries lesions can be acquired using SS-OCT systems. (24, 25) In addition, in previous studies the individual OCT b-scans were manually analyzed. With the three orders of magnitude increase in the amount of data acquired in this study, it was necessary to develop automated methods for identifying and analyzing areas of demineralization.
Our approach to monitoring demineralization in this study is fundamentally different to previous studies. We employed automated algorithms to produce 2D projection images of the lesion depth and Δ R from the acquired full 3D CP-OCT images. Instead of acquiring individual OCT b-scans of areas with suspected lesions and calculating the integrated reflectivity in specific a-scans, we selected an area encompassing thousands of a-scans which was monitored and automatically analyzed at each time point. This is a far more powerful and objective approach and we demonstrate in this study that it can successfully detect very subtle changes in demineralization.
2. Material and methods
2.1. Study design
Twenty test subjects undergoing orthodontic treatment were recruited from the UCSF Orthodontic Clinic according to a protocol approved by the Committee on Human Research, IRB#10-00589. Ten test subjects were male, and ten were female. The age range was 13 to 43 years (mean 19 years). This was a randomized controlled clinical study with a split mouth design such that each subject served as his or her own control. On one side, the control premolar was bonded with a bonding agent (Adper Scotchbond from 3M ESPE, St. Paul, MN) and composite (Transbond XT from 3M Unitek, Monrovia, CA) that lacked fluoride. On the other side, the experimental premolar was bonded with a fluoride releasing glass ionomer cement (GC Fuji Ortho LC from GC America, Alsip, IL).
For the composite cement group, the teeth were pumiced, etched with phosphoric acid for 15 seconds, rinsed for 10 seconds, gently dried, and the Adper Scotchbond bonding resin was applied in 2–3 coats. After gentle air drying, the bonding resin was light cured for 10 seconds. The Transbond XT paste was applied to the bracket, the bracket was positioned, and the cement was light cured.
For the glass ionomer cement , teeth were pumiced, GC Ortho Conditioner (20% polyacrylic acid) was applied for 20 seconds, rinsed off and gently dried. A fresh mix of the glass ionomer cement was applied, bracket was positioned and cement was light cured. Care was taken with both cements to avoid any excess around the bracket. Bonding was carried out by orthodontic residents that were not involved in either imaging or analysis. Therefore, the CP-OCT operator, test subject and the data analyst were blinded to the identity of the bonding agent.
Upper or lower pairs of premolars were randomly selected (11- lower and 9-upper) and bonding agents were assigned randomly to left or right (glass ionomer – 8-left and 12-right). All participants received standard oral hygiene instruction and were advised to use a fluoride dentifrice. Teeth were scanned by a single operator using the CP-OCT system every three months for a period of one year.
Photographs of the teeth were acquired at the first and last time points, 0 & 12 months. The photographs taken at 0 and 12 months were evaluated by two clinicians for visual signs of demineralization. The photographs were rated (+) or (−) for white spot presence, G for covered by gingiva, S for stain, or P for poor photo quality or for other reasons such as excessive reflection or saliva.
2.2. Inclusion criteria
Test subjects must be between 13–60 in age.
Must be able to give informed consent in English.
Must be willing to comply with all study protocols and procedures.
Must reside in San Francisco or nearby locales with community fluoridation, to eliminate water fluoridation as a confounding variable.
2.3. Exclusion criteria
Cannot be suffering from systemic diseases.
Cannot have a condition that affects oral health or oral flora (i.e., HIV, diabetes, heart conditions that require antibiotic prophylaxis)
Cannot be taking medications that may affect oral flora or salivary flow (i.e., antibiotics, drugs that cause xerostomia)
Cannot have had an in-office fluoride treatment within the past 3 months.
2.4. CP-OCT imaging system
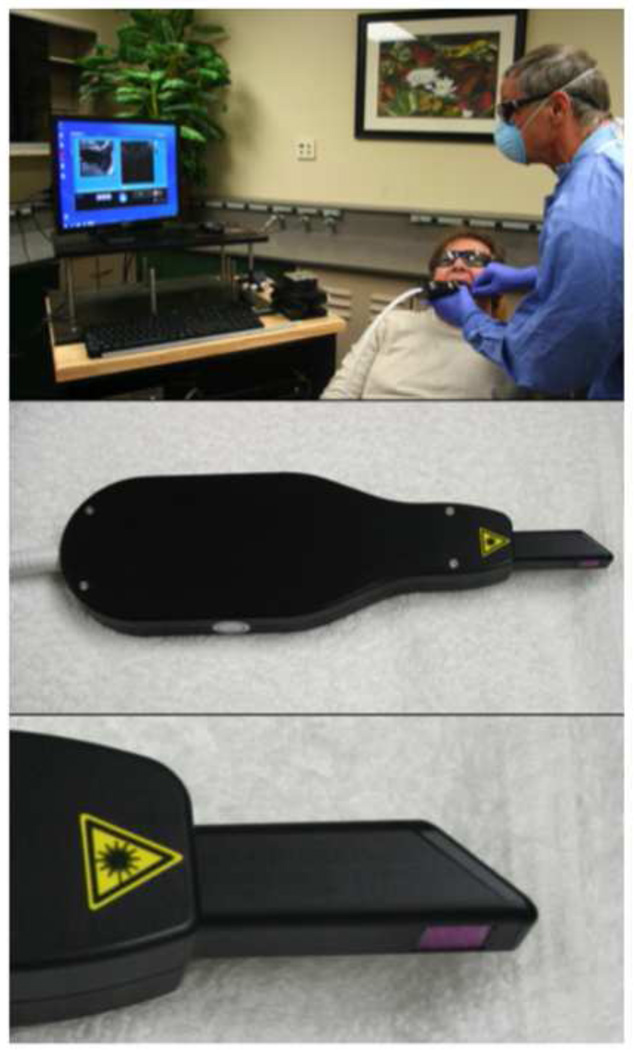
The cross-polarization OCT system used for this study was purchased from Santec (Komaki, Aichi, Japan). This system acquires only the cross polarization image (CP-OCT), not both the cross and co-polarization images (PS-OCT). The Model IVS-3000-CP utilizes a swept laser source; Santec Model HSL-200-30 operating with a 30 kHz a-scan sweep rate. The Mac-Zehnder interferometer is integrated into the handpiece which also contains the microelectromechancial (MEMS) scanning mirror and the imaging optics. It is capable of acquiring complete tomographic images of a volume of 6 × 6 × 7 mm in approximately three seconds. The imaging system along with close-up images of the scanning hand-piece are shown in Fig. 1. The body of the handpiece is 7 × 18 cm with an imaging tip that is 4 cm long and 1.5 cm across. This system operates at a wavelength of 1321-nm with a bandwidth of 111-nm with a measured resolution in air of 11.4 μm (3 dB). The lateral resolution is 80-μm (1/e2) with a transverse imaging window of 6 mm×6 mm and a measured imaging depth of 7-mm in air. The polarization extinction ratio was measured to be 32 dB.
Fig. 1.
Photographs of a volunteer being scanned with the CP-OCT system along with close up views of the scanning handpiece and the 6×6 mm scanning window at the end of the scanner.
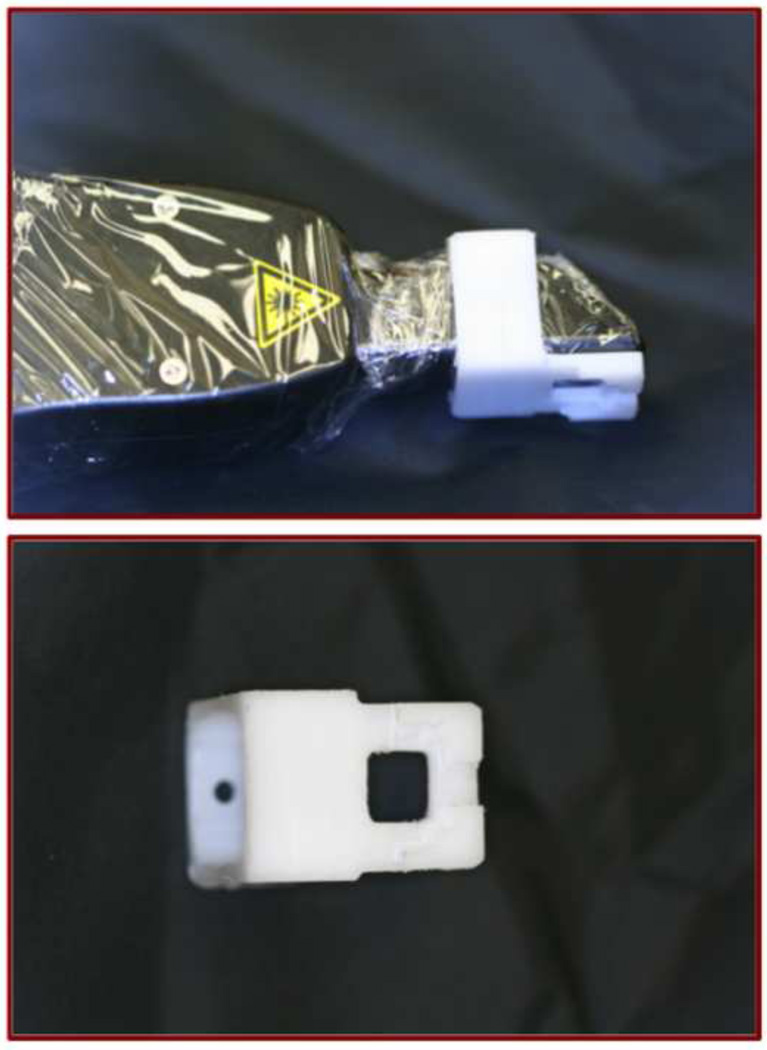
Scans are acquired by placing the scanner in contact with the tooth and bracket. A jig for the CP-OCT probe was milled from Delrin plastic (Dupont) in order to stabilize the probe on the orthodontic bracket and aid in positioning (Fig. 2). The scanner was covered with plastic wrap for infection control. CP-OCT scans were obtained approximately every 3 months until the 12-month end-point.
Fig. 2.
Images of the autoclavable Delrin appliance placed on the end of the plastic covered scanner are shown along with a close up view of the appliance.
2.5. Analysis of CP-OCT images
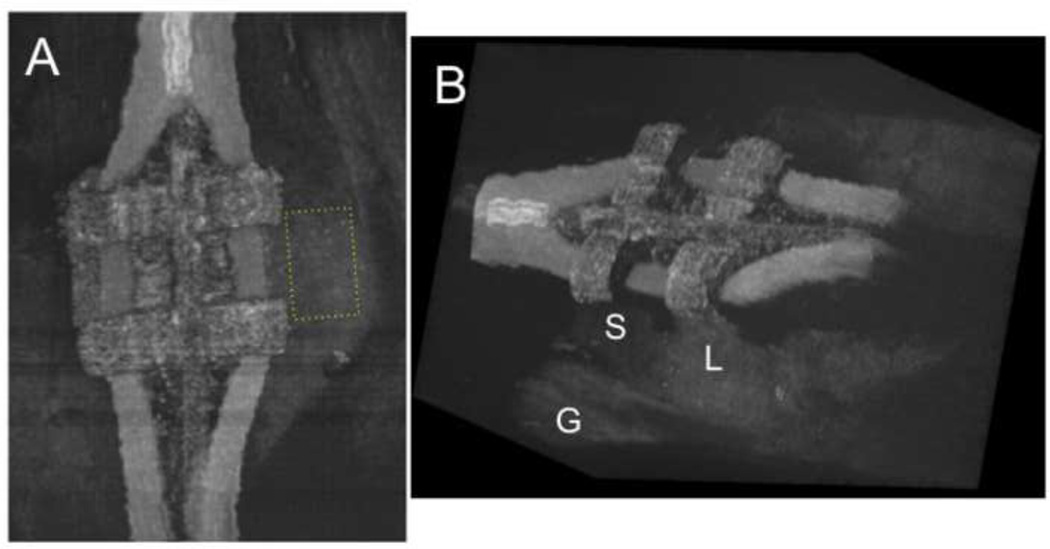
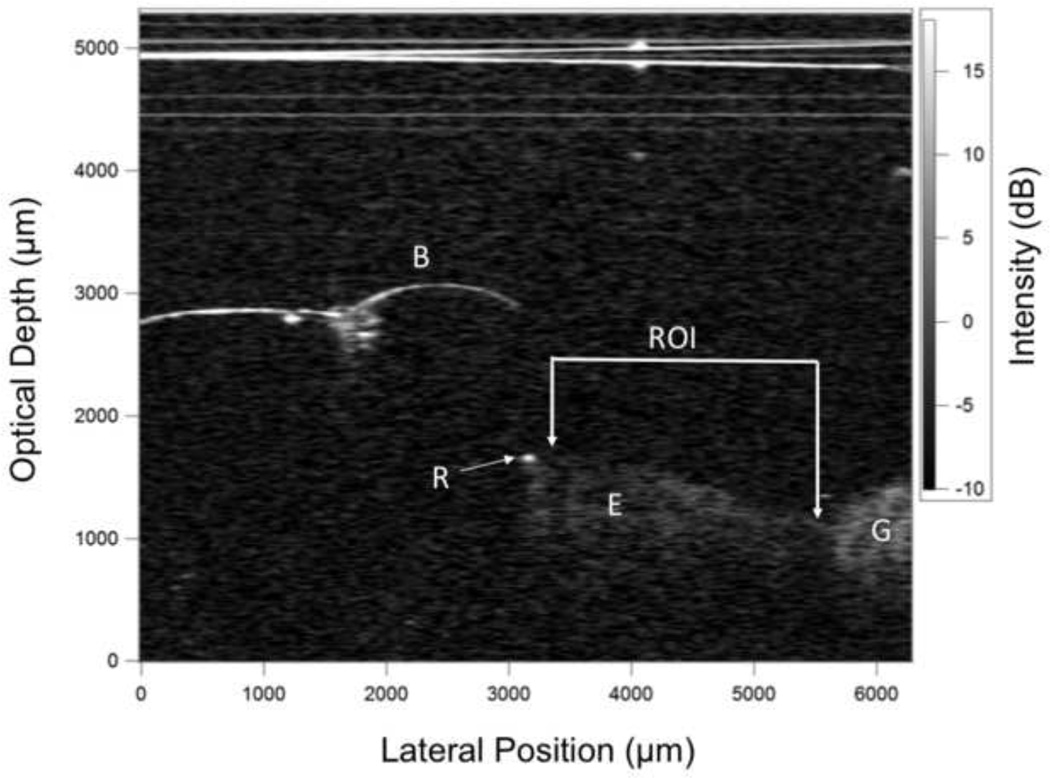
CP-OCT scans were analyzed using in house software written using LabView (National Instruments, Austin, TX). A rectangular shaped region of interest (ROI) centered at the bracket base (see Fig. 5a) was selected for each tooth analyzed based on the available area in the final scan. We could not standardize the ROI dimensions because there was variation in the amount of enamel exposed above the gingiva to the bracket for different patients. However, once the ROI dimension was established for a patient, its size and position were held constant for each time point analysis. The mean area of the ROI was 3.5 ± 1.7 mm2 (mean of 4354 a-scans) with a minimum of 1.2 and a maximum of 6.6 mm2. Figure 3 shows an in vivo CP-OCT b-scan after 12 months showing the position of the bracket, the exposed enamel, resin and the ROI.
Fig. 5.
Three dimensional rendering of a full CP-OCT scan taken of a bracket after completion of the study (12 months). The left view in (A) shows the ROI (yellow box) located between the bracket and the gingiva which was analyzed for mineral loss. The rectangular box was 73×45 pixels for this tooth. Another rendering viewed at an angle (B) shows the 3D structure of the bracket with elastic bands. The left side of the area appears sound (S) while there appears to be demineralization on the right side (L) because it appears whiter. The position of the margin of the gingival (G) is also visible.
Fig. 3.
A b-scan from one of the samples showing the bracket (B), the exposed enamel (E), the gingiva (G) and some resin at the edge of the bracket (R). The horizontal lines at the top of the image were caused by reflections of the scanner window and the plastic wrap.
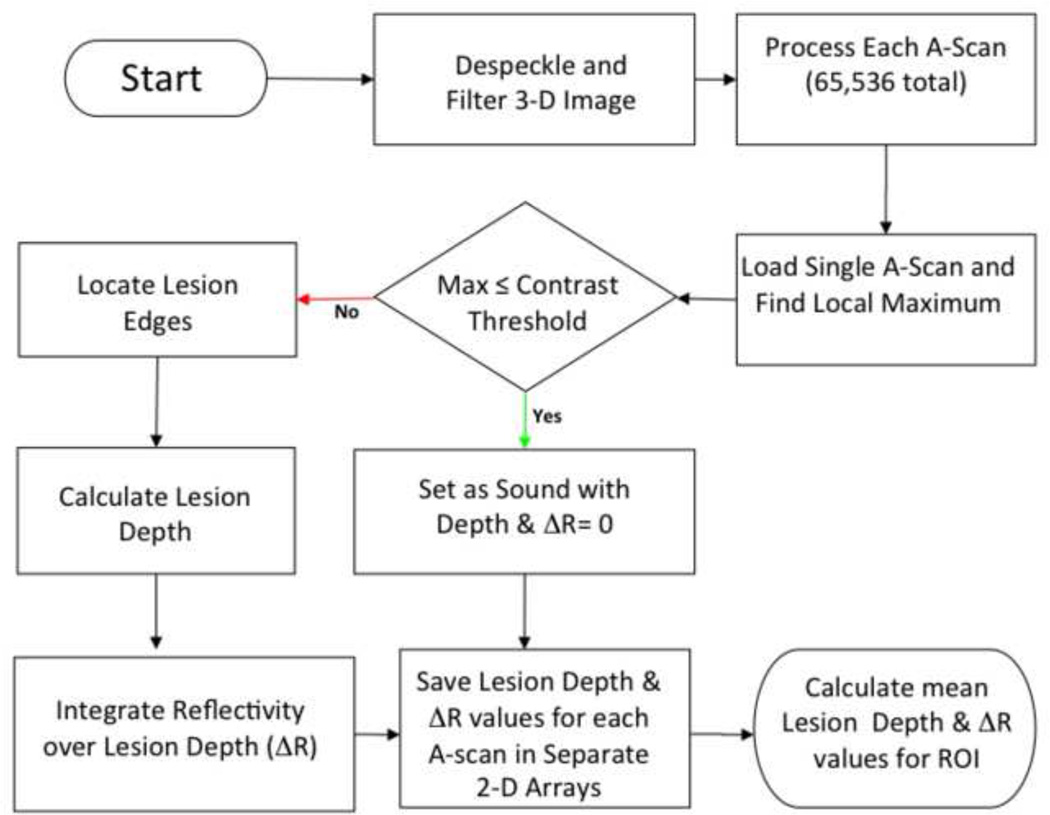
The steps involved in converting the 3D CP-OCT images into the mean values of the lesion depth and integrated reflectivity over the lesion depth (Δ R) in the ROI are shown graphically in the flowchart of Fig. 4 and described in greater detail in ref. 28. For speckle noise reduction, signals not exceeding four standard deviations from the mean background noise floor were reduced to the mean background value and a Gaussian blur smoothing algorithm was applied using a 5 × 5 pixel convolution kernel. (26, 27) In the edge-detection approach, the enamel edge and the lower lesion boundary were determined by applying an edge locator. (26, 27) The program first locates the maximum of each a-scan, and differentiates the a-scan maximum as either demineralized or sound using the signal-to-noise ratio as a threshold. The depth of the lesion was calculated by locating the upper and lower lesion boundaries, by identifying the first pixels that fall under the threshold of e−2 of the maximum value in each a-scan. The distance per pixel conversion factor was obtained experimentally by system calibration. Each a-scan of the CP-OCT images was reduced to single values representing the lesion depth and ΔR in units of (dB × μm) by integrating over the calculated lesion depth. The “lesion depth” represents the number of pixels above an intensity threshold, it’s principal value is to determine how deep to integrate to calculate Δ R. (26, 27) Even though the intensity of the specular reflection from the surface is reduced by 32 dB (extinction ratio) in the cross polarization image, it is not completely eliminated. The reflection at the surface is typically detected and the calculated lesion depth is relatively close to the axial resolution of the system in air. Therefore sound areas and the surface of the metal bracket may have a calculated lesion depth due to the surface reflection but the depth should be shallow on the order of the resolution of the OCT system.
Fig. 4.
Flowchart showing the different steps involved in converting the 3D CP-OCT image to the 2D projection images of the lesion depth and Δ R and subsequently the mean lesion depth and Δ R for the specified ROI at each time point.
Two dimensional projections of the lesion depth and Δ R are well suited for visualization of the large volume of OCT data in volumetric OCT scans. (28) The mean lesion depth and Δ R were calculated in the ROI for each patient at every available time point and for both adhesives.
2.6. Statistics
Based on the study of Gorton and Featherstone(10–15) the standard deviation (s.d.) of the Δ Z values measured with cross-sectional microhardness was 300 (Vol%. × μm), with a 2-sided significance level of 0.05, a study with 20 subjects in each group would have a 90% power to detect a difference in mean Δ Z value of 291. The difference in the relative mineral loss (Δ Z value) between the control and glass ionomer groups after 4-weeks was 645, more than double the effect size (difference/s.d.). Our previous in vivo study showed that Δ R (dBxμm) manifests a smaller s.d. than TMR. In fact we were able to measure a significant difference in mean Δ R values between the buccal surfaces treated with fluoride varnish and those without, but not for Δ Z. Therefore, a sample size of 20 should be sufficient to observe a difference in Δ R between the control and intervention groups for more extended time periods.
A two-way repeated measures analysis of variance (ANOVA) with Tukey’s multiple comparison test was used to determine differences in lesion depth (μm) and Δ R between the adhesives (column factor) and time (row factor) using Prism software (GraphPad, San Diego, CA) for the 17 test subjects that completed all five imaging sessions. P values of less than 0.05 were considered significant.
3. Results
Figure 5 shows 3D renderings of one CP-OCT image acquired after 12-months (end of the study). These renderings were made by using the open source DICOM viewer OsiriX after converting the CP-OCT files to DICOM files. Each 6 mm × 6 mm × 7 mm volumetric scan captures the entire bracket and the area cervical to the bracket and it is comprised of 65536 a-scans for ~ 67 million pixels. The 3D structure of the bracket and the elastic bands attached to the bracket are clearly visible. Two renderings are shown. The first, the top view, indicates the area of demineralization which was monitored at each time period. The second view at an angle shows the area at the base of the bracket. The u-shaped line of the gingiva (G) is visible in all the scans. In this image a whiter area appears in the enamel on the right side of the bracket (L) just above the gingival margin indicative of demineralization, while the left side appears to have less demineralization (S).
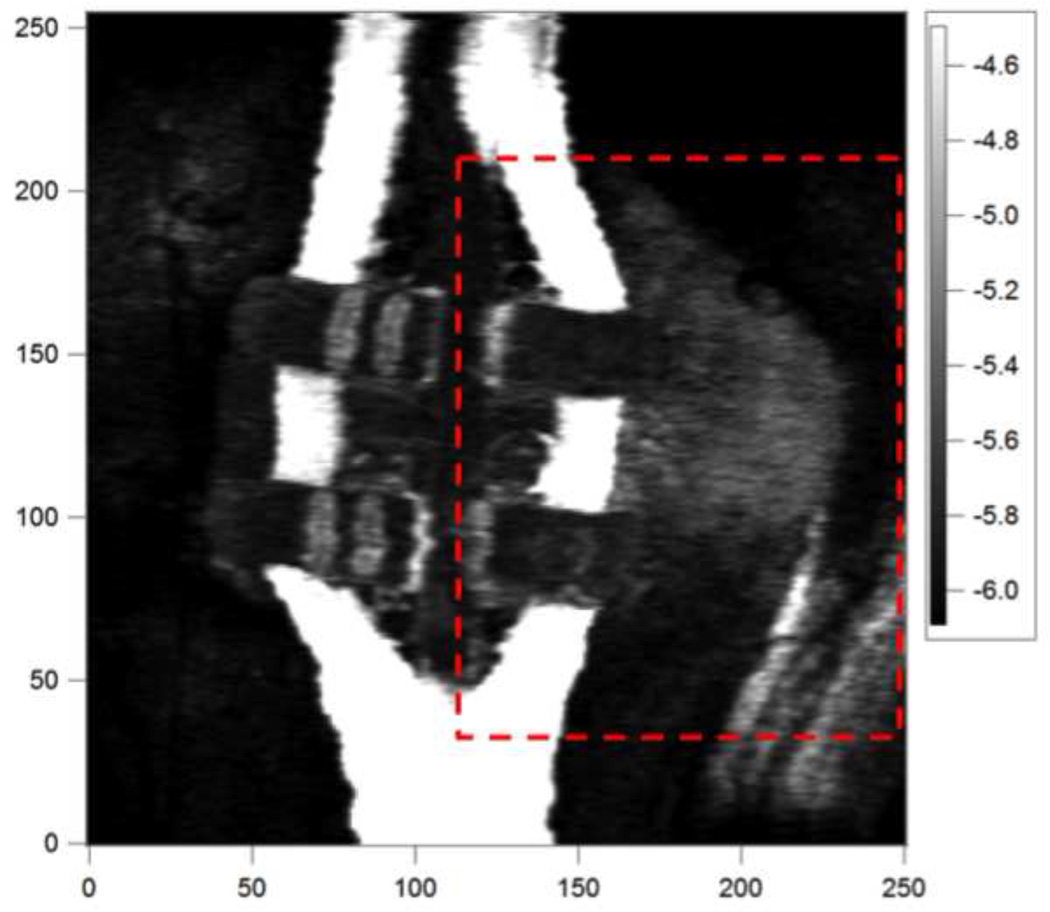
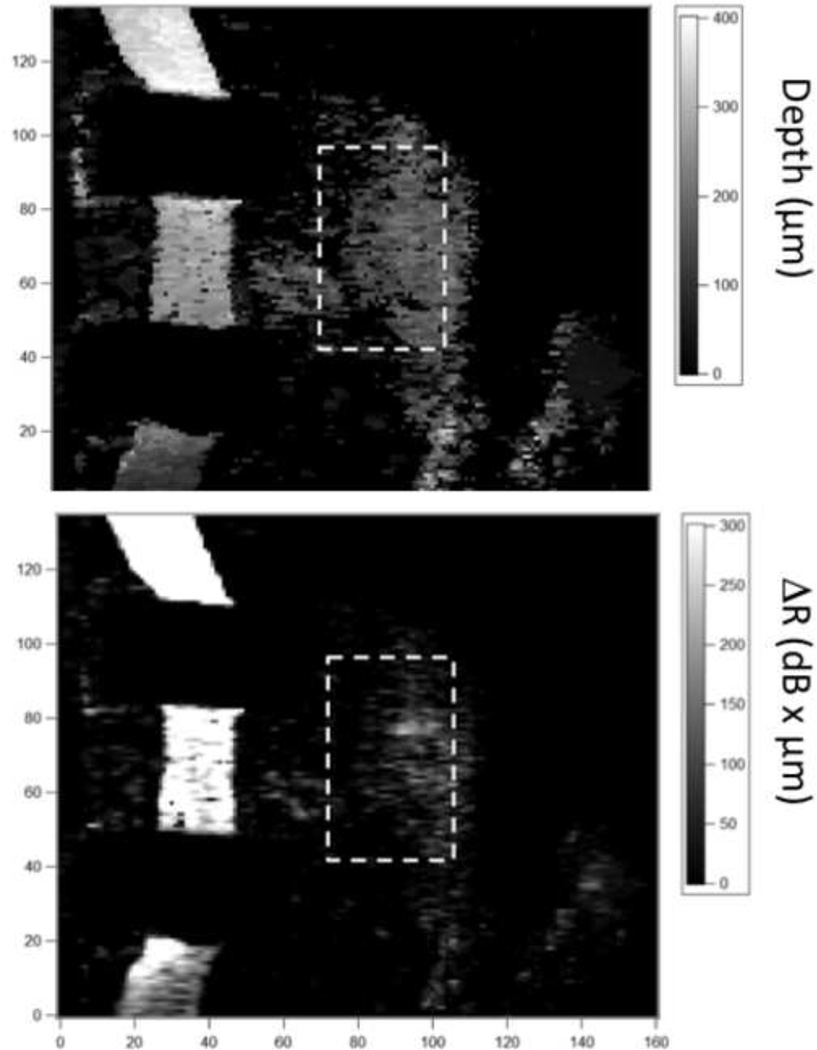
The image in Figure 6 (same data as Fig. 5) was generated by taking the mean values of all the pixels in each a-scan (1024 pixels) to generate a 2D image of the entire 6×6 mm CP-OCT scan, this reduced 2D plot is 256 × 255 pixels. The mean reflectivity in dB is shown and whiter areas have higher reflectivity. The area of the CP-OCT image shown in the red box was converted to images of lesion depth (μm) and Δ R (dB × μm). These two-dimensional projection images are shown in Fig. 7 and they are useful for visualization of the lesion severity (28).
Fig. 6.
This is an image of the mean reflectivity (dB) for each pixel in the CP-OCT image for the sample image shown in Fig. 5. The color bar represents the mean reflectivity in (dB) and whiter areas represent higher reflectivity. The XY axes represent pixels and the spacing along the x-axis is 32-μm per pixel and in the y-axis it is 25 μm per pixel. Images of the lesion depth and Δ R were calculated for the area of the marked box and they are shown in Fig. 7.
Fig. 7.
Images of the lesion depth (μm) (A) and Δ R (dB × μm) (B) are shown for the area in the box of Fig. 6. The ROI that was monitored over time is shown by the marked boxes in each image.
Out of the 20 test subjects recruited for the study, 17 test subjects completed all of the six imaging sessions during the 12 month period. One test subject missed their 9-month imaging session, another test subject withdrew from the study after 3-months and a third test subject withdrew after the initial imaging session due to the inability to get the brackets to adhere suitably with the glass ionomer cement.
The photographs taken at 0 and 12 months were evaluated by two clinicians for visual signs of demineralization. No quantifiable data was obtained by this analysis, as only one tooth changed from (™) to (+) between 0 and 12 months per one of the clinicians but not the other. In the majority of the cases the lesions were either not observed, or not possible to observe due to gingival coverage or insufficient photo quality.
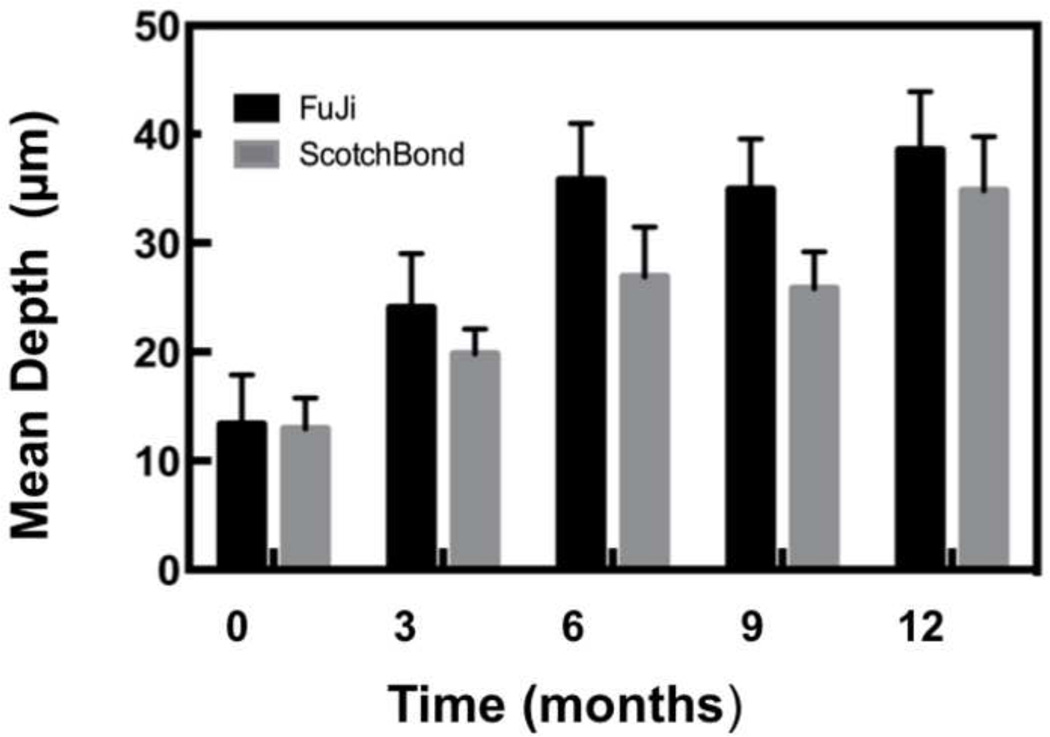
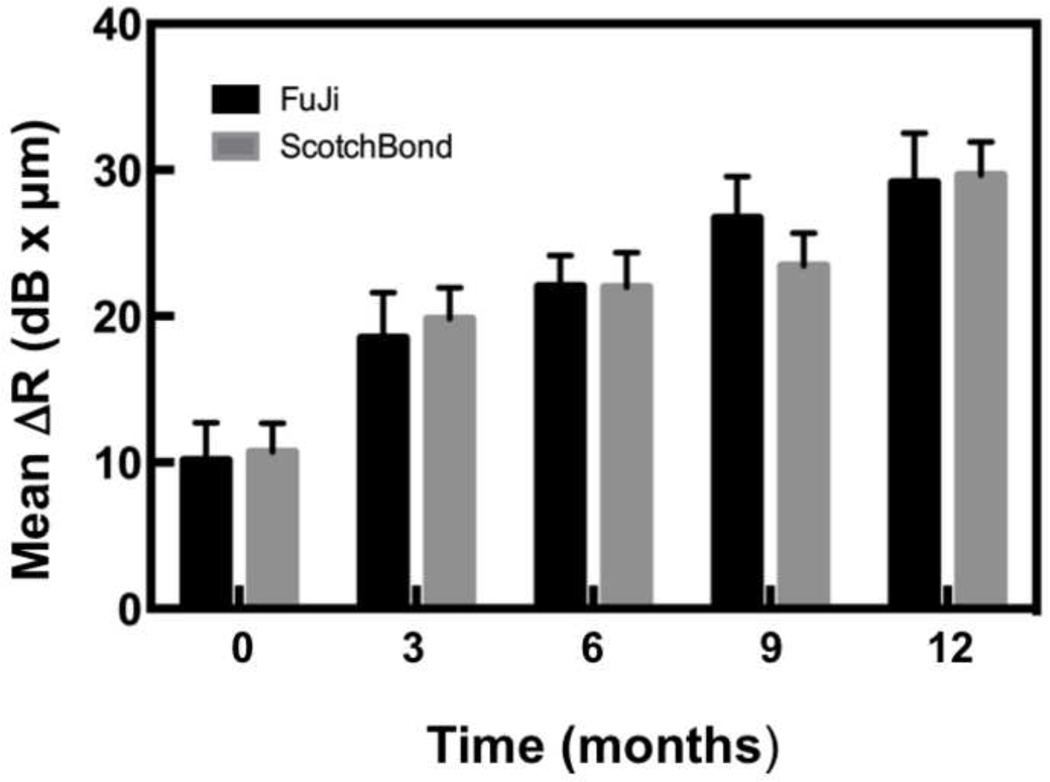
The lesion depth and Δ R were calculated in the ROI centered at the bracket base for each CP-OCT image using our program as described in the materials and methods. The mean lesion depth and Δ R are plotted ± the standard error of the mean (s.e.m.) in Figs. 8 & 9 and tabulated in Table 1 (mean ± standard deviation (s.d.)) for the composite and the glass ionomer groups. Statistical analysis using two-way repeated measures ANOVA on the 17 test subjects that completed the study indicated that there was a significant increase (P < 0.0001) in both the lesion depth and Δ R, while there was no significant difference in either lesion depth (p=0.22) and Δ R (p=0.91) between the composite and the glass ionomer groups.
Fig. 8.
Bar graph of the mean lesion depth (μm) ± (s.e.m.) calculated over the region of interest at the base of the bracket for the sample groups.
Fig. 9.
Bar graph of the mean Δ R (dB × μm) ± (s.e.m.) calculated over the region of interest at the base of the bracket for the sample groups.
Table I.
The mean (s.d.) lesion depth and mean (s.d.) integrated reflectivity over that depth (Δ R) for both adhesives at each time point. Groups with the same letter are statistically similar (P > 0.05) to other groups within the same row.
| Months | |||||
|---|---|---|---|---|---|
| 0 | 3 | 6 | 9 | 12 | |
| Depth (µm) | |||||
| Fuji | 13.3(20.3) a | 24.1(21.5) a,b | 35.8(21.9) b | 34.9(19.1) b | 38.6(22.7) b |
| Scotchbond | 13.0(12.6) a | 19.8(9.9) a,b | 26.9(19.5) a,b | 25.8(13.9) a,b | 34.8(21.9) b |
| Δ R (dB × µm) | |||||
| Fuji | 10.2(10.5) | 18.5(12.8) a | 22.0(8.7) a,b | 26.7(11.6) b,c | 29.1(13.9) c |
| Scotchbond | 10.7(8.1) | 19.8(8.7) a | 22.0(9.7) a,b | 23.4(9.3) a,b,c | 29.7(9.4) c |
4. Discussion
The aim of this study was to test the hypothesis that cross-polarization optical coherence tomography (CP-OCT) can be used to longitudinally monitor demineralization peripheral to orthodontic brackets in an extended clinical study. We found that for both groups, the amount of demineralization, as measured by lesion depth and Δ R, increased over time. This was consistent with our expectations, since orthodontic brackets create a hindrance to oral hygiene.
Our study also underscores the validity and ease of using CP-OCT to track demineralization over time. To our knowledge, this is the first extended in-vivo clinical study using CP-OCT to measure demineralization around orthodontic brackets. The images we obtained were consistent and of high-quality, making it attractive for use in further studies. It is important to point out that the values calculated for the mean lesion depth and mean integrated reflectivity in the region of interest represent a very small degree of demineralization and that CP-OCT was able to successfully monitor such small changes over time.
The approach used to assess the integrated reflectivity differed markedly from previous clinical studies. (16) In previous studies the areas of demineralization were specifically identified on the buccal and occlusal surfaces using transverse microradiography and then Δ R was calculated in those localized areas for comparison. In this study, we monitored large areas, namely a region of interest (ROI) and we were able to identify a significant increase in the lesion depth and Δ R over an extended period of time. This approach is far more powerful and has several advantages. Once the ROI is selected, the process is fully automated and there is no bias or subjective assessment of lesion presence or location and the method can pick up very subtle changes in reflectivity that take place over time.
Although we anticipated less demineralization around the brackets bonded with the fluoride releasing glass ionomer, there was no significant difference in lesion depth or Δ R between the two adhesives. There has been much speculation concerning the efficacy of glass ionomer cements over time including changes in the rate of fluoride release and their recharge capacity. (29) Since we monitored the demineralization at different time points this method should be capable of resolving differences that occur earlier. However, there did not appear to be significant differences between the two cements at any of the time points. Our results are not inconsistent with most previous studies. A recent systematic review of the published data regarding the performance of resin-modified glass-ionomer cements and resin-based composites that examined 389 articles could not establish an unequivocal caries-preventive outcome. (15, 30)
All participants received standard oral hygiene instruction and were advised to use a fluoride dentifrice. The daily use of a fluoride dentifrice and the subsequent uptake of fluoride by the enamel in both groups could be a factor in explaining the similar performance of the two groups. (31)
There were some challenges during our year-long clinical study. One significant problem was brackets debonding, whether intentionally done by the operator for resets, or unintentionally done by the patient. We anticipated this problem beforehand, and decided that the only practical recourse would be to note the date of the debond, and have the operator rebond the bracket with the selected bonding system. We noted that the debond rate for the glass ionomer side was higher than that of the conventional composite side, in keeping with previous reports on glass ionomer. (32) We had to discontinue one patient because of repeated bond failures with the glass ionomer.
Another challenge we faced was that occasionally, the brackets were bonded slightly subgingivally, thereby obscuring our ROI and making analysis difficult. This occurred at times because the majority of our subjects were adolescents and had premolars that were not fully erupted. Nevertheless, we still analyzed those images by reducing the size of the ROI for those patients.
White spot lesions have largely been monitored and studied through visual inspection or intraoral photography. Both these methods have significant disadvantages: visual inspection is subjective, while intraoral photography depends on the photograph quality, whether or not the image is polarized, and on ambient lighting conditions. (11, 33) The comparison of the OCT measurement to the visual inspection of photographs clearly demonstrates the vast superiority of the OCT measurement, as the visual evaluation produced no useful data. It is likely that a direct clinical evaluation would be more successful, especially if carried out after the removal of brackets and further eruption of the teeth. However, even in the best case, a visual inspection can only detect surface changes and cannot measure the depth of the lesion. Also, a visual inspection is affected by the amount of moisture on the surface and it is difficult to control and quantify the degree of drying of the surface during a clinical examination. CP-OCT is a significant improvement over these techniques, primarily because lesion depth can be directly measured and quantified. In addition, since images are objectively obtained, operator bias is eliminated. In our study, CP-OCT scans took less than 3 seconds and did not pose any significant discomfort for any patient. High quality, real time scans were obtained during that time period, allowing us to see if a re-scan was necessary.
5. Conclusions
CP-OCT was able to measure a significant increase in demineralization (P<0.0001) at the base of orthodontic brackets over a period of 12-months. Evaluation of photographs was not useful for this purpose. No significant difference was found in lesion depth (p=0.22) and Δ R (p=0.91) around brackets cemented with fluoride releasing glass ionomer versus brackets cemented with conventional composite cements. Clinical validation of CP-OCT for the early detection of surface and subsurface demineralization will enable in vivo monitoring of short term clinical trials of new anti-caries agents and will likely lead to increased efficiency of caries clinical trials and reduce their costs
Acknowledgements
The authors would also like to acknowledge the contributions of the residents of the UCSF Division of Orthodontics and the help of Robert Lee and Jacob Simon. This work was supported by National Institutes of Health NIDCR Grant# R01-DE17869.
Footnotes
Publisher's Disclaimer: This is a PDF file of an unedited manuscript that has been accepted for publication. As a service to our customers we are providing this early version of the manuscript. The manuscript will undergo copyediting, typesetting, and review of the resulting proof before it is published in its final citable form. Please note that during the production process errors may be discovered which could affect the content, and all legal disclaimers that apply to the journal pertain.
Conflict of interest
The authors declare no conflicts of interest with respect to the authorship and/or publication of this article.
REFERENCES
- 1.Chong SL, Darling CL, Fried D. Nondestructive measurement of the inhibition of demineralization on smooth surfaces using polarization-sensitive optical coherence tomography. Lasers in Surgery and Medicine. 2007;39(5):422–427. doi: 10.1002/lsm.20506. [DOI] [PubMed] [Google Scholar]
- 2.Fried D, Xie J, Shafi S, Featherstone JDB, Breunig T, Lee CQ. Early detection of dental caries and lesion progression with polarization sensitive optical coherence tomography. Journal of Biomedical Optics. 2002;7(4):618–627. doi: 10.1117/1.1509752. [DOI] [PubMed] [Google Scholar]
- 3.Jones RS, Darling CL, Featherstone JD, Fried D. Imaging artificial caries on the occlusal surfaces with polarization-sensitive optical coherence tomography. Caries Research. 2006;40(2):81–89. doi: 10.1159/000091052. [DOI] [PubMed] [Google Scholar]
- 4.Amaechi BT, Higham SM, Podoleanu Ag, Rodgers JA, Jackson DA. Use of Optical Coherence Tomography for Assessment of Dental caries. Journal of Oral Rehabilitation. 2001;28(12):1092–1093. doi: 10.1046/j.1365-2842.2001.00840.x. [DOI] [PubMed] [Google Scholar]
- 5.Amaechi BT, Podoleanu A, Higham SM, Jackson DA. Correlation of quantitative light-induced fluorescence and optical coherence tomography applied for detection and quantification of early dental caries. Journal of Biomedical Optics. 2003;8(4):642–647. doi: 10.1117/1.1606685. [DOI] [PubMed] [Google Scholar]
- 6.Ngaotheppitak P, Darling CL, Fried D. Polarization Optical Coherence Tomography for the Measuring the Severity of Caries Lesions. Lasers in Surgery and Medicine. 2005;37(1):78–88. doi: 10.1002/lsm.20169. [DOI] [PubMed] [Google Scholar]
- 7.Baumgartner A, Dicht S, Hitzenberger CK, Sattmann H, Robi B, Moritz A, et al. Polarization-sensitive optical optical coherence tomography of dental structures. Caries Research. 2000;34:59–69. doi: 10.1159/000016571. [DOI] [PubMed] [Google Scholar]
- 8.Bishara SE, Ostby AW. White Spot Lesions: Formation, Prevention, and Treatment. Seminars in Orthodontics. 2008;14(3):174–182. [Google Scholar]
- 9.Gorelick L, Geiger AM, Gwinnett AJ. Incidence of white spot formation after bonding and banding. American Journal of Orthodontics and Dentofacial Orthopedics. 1982;81(2):93–98. doi: 10.1016/0002-9416(82)90032-x. [DOI] [PubMed] [Google Scholar]
- 10.Gorton J, Featherstone JD. In vivo inhibition of demineralization around orthodontic brackets. A American Journal of Orthodontics and Dentofacial Orthopedics. 2003;123(1):10–14. doi: 10.1067/mod.2003.47. [DOI] [PubMed] [Google Scholar]
- 11.Marcusson A, Norevall LI, Persson M. White spot reduction when using glass ionomer cement for bonding in orthodontics: a longitudinal and comparative study. European Journal of Orthodontics. 1997;19(3):233–242. doi: 10.1093/ejo/19.3.233. [DOI] [PubMed] [Google Scholar]
- 12.Millett DT, Nunn JH, Welbury RR, Gordon PH. Decalcification in relation to brackets bonded with glass ionomer cement or a resin adhesive. The Angle Orthodontist. 1999;69(1):65–70. doi: 10.1043/0003-3219(1999)069<0065:DIRTBB>2.3.CO;2. [DOI] [PubMed] [Google Scholar]
- 13.Monteith VL, Millett DT, Creanor SL, Gilmour WH. Fluoride release from orthodontic bonding agents: a comparison of three in vitro models. Journal of Dentistry. 1999;27(1):53–61. doi: 10.1016/s0300-5712(98)00007-4. [DOI] [PubMed] [Google Scholar]
- 14.Rezk-Lega F, Ogaard B, Arends J. An in vivo study on the merits of two glass ionomers for the cementation of orthodontic bands. American Journal of Orthodontics and Dentofacial Orthopedics. 1991;99(2):162–167. doi: 10.1016/0889-5406(91)70119-H. [DOI] [PubMed] [Google Scholar]
- 15.Yengopal V, Mickenautsch S. Caries-preventive effect of resin-modified glass-ionomer cement (RM-GIC) versus composite resin: a quantitative systematic review. European Archives of Paediatric Dentistry. 2011;12(1):5–14. doi: 10.1007/BF03262772. [DOI] [PubMed] [Google Scholar]
- 16.Hsu DJ, Darling CL, Lachica MM, Fried D. Nondestructive assessment of the inhibition of enamel demineralization by CO2 laser treatment using polarization sensitive optical coherence tomography. Journal of Biomedical Optics. 2008;13(5):054027. doi: 10.1117/1.2976113. [DOI] [PubMed] [Google Scholar]
- 17.Fried D, Featherstone JDB, Darling CL, Jones RS, Ngaotheppitak P, Buehler CM. Dental Clinics of North America - Incipient and Hidden Caries. Vol. 49. Philadelphia: W. B Saunders Company; 2005. Early Caries Imaging and Monitoring with Near-IR Light. [Google Scholar]
- 18.Jones RS, Darling CL, Featherstone JD, Fried D. Remineralization of in vitro dental caries assessed with polarization-sensitive optical coherence tomography. Journal of Biomedical Optics. 2006;11(1):014016. doi: 10.1117/1.2161192. [DOI] [PubMed] [Google Scholar]
- 19.Hirasuna K, Fried D, Darling CL. Near-IR imaging of developmental defects in dental enamel. Journal of Biomedical Optics. 2008;13(4):044011, 1–7. doi: 10.1117/1.2956374. [DOI] [PubMed] [Google Scholar]
- 20.Jones RS, Staninec M, Fried D. Imaging artificial caries under composite sealants and restorations. Journal of Biomedical Optics. 2004;9(6):1297–1304. doi: 10.1117/1.1805562. [DOI] [PubMed] [Google Scholar]
- 21.Jones RS, Fried D. Remineralization of enamel caries can decrease optical reflectivity. Journal of Dental Research. 2006;85(9):804–808. doi: 10.1177/154405910608500905. [DOI] [PMC free article] [PubMed] [Google Scholar]
- 22.Manesh SK, Darling CL, Fried D. Polarization-sensitive optical coherence tomography for the nondestructive assessment of the remineralization of dentin. Journal of Biomedical Optics. 2009;14(4):044002. doi: 10.1117/1.3158995. [DOI] [PubMed] [Google Scholar]
- 23.Louie T, Lee C, Hsu D, Hirasuna K, Manesh S, Staninec M, et al. Clinical assessment of early tooth demineralization using polarization sensitive optical coherence tomography. Lasers in Surgery and Medicine. 2010;42(10):738–745. doi: 10.1002/lsm.21013. [DOI] [PMC free article] [PubMed] [Google Scholar]
- 24.Shimada Y, Sadr A, Burrow MF, Tagami J, Ozawa N, Sumi Y. Validation of swept-source optical coherence tomography (SS-OCT) for the diagnosis of occlusal caries. Journal of Dentistry. 2010;38(8):655–665. doi: 10.1016/j.jdent.2010.05.004. [DOI] [PubMed] [Google Scholar]
- 25.Natsume Y, Nakashima S, Sadr A, Shimada Y, Tagami J, Sumi Y. Estimation of lesion progress in artificial root caries by swept source optical coherence tomography in comparison to transverse microradiography. Journal of Biomedical Optics. 2011;16(7):071408. doi: 10.1117/1.3600448. [DOI] [PubMed] [Google Scholar]
- 26.Kang H, Jiao JJ, Lee C, Le MH, Darling CL, Fried D. Nondestructive Assessment of Early Tooth Demineralization Using Cross-Polarization Optical Coherence Tomography. IEEE Journal of Selected Topics in Quantum Electronics. 2010;16(4):870–876. doi: 10.1109/JSTQE.2009.2033610. [DOI] [PMC free article] [PubMed] [Google Scholar]
- 27.Le MH, Darling CL, Fried D. Automated analysis of lesion depth and integrated reflectivity in PS-OCT scans of tooth demineralization. Lasers in Surgery and Medicine. 2010;42(1):62–68. doi: 10.1002/lsm.20862. [DOI] [PMC free article] [PubMed] [Google Scholar]
- 28.Chan KH, Chan AC, Fried WA, Simon JC, Darling CL, Fried D. Use of 2D images of depth and integrated reflectivity to represent the severity of demineralization in cross-polarization optical coherence tomography. Journal of Biophotonics. 2013 doi: 10.1002/jbio.201300137. (In press) [DOI] [PMC free article] [PubMed] [Google Scholar]
- 29.Chin MY, Sandham A, Rumachik EN, Ruben JL, Huysmans MC. Fluoride release and cariostatic potential of orthodontic adhesives with and without daily fluoride rinsing. American Journal of Orthodontics and Dentofacial Orthopedics. 2009;136(4):547–553. doi: 10.1016/j.ajodo.2007.10.053. [DOI] [PubMed] [Google Scholar]
- 30.Yengopal V, Mickenautsch S. No difference in caries outcome between resin-modified glass ionomer cements and resin-based composites. Journal of the American Dental Association. 2012;143(12):1351–1352. doi: 10.14219/jada.archive.2012.0098. [DOI] [PubMed] [Google Scholar]
- 31.Vorhies AB, Donly KJ, Staley RN, Wefel JS. Enamel demineralization adjacent to orthodontic brackets bonded with hybrid glass ionomer cements: an in vitro study. American Journal of Orthodontics and Dentofacial Orthopedics. 1998;114(6):668–674. doi: 10.1016/s0889-5406(98)70199-4. [DOI] [PubMed] [Google Scholar]
- 32.Voss A, Hickel R, Molkner S. In vivo bonding of orthodontic brackets with glass ionomer cement. The Angle Orthodontist. 1993;63(2):149–153. doi: 10.1043/0003-3219(1993)063<0149:IVBOOB>2.0.CO;2. [DOI] [PubMed] [Google Scholar]
- 33.Millett DT, McCluskey LA, McAuley F, Creanor SL, Newell J, Love J. A comparative clinical trial of a compomer and a resin adhesive for orthodontic bonding. The Angle Orthodontist. 2000;70(3):233–240. doi: 10.1043/0003-3219(2000)070<0233:ACCTOA>2.0.CO;2. [DOI] [PubMed] [Google Scholar]


