Abstract
The transcriptional regulator QsrR is converted into a genetically encoded fluorescent probe capable of ratiometric monitoring of quinones in living cells with high sensitivity and selectivity.
Quinones, along with their phenolic partners, are widely distributed in biology where they participate in diverse physiological processes, including electron shuttering in cell membranes,1 posttranslational modifications of proteins,2 co-factoring enzymes for the metabolism of small molecules,3 perturbing the cellular redox pool through generating reactive oxygen species (ROS),4 and activating biological signaling pathways in response to stress stimulation.5 The important roles of quinones in biology can be attributed to their versatile oxidative and electrophilic properties, which are capable of promoting electron transfer in living systems through the redox cycling of the quinone/quinol couple,6 and Michael addition with cellular thiols, such as free cysteine, glutathione, and cysteine residues of proteins,7 respectively.
Traditional methods for quinone detection include liquid chromatography coupled with UV,8 fluorescence spectroscopy9 or photocatalytic chemiluminescence,10 and Fourier transform infrared difference spectroscopy.11 These methods, while commonly used, are not amenable to applications in vivo, and to date no probe was available for detection of quinones inside living cells. A major challenge to the development of a bio-probe for quinone detection is the lack of a proper quinone binder, which is not only able to specifically bind quinones, but can also undergo a conformational or spectroscopic-property change after binding for the purpose of detection. Recently, our group discovered a Staphylococcus aureus transcriptional repressor, QsrR, as a dimeric protein in control of the quinone-detoxification system. Quinone can alkylate the key Cys residue, Cys5, in QsrR, which induces a conformational change between the two monomeric subunits.7b In this way, QsrR senses the presence of quinone in the microbe. This sensing mechanism of QsrR offers an opportunity to develop a genetically encoded probe for quinone imaging.
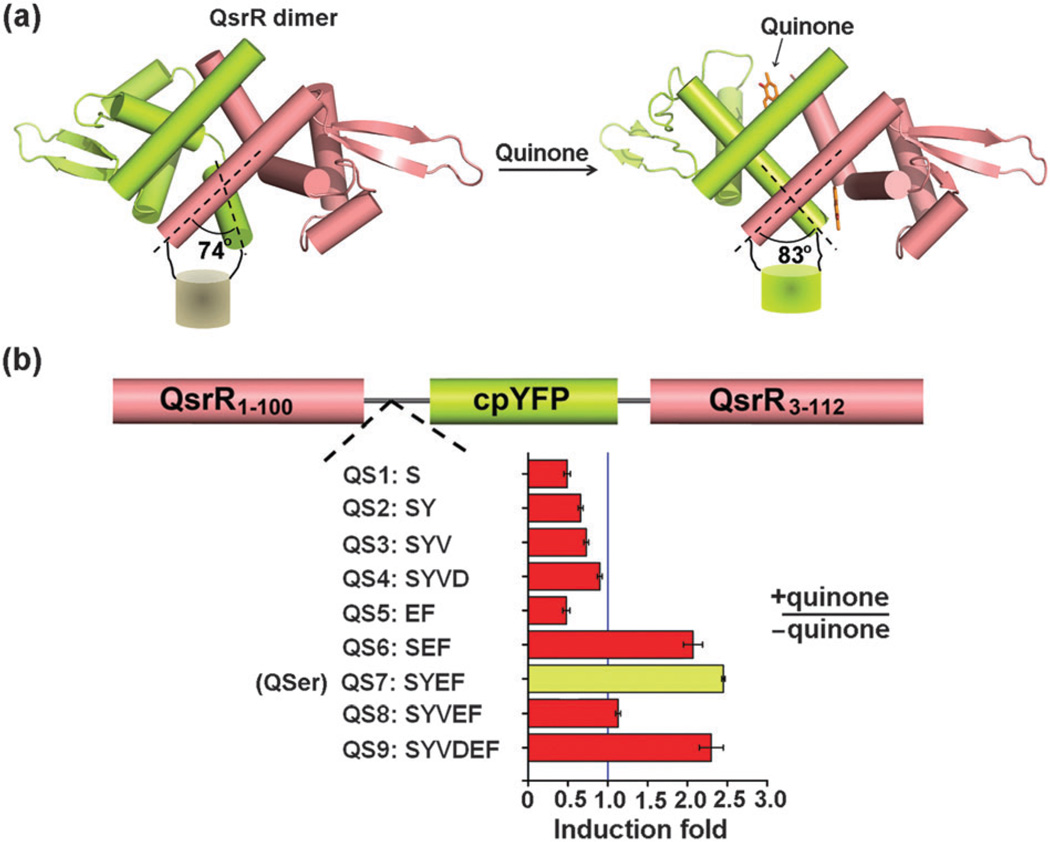
As evidenced by the development of a NADH sensor,12 in which two NADH-sensing transcriptional regulator Rex subunits are covalently linked with a fluorescent protein, cpYFP, a circularly permuted variant of YFP with the capacity to sensitively respond to conformational change,13 we engineered the aforementioned quinone sensor QsrR through the direct insertion of cpYFP between the monomeric sub-units. The principle underlying this construction is primarily based on the observation that a 9-degree rotation exists between the first α helix of one monomer and the last α helix of the other monomer after quinone association, representing a possible driving force for the conformational change of cpYFP, thus enabling spectroscopic detection (Fig. 1a).
Figure 1.
Design and construction of QSer. (a) QSer is generated by directly linking themonomeric subunits of the QsrR dimer with a fluorescent protein, cpYFP, which may undergo conformational change after quinone association. (b) Experimental data showed that a construct QS7 (QSer) with a SYEF linker at the C-terminal of the first monomeric subunit afforded the greatest response among the nine constructs after quinone association. The concentrations of the protein sample and quinone are 10 and 20 µM, respectively.
We proceeded with the knowledge that the sensitivity of a protein-based probe is greatly influenced by the linker between the receptor domain and the fluorescent reporter: we constructed a series of probes via direct deletion, mutation or addition of native amino acids at the C-terminal of the first monomer. The results showed that the construct QS7 containing four-amino acid linker SYEF exhibited the greatest response (approximately 2.5 fold) after quinone association, while other probes either gave decreased response with less than 2-fold magnitude or exhibited less of an increase than QS7 which was therefore selected and named QSer for further investigation (Fig. 1b).
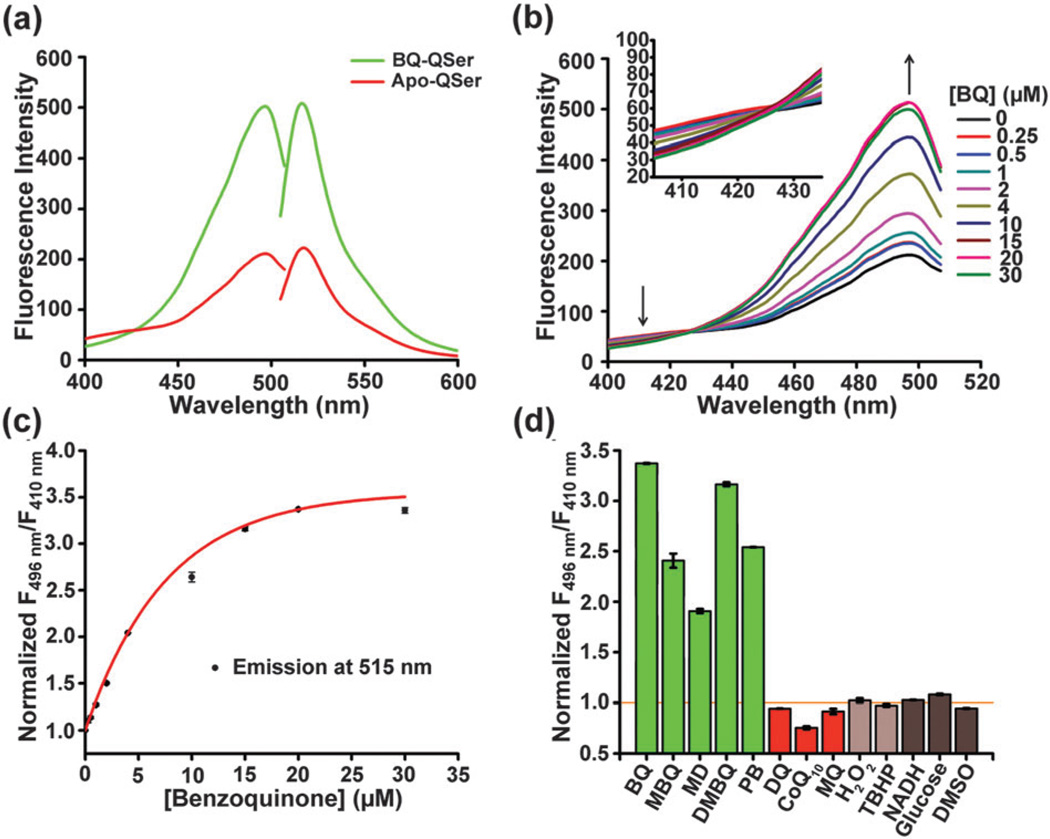
The excitation and emission spectra of apo-QSer and 1,4-benzoquinone (BQ, a model quinone molecule in biological research)-induced QSer were recorded, which revealed an emission peak at 515 nm upon excitation at 496 nm (Fig. 2a). One unique feature of this probe is its ratiometric properties: increased response above the wavelength of 427 nm and decreased response below the wavelength of 427 nm were observed simultaneously when the emission wavelength was fixed at 515 nm (Fig. 2a). Different concentrations of BQ ranging from 0 to 30 µM were added and excitation spectra were recorded. As shown in Fig. 2b, all of the spectra intersected at a wavelength of 427 nm with a significant increase at a higher wavelength and a slight decrease at a lower wavelength when the probe was titrated with increased concentrations of BQ. This result confirmed the ratiometric properties of QSer. The binding curve was created by fitting the normalized ratios of fluorescence intensity at 496 nm divided by that at 410 nm (F496nm/F410nm) with an exponential association function, revealing a sensitive-response property at low concentrations of BQ (<5 µM) and a saturated response at high concentrations of BQ (>20 µM) with approximately 3.5-fold maximal response (Fig. 2c). Similar binding properties were observed in a variety of quinone molecules, including methyl-p-benzoquinone (MBQ, Fig. S1a and b, ESI†), menadione (MD, Fig. S2a and b, ESI†), 2,3-dimethoxy-5-methyl-p-benzoquinone (DMBQ, Fig. S3a and b, ESI†), and plumbagin (PB, Fig. S4a and b, ESI†). A time-dependent fluorescence response was also carried out to investigate the kinetics of the reaction between QSer and quinones. The extremely fast changes in fluorescence (saturated <10 s), however, prevented detailed recording of the transient response with our available setup.
Figure 2.
Characterization of QSer in vitro. (a) The excitation and emission spectra of apo-QSer (red) and BQ-QSer (green). (b) The excitation spectra of QSer with various concentrations of BQ. The emission wavelength is fixed at 515 nm. (c) The response curve of QSer to BQ. (d) QSer selectively responds to specific quinones with less than three substitution groups. The concentrations of BQ, MBQ, MD, DMBQ, and PB are 20 µM; the concentrations of DQ, CoQ10 and MQ are 50 µM; the concentrations of H2O2 and TBHP are 100 µM; the concentrations of NADH and glucose are 500 µM and DMSO is 1% (v/v). Error bars represent the standard error of the mean (SEM).
Next, a variety of biologically relevant small molecules, including quinone molecules containing less than three-substituted groups (BQ, MBQ, MD, DMBQ and PB, termed A-type quinones in Fig. S5a, ESI†), four-substituted quinones (duroquinone [DQ], CoQ10 and menaquinone [MQ], termed B-type quinones in Fig. S5b, ESI†), ROS (H2O2 and tert-butyl hydroperoxide [TBHP]), cellular metabolites (NADH and glucose), and the quinone-dissolving solvent (DMSO) were utilized in order to examine the selectivity of this probe. The results showed that QSer was able to sensitively generate a positive response to the A-type quinones, whereas other chemicals including four-substituted quinones, ROS, cellular metabolites, and DMSO could not induce any significant response of QSer, thereby confirming the high selectivity of this probe (Fig. 2d and Fig. S6).
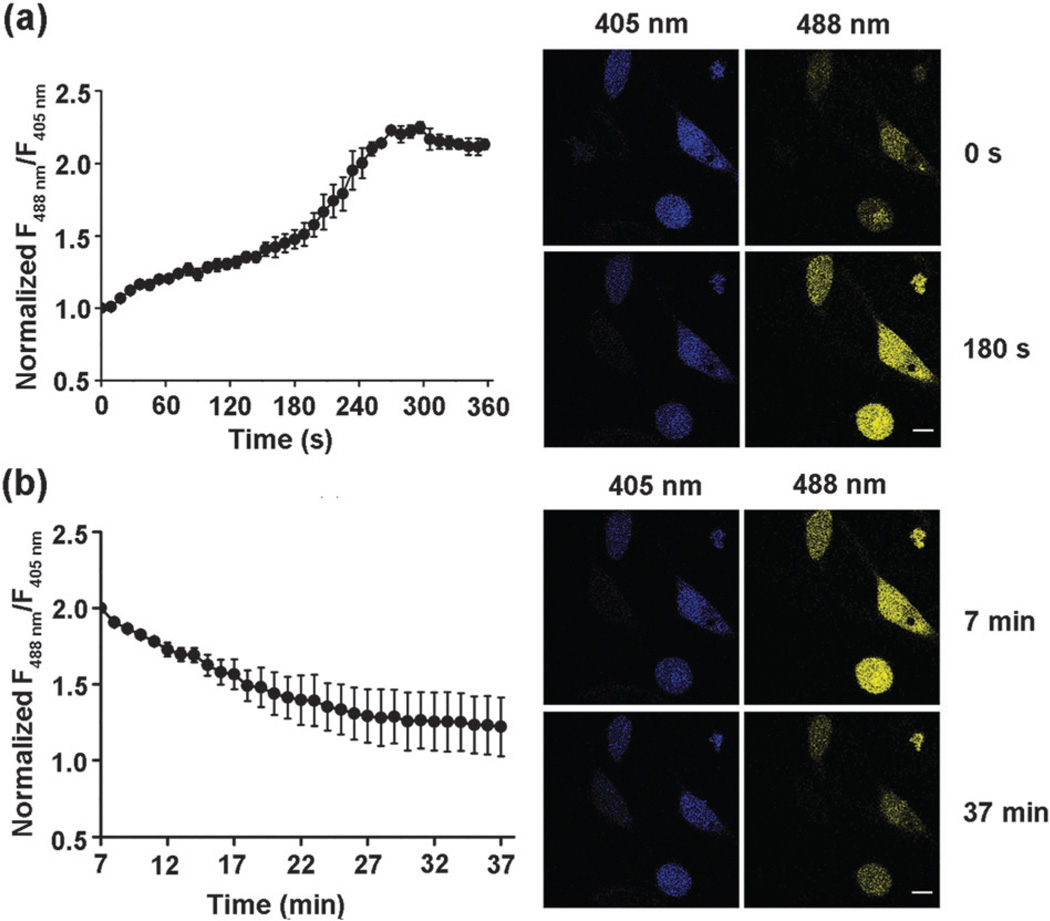
To test the utility of QSer for live-cell imaging of quinones, a mammalian cell expressing vector encoding QSer was transfected into living HeLa cells, which were further imaged using a confocal microscope with a fixed emission range and sequential dual excitation at 488 nm and 405 nm. Upon addition of 20 µM exogenous BQ, a rapid response was observed within 3 min. At 5 min the signals reached a saturated state with a maximal response of ~2.2 fold (Fig. 3a), consistent with the observations in vitro. Furthermore, the signals gradually returned to near basal levels over a 30 min period (Fig. 3b), confirming the reversibility of S-alkylation of QSer inside living cells. In contrast, cells expressing cpYFP instead of QSer exhibited constant response signals with the induction of the same amount of BQ (Fig. S7a, ESI†), therefore excluding the possibilities of interference of the cpYFP domain responding to potential pH fluctuation or quinone treatment. In addition, treatment of QSer-expressed cells with DQ (50 µM), a four-substituted quinone, did not yield any significant fluorescent response (Fig. S7b, ESI†), confirming the specificity of this probe inside cells.
Figure 3.
The response of QSer to 1,4-benzoquinone in living HeLa cells. (a) Time-lapse imaging of HeLa cells exposed to 20 µM 1,4-benzoquinone over 6 min. The fluorescent ratio of 488,405 nm excitation rapidly increased and saturated over 2-fold. (b) Time-lapse imaging of the recovery of BQ-treated HeLa cells over 30 min. The fluorescent ratio of 488/405 nm excitation eventually returned near the baseline. Error bars represent SEM. Scale bars, 20 µm.
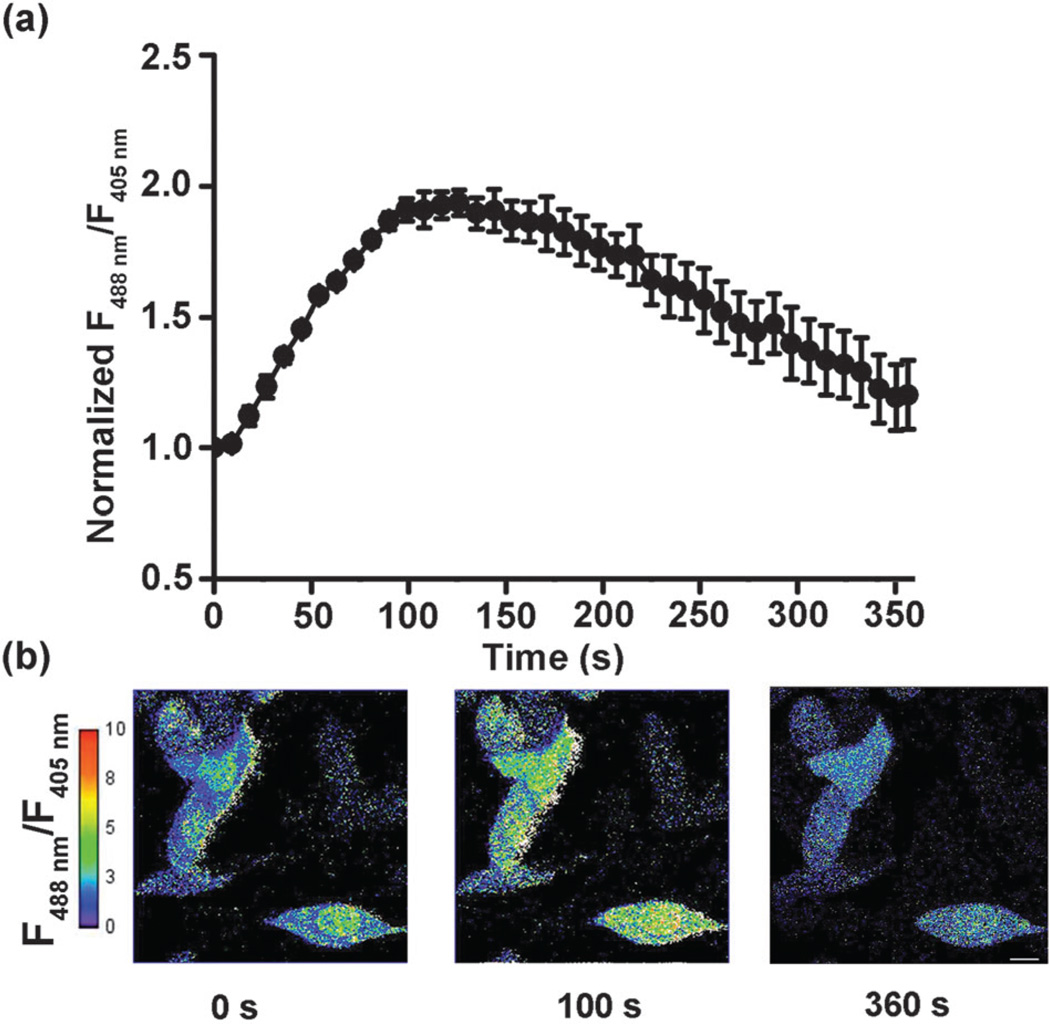
Quinone molecules can give rise to ROS stress as well as act as alkylating agents and therefore are widely utilized as anticancer, antimalarial, or antibacterial drugs.4 We employed a commercially available quinone drug, plumbagin, a well-studied natural product with antimicrobial,14 anti-inflammatory,15 anticarcinogenic16 and neuroprotective17 properties to further explore the utility of QSer. Interestingly, QSer-expressed cells treated with 50 µM of plumbagin induced an immediate increase in the dual excitation ratio (Fig. 4a and b), slightly faster than that observed in BQ-treated cells; however, these signals quickly returned to basal levels within 6 min instead of the slow, extended signal-attenuation state (30 min) observed in the BQ-treated cells (Fig. 4a and b). This result indicates the presence of a fast metabolic process that can decompose or export both the free plumbagin and S-plumbagin complex inside living cells. In addition, this result also confirms the reversibility of the S-quinonization of QSer.
Figure 4.
The response of QSer to plumbagin in living HeLa cells. (a) Time-lapse imaging of HeLa cells exposed to 50 µM plumbagin over 6 minutes. The fluorescent ratio of 488/405 nm excitation of cells showed a dynamic cycle, with a 2-fold peak at 100 seconds, which eventually returned to baseline at 6 minutes. Error bars represent SEM. (b) A pixel-by-pixel ratio of the 488 nm excitation image by the 405 nm excitation image. Scale bar, 20 µm.
The development of novel fluorescent probes has revolutionized cell biology, allowing dynamic monitoring and picturing of cellular metabolites and signals.12,18 Alkylation, a widely utilized organic reaction, has been used to design small molecule probes for detection and imaging of H2S,18b glutathione19 and ONOO−.20 In this study, based on the S-alkylation of QsrR, we have successfully developed the first protein-based fluorescent probe for dynamic monitoring of intracellular metabolism of quinones. The unique covalent-reaction mechanism of the QsrR domain enables QSer to selectively image A-type quinone molecules. The ratiometric properties of QsrR can be utilized as an internal control in order to diminish the inaccuracy caused by differences in probe’s expression levels. The observed reversibility of S-quinonization and the inability of GSH on S-transarylation of QSer (Fig. S8, ESI†) strongly indicate the presence of a novel cellular process rather than the GSH-mediated S-transarylation mechanism observed in GAPDH,21 which may universally reverse S-quinonization on cellular proteins. Further optimization and utilization of this probe should dramatically accelerate the studies of quinones in biology, such as quinone drug metabolism and distribution, menadione-mediated bacterial small colony variants, and the plastoquinone-mediated photosynthetic system.
Supplementary Material
Footnotes
Electronic supplementary information (ESI) available. See DOI: 10.1039/c3cc44534h
Notes and references
- 1.Anderson SS, Lyle IG, Paterson R. Nature. 1976;259:147. doi: 10.1038/259147a0. [DOI] [PubMed] [Google Scholar]
- 2.Zheng J, Cho M, Jones AD, Hammock BD. Chem. Res. Toxicol. 1997;10:1008. doi: 10.1021/tx970061j. [DOI] [PubMed] [Google Scholar]
- 3.Klinman JP, Mu D. Annu. Rev. Biochem. 1994;63:299. doi: 10.1146/annurev.bi.63.070194.001503. [DOI] [PubMed] [Google Scholar]
- 4.Obrien PJ. Chem.-Biol. Interact. 1991;80:1. doi: 10.1016/0009-2797(91)90029-7. [DOI] [PubMed] [Google Scholar]
- 5.Georgellis D, Kwon O, Lin ECC. Science. 2001;292:2314. doi: 10.1126/science.1059361. [DOI] [PubMed] [Google Scholar]
- 6.Nohl H, Jordan W, Youngman RJ. Adv. Free Radical Biol. Med. 1986;2:211. [Google Scholar]
- 7.Leelakriangsak M, Huyen NTT, Towe S, van Duy N, Becher D, Hecker M, Antelmann H, Zuber P. Mol. Microbiol. 2008;67:1108. doi: 10.1111/j.1365-2958.2008.06110.x. [DOI] [PubMed] [Google Scholar]
- 0.Ji Q, Zhang L, Jones MB, Sun F, Deng X, Liang H, Cho H, Brugarolas P, Gao YN, Peterson SN, Lan L, Bae T, He C. Proc. Natl. Acad. Sci. U. S. A. 2013;110:5010. doi: 10.1073/pnas.1219446110. [DOI] [PMC free article] [PubMed] [Google Scholar]
- 8.Bekker M, Kramer G, Hartog AF, Wagner MJ, de Koster CG, Hellingwerf KJ, de Mattos MJT. Microbiology. 2007;153:1974. doi: 10.1099/mic.0.2007/006098-0. [DOI] [PubMed] [Google Scholar]
- 9.Poulsen JR, Birks JW. Anal. Chem. 1989;61:2267. [Google Scholar]
- 10.Poulsen JR, Birks JW. Anal. Chem. 1990;62:1242. [Google Scholar]
- 11.Suzuki H, Nagasaka M, Sugiura M, Noguchi T. Biochemistry. 2005;44:11323. doi: 10.1021/bi051237g. [DOI] [PubMed] [Google Scholar]
- 12.Zhao Y, Jin J, Hu Q, Zhou HM, Yi J, Yu Z, Xu L, Wang X, Yang Y, Loscalzo J. Cell Metab. 2011;14:555. doi: 10.1016/j.cmet.2011.09.004. [DOI] [PMC free article] [PubMed] [Google Scholar]
- 13.Zhao BS, Liang Y, Song Y, Zheng C, Hao Z, Chen PR. J. Am. Chem. Soc. 2010;132:17065. doi: 10.1021/ja1071114. [DOI] [PubMed] [Google Scholar]
- 14.Didry N, Dubreuil L, Pinkas M. Pharmazie. 1994;49:681. [PubMed] [Google Scholar]
- 15.Checker R, Sharma D, Sandur SK, Subrahmanyam G, Krishnan S, Poduval TB, Sainis KB. J. Cell. Biochem. 2010;110:1082. doi: 10.1002/jcb.22620. [DOI] [PMC free article] [PubMed] [Google Scholar]
- 16.Hsu YL, Cho CY, Kuo PL, Huang YT, Lin CC. J. Pharmacol. Exp. Ther. 2006;318:484. doi: 10.1124/jpet.105.098863. [DOI] [PubMed] [Google Scholar]
- 17.Son TG, Camandola S, Arumugam TV, Cutler RG, Telljohann RS, Mughal MR, Moore TA, Luo W, Yu QS, Johnson DA, Johnson JA, Greig NH, Mattson MP. J. Neurochem. 2010;112:1316. doi: 10.1111/j.1471-4159.2009.06552.x. [DOI] [PMC free article] [PubMed] [Google Scholar]
- 18.(a) Berg J, Hung YP, Yellen G. Nat. Methods. 2009;6:161. doi: 10.1038/nmeth.1288. [DOI] [PMC free article] [PubMed] [Google Scholar]; (b) Qian Y, Karpus J, Kabil O, Zhang SY, Zhu HL, Banerjee R, Zhao J, He C. Nat. Commun. 2011;2:495. doi: 10.1038/ncomms1506. [DOI] [PubMed] [Google Scholar]; (c) Gutscher M, Pauleau AL, Marty L, Brach T, Wabnitz GH, Samstag Y, Meyer AJ, Dick TP. Nat. Methods. 2008;5:553. doi: 10.1038/nmeth.1212. [DOI] [PubMed] [Google Scholar]; (d) McQuade LE, Lippard SJ. Curr. Opin. Chem. Biol. 2010;14:43. doi: 10.1016/j.cbpa.2009.10.004. [DOI] [PubMed] [Google Scholar]; (e) Miller EW, Chang CJ. Curr. Opin. Chem. Biol. 2007;11:620. doi: 10.1016/j.cbpa.2007.09.018. [DOI] [PMC free article] [PubMed] [Google Scholar]; (f) Wang J, Karpus J, Zhao BS, Luo Z, Chen PR, He C. Angew. Chem., Int. Ed. 2012;51:9652. doi: 10.1002/anie.201203684. [DOI] [PubMed] [Google Scholar]; (g) Chan J, Dodani SC, Chang CJ. Nat. Chem. 2012;4:973. doi: 10.1038/nchem.1500. [DOI] [PMC free article] [PubMed] [Google Scholar]
- 19.Yi L, Li H, Sun L, Liu L, Zhang C, Xi Z. Angew. Chem., Int. Ed. 2009;48:4034. doi: 10.1002/anie.200805693. [DOI] [PubMed] [Google Scholar]
- 20.Yang D, Wang HL, Sun ZN, Chung NW, Shen JG. J. Am. Chem. Soc. 2006;128:6004. doi: 10.1021/ja0603756. [DOI] [PubMed] [Google Scholar]
- 21.Miura T, Kakehashi H, Shinkai Y, Egara Y, Hirose R, Cho AK, Kumagai Y. Chem. Res. Toxicol. 2011;24:1836. doi: 10.1021/tx200025y. [DOI] [PubMed] [Google Scholar]
Associated Data
This section collects any data citations, data availability statements, or supplementary materials included in this article.


