

Background: Chronic ER stress suppresses mTORC1 activity.
Results: mTORC1-mediated suppression of translation during chronic ER stress is independent of the stress-induced eIF2α-P/ATF4 signaling.
Conclusion: The eIF2α-P/ATF4-induced network of amino acid transporters promotes protein synthesis in part by increasing mTORC1-mediated translational control.
Significance: The eIF2α-P/ATF4/mTORC1 network controls protein synthesis rates during chronic ER stress and mediates the degree of stress response and survival outcomes.
Keywords: Amino Acid Transport, Endoplasmic Reticulum Stress, Gene Expression, Translation Control, Unfolded Protein Response, ATF4, eIF2α, Integrated Stress Response, p62, Sequestosome, Autophagy
Abstract
The accumulation of unfolded/misfolded proteins in the endoplasmic reticulum (ER) causes stress to which an unfolded protein response is activated to render cell survival or apoptosis (chronic stress). Transcriptional and translational reprogramming is tightly regulated during the unfolded protein response to ensure specific gene expression. The master regulator of this response is the PERK/eIF2α/ATF4 signaling where eIF2α is phosphorylated (eIF2α-P) by the kinase PERK. This signal leads to global translational shutdown, but it also enables translation of the transcription factor ATF4 mRNA. We showed recently that ATF4 induces an anabolic program through the up-regulation of selected amino acid transporters and aminoacyl-tRNA synthetases. Paradoxically, this anabolic program led cells to apoptosis during chronic ER stress in a manner that involved recovery from stress-induced protein synthesis inhibition. By using eIF2α-P-deficient cells as an experimental system, we identified a communicating network of signaling pathways that contribute to the inhibition of protein synthesis during chronic ER stress. This eIF2α-P-independent network includes (i) inhibition of mammalian target of rapamycin kinase protein complex 1 (mTORC1)-targeted protein phosphorylation, (ii) inhibited translation of a selective group of 5′-terminal oligopyrimidine mRNAs (encoding proteins involved in the translation machinery and translationally controlled by mTORC1 signaling), and (iii) inhibited translation of non-5′-terminal oligopyrimidine ribosomal protein mRNAs and ribosomal RNA biogenesis. We propose that the PERK/eIF2α-P/ATF4 signaling acts as a brake in the decline of protein synthesis during chronic ER stress by positively regulating signaling downstream of the mTORC1 activity. These studies advance our knowledge on the complexity of the communicating signaling pathways in controlling protein synthesis rates during chronic stress.
Introduction
Protein synthesis is an energy-expensive molecular process that requires careful regulation. Nutrient availability is closely linked to the rates of protein synthesis (1–5). The mammalian target of rapamycin kinase protein complex 1 (mTORC1)4 is believed to be an intracellular sensor of nutrient availability by promoting anabolic processes within the cell (6–9). It was recently shown that mTORC1 activity is important for the translation of a population of mRNAs that contain a 5′-terminal oligopyrimidine (TOP) tract (10). The majority of TOP mRNAs encode ribosomal proteins and translation factors (11). In addition, active mTORC1 phosphorylates multiple proteins by which global protein synthesis rates are positively regulated. One of the mTORC1-targeted proteins is p70 S6 kinase (S6K), a serine/threonine kinase that phosphorylates ribosomal protein S6 and eIF4B as well as proteins involved in the assembly of the translation initiation complex (12). mTORC1 also positively regulates translation elongation via the phosphorylation of the eukaryotic elongation factor 2 (eEF2) kinase, thus preventing the inhibitory phosphorylation of eEF2 (13).
An additional positive effect of mTORC1 has been described for rRNA transcription and processing (14, 15) and de novo pyrimidine synthesis (8, 9). Conversely, mTORC1 signaling inhibits catabolic processes such as autophagy, a survival mechanism used when cells respond to nutrient starvation (9). In agreement with all these findings, a short duration treatment with Torin 1, a catalytic inhibitor of mTORC1, caused a significant decrease in global protein synthesis rates in mouse embryotic fibroblasts (MEFs) (10).
Another intracellular sensor of nutrient availability is the phosphorylation of eIF2α (eIF2α-P) by stress-activated eIF2α kinases (GCN2, PKR, PERK, and HRI). eIF2α-P causes decreased availability of ternary complexes (eIF2-GTP-Met-tRNAi) and inhibits global translation initiation rates (16, 17). However, some mRNAs are preferentially translated via alternative mechanisms of translation initiation (18–24). Specifically, mRNAs that contain upstream open reading frames, among which is the mRNA encoding the transcription factor ATF4, are translated better under conditions of limited ternary complex availability. ATF4 induces transcriptional reprogramming in nutritionally stressed cells and has a profound impact on cell metabolism (17). In response to diverse stress conditions, this ATF4-mediated transcription program is triggered from the phosphorylation of eIF2α at residue Ser51 by the stress-activated eIF2α kinases. This cellular adaptation to stress is known as the integrated stress response (ISR) program (25).
We have recently shown that the cellular response to endoplasmic reticulum (ER) stress involves mechanisms similar to nutritional stress caused by amino acid starvation (26). Although ER stress is the result of the accumulation of unfolded/misfolded proteins in the ER and amino acid starvation induces the accumulation of some deacylated tRNAs, both stresses activate specific kinases that phosphorylate eIF2α, inhibit protein synthesis, and initiate the ISR program (27). We showed previously that during ER stress ATF4 induced the expression of genes encoding aminoacyl-tRNA synthetases, amino acid transporters, and proteins involved in the machinery of protein synthesis (26, 28). Interestingly, ATF4 also increased aminoacylation of tRNAs for amino acids, which are substrates for amino acid transport systems among which are system A (SNAT2/Slc38a2) and the heterodimeric system L (Lat1/Slc7a5 and Slc3a2) (26). System A mediates the transport of small neutral amino acids, and system L mediates the transport of branched-chain (Leu, Ile, and Val) and aromatic amino acids (Phe, Tyr, and Trp) (29, 30). We demonstrated in pancreatic β cells that ER stress increased the flux of amino acids by the coordinated induction of a network of transporters, contributing in parallel to other known mechanisms to translational recovery from the stress-induced inhibition of protein synthesis (26). Interestingly, increased system L activity can lead to increased intracellular levels of Leu, which along with other factors becomes a nutrient sensing mechanism that activates mTORC1 on lysosomal membranes (31, 32). This mechanism of mTORC1 activation also involves the signaling adaptor protein p62, which is targeted for degradation by the autophagic pathway (33).
The effect of the ER stress-induced eIF2α-P/ATF4 axis on mTORC1 activity has not been clearly established. Recent reports showed that activation of AMP-activated protein kinase, a negative regulator of mTORC1, was correlated with decreased mTORC1 activity during prolonged ER stress (34, 35). We hypothesized that the ATF4-induced amino acid transporter network contributes to protein synthesis rates during chronic ER stress by increasing mTORC1 activity. We also hypothesized that the cross-talk between the ISR and mTORC1 signaling pathways during ER stress contributes synergistically to the reprogramming of global protein synthesis rates and selective mRNA translation. To test this hypothesis, we used MEFs deficient in eIF2α-P (S51A mutation; A/A cells). These cells do not have the immediate shutdown of protein synthesis during acute ER stress and do not induce ATF4 expression (36). However, the response of eIF2α-P-deficient cells to prolonged stress has not yet been reported. We now show that ER stress induces a gradual decrease of protein synthesis in A/A cells with a good correlation to mTORC1 inactivation. Ectopic expression of ATF4 in A/A cells increased global translation rates and amino acid uptake and partially restored mTORC1 activity during ER stress. The contribution of amino acid transporters in the induction of mTORC1 activity was also demonstrated in pancreatic β cells. We previously studied extensively the ATF4-mediated amino acid transporter network in mouse insulinoma cell line 6 (MIN6) in response to ER stress (26). We demonstrate here that inhibition of amino acid transporters negatively regulates mTORC1 activity during ER stress. Taken together, our studies reveal a cross-talk between the ATF4 transcription program and the mTORC1 signaling that contributes to the regulation of mRNA translation during prolonged ER stress. The identification of the network of amino acid transporters in this cross-communication of signaling pathways can lead to therapeutic strategies that can attenuate increasing protein synthesis rates during chronic stress. As we showed earlier, control of bulk protein synthesis rates during chronic ER stress is important for cell survival (26). The studies reported here contribute to an increased understanding of the mechanisms that control bulk protein synthesis rates during chronic ER stress.
EXPERIMENTAL PROCEDURES
Cell Culture and Chemicals
MEFs including S/S, A/A, ATG5+/+, and ATG5−/− were grown in high glucose DMEM supplemented with 10% defined FBS (Invitrogen), 2 mm l-glutamine, 100 units/ml penicillin, and 100 μg/ml streptomycin. S/S and A/A MEFs were described previously (36). ATG5+/+ and ATG5−/− MEFs (37) were provided by the RIKEN BioResource Center through the National Bio-Resource Project of the Ministry of Education, Culture, Sports, Science and Technology, Japan. MIN6 was maintained in the same medium as for MEFs plus 1 mm sodium pyruvate and 55 μm β-mercaptoethanol, and only passages 30–42 were cultured for analysis. All cells were maintained at 37 °C with 5% CO2 for all experiments. Adenoviral particles expressing ATF4, β-gal, and shRNA against ATF4 (Vector BioLabs) were propagated in HEK293T cells. For the experiments of ATF4 overexpression in A/A MEFs, cells were infected with adenoviral particles for 24 h followed by the indicated treatments. For the experiments using shRNA for ATF4, cells were infected with adenoviral particles for 72 h followed by the indicated treatments. ER stress was induced with 400 nm thapsigargin (Sigma). Inhibition of glycosylation was treated with 3 μm tunicamycin (Sigma). 2-Aminobicyclo-(2,2,1)-heptane-2-carboxylic acid and α-methyl-dl-tryptophan were from Sigma-Aldrich. Torin 1 was purchased from Tocris.
Amino Acid Transport Assays
Amino acid uptake was measured by the corresponding isotope-labeled amino acid as described previously (26). Briefly, cells were seeded in 24-well plates at 5 × 10⁴ cells/well, grown for 24 h, and subjected to treatment as described. Cells were washed twice with Earle's balanced salt solution at 37 °C, and assays were performed in Earle's balanced salt solution or Earle's balanced salt solution with NaCl replaced by choline chloride as follows: (i) system A activity: 0.1 mm [14C]methylaminoisobutyrate (MeAIB; 4 μCi/ml) for 2 min; (ii) Leu uptake by system L: 0.01 mm [3H]Leu (2 μCi/ml) for 1 min; (iii) Arg uptake by system y+: 0.1 mm [3H]Arg (8 μCi/ml) for 30 s in the presence of 2 mm Leu, which prevents uptake through system y+L; and (iv) 0.05 mm [3H]Gln (5 μCi/ml). Amino acids were extracted in ethanol and measured in a liquid scintillation counter. Cells were lysed in 1 n NaOH and 1% sodium deoxycholate. Protein concentration was determined by the Lowery method using BSA as a standard. All radiochemicals were purchased from PerkinElmer Life Sciences.
Measurement of Intracellular Amino Acid Levels
To measure the concentration of free intracellular amino acids, cells were seeded in 100-mm culture dishes and grown to 70% confluence (3.0–4.0 × 10⁶ cells). Control and treated cells were washed twice with cold PBS, and free amino acids were extracted by 5% acetic acid in ethanol for 1 h at 4 °C. Supernatants were transferred to tubes, dried under vacuum, and dissolved in 0.1 m borate buffer (pH 9.5). The remaining cells were lysed in 1 n NaOH and 1% sodium deoxycholate, and the protein concentration was determined by the Lowery method with BSA as a standard. Amino acids were derivatized and analyzed on an Ultra Performance Liquid Chromatography-UV MassTrak Amino Acid Analysis instrument (Waters) following the manufacturer's instructions at the University Hospital of Cleveland, Laboratory Core.
Metabolic Labeling of Cells with [35S]Met
Cells were seeded in 24-well plates at 5 × 10⁴ cells/well, grown for 24 h, and subjected to treatment as described (38). Briefly, cells were incubated for 10 min in Met/Cys-free DMEM supplemented with 10% dialyzed FBS in the presence of the treatment reagents. [35S]Met/Cys was added (30 μCi/ml Expre35S35S Protein Labeling Mix, PerkinElmer Life Sciences) for an additional 30 min. Cells were rinsed twice with cold PBS, and total proteins were precipitated three times with 5% TCA and 1 mm Met for 10 min on ice. Precipitates were dissolved in 200 μl of 1 n NaOH and 0.5% sodium deoxycholate for 1 h. Radioactivity was determined by liquid scintillation counting. Total cellular proteins were quantified by the DCTM Protein Assay (Bio-Rad) following the manufacturer's instruction. Incorporation of [35S]Met/Cys into total cellular proteins was calculated and normalized.
Polysome Profile Analysis and mRNA Distribution
Cells were seeded in 150-mm culture dishes and grown to 70% confluence (∼1.0 × 10⁷ cells). Following the indicated treatments, 100 μg/ml cycloheximide was added to cells for 10 min at 37 °C. Cells were washed twice with cold PBS containing 100 μg/ml cycloheximide, scraped, and pelleted at 4,000 rpm for 10 min. The cell pellets were suspended in 500 μl of lysis buffer (10 mm HEPES-KOH (pH 7.4), 2.5 mm MgCl2, 100 mm KCl, 0.25% Nonidet P-40, 100 μg/ml cycloheximide, 1 mm DTT, 200 unit/ml RNase inhibitor (RNaseOUT, Invitrogen), EDTA-free protease inhibitor (Roche Applied Science)), kept on ice for 20 min, and then passed 15 times through a 23-gauge needle. Lysates were spun at 14,000 rpm for 15 min, and supernatants (cytosolic cell extracts) were collected. Approximately 10–15 A units (260 nm) of lysates were layered over 10–50% cold sucrose gradients in buffer (10 mm HEPES-KOH (pH 7.4), 2.5 mm MgCl2, 100 mm KCl). Gradients were centrifuged at 17,000 rpm in a Beckman SW28 rotor for 15 h at 4 °C. After centrifugation, 12 fractions (1.2 ml/fraction) were collected. RNA from each fraction was isolated using TRIzol LS reagent (Invitrogen), and an equal volume of RNA from each fraction was used for cDNA synthesis. The relative quantities of specific mRNAs were measured by quantitative RT-PCR (RT-qPCR) as described previously (39, 40).
RNA Isolation and RT-qPCR
For the measurement of RNA levels, cells were seeded in 60-mm culture dishes and grown to 70% confluence (1.0–1.5 × 10⁶ cells). Following the indicated treatments, total intracellular RNA was isolated using TRIzol reagent (Invitrogen). The relative RNA level was measured by RT-qPCR as described previously (39). Briefly, cDNA was synthesized using the SuperScript III First-Strand Synthesis SuperMix (Invitrogen), and the abundance of each cDNA was quantified by qPCR using the VeriQuest SYBR Green qPCR Master Mix (Affymetrix) with the StepOnePlus Real-Time PCR System (Applied Biosystems). Primers used in this study are listed in Table 1. RT-qPCR data were normalized to the GAPDH level.
TABLE 1.
Primers used for qPCR
For, forward; Rev, reverse.
| Detected mRNA | Primer sense | Sequence |
|---|---|---|
| ATF4 | For (−) | GTTTGACTTCGATGCTCTGTTTC |
| Rev (+) | GGGCTCCTTATTAGTCTCTTGG | |
| ATG5 | For (−) | ATATCAGACCACGACGGAGC |
| Rev (+) | TTGGCTCTATCCCGTGAATC | |
| ATG12 | For (−) | ATCCAAGGACTCATTGACTTCATC |
| Rev (+) | CATGCCTGGGATTTGCAGTAATGC | |
| BiP | For (−) | ACTTGGGGACCACCTATTCCT |
| Rev (+) | ATCGCCAATCAGACGCTCC | |
| Calnexin | For (−) | ATTAGTGGTGACCGAAGAGTAG |
| Rev (+) | AAGAGGATCACAAGGAACAC | |
| CHOP | For (−) | CTGGAAGCCTGGTATGAGGAT |
| Rev (+) | CAGGGTCAAGAGTAGTGAAGGT | |
| eEF2 | For (−) | CCAGGCCATCGCTGAACGCA |
| Rev (+) | CTCTCGCCCTCGCCGTAGGT | |
| Fau | For (−) | AAGTCGTGCTTCTGGCAGGCT |
| Rev (+) | AGCCAGGGAACCGTGAACTTTA | |
| GADD34 | For (−) | TACCCCTGTCTCTGGTAACCT |
| Rev (+) | TGGCTTTGCATTGTACTCATCA | |
| GAPDH | For (−) | CGCCTGGAGAAACCTGCCAAGTATG |
| Rev (+) | GGTGGAAGAGTGGGAGTTGCTGTTG | |
| Hsp90ab1 | For (−) | CATTGCTAAGTCTGGCACGA |
| Rev (+) | GAAGGAGCCACCCGCAGACG | |
| Mcl-1 | For (−) | TCAAAGATGGCGTAACAAACTGG |
| Rev (+) | CCCGTTTCGTCCTTACAAGAAC | |
| p62 | For (−) | GCTGAAGGAAGCTGCCCTAT |
| Rev (+) | GCCTTCATCCGAGAAACCCA | |
| Pabpc1 | For (−) | AGGCGATGCTCTACGAGAAG |
| Rev (+) | GACCACATGATGCGTACTGG | |
| Pre-rRNA | For (−) | TTGCGTGTGCTTGCTCTGGGCA |
| Rev (+) | CCGAAATAAGGTGGCCCTCAACC | |
| Rpl13a | For (−) | CATGAGGTCGGGTGGAAGTA |
| Rev (+) | TCTGCCTGTTTCCGTAACCT | |
| Rpl15 | For (−) | TTGCTGAGGAGAGAGCTGGGCG |
| Rev (+) | TGTTTGTGGACTGGTTTGGTGAT | |
| Rpl27 | For (−) | GCAAGAAGAAGATCGCCAAG |
| Rev (+) | CGCTCCTCAAACTTGACCTT | |
| RplP1 | For (−) | TGCACGACGACGAGGTGACG |
| Rev (+) | GAGCAGCACCACCAGCAGGC | |
| RplP2 | For (−) | GTGGGCATCGAAGCGGACGA |
| Rev (+) | GCCAGCTTGCCAACACCCTGA | |
| Rps6 | For (−) | GCGCAAGCTCCGCACCTTCT |
| Rev (+) | AGGCGCACTCTGCCATGGGT | |
| Rps13 | For (−) | ACTCCCTCCCAGATAGGTGTAAT |
| Rev (+) | TTCTGTTCCTCTCAAGGTGCTT | |
| Rps20 | For (−) | TGAAGTCGCTGGAGAAGGTTTGT |
| Rev (+) | TAAATCAATGAGTCGCTTGTGGA | |
| Rps24 | For (−) | TCATGACCAACCGTCTGCTTCA |
| Rev (+) | ACCGAAGTGGGTTCTGAATCCA | |
| Rps26 | For (−) | AACATTGTAGAAGCCGCTGCTGT |
| Rev (+) | GTGCAGCGCCAGCAGGTCTGAA | |
| Rps27a | For (−) | AGGTTGAACCCTCGGACACTAT |
| Rev (+) | ACCAGATGAAGGGTGGACTCCT | |
| Slc1a5 | For (−) | TCAACCATGGTCCAGCTTCT |
| Rev (+) | CGGGTGCGTACCACATAATC | |
| Slc3a2 | For (−) | CATGAGCCAGGACACCGAAG |
| Rev (+) | TCCTCCGCCACCTTGATCTT | |
| Slc7a1 | For (−) | ATCGGTACTTCAAGCGTGGC |
| Rev (+) | CCATGGCTGACTCCTTCACG | |
| Slc7a5 | For (−) | CTGCTACAGCGTAAAGGC |
| Rev (+) | AACACAATGTTCCCCACGTC | |
| SNAT2 | For (−) | TAATCTGAGCAATGCGATTGTGG |
| Rev (+) | AGATGGACGGAGTATAGCGAAAA | |
| Tpt1 | For (−) | GGAGGGCAAGATGGTCAGTA |
| Rev (+) | AACACCGGTGACTACTGTGC | |
| Tubulin | For (−) | CACTTACCACGGAGATAGCGA |
| Rev (+) | ACCTTCTGTGTAGTGCCCCTT | |
| Vim | For (−) | CGAGGAGGAGATGCGGGAGC |
| Rev (+) | GTGCCAGAGAAGCATTGTCA | |
| XBP1s | For (−) | GAGTCCGCAGCAGGTG |
| Rev (+) | CTGGGAGTTCCTCCAGACTA | |
| Ybx1 | For (−) | GGTCATCGCAACGAAGGTTT |
| Rev (+) | ACAGTCTCTCCATCGCCTAC |
Protein Extraction and Western Blot Analysis
For protein extraction, cells were washed twice with cold PBS and then lysed in lysis buffer (50 mm Tris-HCl (pH 7.5), 150 mm NaCl, 2 mm EDTA, 1% Nonidet P-40, 0.1% SDS, 0.5% sodium deoxycholate) supplemented with EDTA-free protease inhibitor (Roche Applied Science) and PhosSTOP phosphatase inhibitor (Roche Applied Science). Protein lysates were centrifuged at 13,000 rpm for 10 min at 4 °C, and supernatants were taken for quantification using the DCTM Protein Assay kit (Bio-Rad). Equal amounts of protein were analyzed by SDS-PAGE and Western blotting following standard procedures. For quantification purposes, the intensities of specific bands were calculated based on densitometry analysis of triplicate determinations using NIH ImageJ software. Primary antibodies used in this study were: AKT (9272, Cell Signaling Technology), ATF4 (sc-200, Santa Cruz Biotechnology), eIF2α (sc-13327, Santa Cruz Biotechnology), GAPDH (sc-32233, Santa Cruz Biotechnology), leucyl-tRNA synthetase (ab31534, Abcam), LC3 (NB100-2220, Novus Biologicals), p62 (GP62-C, Progen Biotechnik), phospho-AKT (Ser473) (sc-7985-R, Santa Cruz Biotechnology), phospho-eIF2α (Ser51) (NB110-56949, Novus Biologicals), phospho-S6 (Ser235/236) (2211, Cell Signaling Technology), phospho-S6 kinase (Thr389) (9205, Cell Signaling Technology), phospho-TSC2 (Ser939) (3615, Cell Signaling Technology), phospho-ULK1 (Ser757) (6888, Cell Signaling Technology), S6 (2217, Cell Signaling Technology), S6 kinase (9202, Cell Signaling Technology), TSC2 (4308, Cell Signaling Technology), tubulin (T 9026, Sigma), and ULK1 (ab128859, Abcam).
Statistical Analysis
Unless further noted, data shown in this study are presented as the mean ± S.E. Statistical significance between groups was evaluated using the Student's t test. p < 0.05 was considered significant.
RESULTS
Prolonged ER Stress Inhibits Protein Synthesis Independently of eIF2α-P
It is well established that acute ER stress induces transient eIF2α-P, which leads to a general inhibition of protein synthesis and enables active translation of some mRNAs such as ATF4 and CHOP (17–20, 41). Previous reports have also shown that the induction of ER stress in cells deficient of eIF2α-P does not inhibit protein synthesis (36). Because ER stress triggers transient and lasting changes of signaling and gene expression, we aimed to determine the contribution of eIF2α-P in protein synthesis rates and translational regulation of specific mRNAs during prolonged ER stress. We used either WT (S/S cells; eIF2α-P-competent) or eIF2α-S51A mutant (A/A cells; eIF2α-P-deficient) MEFs to compare protein synthesis rates under exposure to thapsigargin (Tg), which induces ER stress by depleting the ER calcium stores (42). Tg inhibits the fusion of autophagosomes with lysosomes, which is the final step of the autophagocytic pathway (43). This experimental system allowed us to evaluate protein synthesis rates during chronic ER stress in the absence of autophagy, which is one of the contributing sources for intracellular amino acid levels during stress. The absence of autophagy in our experimental system also excluded the possibility that positive regulation of mTORC1 activity during chronic ER stress might be the result of amino acids released from the autophagic cycle (9). In short, our experimental system will allow the evaluation of factors involved in the regulation of protein synthesis during chronic ER stress in a manner independent of active autophagy.
As expected, S/S cells showed a drastic decrease in the protein synthesis rate by 1 h of Tg treatment followed by gradual recovery that reached ∼80% of the control by 12 h (Fig. 1A). This translational recovery was maintained at ∼70% for up to 24 h until the experiment ended. In contrast, A/A cells showed no significant decrease in protein synthesis during the first 3 h of stress in agreement with previous reports (36). Unexpectedly, a decline of protein synthesis was observed in A/A cells during prolonged stress, reaching ∼70% of the control at 12 h (Fig. 1A). Protein synthesis rates continued to decline and reached ∼40% of the control by 24 h.
FIGURE 1.

Chronic ER stress induces the eIF2α-P-independent inhibition of protein synthesis. A, protein synthesis was measured by [35S]Met/Cys incorporation into proteins in S/S and A/A MEFs treated with Tg (400 nm) for the indicated times. Results are the mean of triplicate determinations. B, Western blot analysis of extracts from S/S and A/A cells treated with Tg for the indicated times. C, quantification of the intensities of phosphorylated S6K was calculated in samples from three independent experiments using NIH ImageJ software. The asterisks indicate p < 0.05. Error bars represent S.E.
The signaling that regulates protein synthesis rates was evaluated next. The two major signaling pathways that regulate protein synthesis during ER stress are the PERK-mediated eIF2α-P and the network of mTORC1-targeted protein phosphorylation (44–46). As shown in Fig. 1B, the change of eIF2α-P levels in S/S cells increased early and decreased gradually throughout the time course of Tg treatment as reported previously (39). The eIF2α-P pattern was also reflected in the protein synthesis rates (Fig. 1A). This strongly suggests a predominant contribution of eIF2α phosphorylation to the translational regulation during ER stress. As expected, the protein levels of ATF4 increased early (Fig. 1B, 1–3 h) and kept increasing during prolonged stress (Fig. 1B, 3–12 h). In contrast, the slow but significant decrease of protein synthesis in A/A cells between 3 and 12 h of Tg treatment was correlated with the decreasing phosphorylation of the mTORC1-targeted protein S6K (Fig. 1, B and C). In S/S cells, S6K phosphorylation increased transiently within 3 h of Tg treatment in parallel to eIF2α-P and gradually declined thereafter (Fig. 1B). Together these data suggest the inhibition of mTORC1 activity as an alternative mechanism for the eIF2α-P-independent regulation of protein synthesis during ER stress. Importantly, the data also imply that the eIF2α-P/ATF4 signaling may positively modulate the mTORC1 signaling, which in turns acts as a brake to the decline of protein synthesis during prolonged ER stress. This implication has not been noted before.
To further examine the differential responses to Tg-induced ER stress between S/S and A/A cells in terms of mRNA translation, we measured the polysome association of a selected group of mRNAs as a function of treatment time (Fig. 2). The polysome profile analysis enables more accurate and specific evaluation of the translation efficiency of individual mRNAs independent of transcriptional regulation. As the hallmark of UPR, XBP1s and ATF4 undergo different regulation of translation via eIF2α-P as reported previously (19, 20, 39). ATF4 mRNA is translationally repressed in untreated S/S cells but activated immediately after eIF2α-P (Fig. 2, A and C, Tg: 1 h), but the modulation switch (decreased eIF2B activity due to increased eIF2α-P) is lost in eIF2α-P-deficient A/A cells (Fig. 2, B and C). Interestingly, the ATF4 mRNA remained associated with polysomes in S/S cells during prolonged stress (Fig. 2, A and C, Tg: 6 h and Tg: 12 h) despite the dephosphorylation of eIF2α-P and translational recovery during prolonged stress (compare Figs. 1 and 2). The accumulation of ATF4 protein levels in S/S cells is in agreement with the continuously efficient translation of the ATF4 mRNA during stress. This finding suggests the existence of an unrecognized mechanism for ATF4 mRNA translation during prolonged ER stress. In contrast, the translation of the XBP1s mRNA in S/S cells under ER stress had a good correlation with the eIF2α phosphorylation and dephosphorylation patterns with high eIF2α-P promoting translational repression of the XBP1s mRNA (Fig. 2, A and C). The XBP1s mRNA was efficiently translated in the eIF2α-P-deficient A/A cells, suggesting that the translation of this UPR-induced mRNA is not sensitive to the decreased mTORC1 activity (Fig. 2, B and C). These data suggest that despite the similar rates of protein synthesis during prolonged stress in S/S and A/A cells (Fig. 1A, compare S/S and A/A at 9–12 h), translational control of stress-induced proteins was not identical, further supporting the long term effects of the eIF2α-P signaling on the regulation of mRNA translation.
FIGURE 2.

Chronic ER stress induces the eIF2α-P-independent inhibition of mRNA translation. A and B, S/S and A/A MEFs were treated with Tg for the indicated times, and the distribution of mRNAs in polysomes was analyzed using RT-qPCR. The dashed line indicates that fractions 8–12 are considered as polysomes. The association of specific mRNAs with polysomes was determined as a percentage of the polysome-associated mRNA signal over the total mRNA signal in each polysome profile. C, quantification of three independent experiments of polysome association for the indicated mRNAs over time of Tg treatment from S/S and A/A MEFs as depicted in A and B. The asterisks indicate p < 0.05 relative to the untreated cells. Error bars represent S.E.
Because mTORC1-targeted S6K protein phosphorylation decreased in both S/S and A/A cells by 12 h of Tg treatment albeit with significantly different kinetics and final levels, we hypothesized that the translation of TOP mRNAs downstream of the mTORC1 signaling pathway (10) is regulated differently in the presence or absence of eIF2α-P. Two bona fide and known TOP mRNAs, RplP2 and Rpl13a, were selected for evaluation. As expected, acute ER stress (Tg: 1 h) caused a significant decrease of translation from both TOP mRNAs in S/S cells presumably as a result of increased eIF2α-P that gradually and partially recovered during prolonged stress (Tg: 6 h and Tg: 12 h) (Fig. 2, A and C). It should be noted that the changes of TOP mRNA translation obtained from S/S cells are the combined effects of eIF2α-P (global inhibition of translation) and mTORC1 activity (TOP mRNA translation). In contrast, we observed a continuous dissociation of the RplP2 and Rpl13a mRNAs from polysomes in A/A cells as a function of time under stress (Fig. 2, B and C). These data correlate well with the protein synthesis rates (Fig. 1A) and S6K phosphorylation patterns (Fig. 1C). The larger decrease in polysome-associated TOP mRNA signal in A/A cells as compared with S/S cells was also in agreement with the changes in mTORC1 activity by 12 h of stress between these cells (Fig. 1, B and C). Therefore, the sustained mTORC1 activity downstream of eIF2α-P serves as an important regulator for translational reprogramming during prolonged ER stress.
Translational Reprogramming during Prolonged ER Stress Reveals Selective Translation
Several studies reported that the translational reprogramming during early stress involves increased translation of mRNAs that contain upstream ORFs such as ATF4 (18–20). It is less clear which mRNAs are translated during prolonged stress at the time of translational recovery. As shown in Fig. 2A, the translation of the upstream ORF-containing mRNA ATF4 is not inhibited upon translational recovery despite eIF2α dephosphorylation (Fig. 1B). The signaling pathways that modulate the translational reprogramming during prolonged stress are also not well studied. We hypothesized that the ISR program downstream of eIF2α-P should contribute to the translational reprogramming during prolonged stress.
To test this hypothesis, we compared the efficiency of translation from representative groups of mRNAs (UPR-induced mRNAs, classical cap-dependent mRNAs, ER-associated chaperones, TOP mRNAs, and non-TOP ribosomal protein mRNAs) in S/S and A/A cells. Because mRNA translation in S/S cells can be directly (early stress) and indirectly (prolonged stress) influenced by the eIF2α-P signaling, the comparison of the efficiency of translation of mRNAs during prolonged stress in S/S and A/A cells should distinguish the differences. Following evaluation of the distribution of mRNAs from polysome profiles of control (untreated) and Tg-treated cells for 12 h, we analyzed the data by plotting the difference of the percentage from polysome-associated mRNA signals between untreated and 12-h Tg-treated cells (Fig. 3). For example, the ATF4 mRNA in S/S cells showed a 70% distribution in polysomes from 12-h Tg-treated cells and a 46% distribution in polysomes from control cells (Fig. 2A), a difference of +24% (Fig. 3). Likewise, the calculated difference for the ATF4 mRNA in A/A cells gave a +2% score (Fig. 3). Several interesting observations were made from this analysis. (i) Similar to the data shown in Fig. 2, A and B, the efficiency of the ATF4 mRNA translation was high in S/S and low in A/A cells. In contrast, translation of the XBP1s mRNA was not affected. (ii) The cap-dependent mRNA group showed higher translation efficiency in S/S cells. (iii) The ER chaperones were better translated in S/S cells. These findings suggest that there are differential responses from cells that experienced eIF2α-P in comparison with eIF2α-P-deficient cells, further supporting that there are long term effects of the ISR program on translational control during prolonged stress.
FIGURE 3.
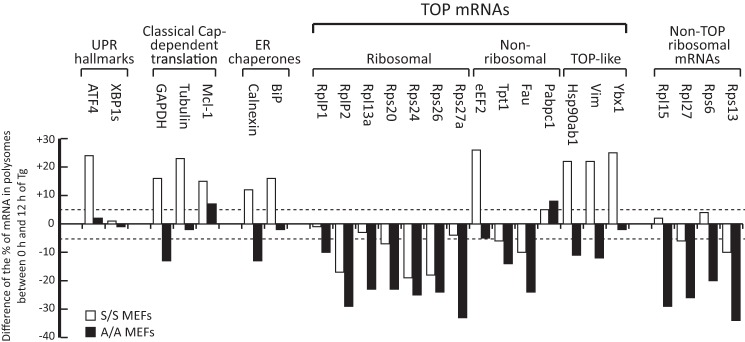
Distribution of mRNAs in polysomes from S/S and A/A cells reveals selective mRNA translation during ER stress. S/S and A/A cells were either left untreated or treated with Tg (400 nm) for 12 h. Cell extracts were used to determine the distribution of mRNAs in polysomes as described in Fig. 2, A and B. The association of specific mRNAs with polysomes (untreated or Tg-treated cells) was determined as a percentage of the polysome-associated mRNA signal over the total mRNA signal in each polysome profile for the indicated mRNAs. The graph indicates the difference, increase (+) or decrease (−), of the percentage of each mRNA in polysomes between untreated and 12-h Tg-treated samples. The dashed lines indicate a difference in distribution of 5% either as an increase (top line) or decrease (bottom line).
Data in Fig. 1 have shown that the mTORC1 signaling decreased in response to prolonged ER stress with the A/A cells showing more severe inhibition. Recent reports demonstrated that TOP mRNA translation decreased under the conditions of complete mTORC1 inhibition via the use of a catalytic inhibitor of mTORC1, Torin 1 (10). Therefore, we tested the translational efficiency from representative groups of TOP mRNAs. All the ribosomal protein TOP mRNAs showed a decrease of translation in response to Tg treatment with a more pronounced inhibition in A/A cells (Fig. 3). An exception showing increased translation in S/S cells was the eEF2 mRNA. When Torin 1 was applied during the last 1 h of the 12-h Tg treatment in S/S cells, a significant dissociation from polysomes was observed for the eEF2 mRNA in agreement with previous findings that it is a TOP mRNA (10). This supports the idea that TOP mRNA translation is differentially regulated during prolonged ER stress. Interestingly, TOP-like mRNAs, whose translation was also inhibited in response to Torin 1 (10), were only inhibited in A/A but not in S/S cells. We conclude that the eIF2α-P signaling may partially restore the translational inhibitory effects of the decreased mTORC1 signaling.
Finally, because mTORC1 positively regulates ribosome biogenesis and processing (11), we tested the translation of ribosomal protein mRNAs that are not classified as TOP mRNAs because of their insensitivity to Torin 1 treatment (10). All four of the tested non-TOP ribosomal protein mRNAs were translationally repressed in A/A cells, suggesting a global shutdown of the translation machinery. Further support to this idea came from the observation of a continuing decline of the 47 S preribosomal RNA levels in A/A cells under Tg treatment, suggesting decreased transcription of the rRNA (Fig. 4E). The decline of the 47 S preribosomal RNA levels was well correlated with suppressed mTORC1 activity in A/A cells (Fig. 1B). In agreement with a previous report (47), S/S cells showed an immediate decrease of 47 S preribosomal RNA levels, which remained at the reduced level throughout the time course of the experiment (Fig. 4E). In conclusion, the translational shutdown is expected to have long term effects on protein synthesis rates in the absence of eIF2α-P because of the inhibition of synthesis and processing of the components comprising the entire protein synthesis machinery. These findings further point to the positive effects of the eIF2α-P-mediated ISR program on protein synthesis rates during chronic ER stress.
FIGURE 4.

Induction of ATF4 during prolonged ER stress contributes positively to protein synthesis rates independently of autophagy. A and B, Western blot analysis of extracts from S/S and A/A cells treated with Tg (400 nm) for the indicated times. C, Western blot analysis of extracts from ATG5+/+ and ATG5−/− MEFs infected with adenoviral particles expressing either control shRNA or shRNA against ATF4. D, protein synthesis was measured by [35S]Met/Cys incorporation into proteins in either untreated or Tg-treated ATG5+/+ and ATG5−/− MEFs following 3 days of adenovirus infection for the corresponding shRNAs. Data obtained were normalized to the values of the respective cells expressing control shRNA without Tg treatment. Results are the mean of triplicate determinations. The asterisks indicate p < 0.05. E and F, RT-qPCR analysis of mRNAs isolated from S/S, A/A, ATG5+/+, and ATG5−/− MEFs treated with Tg for the indicated times. Data were normalized to GAPDH values and expressed as a ratio to the value of untreated samples. Error bars represent S.E.
Induction of ATF4 during Prolonged ER Stress Contributes Positively to Protein Synthesis Rates Independently of Autophagy
It was shown in Fig. 1 that mTORC1-targeted protein phosphorylation decreased during Tg treatment with a more profound decline in cells deficient of eIF2α-P. It is well established that the tuberous sclerosis complex TSC1-TSC2 negatively regulates mTORC1 activity (6, 48–50). AKT-mediated phosphorylation of TSC2 inhibits its activity (51). TSC2 Ser939, an AKT-dependent phosphorylation site, is phosphorylated by activated/Ser473 phosphorylated AKT. Therefore, we determined the AKT and TSC2 phosphorylation patterns in Tg-treated S/S and A/A cells. Phosphorylation of TSC2 (Ser939) declined during prolonged stress in both cell types with a sharper decline in A/A cells (Fig. 4A). A similar decline in AKT-P (Ser473) was observed in S/S and A/A cells during prolonged stress (Fig. 4A). However, in contrast to A/A cells, S/S cells showed a transient increase of AKT phosphorylation (Fig. 4A) in agreement with previous reports of co-regulation of AKT and eIF2α phosphorylation (52, 53). These data suggest that prolonged ER stress in MEFs inhibits mTORC1 activity via the AKT/TSC2 signaling. The inhibition of mTORC1 in turns correlates with the decreased protein synthesis in A/A cells (Fig. 1A). Our data also suggest that the eIF2α-P signaling has an inhibitory effect in the fast decline of mTORC1-targeted protein phosphorylation and mRNA translation because mTORC1 activity declined faster in A/A as compared with S/S cells during prolonged ER stress (Fig. 1B, compare S/S and A/A).
One of the mechanisms by which ATF4 positively modulates protein synthesis during prolonged stress is the regulation of eIF2α-P status via expression of ATF4-induced GADD34, the phosphatase subunit that directs dephosphorylation of eIF2α-P (21, 24, 54). We hypothesized that eIF2α-P also has a positive effect on mTORC1-mediated protein synthesis during prolonged ER stress via the transcription factor ATF4. The sustained translation of the ATF4 mRNA in S/S but not in A/A cells during prolonged ER stress is likely to be a factor contributing to the positive effect of eIF2α-P on mTORC1 activity (Fig. 1). This positive effect is expected to enhance mTORC1 activity and its downstream effects on mRNA translation. ATF4-mediated stress responses with a positive effect on mTORC1-mediated protein synthesis during prolonged ER stress may include the following: (i) induction of autophagy and recycling of cellular components (55), (ii) increased expression of amino acid transporters and amino acid uptake (26, 28, 56, 57), and (iii) increased expression of proteins involved in the protein synthesis machinery (11). We tested these hypotheses next.
We first hypothesized that the ATF4-mediated positive effects on protein synthesis during prolonged ER stress can be independent of autophagy. Tg treatment, which inhibits the fusion of autophagosomes with lysosomes, caused the accumulation of the cytosolic form of LC3 (LC3-I) conjugated to phosphatidylethanolamine (LC3-II) and the accumulation of the autophagic substrate p62 protein, also called sequestrosome-1 (Fig. 4B) (43). However, the accumulation of uncleared autophagosomes may have additional effects on the cellular metabolism and specifically on protein synthesis (58). To test the contribution of autophagy to protein synthesis rates in the absence of autophagosome formation, we used MEFs deficient in the autophagy gene ATG5 (59). ATG5−/− cells showed a great recovery of protein synthesis during prolonged ER stress (Fig. 4D, compare mock and Tg: 9 h of the shCtrl). This recovery was partially dependent on ATF4 given that depletion of ATF4 in ATG5−/− cells (Fig. 4C) further decreased protein synthesis rates during prolonged ER stress (Fig. 4D, compare mock and Tg: 9 h of the shATF4). These data suggest that ATF4 can contribute to protein synthesis recovery rates during prolonged ER stress independently of autophagy.
ATF4 was shown recently to increase the expression of genes involved in autophagy (60). We observed here that the levels of p62 protein, which is involved in cargo recruitment for autophagic degradation and a target of autophagy itself (33), increased in S/S cells during prolonged ER stress (Fig. 4B). A smaller increase was observed in A/A cells (Fig. 4B), suggesting that the eIF2α-P/ATF4 transcription network contributes to p62 accumulation in addition to Tg-mediated inhibition of autophagy. Therefore, we tested the expression of p62 gene in S/S and A/A cells during ER stress. In agreement with the differential increases in p62 protein accumulation between S/S and A/A cells (Fig. 4B), Tg treatment increased the levels of p62 mRNA in S/S cells but to a lesser degree in A/A cells (Fig. 4E). Induced expression of the autophagy genes ATG5 and ATG12 in S/S cells during ER stress was similar to previous reports (60). The involvement of ATF4 in the regulation of ATG5 and ATG12 genes during stress was evident by the lower levels of expression from these genes in A/A cells treated with stress (Fig. 4E, compare S/S and A/A). We conclude that the eIF2α-P/ATF4 signaling positively regulates autophagy in MEFs, including the expression of p62, which is a positive regulator of mTORC1 activation (33). The latter supports the idea that ATF4 may contribute to the regulation of mTORC1 activity during prolonged ER stress via the autophagy-targeted protein p62. It has been reported that p62 is part of a multifactor amino acid-sensing mechanism for mTORC1 activation on lysosomal membranes (61). In the cases where ER stress induces autophagy, the degradation of p62 may be a mechanism to dampen the nutrient-sensing mechanism of mTORC1 activation. Studies of the mechanism of the p62-mediated mTORC1 activation during prolonged ER stress are outside the scope of this study.
We have shown previously that ATF4-mediated induction of amino acid transporter gene expression correlated with increased protein synthesis during prolonged ER stress in insulin-producing β cells (26). A positive relationship between the activities of the amino acid transporter system L (heterodimeric transporter Slc7a5/Slc3a2 for branched-chain and aromatic amino acids) and system ASC (Slc1a5, Gln transporter) has been described previously in tumor cells (57). Therefore, we tested whether ATF4-mediated expression of these amino acid transporters contributes to mTORC1 activation and protein synthesis recovery during prolonged ER stress. This ATF4-dependent regulation is also expected to be independent of autophagy given the observed protein synthesis recovery during prolonged ER stress in autophagy-deficient cells (Fig. 4D, compare ATG5+/+ and ATG5−/−). Therefore, we tested the expression of these amino acid transporter genes in ATG5+/+ and ATG5−/− cells. Expression of the amino acid transporters Slc7a5 and Slc3a2 increased in both cell types during Tg treatment (Fig. 4F). In addition, expression of the ATF4-targeted genes CHOP and GADD34 reached similar levels of induction during prolonged stress, suggesting that autophagy is not required for the execution of the ATF4-mediated transcription program. It should be noted that untreated ATG5−/− cells did not show any increase in the expression of ATF4 (Fig. 4C, compare untreated condition in ATG5+/+ and ATG5−/− cells), further supporting that the absence of autophagy does not induce a nutritional stress response in basal conditions. Taken together, these data support the conclusion that mTORC1-mediated protein synthesis during prolonged ER stress may involve the actions of ATF4 via the induction of amino acid transporters and subsequent amino acid flux independently of autophagy.
ATF4 Induces Amino Acid Uptake and mTORC1 Signaling to Sustain Protein Synthesis during Prolonged ER Stress
We next tested the hypothesis that ectopic expression of ATF4 in A/A cells would increase mTORC1 activity during prolonged ER stress. We expressed ATF4 via adenovirus infection and tested the effect of Tg treatment on the mTORC1-targeted protein phosphorylation. A β-gal-expressing adenovirus was used as an experimental control (Fig. 5A). Increasing levels of ATF4 protein correlated with increased mTORC1-mediated protein phosphorylation during prolonged ER stress (Fig. 5, A and B, Tg: 12 h, ULK1-P (Ser757), S6K-P (Thr389), and S6-P (Ser235/236)). We did not observe similar increases in the absence of ER stress. Similar to the data shown in Fig. 1B, mTORC1-mediated protein phosphorylation was significantly lower in Tg-treated cells (Fig. 5A, Tg: 12 h, compare − and + of in the β-gal expression). In agreement with the data shown in Fig. 4E, expression of ATF4 in A/A cells caused an increase in the levels of p62, which was further increased by Tg treatment (Fig. 5A). The accumulation of LC3-II also increased with ATF4 overexpression in Tg-treated cells (Fig. 5A). As shown earlier (26), ATF4 induced the expression of leucyl-tRNA synthetase (Fig. 5A). These data suggest that ectopic expression of ATF4 contributes to mTORC1 activation during prolonged ER stress.
FIGURE 5.

ATF4 induces mTORC1 signaling and amino acid uptake to sustain protein synthesis during prolonged ER stress. A, Western blot analysis of extracts from either untreated or 12-h Tg-treated (400 nm) A/A MEFs following 24 h of infection with increasing concentrations of adenovirus expressing either β-gal or ATF4. LARS, leucyl-tRNA synthetase. B, quantitation of the intensities of phosphorylated S6K under β-gal or ATF4 expression in the presence of Tg treatment was determined in three independent experiments using NIH ImageJ software. C, the association of specific mRNAs with polysomes (β-gal- or ATF4-overxpressing A/A cells) was determined as a percentage of the polysome-associated mRNA signal over the total mRNA signal in each polysome profile for the indicated mRNAs. The graph indicates the difference of the percentage of each mRNA in polysomes between untreated and 12-h Tg-treated samples. Results are the mean of triplicate determinations. D, [35S]Met/Cys incorporation into proteins in A/A MEFs for the indicated times following 24 h of infection with adenovirus expressing β-gal or ATF4. The value of the β-gal untreated samples was defined as 100% (dashed line). The mTORC1 inhibitor Torin 1 (250 nm) was added for 1 h in either control cells or for the last hour of treatment in cells treated with Tg for 12 h. Results are the mean of triplicate determinations. ns, not significant. Tor1, Torin 1. E, amino acid uptake of Leu, Gln, and MeAIB in A/A MEFs after 24 h of infection with adenovirus expressing β-gal or ATF4. Data were normalized to the values of the β-gal samples. F, [35S]Met/Cys incorporation into proteins in A/A MEFs following 24 h of infection with adenovirus expressing β-gal or ATF4 in the absence or presence of Tg treatment with or without Leu in the culture medium for the last hour of treatment. The value of the β-gal untreated samples was defined as 100% (dashed line). G, intracellular amino acid levels in either untreated or 12-h Tg-treated S/S and A/A cells. Results are the mean of triplicate determinations. The asterisks indicate p < 0.05. Error bars represent S.E.
The effect of ATF4 on mTORC1-mediated translation during prolonged ER stress in A/A cells was also evaluated with polysome profile analysis (Fig. 5C). Similar to data analyzed in Fig. 3 following evaluation of the distribution of mRNAs from polysome profiles of control (β-gal-infected) and ATF4-infected cells, we analyzed the data by plotting the difference of the percentage of polysome-associated mRNA signals between these two treatments (Fig. 5C). A significant increase in polysome-associated mRNA signal was observed in ATF4-expressing cells, suggesting a direct impact of ATF4 expression in elevating mTORC1-mediated translational control. Taken together, these data suggest that eIF2α-P has a positive effect on mTORC1 signaling via the transcription factor ATF4 during prolonged ER stress.
We have recently shown that ATF4 positively regulates protein synthesis rates during prolonged ER stress via mechanisms that involve the increased expression of an amino acid transporter network (26, 28). Therefore, we determined whether ectopic expression of ATF4 in A/A cells increases protein synthesis rates and amino acids uptake. Tg treatment caused a decrease in protein synthesis during 12 h of stress for both β-gal- and ATF4-infected cells (Fig. 5D). However, ATF4-overexpressing cells sustained higher levels of protein synthesis as compared with A/A cells expressing β-gal (Fig. 5D, compare β-gal and ATF4 at 12 h of Tg treatment). We next tested the hypothesis that the ATF4-mediated increase of protein synthesis rates during prolonged ER stress in A/A cells could involve mTORC1-mediated translational control. We applied the mTORC1 inhibitor Torin 1 for the last 1 h of treatment in either control or 12-h Tg-treated cells (Fig. 5D). Torin 1 treatment inhibited protein synthesis in both unstressed and Tg-treated A/A cells in a manner in which the difference was no longer significant between the β-gal- and ATF4-overexpressing cells (Fig. 5D).
We have previously determined that the amino acid transporters Slc7a5/Slc3a2 (system L), Slc1a5 (system ASC), and SNAT2 (system A) mediate Leu, Gln, and MeAIB uptake, respectively (see Fig. 7A). It is shown here that adenovirus-mediated overexpression of ATF4 in A/A cells increased the uptake of all three amino acids (Fig. 5E). Importantly, by depletion of Leu from the culture medium for 1 h, the protein synthesis rate of ATF4-overexpressing A/A cells was reduced to approximately the level of the β-gal-expressing control both in the absence and presence of Tg (Fig. 5F), suggesting a direct contribution of Leu in the ATF4-mediated enhancement of protein synthesis. In agreement with this finding, the intracellular levels of branched-chain (Leu, Ile, and Val) and aromatic amino acids (Phe and Tyr) were all significantly higher after 12 h of Tg treatment in S/S but not A/A cells (Fig. 5G). Taken together, these data suggest that ATF4 induces protein synthesis during chronic ER stress via the regulation of mTORC1 activity. This indirect mechanism of mTORC1 activation by ATF4 involves the increased uptake of the amino acids Leu and Gln, both of which are positive regulators of mTORC1 (57).
FIGURE 7.

Inhibition of glycosylation during prolonged ER stress disturbs the amino acid transporter network and mTORC1 signaling. A, diagrammatic representation of the network of amino acid transporters that provide Gln (by systems ASC and A) as an efflux substrate for increased Leu uptake (by system L) during chronic ER stress in MIN6 cells (26). B–D, MIN6 cells were untreated or treated with Tg (400 nm) and Tu (3 μm) for the indicated times. B, uptake of Leu (system L), Gln (system ASC), MeAIB (system A), and Arg (system y+) in MIN6 cells. C, RT-qPCR analysis for the indicated mRNAs. Slc7a5, system L; Slc1a5, system ASC; SNAT2, system A; Slc7a1, system y+. RT-qPCR data were normalized to GAPDH levels and expressed as a ratio to the value of untreated samples. D, Western blot analysis for the levels of the indicated proteins. Results are the mean of triplicate determinations. The asterisks indicate p < 0.05. ns, not significant. Error bars represent S.E.
Increased Amino Acid Flux in Pancreatic β Cells Contributes to mTORC1 Signaling during Prolonged ER Stress
It is well accepted that ER stress in β cells induces apoptosis, cell loss, and subsequent development of diabetes (62). Although there are several stress-induced cellular pathways that can lead β cells to apoptosis, more recent reports have identified the rates of protein synthesis during chronic stress as the cause of ultimate mitochondrial dysfunction and induction of apoptosis (28). We have contributed to the discovery of this novel pathway by showing that the ATF4-mediated increase of amino acid flux contributes to protein synthesis rates during chronic ER stress in MIN6 β cells and islets in vivo (26). These previous reports and the studies described here tempted us to determine the mTORC1 signaling and its dependence on the regulation of amino acid flux in MIN6 cells under 12–24 h of Tg treatment (which mimics chronic stress).
We first examined the patterns of translational efficiency from different mRNAs during prolonged ER stress (12 h of Tg treatment) in comparison with unstressed cells (Fig. 6A). Similar to MEFs (Fig. 3), we observed decreased efficiency of translation from most mRNAs examined (Fig. 6A). The degree of inhibition in translation for the TOP mRNAs was similar to that observed from S/S cells but not as severe as that from A/A cells (compare Figs. 3 and 6A). Cell type-specific stress responses for the rest of the mRNAs were also observed. Remarkably, we observed more efficient translation from two of the mRNAs tested, the ATF4 and eEF2 mRNAs, similar to the observation from S/S cells (compare Figs. 3 and 6A). Efficient translation of the ATF4 mRNA during prolonged stress could not be explained by the current mechanism of upstream ORF-mediated leaky scanning within the ATF4 5′-UTR due to the decreased eIF2B activity in stressed cells (19, 20, 63, 64). We have shown previously that eIF2B activity is fully restored during chronic stress in Tg-treated MIN6 cells (26). Therefore, it is likely that a novel eIF2α-P-dependent mechanism enhances ATF4 mRNA translation during prolonged ER stress in β cells as well as in MEFs. It was also a surprise to observe more efficient translation of the eEF2 mRNA under these conditions. Because the eEF2 mRNA is a TOP mRNA and its translation is sensitive to the inhibitors of mTORC1 (10), our data suggest either that the translation of TOP mRNAs senses different fluctuations in mTORC1 activity or that other unknown mechanisms operate under these conditions. The physiological relevance of the continuous translation of the eEF2 mRNA under chronic stress could be increased translation elongation rates, thus further inhibiting the stress-induced decline of protein synthesis.
FIGURE 6.

Cross-talk between amino acid uptake and mTORC1 signaling during prolonged ER stress in mouse pancreatic β cells. A, polysome profiles (upper panel) and summarized distributions of mRNAs in polysomes (lower panel) of selected mRNAs in MIN6 cells either untreated or treated with Tg (400 nm) for 12 h as described in Figs. 2 and 3, respectively. B and C, Western blot analysis of extracts (B) and RT-qPCR analysis of RNAs (C) isolated from MIN6 cells treated with Tg for the indicated times following 3 days of infection with adenovirus expressing either control shRNA or shRNA against ATF4. RT-qPCR data were normalized to GAPDH levels and expressed as a ratio to the value of untreated samples. D, intracellular amino acid levels in MIN6 cells either untreated or treated with Tg for 18 h. Results are the mean of triplicate determinations. E, Western blot analysis of extracts from MIN6 cells either untreated or treated with Tg for 18 h alone or with depletion of Leu (−Leu) or increasing concentrations of inhibitors of system L (2-aminobicyclo-(2,2,1)-heptane-2-carboxylic acid (BCH) and α-methyl-dl-tryptophan (αMT)). F, quantitation of the intensities of phosphorylated S6K as depicted in E was calculated based on the densitometry analysis of triplicate determinations using NIH ImageJ software. G, [35S]Met/Cys incorporation into proteins in MIN6 cells either untreated or treated with Tg for 18 h alone or in the presence of increasing concentrations of system L inhibitor 2-aminobicyclo-(2,2,1)-heptane-2-carboxylic acid (BCH). Results are the mean of triplicate determinations. The asterisks indicate p < 0.05. Error bars represent S.E.
We next determined the importance of ATF4 in the mTORC1 signaling during prolonged ER stress in MIN6 cells. ATF4 was depleted (using RNAi technology) in MIN6 cells followed by Tg treatment as indicated (Fig. 6B, compare shCtrl and shATF4), and the levels of different proteins were measured by Western blot analysis (Fig. 6B). The eIF2α-P was slightly higher under the depletion of ATF4 (Fig. 6B, compare shCtrl and shATF4 at 0 h of Tg treatment). The phosphorylation of mTORC1-targeted proteins (Fig. 6B, S6K-P (Thr389) and ULK1-P (Ser757)) was significantly lower in ATF4-depleted MIN6 cells without applying Tg treatment, suggesting that a decreased level of the amino acid pool in MIN6 cells causes the decreased basal mTORC1 activity (Fig. 6B, compare shCtrl and shATF4 at 0 h of Tg treatment). Tg treatment of shCtrl cells showed a decrease of mTORC1-targeted protein phosphorylation as expected (Fig. 6B). To our surprise, ATF4-depleted MIN6 cells under Tg treatment only showed a transient and small decrease in the mTORC1-targeted protein phosphorylation (Fig. 6B, S6K-P (Thr389) and ULK1-P (Ser757) under shATF4). The absence of a more significant decrease suggested that additional ATF4-independent mechanisms (such as insulin-mediated) might exist in this cell type to support mTORC1 activity under ER stress. Alternatively, the low mTORC1 activity in the unstressed cells under ATF4 depletion is already minimally sustainable, and application of stress could not dampen it further.
An additional mechanism that could positively regulate the mTORC1 activity via amino acid sensing is the protein p62 (61, 65). Depletion of ATF4 caused an increase in p62 protein levels in control unstressed cells (Fig. 6B, compare shCtrl and shATF4 at time 0 of Tg treatment) in agreement with the induction of autophagy in response to the decreased intracellular amino acid pool (55, 58). The accumulation of LC3-II was also consistent with this conclusion (Fig. 6B). Under conditions of Tg treatment (where autophagy is inhibited), p62 levels increased during prolonged stress in ATF4-depleted MIN6 cells, suggesting that the induction of p62 during ER stress in MIN6 cells is only partially dependent on the ATF4 transcription program. This was further supported by a similar accumulation of p62 mRNA levels under Tg treatment in MIN6 cells treated with either control or ATF4 shRNAs (Fig. 6C). These data imply that an ATF4-independent mechanism induces the expression of p62 in Tg-treated MIN6 cells. As expected, we observed a significant increase of p62 protein levels in shCtrl cells under Tg treatment, suggesting that ATF4 contributes to the accumulation of p62 levels during chronic stress (Fig. 6B) under conditions of inhibited autophagy (43). However, in experimental systems where ER stress induces autophagy, one would expect that autophagic clearance of p62 would dampen the amino acid-sensing mechanism for mTORC1 (65). We also tested the induction of the two autophagy-mediating genes, ATG5 and ATG12, whose expressions were shown to increase via ATF4 during ER stress in MEFs (60). Depletion of ATF4 had little effect on the induction of ATG5 and ATG12 mRNAs during prolonged stress (12 and 18 h) despite some degree of difference during early stress (Fig. 6C). Regulation of the CHOP gene by ATF4 depletion (Fig. 6C) was similar to previous reports (26). Overall, these data suggested that MIN6 β cells might have ATF4-independent mechanisms to regulate the autophagy gene program during ER stress.
Finally, we investigated the importance of amino acid flux in mTORC1-targeted protein phosphorylation during prolonged stress in MIN6 cells. We have shown previously that Tg-treated MIN6 cells have increased activity of systems L (transports Leu, Ile, Val, Met, Phe, Trp, and Tyr) and A (transports Ala, Ser, Gln, Gly, and Pro) (26). Furthermore, we have also characterized these two amino acid flux systems in MIN6 cells, making this cell type a good experimental system to determine the cross-communication between the amino acid transporters and mTORC1 signaling during prolonged stress. We first determined the intracellular amino acid levels in MIN6 cells under 18 h of Tg treatment as described under “Experimental Procedures.” It is shown here that the intracellular levels of most amino acids increased during Tg treatment (Fig. 6D). These data support the conclusion that amino acid flux contributes to protein synthesis and mTORC1 activity via the increase of the intracellular amino acid pool. As mentioned earlier, system L activity positively regulates mTORC1 signaling (57). To directly test the hypothesis that inhibition of system L activity during prolonged stress negatively regulates mTORC1 signaling, we applied the inhibitors of system L (2-aminobicyclo-(2,2,1)-heptane-2-carboxylic acid and α-methyl-dl-tryptophan) at increasing concentrations during the 18-h Tg treatment in MIN6 cells. We have shown previously that these inhibitors abolish system L-mediated amino acid flux in MIN6 cells (26). It is shown here that addition of system L inhibitors decreased mTORC1-mediated protein phosphorylation (Fig. 6, E and F, S6K-P (Thr389) and S6-P (Ser235/236)) and protein synthesis rates (Fig. 6G) in agreement with a direct effect of amino acid uptake on mTORC1 signaling and protein synthesis during chronic ER stress. As a control, we also showed that depletion of Leu during the 18-h Tg treatment decreased mTORC1 activity in a manner similar to the inhibition of the Leu transporter, system L (Fig. 6, E and F, −Leu).
We have shown previously that a network of amino acid transporters is required for system L-mediated Leu uptake in MIN6 cells during ER stress (Fig. 7A) (26). It is also known that the activity of some transporters is influenced by post-translational glycosylation (66). As an additional test to our hypothesis that amino acid flux contributes to the mTORC1 signaling during prolonged ER stress in MIN6 cells, we hypothesized that the inhibition of glycosylation would differentially regulate amino acid flux mediated from systems L, A, and ASC, thus influencing downstream signaling. It was shown previously that system y+ activity is insensitive to the absence of glycosylation on the Slc7a1 amino acid transporter (67). In contrast, system A has been reported to show reduced activity by inhibition of glycosylation (68). Here we tested the effect of tunicamycin (Tu), an inhibitor of protein glycosylation, on the Tg-mediated amino acid flux (Fig. 7B) by systems L (Slc7a5; Leu), ASC (Slc1a5; Gln), A (SNAT2; MeAIB), and y+ (Slc7a1; Arg). We hypothesized that a functional disturbance of the network of transporters (Fig. 7) will further decrease the mTORC1-targeted protein phosphorylation.
We first tested the effect of Tu on amino acid uptake in MIN6 cells treated with Tg for 18 h. It is shown here (Fig. 7B) that the inclusion of Tu during Tg treatment impaired the uptake activity of Gln (system ASC) and MeAIB (an Ala derivative; a substrate for system A). In contrast, the uptake of Leu (system L) was not affected by the addition of Tu during the 18-h Tg treatment (Fig. 7B, Leu). As an experimental control, we also tested the uptake of Arg (system y+), which is insensitive to the inhibition of glycosylation (Fig. 7B, Arg) in agreement with a previous report (67). The decreased uptake of Gln and MeAIB in MIN6 cells treated with both drugs (Tg and Tu) was not the result of lower expression of mRNAs encoding the corresponding transporters, Slc1a5 and SNAT2, respectively (Fig. 7C). It should be noted that despite the fact that the system L activity did not change with the inclusion of Tu the activity of systems A and ASC decreased significantly (Fig. 7B). Because Gln is required as an efflux substrate for system L to increase intracellular Leu levels and other branched-chain amino acids during prolonged ER stress, it was expected that impaired uptake of Gln due to the absence of glycosylation (Fig. 7B) would cause a long term disturbance in the transporter network and affect downstream mTORC1 activity. We next tested the effect of Tu on mTORC1 signaling during Tg treatment in MIN6 cells. We showed that addition of Tu during prolonged Tg treatment in MIN6 cells further decreased mTORC1-targeted protein phosphorylation (Fig. 7D, S6K-P (Thr389) and S6-P (Ser235/236)). Taken together, these data support the conclusion that transporter protein glycosylation is important for the regulation of amino acid flux by the network of amino acid transporters during prolonged ER stress.
DISCUSSION
The cross-talk between the UPR and the mTORC1 signaling is an emerging research area (46). Given that stress induces catabolic processes and mTORC1 mediates anabolic responses, one would expect the mTORC1 signaling to be inhibited during the UPR. However, a few reports describe concurrent mTORC1 activity and UPR induction, and in some cases, increased mTORC1 activity during ER stress was directly linked to pathogenesis (69, 70).
We investigated the contribution of the mTORC1 signaling in translational control and the mechanism that regulates mTORC1 activity during ER stress. We tested the possibility of a cross-talk between the eIF2α-P/ATF4 signaling and the regulation of mTORC1 activity. We found that in addition to the well characterized eIF2α-P-dependent mechanisms for translational repression during ER stress suppression of mTORC1 activity was in parallel to the eIF2α-P mechanism and it independently caused the decline of protein synthesis during chronic ER stress. During early stress, we showed that the eIF2α-P signaling was correlated with the transient increase of AKT and mTORC1 activities (Figs. 1B and 4A). This observation was in agreement with previous studies showing that the activation of either PERK or PKR in response to stress leads to an early induction of the PI3K-AKT-mTOR pathway via the increased eIF2α-P (52, 71). This early response is followed by a gradual decline of the PI3K-AKT-mTOR through the induction of negative feedback regulatory mechanisms. Such mechanisms may include either an mTORC1-mediated negative regulation of IRS1/2 (72–74) or a GSK3-β-mediated inactivation of mTORC2 by the phosphorylation of Rictor at Ser1235, a modification that compromises AKT activation by phosphorylation at Ser473 (75).
We also showed that the eIF2α-P/ATF4 signaling promoted mTORC1 activity via the induced expression of an amino acid transporter network resulting in increased system L-mediated uptake of Leu, thus ameliorating the effects of mTORC1-mediated inhibition of protein synthesis during chronic ER stress. The eIF2α-P-independent translational inhibition during ER stress involved the decreased translation of mRNAs encoding anabolic proteins, including proteins responsible for the translational machinery, ribosomal proteins, and TOP mRNAs in general. Our findings place mTORC1 as a downstream target of the proanabolic functions of the eIF2α-P/ATF4 signaling. Fig. 8 has a schematic representation of our findings. These anabolic functions can promote survival or death during chronic stress in a manner dependent on the respective cell types. As we have shown for pancreatic β cells, the recovery of protein synthesis decreased survival during chronic stress (26). Therefore, modulating bulk protein synthesis rates via the eIF2α-P/ATF4/mTORC1 signaling may have an impact on survival or death decisions during ER stress.
FIGURE 8.
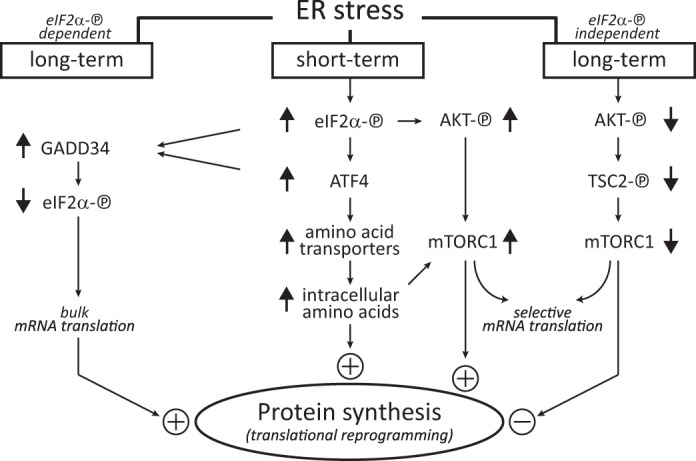
Diagrammatic representation of stress-induced pathways during early and late ER stress leading to the modulation of bulk protein synthesis. Based on the data in this study, the eIF2α-P signaling contributes to positive regulation of protein synthesis during chronic ER stress via the ATF4-mediated induction of amino acid transporters (26) and mTORC1-mediated translational control. During long term stress, the eIF2α-P-independent decrease of protein synthesis involves the suppression of mTORC1-mediated translational control. The increased expression of the amino acid transporter network leads to increased intracellular amino acid levels that attenuate the dramatic decline of mTORC1-mediated mRNA translation during prolonged stress. These stress-induced pathways along with other reported mechanisms (21, 24, 26, 28) contribute to our better understanding of translational reprogramming during chronic ER stress. The diagram includes the well known late stress response of translational recovery via the ATF4-mediated induction of GADD34 and subsequent dephosphorylation of eIF2α-P.
A recent report referred to the decline of mTORC1 activity during prolonged ER stress as a second node of translational control (35). The authors showed that the decreased mTORC1 activity was correlated with increased AMP-activated protein kinase activity and TSC2 phosphorylation on Ser1387, a known AMP-activated protein kinase phosphorylation site (76). TSC2 phosphorylation at Ser1387 inhibits Rheb-mediated activation of mTORC1 (73). The same authors did not observe this regulation in MEFs (35). In our studies, we also did not observe the activation of AMP-activated protein kinase in MEFs (data not shown). Instead, we observed decreased phosphorylation of TSC2 at the AKT phosphorylation site Ser939. Decreased phosphorylation of TSC2 at Ser939 causes its activation, leading to the suppression of mTORC1 activity (77). In agreement with this observation, a dramatic decrease of AKT activity was observed during prolonged stress (Fig. 4A). It has been suggested that mTORC1 activation during ER stress negatively regulates the PI3K-AKT pathway, leading to decreased AKT activity (49). However, in our studies, we observed a decrease of AKT activity during ER stress independently of mTORC1 activation. S/S and A/A cells both showed decreased AKT Ser473 phosphorylation during prolonged stress, although only S/S cells showed a transient increase in mTORC1 signaling (Fig. 4A, compare S/S and A/A). Collectively, previous studies (52, 53) and this report point to the regulation of AKT/mTORC1 signaling during ER stress via mechanisms that involve growth factor signaling. It is likely that decreased growth factor signaling during chronic stress results in the eIF2α-P-independent decline of mTORC1 activity and in turns translational inhibition. Genetic mutations of proteins that act upstream of the mTORC1 signaling may also contribute to the cellular response to chronic ER stress (46).
We have shown that the efficiency of translation from different mRNAs varied during chronic ER stress in a manner that involved the eIF2α-P signaling. In the absence of eIF2α-P, we observed a more extensive inhibition of mRNA translation, which paralleled mTORC1 inactivation (Fig. 3). A recent report showed that mTORC1-mediated translational control involves, almost exclusively, mRNAs that are either characterized as TOP mRNAs or recently recognized TOP-like mRNAs (10). This previous study, by comparing the degree of association of mRNAs with polysomes between control and Torin 1-treated MEFs (complete inhibition of mTORC1), revealed the mRNAs under the mTORC-1-mediated translational control in unstressed cells (10). However, in physiological or even pathological conditions of stress, we expect changes in mTORC1 activity but not complete inhibition as occurs in the case of Torin 1-treatment. Therefore, it is possible that the degree of mTORC1 inhibition will be reflected from differential responses of the mRNAs that are reported as being under the translational control of mTORC1-dependent signaling (78, 79). In our study, we believe that we have such a scenario, which is in agreement with a recent report (80). Although the majority of the TOP mRNAs tested showed translational inhibition during prolonged stress in parallel with decreased mTORC1 activity, a few TOP and TOP-like mRNAs were not or were less inhibited in eIF2α-P-competent cells (Fig. 3, S/S). Future studies using a transcriptome-scale ribosome profiling approach can identify the entire population of TOP and TOP-like mRNAs that are differentially translated during chronic ER stress.
The novel idea presented in this study is the contribution of amino acid transporters to the intracellular amino acid pool during chronic ER stress in sustaining protein synthesis rates via mTORC1-mediated translational control (Fig. 8). Activation of mTORC1 signaling via amino acid sensing has long been recognized (9, 79). More recently, the mechanism of amino acid sensing by mTORC1 was described as the coordinated actions of Leu, leucyl-tRNA synthetase, and lysosome-associated RAG GTPases, leading to the activation of mTORC1 on lysosomal membranes (31, 32, 81–83). The involvement of amino acid transporters in the regulation of mTORC1 activity has only been described in cancer cells, which demand high levels of the amino acid Gln for their growth (57). We have shown here and in a recent report (26) that a network of amino acid transporters is induced during chronic ER stress, leading to increased amino acid flux, tRNA aminoacylation, and bulk protein synthesis rates. The link between activation of the amino acid transporter network consisting of at least systems L, ASC, and A (Fig. 7A) and mTORC1 activity during chronic ER stress is recognized for the first time in this study (Fig. 8). The mechanism that activates mTORC1 downstream of the amino acid transporter network is likely to be similar to the previously described lysosomal membrane activation of RAG GTPases (32, 81–83). Although we did not study this mechanism in detail, the idea is supported by the findings of increased intracellular levels of Leu (Figs. 5G and 6D), increased levels of leucyl-tRNA synthetase (Fig. 5A), and increased levels of the signaling adaptor protein p62 (Figs. 4B and 6B). Overall, different mechanisms may operate in the regulation of mTORC1 activity during chronic ER stress with the amino acid transporter network being a positive regulator downstream of the eIF2α-P/ATF4 axis in the cellular response to stress. The eIF2α-P/ATF4 axis has also been described to negatively regulate mTORC1 during stress by either the REDD1 (regulated in DNA damage and development 1) (84, 85) or TRB3 (Tribbles homolog 3) protein (86, 87). We have shown that, in ATF4-overexpressing cells deficient of eIF2α-P, mTORC1 activity increased during prolonged stress (Fig. 5, A and B), suggesting that in A/A cells the outcome of ATF4-mediated gene expression is a positive regulation of mTORC1.
The significance of increased mTORC1 activity during ER stress is not a well studied area. A few reports have linked the presence of mTORC1 activity during ER stress to apoptosis (88, 89) or the development of disease such as dyslipidemia (69) and decreased insulin receptor signaling in obesity (90). The latter cases involve cellular responses to chronic ER stress. Although the underlying mechanisms for the pathogenic functions of mTORC1 during ER stress are not clear, it is evident that active mTORC1 amplifies the induction of UPR (91). We found that the eIF2α-P/ATF4/mTORC1 signaling contributes to the translational control during prolonged ER stress. Our data suggest that by sustaining mTORC1 activity during chronic ER stress an increase in protein synthesis would be expected via the up-regulation of the translation machinery and ribosomal RNA transcription and processing. mTORC1-mediated amplification of the UPR markers lies downstream of the global maintenance of protein synthesis.
Another important cellular response to stress is the induction of autophagy (55). As shown here and by others (92), the eIF2α-P/ATF4 signaling positively regulates the expression of genes involved in autophagy in MEFs (Fig. 4). However, cell type differences were also observed with MIN6 cells showing increased expression of autophagy-related genes independently of ATF4 (Fig. 6). The latter is in agreement with the literature on alternative transcription programs in β cells (93). The prosurvival role of autophagy during ER stress was demonstrated in an elegant study by Leibowitz and co-workers (94) via the use of mouse models of diabetes. In addition, induction of autophagy in Paneth cells from models of inflammatory bowel disease protected cells from ER stress-induced apoptosis (95). It is well established that mTORC1 is a negative regulator of autophagy (96–98). In fact, inhibition of mTORC1 during ER stress increased autophagy and attenuated cellular stress and apoptosis (34). However, autophagy can also generate free amino acids, which can in turn activate mTORC1, thus limiting self-digestion of the stressed cells (57). In this study, we used Tg as an inducer of ER stress, an experimental system known to inhibit autophagy (43). Therefore, we studied the mTORC1 activation during chronic ER stress in the absence of autophagy-generated amino acids. The increased intracellular pool of amino acids was most likely the result of regulated amino acid flux (Fig. 6). From our studies and reports in the literature, we can conclude that uncontrolled mTORC1 activity during chronic stress may influence cell survival either by translational control mechanisms or via the modulation of autophagy.
In conclusion, we have shown that the absence of stress-induced eIF2α-P signaling causes global translational shutdown in a timely fashion without the signs of recovery. This suppression of protein synthesis depends at first on decreased mTORC1 activity and subsequent TOP and TOP-like mRNA translational inhibition. However, a second wave of translational inhibition downstream of mTORC1 is the decreased efficiency of translation from non-TOP ribosomal protein mRNAs and decreased ribosomal RNA transcription and processing. Although the eIF2α-P/ATF4 axis has been extensively described in promoting protein synthesis via gene expression programs, our current study introduces a new dimension in the complexity of the cellular response to chronic ER stress via the positive effects on the mTORC1 signaling by the eIF2α-P/ATF4-mediated induction of an amino acid transporter network.
Acknowledgments
We thank Jing Wu and Scott A. Becka, Case Western Reserve University, for technical assistance. We thank Dr. Michael T. McManus, University of California San Francisco, for providing MIN6 cells. We also thank Dr. Maria Figueiredo-Pereira, Hunter College of City University of New York, for assisting us with the studies involving the ATG5−/− cells.
This work was supported, in whole or in part, by National Institutes of Health Grants R37-DK060596 and R01-DK053307 (to M. H.) and R01-DK013499 (to S. R. K.). This work was also supported by Canadian Institutes of Health Research Grant MOP-38160 (to A. E. K.) and a Quebec Breast Cancer Foundation grant (to A. E. K.).
- mTORC1
- mammalian target of rapamycin kinase protein complex 1
- A/A cells
- eIF2α-S51A mutant (eIF2α-P-deficient) MEFs
- eEF2
- eukaryotic elongation factor 2
- eIF2α-P
- phosphorylation of eIF2α
- ER
- endoplasmic reticulum
- ISR
- integrated stress response
- MEFs
- mouse embryonic fibroblasts
- MIN6
- mouse insulinoma cell line 6
- qPCR
- quantitative PCR
- S6K
- p70 S6 kinase
- S/S cells
- WT (eIF2α-P-competent) MEFs
- Tg
- thapsigargin
- TOP
- 5′-terminal oligopyrimidine
- Tu
- tunicamycin
- UPR
- unfolded protein response
- MeAIB
- methylaminoisobutyrate
- shCtrl
- control shRNA
- shATF4
- ATF4 shRNA
- mTOR
- mammalian target of rapamycin
- CHOP
- C/EBP (CCAAT/enhancer-binding protein) homologous protein.
REFERENCES
- 1. Ron D., Harding H. P. (2012) Protein-folding homeostasis in the endoplasmic reticulum and nutritional regulation. Cold Spring Harb. Perspect. Biol. 4, a013177. [DOI] [PMC free article] [PubMed] [Google Scholar]
- 2. Kaufman R. J., Scheuner D., Schröder M., Shen X., Lee K., Liu C. Y., Arnold S. M. (2002) The unfolded protein response in nutrient sensing and differentiation. Nat. Rev. Mol. Cell Biol. 3, 411–421 [DOI] [PubMed] [Google Scholar]
- 3. Kimball S. R. (2002) Regulation of global and specific mRNA translation by amino acids. J. Nutr. 132, 883–886 [DOI] [PubMed] [Google Scholar]
- 4. Kimball S. R., Jefferson L. S. (2005) Role of amino acids in the translational control of protein synthesis in mammals. Semin. Cell Dev. Biol. 16, 21–27 [DOI] [PubMed] [Google Scholar]
- 5. Kimball S. R., Jefferson L. S. (2010) Control of translation initiation through integration of signals generated by hormones, nutrients, and exercise. J. Biol. Chem. 285, 29027–29032 [DOI] [PMC free article] [PubMed] [Google Scholar]
- 6. Laplante M., Sabatini D. M. (2012) mTOR signaling in growth control and disease. Cell 149, 274–293 [DOI] [PMC free article] [PubMed] [Google Scholar]
- 7. Lamming D. W., Sabatini D. M. (2013) A central role for mTOR in lipid homeostasis. Cell Metab. 18, 465–469 [DOI] [PMC free article] [PubMed] [Google Scholar]
- 8. Buel G. R., Kim S. G., Blenis J. (2013) mTORC1 signaling aids in CADalyzing pyrimidine biosynthesis. Cell Metab. 17, 633–635 [DOI] [PubMed] [Google Scholar]
- 9. Jewell J. L., Russell R. C., Guan K. L. (2013) Amino acid signalling upstream of mTOR. Nat. Rev. Mol. Cell Biol. 14, 133–139 [DOI] [PMC free article] [PubMed] [Google Scholar]
- 10. Thoreen C. C., Chantranupong L., Keys H. R., Wang T., Gray N. S., Sabatini D. M. (2012) A unifying model for mTORC1-mediated regulation of mRNA translation. Nature 485, 109–113 [DOI] [PMC free article] [PubMed] [Google Scholar]
- 11. Mahoney S. J., Dempsey J. M., Blenis J. (2009) Cell signaling in protein synthesis ribosome biogenesis and translation initiation and elongation. Prog. Mol. Biol. Transl. Sci. 90, 53–107 [DOI] [PubMed] [Google Scholar]
- 12. Jastrzebski K., Hannan K. M., Tchoubrieva E. B., Hannan R. D., Pearson R. B. (2007) Coordinate regulation of ribosome biogenesis and function by the ribosomal protein S6 kinase, a key mediator of mTOR function. Growth Factors 25, 209–226 [DOI] [PubMed] [Google Scholar]
- 13. Browne G. J., Proud C. G. (2004) A novel mTOR-regulated phosphorylation site in elongation factor 2 kinase modulates the activity of the kinase and its binding to calmodulin. Mol. Cell. Biol. 24, 2986–2997 [DOI] [PMC free article] [PubMed] [Google Scholar]
- 14. Mayer C., Zhao J., Yuan X., Grummt I. (2004) mTOR-dependent activation of the transcription factor TIF-IA links rRNA synthesis to nutrient availability. Genes Dev. 18, 423–434 [DOI] [PMC free article] [PubMed] [Google Scholar]
- 15. Iadevaia V., Zhang Z., Jan E., Proud C. G. (2012) mTOR signaling regulates the processing of pre-rRNA in human cells. Nucleic Acids Res. 40, 2527–2539 [DOI] [PMC free article] [PubMed] [Google Scholar]
- 16. Sonenberg N., Hinnebusch A. G. (2009) Regulation of translation initiation in eukaryotes: mechanisms and biological targets. Cell 136, 731–745 [DOI] [PMC free article] [PubMed] [Google Scholar]
- 17. Baird T. D., Wek R. C. (2012) Eukaryotic initiation factor 2 phosphorylation and translational control in metabolism. Adv. Nutr. 3, 307–321 [DOI] [PMC free article] [PubMed] [Google Scholar]
- 18. Palam L. R., Baird T. D., Wek R. C. (2011) Phosphorylation of eIF2 facilitates ribosomal bypass of an inhibitory upstream ORF to enhance CHOP translation. J. Biol. Chem. 286, 10939–10949 [DOI] [PMC free article] [PubMed] [Google Scholar]
- 19. Vattem K. M., Wek R. C. (2004) Reinitiation involving upstream ORFs regulates ATF4 mRNA translation in mammalian cells. Proc. Natl. Acad. Sci. U.S.A. 101, 11269–11274 [DOI] [PMC free article] [PubMed] [Google Scholar]
- 20. Lu P. D., Harding H. P., Ron D. (2004) Translation reinitiation at alternative open reading frames regulates gene expression in an integrated stress response. J. Cell Biol. 167, 27–33 [DOI] [PMC free article] [PubMed] [Google Scholar]
- 21. Lee Y. Y., Cevallos R. C., Jan E. (2009) An upstream open reading frame regulates translation of GADD34 during cellular stresses that induce eIF2α phosphorylation. J. Biol. Chem. 284, 6661–6673 [DOI] [PMC free article] [PubMed] [Google Scholar]
- 22. Zhou D., Palam L. R., Jiang L., Narasimhan J., Staschke K. A., Wek R. C. (2008) Phosphorylation of eIF2 directs ATF5 translational control in response to diverse stress conditions. J. Biol. Chem. 283, 7064–7073 [DOI] [PubMed] [Google Scholar]
- 23. Komar A. A., Hatzoglou M. (2005) Internal ribosome entry sites in cellular mRNAs: mystery of their existence. J. Biol. Chem. 280, 23425–23428 [DOI] [PubMed] [Google Scholar]
- 24. Novoa I., Zeng H., Harding H. P., Ron D. (2001) Feedback inhibition of the unfolded protein response by GADD34-mediated dephosphorylation of eIF2α. J. Cell Biol. 153, 1011–1022 [DOI] [PMC free article] [PubMed] [Google Scholar]
- 25. Harding H. P., Zhang Y., Zeng H., Novoa I., Lu P. D., Calfon M., Sadri N., Yun C., Popko B., Paules R., Stojdl D. F., Bell J. C., Hettmann T., Leiden J. M., Ron D. (2003) An integrated stress response regulates amino acid metabolism and resistance to oxidative stress. Mol. Cell 11, 619–633 [DOI] [PubMed] [Google Scholar]
- 26. Krokowski D., Han J., Saikia M., Majumder M., Yuan C. L., Guan B. J., Bevilacqua E., Bussolati O., Bröer S., Arvan P., Tchórzewski M., Snider M. D., Puchowicz M., Croniger C. M., Kimball S. R., Pan T., Koromilas A. E., Kaufman R. J., Hatzoglou M. (2013) A self-defeating anabolic program leads to β-cell apoptosis in endoplasmic reticulum stress-induced diabetes via regulation of amino acid flux. J. Biol. Chem. 288, 17202–17213 [DOI] [PMC free article] [PubMed] [Google Scholar]
- 27. Ron D., Walter P. (2007) Signal integration in the endoplasmic reticulum unfolded protein response. Nat. Rev. Mol. Cell Biol. 8, 519–529 [DOI] [PubMed] [Google Scholar]
- 28. Han J., Back S. H., Hur J., Lin Y. H., Gildersleeve R., Shan J., Yuan C. L., Krokowski D., Wang S., Hatzoglou M., Kilberg M. S., Sartor M. A., Kaufman R. J. (2013) ER-stress-induced transcriptional regulation increases protein synthesis leading to cell death. Nat. Cell Biol. 15, 481–490 [DOI] [PMC free article] [PubMed] [Google Scholar]
- 29. Hyde R., Taylor P. M., Hundal H. S. (2003) Amino acid transporters: roles in amino acid sensing and signalling in animal cells. Biochem. J. 373, 1–18 [DOI] [PMC free article] [PubMed] [Google Scholar]
- 30. Hundal H. S., Taylor P. M. (2009) Amino acid transceptors: gate keepers of nutrient exchange and regulators of nutrient signaling. Am. J. Physiol. Endocrinol. Metab. 296, E603–E613 [DOI] [PMC free article] [PubMed] [Google Scholar]
- 31. Han J. M., Jeong S. J., Park M. C., Kim G., Kwon N. H., Kim H. K., Ha S. H., Ryu S. H., Kim S. (2012) Leucyl-tRNA synthetase is an intracellular leucine sensor for the mTORC1-signaling pathway. Cell 149, 410–424 [DOI] [PubMed] [Google Scholar]
- 32. Bar-Peled L., Chantranupong L., Cherniack A. D., Chen W. W., Ottina K. A., Grabiner B. C., Spear E. D., Carter S. L., Meyerson M., Sabatini D. M. (2013) A tumor suppressor complex with GAP activity for the Rag GTPases that signal amino acid sufficiency to mTORC1. Science 340, 1100–1106 [DOI] [PMC free article] [PubMed] [Google Scholar]
- 33. Moscat J., Diaz-Meco M. T. (2011) Feedback on fat: p62-mTORC1-autophagy connections. Cell 147, 724–727 [DOI] [PMC free article] [PubMed] [Google Scholar]
- 34. Qin L., Wang Z., Tao L., Wang Y. (2010) ER stress negatively regulates AKT/TSC/mTOR pathway to enhance autophagy. Autophagy 6, 239–247 [DOI] [PubMed] [Google Scholar]
- 35. Preston A. M., Hendershot L. M. (2013) Examination of a second node of translational control in the unfolded protein response. J. Cell Sci. 126, 4253–4261 [DOI] [PMC free article] [PubMed] [Google Scholar]
- 36. Scheuner D., Song B., McEwen E., Liu C., Laybutt R., Gillespie P., Saunders T., Bonner-Weir S., Kaufman R. J. (2001) Translational control is required for the unfolded protein response and in vivo glucose homeostasis. Mol. Cell 7, 1165–1176 [DOI] [PubMed] [Google Scholar]
- 37. Myeku N., Figueiredo-Pereira M. E. (2011) Dynamics of the degradation of ubiquitinated proteins by proteasomes and autophagy: association with sequestosome 1/p62. J. Biol. Chem. 286, 22426–22440 [DOI] [PMC free article] [PubMed] [Google Scholar]
- 38. Bevilacqua E., Wang X., Majumder M., Gaccioli F., Yuan C. L., Wang C., Zhu X., Jordan L. E., Scheuner D., Kaufman R. J., Koromilas A. E., Snider M. D., Holcik M., Hatzoglou M. (2010) eIF2α phosphorylation tips the balance to apoptosis during osmotic stress. J. Biol. Chem. 285, 17098–17111 [DOI] [PMC free article] [PubMed] [Google Scholar]
- 39. Majumder M., Huang C., Snider M. D., Komar A. A., Tanaka J., Kaufman R. J., Krokowski D., Hatzoglou M. (2012) A novel feedback loop regulates the response to endoplasmic reticulum stress via the cooperation of cytoplasmic splicing and mRNA translation. Mol. Cell. Biol. 32, 992–1003 [DOI] [PMC free article] [PubMed] [Google Scholar]
- 40. Li Y., Bevilacqua E., Chiribau C. B., Majumder M., Wang C., Croniger C. M., Snider M. D., Johnson P. F., Hatzoglou M. (2008) Differential control of the CCAAT/enhancer-binding protein β (C/EBPβ) products liver-enriched transcriptional activating protein (LAP) and liver-enriched transcriptional inhibitory protein (LIP) and the regulation of gene expression during the response to endoplasmic reticulum stress. J. Biol. Chem. 283, 22443–22456 [DOI] [PMC free article] [PubMed] [Google Scholar]
- 41. Harding H. P., Novoa I., Zhang Y., Zeng H., Wek R., Schapira M., Ron D. (2000) Regulated translation initiation controls stress-induced gene expression in mammalian cells. Mol. Cell 6, 1099–1108 [DOI] [PubMed] [Google Scholar]
- 42. Jackson T. R., Patterson S. I., Thastrup O., Hanley M. R. (1988) A novel tumour promoter, thapsigargin, transiently increases cytoplasmic free Ca2+ without generation of inositol phosphates in NG115-401L neuronal cells. Biochem. J. 253, 81–86 [DOI] [PMC free article] [PubMed] [Google Scholar]
- 43. Ganley I. G., Wong P. M., Gammoh N., Jiang X. (2011) Distinct autophagosomal-lysosomal fusion mechanism revealed by thapsigargin-induced autophagy arrest. Mol. Cell 42, 731–743 [DOI] [PMC free article] [PubMed] [Google Scholar]
- 44. Pavitt G. D., Ron D. (2012) New insights into translational regulation in the endoplasmic reticulum unfolded protein response. Cold Spring Harb. Perspect. Biol. 4, a012278. [DOI] [PMC free article] [PubMed] [Google Scholar]
- 45. Wek R. C., Cavener D. R. (2007) Translational control and the unfolded protein response. Antioxid. Redox Signal. 9, 2357–2371 [DOI] [PubMed] [Google Scholar]
- 46. Appenzeller-Herzog C., Hall M. N. (2012) Bidirectional crosstalk between endoplasmic reticulum stress and mTOR signaling. Trends Cell Biol. 22, 274–282 [DOI] [PubMed] [Google Scholar]
- 47. DuRose J. B., Scheuner D., Kaufman R. J., Rothblum L. I., Niwa M. (2009) Phosphorylation of eukaryotic translation initiation factor 2α coordinates rRNA transcription and translation inhibition during endoplasmic reticulum stress. Mol. Cell. Biol. 29, 4295–4307 [DOI] [PMC free article] [PubMed] [Google Scholar]
- 48. Gingras A. C., Raught B., Sonenberg N. (2004) mTOR signaling to translation. Curr. Top. Microbiol. Immunol. 279, 169–197 [DOI] [PubMed] [Google Scholar]
- 49. Hay N., Sonenberg N. (2004) Upstream and downstream of mTOR. Genes Dev. 18, 1926–1945 [DOI] [PubMed] [Google Scholar]
- 50. Zoncu R., Efeyan A., Sabatini D. M. (2011) mTOR: from growth signal integration to cancer, diabetes and ageing. Nat. Rev. Mol. Cell Biol. 12, 21–35 [DOI] [PMC free article] [PubMed] [Google Scholar]
- 51. Huang J., Manning B. D. (2009) A complex interplay between Akt, TSC2 and the two mTOR complexes. Biochem. Soc. Trans. 37, 217–222 [DOI] [PMC free article] [PubMed] [Google Scholar]
- 52. Kazemi S., Mounir Z., Baltzis D., Raven J. F., Wang S., Krishnamoorthy J. L., Pluquet O., Pelletier J., Koromilas A. E. (2007) A novel function of eIF2α kinases as inducers of the phosphoinositide-3 kinase signaling pathway. Mol. Biol. Cell 18, 3635–3644 [DOI] [PMC free article] [PubMed] [Google Scholar]
- 53. Dai C. L., Shi J., Chen Y., Iqbal K., Liu F., Gong C. X. (2013) Inhibition of protein synthesis alters protein degradation through activation of protein kinase B (AKT). J. Biol. Chem. 288, 23875–23883 [DOI] [PMC free article] [PubMed] [Google Scholar]
- 54. Novoa I., Zhang Y., Zeng H., Jungreis R., Harding H. P., Ron D. (2003) Stress-induced gene expression requires programmed recovery from translational repression. EMBO J. 22, 1180–1187 [DOI] [PMC free article] [PubMed] [Google Scholar]
- 55. Díaz-Troya S., Pérez-Pérez M. E., Florencio F. J., Crespo J. L. (2008) The role of TOR in autophagy regulation from yeast to plants and mammals. Autophagy 4, 851–865 [DOI] [PubMed] [Google Scholar]
- 56. Kilberg M. S., Shan J., Su N. (2009) ATF4-dependent transcription mediates signaling of amino acid limitation. Trends Endocrinol. Metab. 20, 436–443 [DOI] [PMC free article] [PubMed] [Google Scholar]
- 57. Nicklin P., Bergman P., Zhang B., Triantafellow E., Wang H., Nyfeler B., Yang H., Hild M., Kung C., Wilson C., Myer V. E., MacKeigan J. P., Porter J. A., Wang Y. K., Cantley L. C., Finan P. M., Murphy L. O. (2009) Bidirectional transport of amino acids regulates mTOR and autophagy. Cell 136, 521–534 [DOI] [PMC free article] [PubMed] [Google Scholar]
- 58. Mizushima N., Komatsu M. (2011) Autophagy: renovation of cells and tissues. Cell 147, 728–741 [DOI] [PubMed] [Google Scholar]
- 59. Kuma A., Hatano M., Matsui M., Yamamoto A., Nakaya H., Yoshimori T., Ohsumi Y., Tokuhisa T., Mizushima N. (2004) The role of autophagy during the early neonatal starvation period. Nature 432, 1032–1036 [DOI] [PubMed] [Google Scholar]
- 60. B'chir W., Maurin A. C., Carraro V., Averous J., Jousse C., Muranishi Y., Parry L., Stepien G., Fafournoux P., Bruhat A. (2013) The eIF2α/ATF4 pathway is essential for stress-induced autophagy gene expression. Nucleic Acids Res. 41, 7683–7699 [DOI] [PMC free article] [PubMed] [Google Scholar]
- 61. Linares J. F., Duran A., Yajima T., Pasparakis M., Moscat J., Diaz-Meco M. T. (2013) K63 polyubiquitination and activation of mTOR by the p62-TRAF6 complex in nutrient-activated cells. Mol. Cell 51, 283–296 [DOI] [PMC free article] [PubMed] [Google Scholar]
- 62. Back S. H., Kaufman R. J. (2012) Endoplasmic reticulum stress and type 2 diabetes. Annu. Rev. Biochem. 81, 767–793 [DOI] [PMC free article] [PubMed] [Google Scholar]
- 63. Horzinski L., Kantor L., Huyghe A., Schiffmann R., Elroy-Stein O., Boespflug-Tanguy O., Fogli A. (2010) Evaluation of the endoplasmic reticulum-stress response in eIF2B-mutated lymphocytes and lymphoblasts from CACH/VWM patients. BMC Neurol. 10, 94. [DOI] [PMC free article] [PubMed] [Google Scholar]
- 64. Kubica N., Jefferson L. S., Kimball S. R. (2006) Eukaryotic initiation factor 2B and its role in alterations in mRNA translation that occur under a number of pathophysiological and physiological conditions. Prog. Nucleic Acid Res. Mol. Biol. 81, 271–296 [DOI] [PubMed] [Google Scholar]
- 65. Duran A., Amanchy R., Linares J. F., Joshi J., Abu-Baker S., Porollo A., Hansen M., Moscat J., Diaz-Meco M. T. (2011) p62 is a key regulator of nutrient sensing in the mTORC1 pathway. Mol. Cell 44, 134–146 [DOI] [PMC free article] [PubMed] [Google Scholar]
- 66. Bröer S. (2008) Amino acid transport across mammalian intestinal and renal epithelia. Physiol. Rev. 88, 249–286 [DOI] [PubMed] [Google Scholar]
- 67. Wang H., Klamo E., Kuhmann S. E., Kozak S. L., Kavanaugh M. P., Kabat D. (1996) Modulation of ecotropic murine retroviruses by N-linked glycosylation of the cell surface receptor/amino acid transporter. J. Virol. 70, 6884–6891 [DOI] [PMC free article] [PubMed] [Google Scholar]
- 68. Barber E. F., Handlogten M. E., Kilberg M. S. (1983) Induction of amino acid transport system A in rat hepatocytes is blocked by tunicamycin. J. Biol. Chem. 258, 11851–11855 [PubMed] [Google Scholar]
- 69. Ai D., Baez J. M., Jiang H., Conlon D. M., Hernandez-Ono A., Frank-Kamenetsky M., Milstein S., Fitzgerald K., Murphy A. J., Woo C. W., Strong A., Ginsberg H. N., Tabas I., Rader D. J., Tall A. R. (2012) Activation of ER stress and mTORC1 suppresses hepatic sortilin-1 levels in obese mice. J. Clin. Investig. 122, 1677–1687 [DOI] [PMC free article] [PubMed] [Google Scholar]
- 70. Inoki K., Mori H., Wang J., Suzuki T., Hong S., Yoshida S., Blattner S. M., Ikenoue T., Rüegg M. A., Hall M. N., Kwiatkowski D. J., Rastaldi M. P., Huber T. B., Kretzler M., Holzman L. B., Wiggins R. C., Guan K. L. (2011) mTORC1 activation in podocytes is a critical step in the development of diabetic nephropathy in mice. J. Clin. Investig. 121, 2181–2196 [DOI] [PMC free article] [PubMed] [Google Scholar]
- 71. Koromilas A. E., Mounir Z. (2013) Control of oncogenesis by eIF2α phosphorylation: implications in PTEN and PI3K-Akt signaling and tumor treatment. Future Oncol. 9, 1005–1015 [DOI] [PubMed] [Google Scholar]
- 72. Harrington L. S., Findlay G. M., Gray A., Tolkacheva T., Wigfield S., Rebholz H., Barnett J., Leslie N. R., Cheng S., Shepherd P. R., Gout I., Downes C. P., Lamb R. F. (2004) The TSC1–2 tumor suppressor controls insulin-PI3K signaling via regulation of IRS proteins. J. Cell Biol. 166, 213–223 [DOI] [PMC free article] [PubMed] [Google Scholar]
- 73. Shah O. J., Wang Z., Hunter T. (2004) Inappropriate activation of the TSC/Rheb/mTOR/S6K cassette induces IRS1/2 depletion, insulin resistance, and cell survival deficiencies. Curr. Biol. 14, 1650–1656 [DOI] [PubMed] [Google Scholar]
- 74. Wan X., Harkavy B., Shen N., Grohar P., Helman L. J. (2007) Rapamycin induces feedback activation of Akt signaling through an IGF-1R-dependent mechanism. Oncogene 26, 1932–1940 [DOI] [PubMed] [Google Scholar]
- 75. Chen C. H., Shaikenov T., Peterson T. R., Aimbetov R., Bissenbaev A. K., Lee S. W., Wu J., Lin H. K., Sarbassov D. D. (2011) ER stress inhibits mTORC2 and Akt signaling through GSK-3β-mediated phosphorylation of rictor. Sci. Signal 4, ra10. [DOI] [PubMed] [Google Scholar]
- 76. Inoki K., Zhu T., Guan K. L. (2003) TSC2 mediates cellular energy response to control cell growth and survival. Cell 115, 577–590 [DOI] [PubMed] [Google Scholar]
- 77. Inoki K., Li Y., Zhu T., Wu J., Guan K. L. (2002) TSC2 is phosphorylated and inhibited by Akt and suppresses mTOR signalling. Nat. Cell Biol. 4, 648–657 [DOI] [PubMed] [Google Scholar]
- 78. Conn C. S., Qian S. B. (2011) mTOR signaling in protein homeostasis: less is more? Cell Cycle 10, 1940–1947 [DOI] [PMC free article] [PubMed] [Google Scholar]
- 79. Efeyan A., Zoncu R., Sabatini D. M. (2012) Amino acids and mTORC1: from lysosomes to disease. Trends Mol. Med. 18, 524–533 [DOI] [PMC free article] [PubMed] [Google Scholar]
- 80. Kang S. A., Pacold M. E., Cervantes C. L., Lim D., Lou H. J., Ottina K., Gray N. S., Turk B. E., Yaffe M. B., Sabatini D. M. (2013) mTORC1 phosphorylation sites encode their sensitivity to starvation and rapamycin. Science 341, 1236566. [DOI] [PMC free article] [PubMed] [Google Scholar]
- 81. Sancak Y., Peterson T. R., Shaul Y. D., Lindquist R. A., Thoreen C. C., Bar-Peled L., Sabatini D. M. (2008) The Rag GTPases bind raptor and mediate amino acid signaling to mTORC1. Science 320, 1496–1501 [DOI] [PMC free article] [PubMed] [Google Scholar]
- 82. Sancak Y., Bar-Peled L., Zoncu R., Markhard A. L., Nada S., Sabatini D. M. (2010) Ragulator-Rag complex targets mTORC1 to the lysosomal surface and is necessary for its activation by amino acids. Cell 141, 290–303 [DOI] [PMC free article] [PubMed] [Google Scholar]
- 83. Sancak Y., Sabatini D. M. (2009) Rag proteins regulate amino-acid-induced mTORC1 signalling. Biochem. Soc. Trans. 37, 289–290 [DOI] [PMC free article] [PubMed] [Google Scholar]
- 84. Dennis M. D., McGhee N. K., Jefferson L. S., Kimball S. R. (2013) Regulated in DNA damage and development 1 (REDD1) promotes cell survival during serum deprivation by sustaining repression of signaling through the mechanistic target of rapamycin in complex 1 (mTORC1). Cell. Signal. 25, 2709–2716 [DOI] [PMC free article] [PubMed] [Google Scholar]
- 85. Whitney M. L., Jefferson L. S., Kimball S. R. (2009) ATF4 is necessary and sufficient for ER stress-induced upregulation of REDD1 expression. Biochem. Biophys. Res. Commun. 379, 451–455 [DOI] [PMC free article] [PubMed] [Google Scholar]
- 86. Matsushima R., Harada N., Webster N. J., Tsutsumi Y. M., Nakaya Y. (2006) Effect of TRB3 on insulin and nutrient-stimulated hepatic p70 S6 kinase activity. J. Biol. Chem. 281, 29719–29729 [DOI] [PubMed] [Google Scholar]
- 87. Ozcan L., Cristina de Souza J., Harari A. A., Backs J., Olson E. N., Tabas I. (2013) Activation of calcium/calmodulin-dependent protein kinase II in obesity mediates suppression of hepatic insulin signaling. Cell Metab. 18, 803–815 [DOI] [PMC free article] [PubMed] [Google Scholar]
- 88. Ozcan U., Ozcan L., Yilmaz E., Düvel K., Sahin M., Manning B. D., Hotamisligil G. S. (2008) Loss of the tuberous sclerosis complex tumor suppressors triggers the unfolded protein response to regulate insulin signaling and apoptosis. Mol. Cell 29, 541–551 [DOI] [PMC free article] [PubMed] [Google Scholar]
- 89. Kato H., Nakajima S., Saito Y., Takahashi S., Katoh R., Kitamura M. (2012) mTORC1 serves ER stress-triggered apoptosis via selective activation of the IRE1-JNK pathway. Cell Death Differ. 19, 310–320 [DOI] [PMC free article] [PubMed] [Google Scholar]
- 90. Bobrovnikova-Marjon E., Pytel D., Riese M. J., Vaites L. P., Singh N., Koretzky G. A., Witze E. S., Diehl J. A. (2012) PERK utilizes intrinsic lipid kinase activity to generate phosphatidic acid, mediate Akt activation, and promote adipocyte differentiation. Mol. Cell. Biol. 32, 2268–2278 [DOI] [PMC free article] [PubMed] [Google Scholar]
- 91. Reiling J. H., Sabatini D. M. (2008) Increased mTORC1 signaling UPRegulates stress. Mol. Cell 29, 533–535 [DOI] [PubMed] [Google Scholar]
- 92. Kouroku Y., Fujita E., Tanida I., Ueno T., Isoai A., Kumagai H., Ogawa S., Kaufman R. J., Kominami E., Momoi T. (2007) ER stress (PERK/eIF2α phosphorylation) mediates the polyglutamine-induced LC3 conversion, an essential step for autophagy formation. Cell Death Differ. 14, 230–239 [DOI] [PubMed] [Google Scholar]
- 93. Martina J. A., Chen Y., Gucek M., Puertollano R. (2012) MTORC1 functions as a transcriptional regulator of autophagy by preventing nuclear transport of TFEB. Autophagy 8, 903–914 [DOI] [PMC free article] [PubMed] [Google Scholar]
- 94. Bachar-Wikstrom E., Wikstrom J. D., Kaiser N., Cerasi E., Leibowitz G. (2013) Improvement of ER stress-induced diabetes by stimulating autophagy. Autophagy 9, 626–628 [DOI] [PMC free article] [PubMed] [Google Scholar]
- 95. Adolph T. E., Tomczak M. F., Niederreiter L., Ko H. J., Böck J., Martinez-Naves E., Glickman J. N., Tschurtschenthaler M., Hartwig J., Hosomi S., Flak M. B., Cusick J. L., Kohno K., Iwawaki T., Billmann-Born S., Raine T., Bharti R., Lucius R., Kweon M. N., Marciniak S. J., Choi A., Hagen S. J., Schreiber S., Rosenstiel P., Kaser A., Blumberg R. S. (2013) Paneth cells as a site of origin for intestinal inflammation. Nature 503, 272–276 [DOI] [PMC free article] [PubMed] [Google Scholar]
- 96. Egan D. F., Shackelford D. B., Mihaylova M. M., Gelino S., Kohnz R. A., Mair W., Vasquez D. S., Joshi A., Gwinn D. M., Taylor R., Asara J. M., Fitzpatrick J., Dillin A., Viollet B., Kundu M., Hansen M., Shaw R. J. (2011) Phosphorylation of ULK1 (hATG1) by AMP-activated protein kinase connects energy sensing to mitophagy. Science 331, 456–461 [DOI] [PMC free article] [PubMed] [Google Scholar]
- 97. Kim J., Kundu M., Viollet B., Guan K. L. (2011) AMPK and mTOR regulate autophagy through direct phosphorylation of Ulk1. Nat. Cell Biol. 13, 132–141 [DOI] [PMC free article] [PubMed] [Google Scholar]
- 98. Zhao M., Klionsky D. J. (2011) AMPK-dependent phosphorylation of ULK1 induces autophagy. Cell Metab. 13, 119–120 [DOI] [PMC free article] [PubMed] [Google Scholar]