

Background: The structure of C18ORF1 is similar to that of TMEPAI.
Results: C18ORF1 inhibits TGF-β signaling, but not BMP signaling, by its competition with SARA for Smad2/3 binding.
Conclusion: C18ORF1 is a surveillant during the steady state of TGF-β signaling, although it is helped by TMEPAI to inhibit TGF-β signaling in a coordinated manner.
Significance: C18ORF1 acts as a gatekeeper that abrogates excessive TGF-β signaling.
Keywords: Activin, EMT, Receptor Serine/threonine Kinase, SMAD Transcription Factor, Transforming Growth Factor β (TGFβ), C18ORF1, SARA, SIM, TMEPAI
Abstract
Transforming growth factor (TGF)-β signaling is deliberately regulated at multiple steps in its pathway from the extracellular microenvironment to the nucleus. However, how TGF-β signaling is activated or attenuated is not fully understood. We recently identified transmembrane prostate androgen-induced RNA (TMEPAI), which is involved in a negative feedback loop of TGF-β signaling. When we searched for a family molecule(s) for TMEPAI, we found C18ORF1, which, like TMEPAI, possesses two PY motifs and one Smad-interacting motif (SIM) domain. As expected, C18ORF1 could block TGF-β signaling but not bone morphogenetic protein signaling. C18ORF1 bound to Smad2/3 via its SIM and competed with the Smad anchor for receptor activation for Smad2/3 binding to attenuate recruitment of Smad2/3 to the TGF-β type I receptor (also termed activin receptor-like kinase 5 (ALK5)), in a similar fashion to TMEPAI. Knockdown of C18ORF1 prolonged duration of TGF-β-induced Smad2 phosphorylation and concomitantly potentiated the expression of JunB, p21, and TMEPAI mRNAs induced by TGF-β. Consistently, TGF-β-induced cell migration was enhanced by the knockdown of C18ORF1. These results indicate that the inhibitory function of C18ORF1 on TGF-β signaling is similar to that of TMEPAI. However, in contrast to TMEPAI, C18ORF1 was not induced upon TGF-β signaling. Thus, we defined C18ORF1 as a surveillant of steady state TGF-β signaling, whereas TMEPAI might help C18ORF1 to inhibit TGF-β signaling in a coordinated manner when cells are stimulated with high levels of TGF-β.
Introduction
Transforming growth factor-β (TGF-β) is a multifunctional cytokine that regulates the growth, differentiation, motility, apoptosis, and matrix protein production of a number of cell types (1, 2). The TGF-β family starts to transduce its signals via specific serine/threonine kinase receptors on the cell membrane. Then the canonical and noncanonical TGF-β signaling pathways into the cell are activated. In brief, after TGF-β binds to its type II receptor, the complex recruits TGF-β type I receptor (activin receptor-like kinase 5 (ALK5)) to make a ternary complex. Subsequently, TGF-β type II receptor kinase phosphorylates ALK5 in its juxtamembrane domain, termed the GS domain, to activate it. In the canonical TGF-β pathway, the adaptor proteins Smad anchor for receptor activation (SARA)3 and hepatocyte growth factor-regulated tyrosine kinase substrate/(Hgr/Hrs) recruit the activin/TGF-β receptor-regulated Smads (AR-Smads; i.e. Smad2 and Smad3) to the active ALK5, which phosphorylates AR-Smads at two serine residues located at their extreme C terminus. The two phosphorylated AR-Smads then make a heteromeric complex with one Smad4 to translocate to the nucleus, where this AR-Smads·Smad4 ternary complex transcriptionally regulates its target genes (3). However, the TGF-β pathways that do not transduce signals via Smads act as noncanonical TGF-β pathways, which include the p38, JNK, PI3K, Par6, and Rho pathways. These noncanonical TGF-β pathways are known to occasionally compensate the Smad pathway (3–8). Because the TGF-β family plays crucial roles in embryogenesis and maintenance of tissue homeostasis during adult life, a number of lines of evidence indicate that dysregulation of TGF-β signaling contributes to various disorders, including cancer, fibrosis, and vascular disorders (9, 10). To prevent excessive TGF-β signaling in cells, TGF-β signaling is tightly regulated at multiple steps from the extracellular microenvironment to the nucleus, including by entrapment of TGF-β ligands, decoy receptors, polyubiquitination, dephosphorylation, and interaction of Smads with transcriptional repressors or corepressors (11, 12).
Previously, we reported that TMEPAI, a direct target gene of TGF-β/activin signaling, inhibits TGF-β/activin signaling through a negative feedback loop. This inhibitory action of TMEPAI is due to its competition with SARA for binding to AR-Smads. Thus, active ALK5 cannot be provided with AR-Smads to terminate TGF-β/activin signaling (13). Because TMEPAI possesses unique motifs in its cytoplasmic region (two PY motifs that can interact with WW domain-containing proteins and one Smad-interacting motif (SIM) that can recognize AR-Smads), we searched for a TMEPAI family molecule(s) that also has a PY motif and SIM. Our screening yielded C18ORF1. C18ORF1 has a low density lipoprotein receptor class A domain-containing protein 4 in its extracellular domain and is a putative schizophrenia-related gene (14–16). However, its mechanism of action and physiological function are still unclear. Here, we show that C18ORF1 can specifically inhibit TGF-β signaling in a similar fashion to TMEPAI as a gatekeeper that abrogates excessive TGF-β signaling.
EXPERIMENTAL PROCEDURES
Expression Plasmids
Human C18ORF1 cDNA was cloned by RT-PCR. All of the C18ORF1 mutants were made by using a QuikChange site-directed mutagenesis kit (Stratagene) or PrimeStar HS DNA polymerase (Takara Bio). C18ORF1 and its mutants were inserted into pcDNA3.1-V5-His-A (Invitrogen), pcDNA3-HA, or pcDNA3-FLAG (17). All C18ORF1 constructs possessed the FLAG, HA, or V5 epitope tag at their C terminus. Adenoviruses expressing C18ORF1/V5 or C18ORF1(4A)/V5 were generated using the pAdTrack-CMV vector. After recombination of either pAdTrack-CMV-C18ORF1/V5 or pAdTrack-CMV-C18ORF1(4A)/V5 with pAdEasy-1 (18), the resulting plasmids were transfected into 293T cells, and the adenoviruses were amplified. The other constructs were previously described (13, 19–24).
Antibodies
Antibodies were obtained from the following sources: mouse monoclonal anti-FLAG M2, anti-FLAG M5, and anti-β-actin antibodies from Sigma; mouse polyclonal C18ORF1 antibody from Abnova; mouse monoclonal anti-p21, anti-Myc9E10, and anti-GFP antibodies from Santa Cruz Biotechnology; rat monoclonal anti-HA 3F10 antibodies from Roche Applied Science; mouse monoclonal V5 antibodies from Invitrogen; mouse monoclonal anti-E-cadherin and anti-Smad2/3 antibodies from BD Transduction Laboratories; and rabbit monoclonal anti-Smad3 antibody from Cell Signaling Technology. Rabbit polyclonal phosphorylated Smad2 and Smad1/3 antibodies were in-house (25).
Cell Culture
NMuMG, HaCaT, 911, 293, HeLa, A549, and COS7 cells were cultured in Dulbecco's modified Eagle's medium (Nacalai Tesque) containing 10% fetal calf serum (FCS; Invitrogen). HepG2 cells were maintained in minimum essential medium (Wako) containing 10% FCS, nonessential amino acids (Nacalai Tesque), and sodium pyruvate. Mouse embryonic fibroblasts (MEFs) from C18ORF1 and TMEPAI knock-out mice4 were prepared and cultured in DMEM containing 10% FCS.
Transcriptional Reporter Assays
One day before transfection, HepG2 cells were seeded at 1.0 × 10⁵ cells/well in 12-well plates. The cells were transfected using polyethyleneimine (Polysciences). Where indicated, 5 ng/ml TGF-β or 25 ng/ml BMP-6 was added to the wells 24 h after transfection. Subsequently, the cells were cultured in the absence of FCS for 18 h. In all experiments, β-galactosidase (pCH110; GE Healthcare) activity was measured to normalize for transfection efficiency. Each transfection was carried out in triplicate and repeated at least twice.
Immunoprecipitation and Western Blot Analysis
To detect interactions among proteins, plasmids were transfected into COS7 cells (5 × 10⁵ cells/6-cm dish) using polyethyleneimine. Forty hours after transfection, cells were lysed in 500 μl of TNE buffer (10 mm Tris (pH 7.4), 150 mm NaCl, 1 mm EDTA, 1% Nonidet P-40, 1 mm PMSF, 5 μg/ml leupeptin, 100 units/ml aprotinin, 2 mm sodium vanadate, 40 mm NaF, and 20 mm β-glycerophosphate). Cell lysates were precleared with protein G-Sepharose beads (GE Healthcare) for 30 min at 4 °C and then incubated with either anti-FLAG M5 or anti-FLAG M2 antibody for 2 h at 4 °C. Protein complexes were immunoprecipitated by incubation with protein G-Sepharose beads for 30 min at 4 °C and then washed three times with TNE buffer. Immunoprecipitated proteins and aliquots of total cell lysates were boiled for 5 min in sample buffer, separated by SDS-PAGE, and transferred to Hybond-C Extra membranes (GE Healthcare). The membranes were probed with primary antibodies. The primary antibodies were detected with horseradish peroxidase-conjugated secondary antibodies and chemiluminescent substrate (Thermo Scientific). Protein expression in total cell lysates was evaluated by Western blot analysis.
RNA Preparation and RT-PCR
Total RNA was extracted using an RNeasy Plus mini kit (Qiagen). Reverse transcription was performed with a High-Capacity RNA-to-cDNA kit (Applied Biosystems). PCR was performed using GoTaq (Promega) according to the manufacturer's instructions. To distinguish mRNA expressions among human C18ORF1α, C18ORF1β, and C18ORF1γ, three primer sets were synthesized as follows: 5′-ATGCCGGAAGCTGGTTTTCA-3′ and 5′-CGATGATGATGATTTGGGCG-3′ for C18ORF1α; 5′-AGGAACAGACGTGTGAGA-3′ and 5′-CGATGATGATGTTTGGGCG-3′ for C18ORF1β; and 5′-ATAACTGCAGCTCTGAGCTG-3′ and 5′-CGATGATGATGATTTGGGCG-3′ for C18ORF1γ. In addition, total expression of human C18ORF1 mRNAs was detected using one set of primers (5′-CGCCCAAATCATCATCATCG-3′ and 5′-AAGCGATCCCTCTGGATGAA-3′). The following primer sets were used to amplify TMEPAI, C18ORF1, SMAD6, JUNB, and β-ACTIN cDNAs: 5′-CAAGAGATGGCCACGGCTGCT-3′ and 5′-TCCTTCTGCATCCTGTCGGCA-3′ for human TMEPAI; 5′-CAGGAACTCAAAACCGTCAC-3′ and 5′-AATTCACCCGGAGCAGTGAT-3′ for human SMAD6; 5′-CCTCTCTCTACACGACTACA-3′ and 5′-CGTGGTTCATCTTGTGCAGA-3′ for human JUNB; 5′-CAAGAGATGGCCACGGCTGCT-3′ and 5′-TCCTTCTGCATCCTGTCGGCA-3′ for human β-ACTIN; 5′-CGCGCAGATCCTTATCATTG-3′ and 5′-GAATGGATCCCTCTGGATGA-3′ for mouse C18orf1; 5′-GTGATGATGGTGATGGTGGT-3′ and 5′-ATCAGACAGTGAGATGGTGG-3′ for mouse Tmepai; and 5′-GCTCATAGCTCTTCTCCAGGG-3′ and 5′-TGAACCCTAAGGCCAACCGTG-3′ for mouse β-Actin.
Quantitative Real Time-PCR Analysis
Preparation of total RNA, reverse transcription, and oligonucleotide DNA primers were described above. Quantitative PCR was performed with FastStart SYBR Green Master mix (Roche Applied Science). All reactions were carried out on a StepOne Plus (ABI). Each sample was analyzed in triplicate for each PCR measurement. Melting curves were checked to ensure specificity. Relative quantification of mRNA expression was calculated using the standard curve method with β-actin level.
Proximity Ligation Assay (PLA)
Cells on cover glasses coated with 0.1% gelatin were cultured with DMEM. Then the cover glasses were washed once with phosphate-buffered saline (PBS), fixed for 10 min with 4% paraformaldehyde (Wako), washed three times with PBS, permeabilized with 0.5% Triton X-100 in PBS for 10 min, and again washed three times with PBS.
The following procedures were performed according to the manufacturer's instructions (Olink Bioscience). To visualize the fluorescence, an immunofluorescence microscope (Nikon) was used.
Immunofluorescence Staining
Immunofluorescence staining was performed as described previously (13). Briefly, cells grown on the cover glasses were transfected with the indicated plasmids. If necessary, cells were stimulated with TGF-β for 2 h. After treatment, the glasses were washed once with PBS, fixed for 10 min with 4% paraformaldehyde, washed three times with PBS, permeabilized with 0.5% Triton X-100 in PBS for 10 min, and again washed three times with PBS. The cover glasses were blocked with 5% normal swine serum (Dako) in PBS at 37 °C for 1 h and incubated with 5% normal swine serum (in PBS) containing mouse monoclonal anti-V5 and rat monoclonal anti-HA3F10 antibodies at 4 °C overnight. The cover glasses were then washed three times with PBS, incubated with 5% normal swine serum (in PBS) containing both FITC-conjugated goat anti-mouse IgG antibody (diluted 1:250) (Invitrogen) and Texas Red-conjugated goat anti-rabbit IgG antibody (diluted 1:250) (Invitrogen) at room temperature for 1 h, and washed three times with PBS. Nuclei were stained with DAPI. To visualize the fluorescence, an immunofluorescence microscope was used.
siRNA for C18ORF1
C18ORF1-specific siRNA and control siRNA (Stealth RNAiTM Negative Universal Control Medium) were purchased from Invitrogen (Stealth RNAiTM). The sequence of siRNA for C18ORF1 was 5′-GCAGAACAAUGCAGAGAGCACAAUA-3′. Both siRNAs were transfected into 293 or HepG2 cells using Lipofectamine 2000 (Invitrogen).
Lentiviral shRNAs for C18ORF1
The lentiviral vectors for C18ORF1 shRNA (TRCN0000149106 and TRCN0000147058) and nontargeting shRNA (SHC002) were purchased from Sigma. Lentiviral vectors expressing shC18ORF1 were transfected into 293A cells together with psPAX2 and pMD2.G. After 48 h of transfection, the media were collected as a source of lentiviruses. Three different lentiviruses were simultaneously incubated in DMEM containing 8 μg/ml Polybrene (Sigma) for 2 h and then added to the A549 cell culture dishes. Twelve hours after infection, cells were washed and cultured in medium. Infected A549 cells, which became puromycin-resistant, were used for the experiments.
Adenoviral Infections
Adenoviruses were incubated in DMEM containing Polybrene (80 μg/ml) for 2 h and added to the dishes. Twenty four hours after infection, cells were washed with PBS and used for each experiment. If necessary, cells were starved by removal from the FCS overnight.
Actin Staining
A549 cells carrying C18ORF1 shRNAs were seeded at 1 × 10⁵ cells/well on cover glasses coated with 0.1% gelatin. Eighteen hours later, the cells were starved in DMEM, 1% FCS for 4 h and then stimulated with or without 5 ng/ml TGF-β for 36 h. After treatment, the slides were washed once with PBS, fixed for 10 min with 4% paraformaldehyde, washed three times with PBS, permeabilized with 0.1% Triton X-100 in PBS for 10 min, and again washed three times with PBS. Slides were blocked with 5% normal swine serum in PBS at 37 °C for 1 h and incubated with 5% normal swine serum (in PBS) containing rhodamine-conjugated phalloidin (diluted 1:200; Molecular Probes). The slides were then washed five times with PBS. To observe the nuclei, cells were further stained with DAPI. To visualize the fluorescence, a fluorescence microscope was used.
Scratch Assay
shRNA-carrying A549 cells were seeded in 12-well plates, grown until confluent, and wounded with a 200-μl tip. After wounding, 0.5 ng/ml TGF-β was added. Photographs were then taken using the time lapse microscopy (Nikon) for 48 h. For statistical analysis, the wound distance from each well was measured in duplicate at three randomly defined wound gap locations per frame recorded per experiment, and at least three independent scratch assays were used for the calculations.
RESULTS
Expression of C18ORF1
TMEPAI, a direct target gene of TGF-β signaling, has been characterized as a negative regulator of TGF-β signaling (13). When we tried to obtain a molecule(s) that exhibits high homology to TMEPAI, we found C18ORF1 (official symbol in NCBI website: LDLRAD4, low density lipoprotein receptor class A domain containing 4). In the NCBI database, C18ORF1 has six corresponding isoforms as follows: C18ORF1α1, C18ORF1α2, C18ORF1β1, C18ORF1β2, C18ORF1γ1, and C18ORF1γ2 (Fig. 1A). Comparison of the primary protein structure of C18ORF1α1 (the longest form of C18ORF1) with that of TMEPAI revealed that similarity between C18ORF1α1 and TMEPAI was 75 and 67% in the transmembrane and intracellular domains, respectively (Fig. 1B). However, the extracellular domains of C18ORF1α1 and TMEPAI have low similarity. The other five C18ORF1 isoforms also showed low homology with TMEPAI in their extracellular domains, which diverge among the C18ORF1 subfamily. TMEPAI has been reported to inhibit TGF-β signaling via its SIM domain (13). All of the C18ORF1 isoforms include the SIM domain in their structures (Fig. 1A). Thus, we speculated that C18ORF1 might act as a negative regulator of TGF-β signaling, like TMEPAI (see below). Among the six C18ORF1 isoforms, the C18ORF1γ subfamily was not detected in cells, whereas the transcript of the C18ORF1α subfamily in cells was generally higher than that of the C18ORF1β subfamily (Fig. 1C). Furthermore, the inhibitory action of TMEPAI did not depend on its extracellular domain (13). Thus, we used the C18ORF1α subfamily in the subsequent experiments.
FIGURE 1.

Comparison between C18ORF1 and TMEPAI. A, alternative splicing forms of C18ORF1. C18ORF1 has six isoforms. TM, transmembrane domain; PY, PY motif; SIM, Smad-interacting motif. B, alignment of amino acid sequences between C18ORF1α1 and TMEPAI. C, expression of C18ORF1 isoforms detected by RT-PCR. Total RNAs from HepG2, 293, and HeLa cells were prepared and followed by cDNA synthesis and PCR. Upper panel, whole C18ORF1 expression is shown. The upper and lower bands indicate C18ORF1 with and without 18 amino acids, respectively. The 2nd, 3rd, 4th, and bottom panels show expressions of C18ORF1α, C18ORF1β, and C18ORF1γ subfamily, and β-ACTIN mRNAs, respectively. D, effect of TGF-β or BMP on C18ORF1 mRNA expression. HepG2 cells were stimulated with either 5 ng/ml TGF-β or 25 ng/ml BMP-6 for indicated times. The RT-PCR was then performed using specific primer sets. The upper and lower bands corresponding to C18ORF1 mRNA indicate C18ORF1 and C18ORF1 without 18 amino acids in its cytoplasmic region, respectively. TMEPAI and Smad6 mRNA expressions were used as positive controls for TGF-β and BMP-6 stimulation, respectively. β-Actin mRNA was used as an internal control. E, expression of C18ORF1 and TMEPAI by quantitative PCR. All values represent mean ± S.D. Significantly different from the absence of TGF-β: *, p < 0.05; **, p < 0.01; ***, p < 0.001. F, colocalization of C18ORF1 with TMEPAI. Either C18ORF1α1/V5 (left panels) or C18ORF1α2/V5 (right panels) was transfected with TMEPAI/HA into 911 cells. Twenty four hours after transfection, cells were fixed and stained with mouse anti-V5 and rat anti-HA3F10 monoclonal antibodies. The Alexa488-conjugated goat anti-mouse and the Alexa555-conjugated goat anti-rat IgG antibodies (Molecular Probes) were used for visualization. Colocalization in the merge panel can be seen in yellow. Nuclear staining (blue) was carried out using DAPI. G, TMEPAI makes homomeric interaction as well as heteromeric interaction with C18ORF1α1. The cell lysates were immunoprecipitated (IP) with anti-FLAG M2 antibody and then analyzed by Western blot (WB) with anti-V5 antibody (upper panels). The middle and lower panels indicate total expressions of TMEPAI/V5 and C18ORF1α1/FLAG or TMEPAI/FLAG, respectively. H, homomeric and heteromeric complex between C18ORF1α1 and TMEPAI. The experiments were carried out according to the description above. Upper panel, heteromeric complex between C18ORF1α1 and TMEPAI or homomeric complex of C18ORF1α1. Middle panel, expression of C18ORF1α1/V5. Lower panel, expression of TMEPAI/FLAG and C18ORF1α1/FLAG. I, profile of C18orf1 mRNA expression in mouse tissues. Upper panel, expression of mouse C18orf1 mRNA (middle panel) expression of mouse Tmepai mRNA (lower panel) expression of mouse β-actin mRNA.
Because TMEPAI is a direct target gene of TGF-β signaling (13, 24), we investigated whether the C18ORF1 transcript was augmented in cells upon TGF-β stimulation. However, in contrast to the TMEPAI transcript, the expression of C18ORF1 mRNA was only marginally induced by TGF-β but not by BMP (Fig. 1, D and E). We have already revealed that TMEPAI localizes to early endosomes together with SARA (13). Hence, we examined whether C18ORF1 can be colocalized with TMEPAI in cells. In fluorescence immunostaining, C18ORF1α1 and C18ORF1α2 deficient in 18 amino acids between the transmembrane and SIM domains were cotransfected with TMEPAI into 911 cells. Both TMEPAI and C18ORF1 showed colocalization with typical punctate staining (Fig. 1F). Thus, C18ORF1 is probably present in early endosomes. Consistently, C18ORF1α1 could also physically interact with TMEPAI, both of which made a homomeric complex (Fig. 1, G and H). When we checked the expression of Tmepai and C18orf1 in mouse tissues, C18orf1 mRNA could be detected in almost all tissues examined, whereas Tmepai mRNA could not be seen in some of tissues. Thus, the mRNA expression profiles between C18orf1 and Tmepai were not completely identical in tissues (Fig. 1I).
Inhibitory Effect of C18ORF1 on TGF-β Signaling
Because the primary protein structure of C18ORF1 in its intracellular domain is highly similar to that of TMEPAI, we tested the effect of C18ORF1 on the Smad-driven transcriptional (SBE)4-luc reporter (20). Both C18ORF1α1 and C18ORF1α2 could perturb TGF-β-induced reporter activity in a dose-dependent manner, although they did not affect BMP-induced reporter activity (Fig. 2, A and B). Because both C18ORF1 and TMEPAI can make a heterodimer as well as a homodimer, we explored whether the TMEAPI family could inhibit TGF-β signaling either synergistically or additionally. Fig. 2, C and D, indicated that inhibition of TGF-β signaling by the TMEPAI family might be an additional effect rather than a synergistic effect. We also performed luciferase assays using MEFs from either C18orf1 or Tmepai knock-out mice (Fig. 2, E and F). Although C18ORF1 can make a heteromeric complex with TMEPAI, C18ORF1 and TMEPAI could independently suppress TGF-β signaling. To investigate the possibility that C18ORF1α1 and C18ORF1α2 can inhibit Smad2 phosphorylation upon TGF-β receptor activation in a manner analogous to TMEPAI, Smad2 and constitutively active TGF-β type I receptor (termed ALK5ca) were transfected into COS7 cells with and without the C18ORF1α subfamily. Expectedly, both C18ORF1α1 and C18ORF1α2 could interfere with ALK5ca-mediated Smad2 phosphorylation in almost the same manner as TMEPAI (Fig. 2G). Because both C18ORF1α subfamilies show comparably inhibitory action on TGF-β signaling, we used the longest form of C18ORF1, C18ORF1α1, as a representative of the C18ORF1 family in the subsequent experiments. TGF-β promotes Smad3 phosphorylation as well as Smad2 phosphorylation via its ALK5 activation (1–3). As seen in Fig. 2H, C18ORF1α1 could counteract ALK5ca-mediated Smad3 phosphorylation. In addition, ALK4ca-mediated Smad2 phosphorylation was inhibited by C18ORF1α1 as well (Fig. 2I). We further investigated whether C18ORF1 could perturb TGF-β-mediated or activin-mediated phosphorylation of endogenous AR-Smads in NMuMG cells. As expected, phosphorylation of AR-Smads upon both TGF-β and activin stimulation was suppressed by C18ORF1α1 in cells (Fig. 2J). However, C18ORF1α1 did not influence Smad1 phosphorylation mediated by constitutively active BMP type IB receptor (ALK6ca) (Fig. 2K). Therefore, C18ORF1 specifically inhibits TGF-β/activin signaling but not BMP signaling.
FIGURE 2.

C18ORF1 inhibits TGF-β signaling. A and B, effect of C18ORF1 on TGF-β- or BMP-induced luciferase reporter activity. HepG2 cells were transfected with indicated plasmids at different doses. Twenty four hours later, cells were stimulated with either 5 ng/ml TGF-β (A) or 25 ng/ml BMP-6 (B). All values represent mean ± S.D. Significantly different from mock in the presence of TGF-β or BMP-6: **, p < 0.01; ***, p < 0.001. TMEPAI was used as a positive control. C and D, additional inhibitory effect of TMEPAI family on TGF-β-induced reporter activity. HepG2 cells carrying a certain amount of TMEPAI (C) and C18ORF1 (D) were transfected with increased amounts of C18ORF1 and TMEPAI, respectively. Twenty four hours later, cells were stimulated with either 5 ng/ml TGF-β. All values represent mean ± S.D. Significantly different from mock in the presence of TGF-β: *, p < 0.05; **, p < 0.01. E and F, inhibitory effect of TMEPAI (E) and C18ORF1 (F) on TGF-β signaling in C18ORF1 (E) and TMEPAI knock-out MEFs (F). MEFs lacking C18ORF1 (E) and TMEPAI (F) were transfected with increased amounts of TMEPAI and C18ORF1, respectively. Twenty four hours later, cells were stimulated with 5 ng/ml TGF-β for 18 h. All values represent mean ± S.D. Significantly different from mock in the presence of TGF-β: **, p < 0.01; ***, p < 0.001. G and H, inhibition of ALK5ca-induced Smad2 (G) and Smad3 (H) phosphorylation by C18ORF1. COS7 cells were transfected with indicated plasmids. To show phosphorylation of Smad2 or Smad3 upon ALK5 activation, the cell lysates were immunoprecipitated (IP) with anti-FLAG M5 antibody and then analyzed by Western blot (WB) with anti-phospho-Smad2 (PS2) or anti-phospho-Smad1/3 antibody (PS1/3) (upper panels). The 2nd, 3rd, and lower panels indicate total expressions of FLAG-Smad2 (G) or FLAG-Smad3 (H), ALK5ca/HA, and C18ORF1α1/V5, C18ORF1α2/V5, or TMEPAI/V5, respectively. TMEPAI was used as a positive control. I, inhibition of ALK4ca-induced Smad2 phosphorylation by C18ORF1. COS7 cells were transfected with the indicated plasmids. To show phosphorylation of Smad2 upon ALK4 activation, the cell lysates were immunoprecipitated with anti-FLAG M5 antibody and then analyzed by Western blot with PS2. The 2nd, 3rd, and lower panels indicate total expressions of FLAG-Smad2, ALK4ca/HA and C18ORF1α1/V5. J, inhibition of endogenous AR-Smad phosphorylation by C18ORF1α1. NMuMG cells infected with either adenoviral GFP or C18ORF1α1/V5 were stimulated with 0.5 ng/ml TGF-β or 50 ng/ml activin for 1 h. Then, total lysates were used for Western blot analysis. Upper panel, phosphorylated Smad2; 2nd panel, phosphorylated Smad3; 3rd panel, total Smad2; 4th panel, total Smad3; 5th panel, expression of C18ORF1α1; lower panel, β-actin. K, effect of C18ORF1α1 on ALK6ca-induced Smad1 phosphorylation. COS7 cells were transfected with indicated plasmids. To show phosphorylation of Smad1 upon ALK6 activation, the cell lysates were immunoprecipitated with anti-FLAG M5 antibody and then analyzed by Western blot using PS1/3 (upper panel). The 2nd, 3rd, and lower panels indicate total expressions of FLAG-Smad1, ALK6ca/HA, and C18ORF1/V5, respectively.
Interaction of Smads with C18ORF1
C18ORF1 possesses the SIM domain in its structure. Thus, AR-Smads possibly associate with C18ORF1. Fig. 3A indicates that AR-Smads can bind to C18ORF1α1, although none of the BMP-specific R-Smads (BR-Smads), Smad4, or Smad7 interact with C18ORF1α1. Indeed, the mutation of the SIM domain in C18ORF1α1 led C18ORF1α1 to lose its ability to associate with AR-Smads (Fig. 4, F and G). Next, we adopted PLA to detect endogenous interaction between AR-Smads and C18ORF1 in cells. When both rabbit anti-Smad3 and mouse anti-C18ORF1 antibodies were simultaneously added to the fixed sample, a large number of red spots could be observed (Fig. 3B). Conversely, no dots were detected when mouse anti-Myc9E10 and rabbit anti-Smad3 antibodies were used for PLA (Fig. 3C). This evidence indicates that C18ORF1 could associate with Smad3 in the cytosol.
FIGURE 3.

A, interaction of C18ORF1 with Smads. COS7 cells were transfected with the indicated plasmids and harvested for coimmunoprecipitation (co-IP) experiments. The interaction between C18ORF1 and Smads is shown in the upper panel. The middle and lower panels indicate the total expression of FLAG-Smads and C18ORF1α1, respectively. B, endogenous interaction between Smad3 and C18ORF1. HaCaT cells were fixed, followed by addition of rabbit anti-Smad3 and/or mouse anti-C18ORF1 antibodies. Then PLA was performed. Upper panel, only Smad3 antibody was added to the section. Lower panel, both Smad3 and C18ORF1 antibodies were added. The red dots indicate colocalization. Nuclear staining with DAPI is indicated in blue. C, no detectable dots in HaCaT cells when rabbit anti-Smad3 and mouse anti-Myc9E10 antibodies were used for PLA assay. HaCaT cells were fixed, followed by addition of rabbit anti-Smad3 and mouse anti-Myc9E10 antibodies. Then, PLA was performed. Red dots were not visualized because mouse anti-Myc9E10 antibody was used as a control antibody. Left panels, interaction between two molecules that are recognized by anti-Smad3 and anti-Myc9E10 antibodies. Middle panels, nuclear staining with DAPI is indicated in blue. Right panels, merge image. D, C18ORF1 equally binds to nonphosphorylated and phosphorylated AR-Smads. Left panel, illustration of how cell lysates were prepared from each dish in which indicated plasmids were transfected. Middle panel, each cell lysate was mixed and subjected to co-IP experiments. Upper panel, interaction of Smad2 with C18ORF1α1; 2nd panel, total expression of Smad2; 3rd panel, Smad2 phosphorylation; lower panel, total expression of C18ORF1α1. Right panel, each cell lysate was mixed and subjected to co-IP experiments. Upper panel, interaction of Smad3 with C18ORF1α1; 2nd panel, total expression of Smad3; 3rd panel, total expression of C18ORF1α1; lower panel, total expression of ALK5. E, C18ORF1 inhibits interaction between Smad2 and Smad4. COS7 cells were transfected with the indicated plasmids and harvested for co-IP experiments. The interaction between Smad2 and Smad4 is shown in the upper panel. The 2nd, 3rd, 4th, and lower panels indicate the total expression of FLAG-Smad4, 6×Myc-Smad2, ALK5ca/HA, and C18ORF1α1/V5, respectively. F, C18ORF1 interferes with endogenous AR-Smad·Smad4 complex formation. NMuMG cells were infected with indicated adenoviruses, stimulated with 5 ng/ml TGF-β for 90 min, and harvested for co-IP experiments. Upper panel, interaction between AR-Smads and Smad4; 2nd panel, expression of total Smad2/3; 3rd panel, expression of total Smad4; lower panel, expression of C18ORF1.
FIGURE 4.

Indispensability of the SIM domain for C18ORF1 to inhibit TGF-β signaling. A, schematic presentation of deletion mutants for human C18ORF1α1. TM, transmembrane domain; PY, PY motif. C18ORF1(4A) indicates replacement of PPNR (Pro-Pro-Asn-Arg) into AAAA (Ala-Ala-Ala-Ala) in the SIM domain of C18ORF1α1. B, effect of C18ORF1 mutants on TGF-β-induced (SBE)4-luc activity. C18ORF1α1 or its mutants were cotransfected with (SBE)4-luc in HepG2 cells with or without 5 ng/ml TGF-β for 18 h. All values represent mean ± S.D. Significantly different from the presence of TGF-β: **, p < 0.01; ***, p < 0.001. C, subcellular localization of C18ORF1α1 and its mutants in cells. 911 cells were transfected with indicated plasmids. C18ORF1α1 or its mutants were stained red. Nuclei can be observed in blue. D and E, effect of C18ORF1α1 mutants on ALK5ca-mediated Smad2 (D) or Smad3 phosphorylation (E). Experiments were performed according to Fig. 2G. Upper panel, phosphorylation of AR-Smads; 2nd panel, expression of total AR-Smads; 3rd panel, expression of total ALK5ca; lower panel, expression of C18ORF1α1 or its mutants. F and G, SIM domain is required for C18ORF1α1 to interact with Smad2 (F) or Smad3 (G). Myc-AR-Smads was transfected with C18ORF1α1 or its mutants in COS7 cells. Experiments were performed according to Fig. 3A. Upper panel, interaction of AR-Smads with C18ORF1α1 or its mutants; 2nd panel, expression of total AR-Smads; lower panel, expression of C18ORF1α1 or its mutants. H, C18ORF1α1, but not C18ORF1α1(4A), blocks nuclear translocation of AR-Smads upon TGF-β stimulation. NMuMG cells were transfected with (upper right panels) C18ORF1α1 or (lower right panels) C18ORF1α1(4A), stimulated with 5 ng/ml TGF-β for 1 h, and fixed for immunofluorescence. Ectopic C18ORF1α1 and endogenous AR-Smads were visualized with green and red, respectively. Left panel, mock-transfected cells without TGF-β were fixed. Next, cells were used for immunofluorescence. I, colocalization of SARA with either C18ORF1α1 or TMEPAI. GFP-SARA(FYVE) and either TMEPAI/V5 or C18ORF1α1/V5 were cotransfected into 911 cells. Twenty four hours after transfection, cells were fixed and stained with mouse anti-V5 monoclonal antibody. Then Texas red-conjugated goat anti-mouse IgG antibody (Molecular Probes) was used for visualization. Colocalization is shown in yellow. Nuclei were stained with DAPI (blue). J and K, SARA(SBD) prevents interaction of Smad2 (J) or Smad3 (K) with C18ORF1α1. Each cell lysate was mixed and subjected to co-IP experiments according to Fig. 3D. Upper panel, interaction of AR-Smads with C18ORF1α1; 2nd panel, expression of total AR-Smads; 3rd panel, expression of C18ORF1α1; lower panel, expression of GFP or GFP-SARA(SBD). IP, immunoprecipitation; WB, Western blot.
Although C18ORF1 could interact with both Smad2 and Smad3, we did not know whether phosphorylation of AR-Smads at their C terminus affects the interaction between C18ORF1 and AR-Smads. Thus, we prepared lysates from cells transfected with either AR-Smad (FLAG-Smad2 or FLAG-Smad3) alone or with AR-Smad and ALK5ca/HA. Subsequently, each lysate was mixed with lysate prepared from cells transfected with C18ORF1α1/V5 alone, immunoprecipitated with anti-FLAG antibody, and then analyzed by Western blot with anti-V5 antibody. As seen in Fig. 3D, C18ORF1α1 bound to both nonphosphorylated and phosphorylated AR-Smads equally.
After TGF-β stimulation, phosphorylated AR-Smads interact with Smad4 to go to the nucleus, where this heteromeric complex transcriptionally regulates gene expression (1–3). Consistent with this concept, overexpression of C18ORF1α1 perturbed complex formation between AR-Smads and Smad4 upon TGF-β stimulation. (Fig. 3, E and F).
Pursuit of the Functional Domain in C18ORF1
C18ORF1 consists of a short extracellular domain, a transmembrane, and an intracellular domain. Thus, we examined which domain(s) in C18ORF1 is involved in its inhibition of TGF-β signaling. For that purpose, we first made a mutant that lacks both the extracellular domain and the transmembrane in C18ORF1α1 (C18ORF1α1ΔTM) (Fig. 4A). C18ORF1α1ΔTM possessed the ability to inhibit TGF-β signaling comparable with that of wild-type C18ORF1α1 (Fig. 4B). Because C18ORF1α1ΔTM can localize to cytosol, it might bind to AR-Smads to interfere with TGF-β signaling (Fig. 4C). The intracellular domain in C18ORF1 includes three known regions as follows: two PY motifs and one SIM domain. The deletion of two PY motifs from C18ORF1α1 (C18ORF1α1ΔPY) led to partial loss of its ability to inhibit TGF-β-induced luciferase activity, whereas C18ORF1α1 (Fig. 4A), resulted in a defect in its inhibitory action (Fig. 4B). Furthermore, C18ORF1α1 (Fig. 4A) could not inhibit ALK5ca-mediated phosphorylation of AR-Smads, although C18ORF1α1ΔPY still possessed the ability to partially inhibit AR-Smads phosphorylation upon ALK5 activation (Fig. 4, D and E). We previously reported that the SIM domain in TMEPAI interacts with AR-Smads (13). Indeed, the mutation of the SIM domain in C18ORF1α1 prevented it from associating with AR-Smads (Fig. 4, F and G), suggesting that the SIM domain in C18ORF1 plays a key role in its inhibition of TGF-β signaling. Consistently, overexpression of C18ORF1α1 in 911 cells kept AR-Smads in the cytosol upon TGF-β stimulation, whereas C18ORF1α1 (Fig. 4A) did not affect the nuclear translocation of AR-Smads in the presence of TGF-β (Fig. 4H). As shown in Fig. 1E, both C18ORF1α1 and TMEPAI can indeed colocalize to early endosomes. This result led us to the notion that C18ORF1 can compete with SARA for binding to AR-Smads, like TMEPAI. We have already reported that the FYVE domain of SARA, termed SARA(FYVE), colocalizes with SARA in early endosomes (26). Therefore, C18ORF1α1/V5 or TMEPAI/V5 was transfected into 911 cells with GFP-SARA(FYVE) instead of SARA because of low expression of SARA in cells. Like TMEPAI and GFP-SARA(FYVE), both C18ORF1α1 and GFP-SARA(FYVE) showed punctate staining indicative of their colocalization (Fig. 4I). SARA is known to recruit AR-Smads to present them to activated ALK5 (27). Thus, C18ORF1 might counteract with SARA in recruitment of AR-Smads. Indeed, SARA(SBD) blocked the interaction between C18ORF1α1 and AR-Smads (Fig. 4, J and K). These results reveal that SARA·AR-Smad complex formation is abrogated by C18ORF1. Therefore, SARA cannot efficiently recruit AR-Smads to ALK5 upon TGF-β stimulation in the presence of C18ORF1.
Gain-of-Function Analysis of C18ORF1
p21 and JunB are well known direct target genes of TGF-β signaling (28, 29). When C18ORF1α1 was introduced into HaCaT cells by adenoviral transfer, the induction of p21 and JunB proteins was inhibited. Conversely, C18ORF1α1 (Fig. 4A) deficient of the ability to bind to AR-Smads, could not interfere with TGF-β-induced expression of p21 and JunB (Fig. 5).
FIGURE 5.
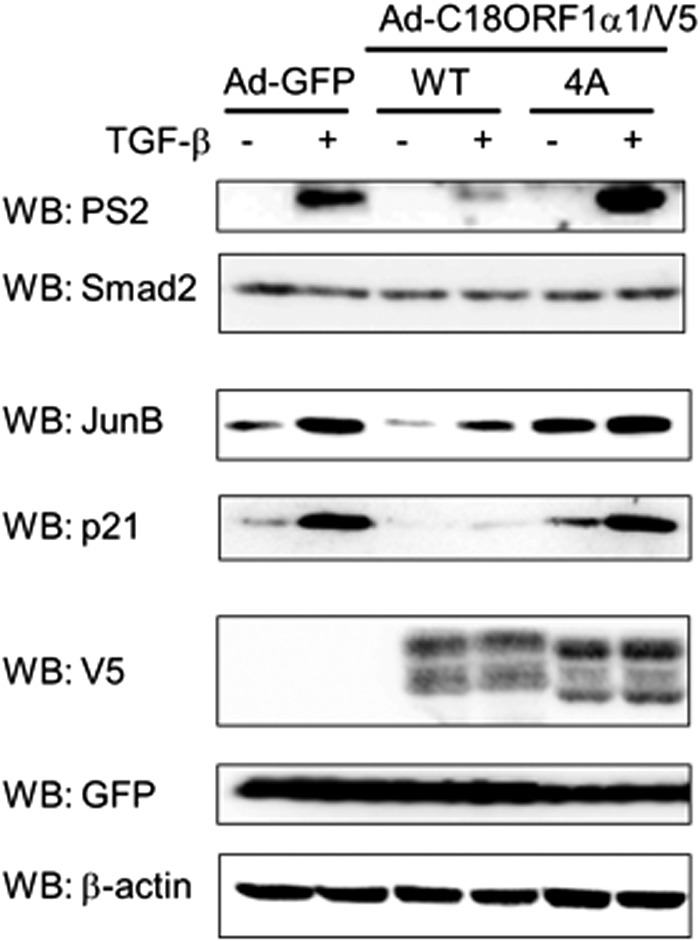
Gain-of-function analysis of C18ORF1. HaCaT cells were infected with indicated adenoviruses. Forty hours later, cells were starved for 12 h and then stimulated with 5 ng/ml of TGF-β. Using cell lysates, Western blot (WB) analyses were carried out using the indicated antibodies. Upper panel, anti-phosphorylated Smad2 antibody (PS2); 2nd panel, anti-Smad2 antibody; 3rd panel, anti-Jun B antibody; 4th panel, anti-p21 antibody; 5th panel, expression of C18ORF1α1 or C18ORF1α1(4A) using anti-V5 antibody; 6th panel, anti-GFP antibody; lower panel, anti-β-actin antibody.
Loss-of-Function Analysis of C18ORF1
Because overexpression of C18ORF1 blocks TGF-β signaling, decreased expression of C18ORF1 (Fig. 6A) might enhance it. The siRNA-mediated depletion of C18ORF1 could enhance both (CAGA)12-luc reporter activity (Fig. 6B) and Smad2 phosphorylation (Fig. 6C) upon TGF-β stimulation. Furthermore, introduction of mouse C18orf1 could rescue suppression of TGF-β-induced (CAGA)12-luc reporter activity by human C18ORF1 siRNA (Fig. 6D). Consistent with prolongation of Smad2 phosphorylation by TGF-β, siRNAs for C18ORF1 potentiated the TGF-β-induced expression of JUNB, p21, and TMEPAI more than did control siRNAs (Fig. 6, E and F).
FIGURE 6.

Loss-of-function analysis of C18ORF1. A, decreased expression of C18ORF1 mRNA. The expressions of C18ORF1 and β-ACTIN mRNAs as a negative control are shown. RT(+), with reverse transcriptase; RT(−), without reverse transcriptase. Cont, control siRNA; C18, C18ORF1-specific siRNA. B, effect of C18ORF1 siRNA on TGF-β-induced luciferase reporter activity. C18ORF1 siRNA or control siRNA was incorporated into cells. Subsequently, the luciferase assay was performed using a (CAGA)12-luc reporter with or without TGF-β. All values represent mean ± S.D. Significantly different from control siRNA in the presence of TGF-β: ***, p < 0.001. C, prolongation of TGF-β-induced Smad2 phosphorylation by C18ORF1 siRNA. C18ORF1 or control siRNA was incorporated into cells. Next, the cells were divided into six dishes and then stimulated with TGF-β for the indicated times. The expressions of phosphorylated Smad2 (upper panel), Smad2 (middle panel), and β-actin (lower panel) were observed using each specific antibody. D, mouse C18orf1(mC18orf1) rescues suppression of TGF-β-mediated responses by human C18ORF1-specific siRNA. All values represent mean ± S.D. Significantly different from human C18ORF1-specific siRNA-transfected cells in the presence of TGF-β: *, p < 0.05. E, enhancement of TGF-β-induced p21 expression by C18ORF1 siRNA. C18ORF1 or control siRNA was transfected into cells. Next, the cells were separated into two dishes, and cells in one dish were stimulated with TGF-β for 4 h. Upper panel, expression of C18ORF1 by RT-PCR; 2nd panel, expressions of phosphorylated Smad2; 3rd panel, expression of p21; lower panel, expression of β-actin. F, enhancement of TGF-β-induced TMEPAI and JUNB expression by C18ORF1siRNA. C18ORF1 or control siRNA was transfected into cells. Next, the cells were separated into four dishes, and the cells in one dish were stimulated with TGF-β for the indicated times. The expression of each molecule was detected by RT-PCR. Upper panel, expression of C18ORF1; 2nd panel, expression of TMEPAI; 3rd panel, expression of JunB; lower panel, expression of β-actin. WB, Western blot.
TGF-β is known to promote cell motility in some epithelial cells. Thus, we tried to decrease the endogenous C18ORF1 expression using a lentiviral shRNA to explore the effect of C18ORF1 on cell motility. As seen in Fig. 7A, both C18ORF1-specific shRNAs could decrease the expression of C18ORF1 mRNA. Then, we tested the effect of TGF-β on cell migration using A549 cells expressing control shRNA, C18ORF1 shRNA#1, or shRNA#2. A549 cells expressing C18ORF1 shRNA#1 or shRNA#2 could migrate quicker than those expressing control shRNA (Fig. 7B and supplemental movie). Furthermore, we compared the ability of TGF-β-induced epithelial-mesenchymal transition (EMT) among the three cell lines. EMT is a process whereby tightly interacting and immotile epithelial cells acquire the phenotype of loosely adherent and motile mesenchymal cells. Consistent with the results of the cell migration assay, introduction of C18ORF1 shRNA#1 or C18ORF1 shRNA#2 promoted EMT in A549 cells more rapidly than did introduction of control shRNA when cells were stimulated with TGF-β (Fig. 7C). During EMT, E-cadherin, a marker of epithelial cells, gradually disappears. TGF-β prompted loss of E-cadherin expression in both shRNA#1- and shRNA#2-expressing A549 cells more quickly than in control shRNA-expressing A549 cells (Fig. 7, D and E). These gain-of-function and loss-of-function analyses of C18ORF1 provided a convincing explanation for how C18ORF1 interferes with TGF-β signaling.
FIGURE 7.

Enhancement of TGF-β-mediated biological responses. A, decrease in C18ORF1 expression. A549 cells stably expressing C18ORF1 shRNA#1 or shRNA#2 were established. The expression of C18ORF1 and β-actin was detected by RT-PCR. B, increased motility in C18ORF1 knockdown cells. A549 cells carrying C18ORF1 shRNA#1-expressing, shRNA#2-expressing, or control vector were confluently seeded in 24-well plates. After cell scratching, TGF-β was added to the media. Then cell movement was measured by microscopy. The velocity of cell movement was calculated. The experiments were carried out twice. All values represent mean ± S.D. Significantly different from mock in the presence of TGF-β: **, p < 0.01; ***, p < 0.001. C, enhancement of TGF-β-mediated EMT in C18ORF1 shRNA-expressing A549 cells. The cells carrying C18ORF1 shRNA#1, C18ORF1 shRNA#2, or control shRNA were stimulated with or without TGF-β for 36 h. The actin stress fibers were visualized using phalloidin. D, expression of E-cadherin in A549 cells carrying C18ORF1 shRNAs. The cells stably transfected with C18ORF1 shRNA#1, C18ORF1 shRNA#2, or control shRNA were stimulated with TGF-β for indicated times. Then the expression of E-cadherin (upper panel) or β-actin (lower panel) was observed. E, immunofluorescence staining of E-cadherin in cells. The cells carrying C18ORF1 shRNA#1, C18ORF1 shRNA#2, or control shRNA were fixed and then stained with anti-E-cadherin antibody (red). Nuclei were stained blue. Cells were stimulated with TGF-β for 36 h. WB, Western blot.
DISCUSSION
Dysregulation of signal transduction promotes incompetent cell-cell communication to give rise to congenital or acquired disease. Thus, cells constantly survey inappropriate signal transductions to eliminate them. The TGF-β family controls proliferation and differentiation in a variety of cell types. Accordingly, this signaling pathway is implicated in homeostasis during embryogenesis and in adult life. Not surprisingly, aberrant TGF-β family signal transduction is linked to genetic disorders, tumorigenicity, and fibrosis, which can all be life-threatening (9, 10).
Because TMEPAI, a direct target gene of TGF-β signaling, contributes to a negative feedback loop of TGF-β signaling (13), we speculated that there is a TMEPAI homologue(s) that monitors excessive TGF-β or BMP signaling in cells. Our search of the NCBI database yielded C18ORF1 as a homologue of TMEPAI. Although the putative extracellular domain of C18ORF1 was less similar to that of TMEPAI, the putative intracellular domain between C18ORF1 and TMEPAI was highly conserved. As anticipated, TGF-β signaling, but not BMP signaling, could be counteracted by C18ORF1, as it is by TMEPAI.
We found six alternative splicing forms of C18ORF1 in the database. On the basis of their similarity, the six isoforms were classified into three C18ORF1 subfamilies as follows: C18ORF1α, C18ORF1β, and C18ORF1γ. Each subfamily shares the same intracellular domain except for a region consisting of 18 amino acids, whereas their N-terminal extracellular domains are divergent because of different exon usages. Among the six C18ORF1 isoforms, we focused on the C18ORF1α subfamily because RT-PCR supported the notion that C18ORF1α1 and C18ORF1α2 lacking the region consisting of 18 amino acids in its intracellular domain might be more highly expressed than others, although we did not know exactly how much the C18ORF1α subfamily is expressed in cells as compared with the C18ORF1β and C18ORF1γ subfamilies. When we sought to clarify how important the region, consisting of 18 amino acids in its intracellular domain, is for the ability of the C18ORF1α subfamily, we could not find any differences among the C18ORF1α subfamily members. Because the region consisting of 18 amino acids is located apart from the SIM domain, the deletion of this region possibly does not affect the inhibitory action of C18ORF1 on TGF-β signaling. Furthermore, the extracellular domain of C18ORF1α1 is not necessary for C18ORF1α1 to reveal its inhibitory action for TGF-β signaling. Thus, C18ORF1β and C18ORF1γ subfamilies are strongly suggested to possess the inhibitory capability like the C18ORF1α subfamily because their intracellular domains are identical. Therefore, we used C18ORF1α1 in almost of all of the experiments in this study.
C18ORF1 colocalizes with both TMEPAI and SARA, revealing that C18ORF1 is present in early endosomes together with TMEPAI. Indeed, C18ORF1 could make a heteromeric complex with TMEPAI (Fig. 1, G and H). However, we could observe inhibition of TGF-β signaling by TMEPAI and C18ORF1 in mouse embryonic fibroblasts from C18orf1 and Tmepai knock-out mice, respectively (Fig. 2, E and F). Furthermore, inhibition of TGF-β signaling could not be synergistically seen when increased amounts of TMEPAI and C18ORF1α1 expression vectors were transfected in cells carrying a definite quantity of C18ORF1α1 and TMEPAI, respectively (Fig. 2, C and D). These results supposed that the heteromeric complex might not be needed for the function of C18ORF1 and TMEPAI.
SARA, which possesses a FYVE domain in its structure, has been demonstrated to present AR-Smads to activated ALK5 via its SBD. Thus, SARA seems to be a scaffold protein in TGF-β signaling (27). In this study, C18ORF1 could compete with SARA for binding to AR-Smads. Furthermore, SARA could improve the C18ORF1-mediated (this study) and TMEPAI- mediated (13) inhibition of TGF-β signaling. However, Bakkebø et al. (30) argued that SARA contributes to TGF-β signaling because a loss-of function analysis of SARA did not affect TGF-β signaling at all. Because several scaffold molecules rely on activated ALK5 and AR-Smads (27, 31, 32), requirement of SARA for TGF-β signaling might be context-dependent. Therefore, C18ORF1 as well as TMEPAI possibly acts as a negative regulator of TGF-β signaling in cells that command SARA or its related molecules to activate the TGF-β signal.
We initially thought that C18ORF1 can ubiquitinate Smads via two PY motifs with which WW domain-containing E3 ligases interact. In fact, Smurfs, WWP1, and NEDD4 could be bound by C18ORF1 via its two PY motifs. However, we could not obtain any obvious evidence that Smads were either ubiquitinated or degraded.
When we tried to account for the role of the PY motifs and SIM domain in C18ORF1, C18ORF1ΔPY partially inhibited TGF-β signaling, in contrast to TMEPAIΔPY (13), although C18ORF1(4A) had a loss of its function. Deletion of the two PY motifs in C18ORF1 could affect the binding of its SIM domain to AR-Smads, or the WW domain-containing proteins, other than ubiquitin E3 ligases, could be involved in the inhibitory action of TGF-β signaling via the PY motifs of C18ORF1. We will explore the latter possibility in future investigations.
The loss-of-function and gain-of-function analyses indicated that C18ORF1 definitely interferes with the TGF-β signaling pathway. Therefore, it seems that the expression of TGF-β target genes and TGF-β-mediated cell motility were perturbed by C18ORF1, as they are by TMEPAI. The question then arises as to why two molecules that possess similar features to inhibit TGF-β signaling exist in one cell. It is known that most cells secrete TGF-β to communicate with neighboring cells, thereby ensuring maintenance of homeostasis. We speculate that C18ORF1 plays a role in fine-tuning TGF-β signaling under the steady state. However, TMEPAI, which is rapidly induced by TGF-β (13, 24), can protect cells from excessive TGF-β signaling together with C18ORF1 to cease such extraordinary TGF-β signaling (Fig. 8). Although it is well known that a large number of inhibitory molecules for TGF-β signaling are present in cells (11, 12), so far only TMEPAI is known to be an inhibitory molecule of TGF-β signaling that targets SARA (13). In this study, we demonstrated that C18ORF1 coordinates with TMEPAI to target SARA for interference of TGF-β signaling.
FIGURE 8.

Proposed model for TMEPAI family to inhibit TGF-β signaling. Both C18ORF1 and TMEPAI belong to TMEPAI family. C18ORF1 perturbs TGF-β signaling under steady state, whereas TMEPAI, which is a direct target gene of TGF-β signaling, is not expressed under steady state. However, as soon as cells receive TGF-β signaling, TMEPAI is immediately induced to be able to protect cells from excessive TGF-β signaling together with C18ORF1. In consequence, such extraordinary TGF-β signaling passes away. TMEPAI family makes either a heteromeric or homomeric complex even though heteromeric complex formation is of little importance for their function.
TGF-β has two aspects during tumorigenicity as follows: tumor-suppressive effects in the premalignant state and tumor progression in the malignant state (33–36). TMEPAI is known to be expressed in several tumors (13, 24, 37–41). Thus, TMEPAI seems to have tumor-promoting effects due to interference of TGF-β-mediated growth inhibition. However, no relevance between C18ORF1 and tumorigenicity has yet been reported. Genetic mouse model and tumor studies are needed to clarify the implication of C18ORF1 in tumorigenicity. However, C18ORF1 loci confer susceptibility to schizophrenia (14–16). Forebrain-specific Smad4 knock-out mice revealed psychiatric-like behavior because of a disruption in the balance of the excitatory and inhibitory hippocampal networks. Thus, these Smad4 conditional mice show an endophenotype of schizophrenia (42). Therefore, deletion of C18ORF1 that is constitutively expressed in cells might also disequilibrate the excitatory and inhibitory hippocampal networks, leading to development of schizophrenia.
Supplementary Material
Acknowledgment
We thank F. Miyamasu for excellent English proofreading.
This work was supported by a grant-in-aid for young scientists (A) from the Ministry of Education, Culture, Sports, Science, and Technology of Japan (to F. I.); a grant-in-aid for exploratory research (A) from Japan Society for the Promotion of Science) (to N. S.); MEXT-supported Program for the Strategic Research Foundation at Private Universities 2013-2017 (to S. Itoh); the Takeda Science Foundation (to S. Itoh); the Smoking Research Foundation (to S. Itoh); the Daiichi-Sankyo Foundation of Life Science (to S. Itoh); the Naito Foundation (to S. Itoh); the Vehicle Racing Commemorative Foundation (to S. Itoh); a grant-in-aid for young scientists of Showa Pharmaceutical University (to S. Ikeno); the Joint Usage/Research Program of the Medical Research Institute; Tokyo Medical and Dental University (to S. Itoh); and the Core-to-Core Program “Cooperative International Framework in TGF-β Family Signaling” of the Japan Society for the Promotion of Science (to S. Itoh).

This article contains a supplemental video.
S. Itoh, Y. Watanabe, F. Itoh, S. Takahashi, and M. Kato, unpublished results.
- SARA
- Smad anchor for receptor activation
- TMEPAI
- transmembrane prostate androgen-induced RNA
- SIM
- Smad-interacting motif
- BMP
- bone morphogenetic protein
- PLA
- proximity ligation assay
- MEF
- mouse embryonic fibroblast
- SBE
- Smad-binding element
- EMT
- epithelial-mesenchymal transition
- AR-Smad
- activin/TGF-β receptor-regulated Smad
- SARA(SBD)
- SARA(Smad binding domain).
REFERENCES
- 1. Massagué J., Blain S. W., Lo R. S. (2000) TGFβ signaling in growth control, cancer, and heritable disorders. Cell 103, 295–309 [DOI] [PubMed] [Google Scholar]
- 2. Derynck R., Akhurst R. J. (2007) Differentiation plasticity regulated by TGF-β family proteins in development and disease. Nat. Cell Biol. 9, 1000–1004 [DOI] [PubMed] [Google Scholar]
- 3. Massagué J. (2012) TGFβ signalling in context. Nat. Rev. Mol. Cell Biol. 13, 616–630 [DOI] [PMC free article] [PubMed] [Google Scholar]
- 4. Moustakas A., Heldin C.-H. (2005) Non-Smad TGF-β signals. J. Cell Sci. 118, 3573–3584 [DOI] [PubMed] [Google Scholar]
- 5. Hoover L. L., Kubalak S. W. (2008) Holding their own: the noncanonical roles of Smad proteins. Sci. Signal. 1, pe48. [DOI] [PMC free article] [PubMed] [Google Scholar]
- 6. Zhang Y. E. (2009) Non-Smad pathways in TGF-β signaling. Cell Res. 19, 128–139 [DOI] [PMC free article] [PubMed] [Google Scholar]
- 7. Kang J. S., Liu C., Derynck R. (2009) New regulatory mechanisms of TGF-β receptor function. Trends Cell Biol. 19, 385–394 [DOI] [PubMed] [Google Scholar]
- 8. Mu Y., Gudey S. K., Landström M. (2012) Non-Smad signaling pathways. Cell Tissue Res. 347, 11–20 [DOI] [PubMed] [Google Scholar]
- 9. ten Dijke P., Arthur H. M. (2007) Extracellular control of TGFβ signalling in vascular development and disease. Nat. Rev. Mol. Cell Biol. 8, 857–869 [DOI] [PubMed] [Google Scholar]
- 10. Gordon K. J., Blobe G. C. (2008) Role of transforming growth factor-β superfamily signaling pathways in human disease. Biochim. Biophys. Acta 1782, 197–228 [DOI] [PubMed] [Google Scholar]
- 11. Itoh S., ten Dijke P. (2007) Negative regulation of TGF-β receptor/Smad signal transduction. Curr. Opin. Cell Biol. 19, 176–184 [DOI] [PubMed] [Google Scholar]
- 12. Itoh S., Itoh F. (2011) Inhibitory machinery for the TGF-β family signaling pathway. Growth Factors 29, 163–173 [DOI] [PubMed] [Google Scholar]
- 13. Watanabe Y., Itoh S., Goto T., Ohnishi E., Inamitsu M., Itoh F., Satoh K., Wiercinska E., Yang W., Shi L., Tanaka A., Nakano N., Mommaas A. M., Shibuya H., Ten Dijke P., Kato M. (2010) TMEPAI, a transmembrane TGF-β-inducible protein, sequesters Smad proteins from active participation in TGF-β signaling. Mol. Cell 37, 123–134 [DOI] [PubMed] [Google Scholar]
- 14. Meerabux J. M., Ohba H., Iwayama Y., Maekawa M., Detera-Wadleigh S. D., DeLisi L. E., Yoshikawa T. (2009) Analysis of a t(18;21)(p11.1;p11.1) translocation in a family with schizophrenia. J. Hum. Genet. 54, 386–391 [DOI] [PubMed] [Google Scholar]
- 15. Kikuchi M., Yamada K., Toyota T., Yoshikawa T. (2003) C18orf1 located on chromosome 18p11.2 may confer susceptibility to schizophrenia. J. Med. Dent. Sci. 50, 225–229 [PubMed] [Google Scholar]
- 16. Kikuchi M., Yamada K., Toyota T., Itokawa M., Hattori E., Yoshitsugu K., Shimizu H., Yoshikawa T. (2003) Two-step association analyses of the chromosome 18p11.2 region in schizophrenia detect a locus encompassing C18orf1. Mol. Psychiatry 8, 467–469 [DOI] [PubMed] [Google Scholar]
- 17. Kawabata M., Inoue H., Hanyu A., Imamura T., Miyazono K. (1998) Smad proteins exist as monomers in vivo and undergo homo- and hetero-oligomerization upon activation by serine/threonine kinase receptors. EMBO J. 17, 4056–4065 [DOI] [PMC free article] [PubMed] [Google Scholar]
- 18. He T.-C., Zhou S., da Costa L. T., Yu J., Kinzler K. W., Vogelstein B. (1998) A simplified system for generating recombinant adenoviruses. Proc. Natl. Acad. Sci. U.S.A. 95, 2509–2514 [DOI] [PMC free article] [PubMed] [Google Scholar]
- 19. Dennler S., Itoh S., Vivien D., ten Dijke P., Huet S., Gauthier J. M. (1998) Direct binding of Smad3 and Smad4 to critical TGF β-inducible elements in the promoter of human plasminogen activator inhibitor-type 1 gene. EMBO J. 17, 3091–3100 [DOI] [PMC free article] [PubMed] [Google Scholar]
- 20. Jonk L. J., Itoh S., Heldin C.-H., ten Dijke P., Kruijer W. (1998) Identification and functional characterization of an SBE in the JunB promoter that acts as a transforming growth factor-β, activin, and bone morphogenetic protein-inducible enhancer. J. Biol. Chem. 273, 21145–21152 [DOI] [PubMed] [Google Scholar]
- 21. Itoh F., Asao H., Sugamura K., Heldin C.-H., ten Dijke P., Itoh S. (2001) Promoting bone morphogenetic protein signaling through negative regulation of inhibitory Smads. EMBO J. 20, 4132–4142 [DOI] [PMC free article] [PubMed] [Google Scholar]
- 22. Itoh S., Thorikay M., Kowanetz M., Moustakas A., Itoh F., Heldin C. H., ten Dijke P. (2003) Elucidation of Smad requirement in transforming growth factor-β type I receptor-induced responses. J. Biol. Chem. 278, 3751–3761 [DOI] [PubMed] [Google Scholar]
- 23. Noda D., Itoh S., Watanabe Y., Inamitsu M., Dennler S., Itoh F., Koike S., Danielpour D., ten Dijke P., Kato M. (2006) ELAC2, a putative prostate cancer susceptibility gene product, potentiates TGF-β/Smad-induced growth arrest of prostate cells. Oncogene 25, 5591–5600 [DOI] [PubMed] [Google Scholar]
- 24. Nakano N., Itoh S., Watanabe Y., Maeyama K., Itoh F., Kato M. (2010) Requirement of TCF7L2 for TGF-β-dependent transcriptional activation of the TMEPAI gene. J. Biol. Chem. 285, 38023–38033 [DOI] [PMC free article] [PubMed] [Google Scholar]
- 25. Persson U., Izumi H., Souchelnytskyi S., Itoh S., Grimsby S., Engström U., Heldin C. H., Funa K., ten Dijke P. (1998) The L45 loop in type I receptors for TGF-β family members is a critical determinant in specifying Smad isoform activation. FEBS Lett. 434, 83–87 [DOI] [PubMed] [Google Scholar]
- 26. Itoh F., Divecha N., Brocks L., Oomen L., Janssen H., Calafat J., Itoh S., Dijke Pt Pt. (2002) The FYVE domain in Smad anchor for receptor activation (SARA) is sufficient for localization of SARA in early endosomes and regulates TGF-β/Smad signalling. Genes Cells 7, 321–331 [DOI] [PubMed] [Google Scholar]
- 27. Tsukazaki T., Chiang T. A., Davison A. F., Attisano L., Wrana J. L. (1998) A FYVE domain protein that recruits Smad2 to the TGFβ receptor. Cell 95, 779–791 [DOI] [PubMed] [Google Scholar]
- 28. Reynisdóttir I., Polyak K., Iavarone A., Massagué J. (1995) Kip/Cip and Ink4 Cdk inhibitors cooperate to induce cell cycle arrest in response to TGF-β. Genes Dev. 9, 1831–1845 [DOI] [PubMed] [Google Scholar]
- 29. Verrecchia F., Tacheau C., Schorpp-Kistner M., Angel P., Mauviel A. (2001) Induction of the AP-1 members c-Jun and JunB by TGF-β/Smad suppresses early Smad-driven gene activation. Oncogene 20, 2205–2211 [DOI] [PubMed] [Google Scholar]
- 30. Bakkebø M., Huse K., Hilden V. I., Forfang L., Myklebust J. H., Smeland E. B., Oksvold M. P. (2012) SARA is dispensable for functional TGF-β signaling. FEBS Lett. 586, 3367–3372 [DOI] [PubMed] [Google Scholar]
- 31. Chen Y. G., Wang Z., Ma J., Zhang L., Lu Z. (2007) Endofin, a FYVE domain protein, interacts with Smad4 and facilitates transforming growth factor-β signaling. J. Biol. Chem. 282, 9688–9695 [DOI] [PubMed] [Google Scholar]
- 32. Miura S., Takeshita T., Asao H., Kimura Y., Murata K., Sasaki Y., Hanai J. I., Beppu H., Tsukazaki T., Wrana J. L., Miyazono K., Sugamura K. (2000) Hgs (Hrs), a FYVE domain protein, is involved in Smad signaling through cooperation with SARA. Mol. Cell. Biol. 20, 9346–9355 [DOI] [PMC free article] [PubMed] [Google Scholar]
- 33. Bierie B., Moses H. L. (2006) Tumour microenvironment: TGFβ: the molecular Jekyll and Hyde of cancer. Nat. Rev. Cancer 6, 506–520 [DOI] [PubMed] [Google Scholar]
- 34. Massagué J. (2008) TGFβ in cancer. Cell 134, 215–230 [DOI] [PMC free article] [PubMed] [Google Scholar]
- 35. Inman G. J. (2011) Switching TGFβ from a tumor suppressor to a tumor promoter. Curr. Opin. Genet. Dev. 21, 93–99 [DOI] [PubMed] [Google Scholar]
- 36. Meulmeester E., Ten Dijke P. (2011) The dynamic roles of TGF-β in cancer. J. Pathol. 223, 205–218 [DOI] [PubMed] [Google Scholar]
- 37. Hirokawa Y. S., Takagi A., Uchida K., Kozuka Y., Yoneda M., Watanabe M., Shiraishi T. (2007) High level expression of STAG1/PMEPA1 in an androgen-independent prostate cancer PC3 subclone. Cell. Mol. Biol. Lett. 12, 370–377 [DOI] [PMC free article] [PubMed] [Google Scholar]
- 38. Hofsli E., Wheeler T. E., Langaas M., Laegreid A., Thommesen L. (2008) Identification of novel neuroendocrine-specific tumour genes. Br. J. Cancer 99, 1330–1339 [DOI] [PMC free article] [PubMed] [Google Scholar]
- 39. Reichling T., Goss K. H., Carson D. J., Holdcraft R. W., Ley-Ebert C., Witte D., Aronow B. J., Groden J. (2005) Transcriptional profiles of intestinal tumors in Apc(Min) mice are unique from those of embryonic intestine and identify novel gene targets dysregulated in human colorectal tumors. Cancer Res. 65, 166–176 [PubMed] [Google Scholar]
- 40. Giannini G., Ambrosini M. I., Di Marcotullio L., Cerignoli F., Zani M., MacKay A. R., Screpanti I., Frati L., Gulino A. (2003) EGF- and cell-cycle-regulated STAG1/PMEPA1/ERG1.2 belongs to a conserved gene family and is overexpressed and amplified in breast and ovarian cancer. Mol. Carcinog. 38, 188–200 [DOI] [PubMed] [Google Scholar]
- 41. Brunschwig E. B., Wilson K., Mack D., Dawson D., Lawrence E., Willson J. K., Lu S., Nosrati A., Rerko R. M., Swinler S., Beard L., Lutterbaugh J. D., Willis J., Platzer P., Markowitz S. (2003) PMEPA1, a transforming growth factor-β-induced marker of terminal colonocyte differentiation whose expression is maintained in primary and metastatic colon cancer. Cancer Res. 63, 1568–1575 [PubMed] [Google Scholar]
- 42. Sun M., Gewirtz J. C., Bofenkamp L., Wickham R. J., Ge H., O'Connor M. B. (2010) Canonical TGF-β signaling is required for the balance of excitatory/inhibitory transmission within the hippocampus and prepulse inhibition of acoustic startle. J. Neurosci. 30, 6025–6035 [DOI] [PMC free article] [PubMed] [Google Scholar]
Associated Data
This section collects any data citations, data availability statements, or supplementary materials included in this article.