

Abstract
The Arabidopsis DA1 genes appear to have multiple functions in regulating organ size and abiotic stress response, but the biological roles of its closely related genes remain unknown. Evolutionary analyses might provide some clues to aid in an understanding of their functional diversification. In this work, we characterized the molecular evolution and expressional diversification of DA1-like genes. Surveying 354 sequenced genomes revealed 142 DA1-like genes only in plants, indicating plant-specificity of these genes. The DA1-like protein modular structure was composed of two UIMs (ubiquitin interaction motifs), one LIM-domain (from lin-11, isl-1, and mec-3), and a conserved C-terminal, and was distinguishable from the already defined three groups of LIM-domain proteins. We further found that the DA1-like genes diverged into Classes I and II at the ancestor of seed plants and acquired 13 clade-specific residues during their evolutionary history. Moreover, diverse intron size evolution was noted following the transition from size-expandable introns to minimal ones, accompanying the emergence and diversification of angiosperms. Functional diversification as it relates to gene expression was further investigated in soybean. Glycine max DA1 genes showed diverse tissues expression patterns during development and had substantially varied abiotic stress response expression. Thus, variations in the coding regions, intron size, and gene expression contributed to the functional diversification of this gene family. Our data suggest that the evolution of the DA1-like genes facilitated the development of diverse molecular and functional diversification patterns to accompany the successful radiation of plants into diverse environments during evolution.
Keywords: abiotic stress, gene expression, genome, LIM-domain, evolution, soybean
Introduction
Most genes are duplicated multiple times during evolution, with the fixed duplicates usually maintaining a similar domain structure and related function, thus forming a gene family such as the MADS-box gene family (Theissen et al. 1996, 2000). The LIM- (from lin-11, isl-1, and mec-3) domain proteins are a prevalent superfamily in animals (Way and Chalfie 1988; Freyd et al. 1990; Karlsson et al. 1990), yeast, and plants (Müller et al. 1994; Mundel et al. 2000; Hicke et al. 2005). The LIM-domain contains two independent zinc fingers, with the consensus amino acid sequence of CX2CX16–23HX2CX2CX2CX16–21CX2–3(C/H/D) (Sadler et al. 1992) that has been shown to function in protein–protein interactions (Perez-Alvarado et al. 1994; Schmeichel and Beckerle 1994; Agulnick et al. 1996; Yao et al. 1999). The LIM-domain proteins were categorized into three groups (fig. 1) designated as Group 1 (Freyd et al. 1990), 2, and 3 (Taira et al. 1995; Dawid et al. 1998; Eliasson et al. 2000; Arnaud et al. 2007). Accumulating evidence suggests that these groups exhibit diverse regulatory mechanisms for a variety of basic cellular processes including gene transcription, cytoskeleton organization, cell lineages determination, signaling transduction, and pollen development (Baltz et al. 1992, 1999; Eliasson et al. 2000; Weiskirchen and Günther 2003).
Fig. 1.—

Modular structure of the LIM-domain proteins. (A) The LIM-domain gene superfamily. Groups 1, 2, and 3 identified by Dawid et al. (1998) exist widely in yeast, fungi, animals and plants. Group 4, a plant-specific LIM-domain (L) gene family was defined in this study. The black box with a letter L signifies the LIM-domain. The blue box stands for the homeodomain or kinase in Group 1. The green boxes stand for glycine-rich repeats in Group 2. Group 3 proteins contain multiple copies of LIM domain, and apostrophe in the black box of this group signifies different numbers of LIM-domains located at the C-terminus. In Group 4, the purple boxes are UIMs, the pink is nucleotide-binding site domain (NBS), and the orange is the LIM-associated unknown-function but conserved C-domain. Group 4 includes DA1-like and DA1-related (DAR-like) subgroups. DAR-like contains both DAR6-like and CHS3-like genes. CHS3-like genes encode two types of NBS-like resistance proteins. Of which DAR5 (Li et al. 2008) encodes a resistance to powdery mildew 8 (RPW8)-like NBS protein and was only found in Arabidopsis, whereas other CHS3-like genes including CHS3 from Arabidopsis (Yang et al. 2010; Bi et al. 2011) and MdoCHS3 (MDP0000289234) from Malus domestica encode the typical toll-interleukin receptor-NBS-LRR (leucine-rich repeat) type resistance proteins. Therefore, NBS as one characteristic domain for CHS3-like subgroup is shown. Other parts of the cartoons represent the sequences with no typical motifs or domains. (B–D) The sequence composition of the (B) UIM, (C) LIM, and (D) the conserved C-domain. The height of the each letter represents the probability of the letter at that position, and total height of the stack represents the information content of that position.
Recently, the Arabidopsis DA1 gene, which encodes a LIM-domain protein, was characterized to function as an ubiquitin receptor (Li et al. 2008). Ubiquitin is a highly conserved and wide-spread small protein modifier that is engaged in a wide range of cellular processes (Vierstra 2009) and biological processes, such as abnormal protein degradation (Yan et al. 2000; Raasi and Wolf 2007), hormonal signaling (Dreher and Callis 2007; Santner and Estelle 2010), resistance to disease and abiotic stresses (Dreher and Callis 2007; Trujillo and Shirasu 2010; Liu et al. 2011), and cell cycles (King et al. 1996). The consequences of ubiquitination are condemning the target protein to proteolysis (ubiquitin-26S proteasome system) or other fates, such as relocalization or endocytosis (Ikeda and Dikic 2008). DA1 is inevitably involved in ubiquitination and was found to extend the cellular proliferation period, thus increasing cell numbers and ultimately plant organ size (Li et al. 2008; Xia et al. 2013). A da1-1 mutant produces large seeds, with the overexpressed cDNA dramatically increasing the size of various organs in wild-type Arabidopsis (Li et al. 2008). Additionally, DA1 expression is induced by abscisic acid (ABA), an important player in various defense processes in plants, thus implying potential involvement in abiotic stress response (Li et al. 2008). DAR1, a DA1-like gene, can also influence growth (Li et al. 2008). Another DA1-related gene (DAR-like), CHS3, has been reported to play a role in the biotic resistance response (Yang et al. 2010; Bi et al. 2011). However, the function of other closely related DA1 homologs is unknown.
The multiple copies generated via gene duplication provide the raw genetic material associated with the complexity and diversity of the body architecture (Lynch and Conery 2000; Zhang 2003). Sequence changes either in the coding domain or in the regulatory regions are major determinants of plant and animal morphological evolution (Doebley and Lukens 1998). Soybeans are palaeopolyploid crops that provide oils and proteins internationally (Chung and Singh 2008; Schmutz et al. 2010) and display multiple copies of most genes in their genome, such as DA1-like genes. Due to the multiple gene duplication events seen in soybeans and the potential role of DA1-like genes in plant diversification, these plants can serve as a useful tool to understand this evolutionary process. In this study, we traced the evolutionary history of the DA1 gene family via combined analyses of both gene phylogeny and structure. The DA1 protein family seems to be plant-specific within a defined modular structure. This family should be placed in a new group (Group 4 as defined) within the LIM-domain superfamily (fig. 1). Owing to the agricultural and economic importance of soybeans, Glycine max DA1 (GmaDA1) gene expression and various abiotic stress responses were examined. Our work clarifies the evolutionary patterns and diversification processes of the DA1 gene family and provides further insights into the diversified roles of the proteins they encode, to enable the successful evolution of plants.
Materials and Methods
Plant Materials
The soybean cultivar “Suinong14” was grown in a greenhouse under short-day conditions (16 h dark/8 h light at 23–25 °C). The flower buds, mature flowers, 2-, 4-, and 6-day-old postfertilization fruits were harvested. The roots, stems, and leaves were harvested from the 2-week-old seedlings that were cultured with modified 50% Hoagland solution in a growth chamber under long-day conditions (16 h light/8 h dark at 23–25 °C). The harvested tissues were immediately stored in liquid N2 and total RNA was extracted using TRIzol reagent (Invitrogen).
Identification of the DA1 Gene Family
The sequence of Arabidopsis DA1 (AT1G19270) contains two UIMs (ubiquitin interaction motifs), one LIM-domain, and a conserved C-terminal (fig. 1) and was used to search for DA1-like genes from species with released whole genome sequences, with the exception of the inclusion of gymnosperms lacking whole genome sequences. Sequences that did not have the two UIMs but rather had a LIM-domain and the conserved C-terminal were defined as DA1-related genes (DAR-like), including DAR6 and CHS3. The BLASTN and TBLASTN programs were utilized with the following criteria: E value < 1E-05 and an amino acid identity above 40%, and the sequences were downloaded from the databases Phytozome (http://www.phytozome.net/, last accessed April 19, 2014) or NCBI (The National Center for Biotechnology Information, http://blast.ncbi.nlm.nih.gov/Blast.cgi, last accessed April 19, 2014). The Pfam (http://pfam.sanger.ac.uk/, last accessed April 19, 2014) and SMART (http://smart.embl-heidelberg.de/, last accessed April 19, 2014) databases were employed to detect conserved domains, with 142 DA1-like and seven DAR-like sequences obtained from the 33 plant species examined (supplementary table S1, Supplementary Material online).
Multiple Sequence Alignments and Phylogenetic Reconstruction
DA1-like sequences were aligned using the Clustal X v1.81 program (Thompson et al. 1997) with default parameters and alignments optimized via manual adjustments using BioEdit v 7.0.9.0 (Hall 1999). Sequences with poorly aligned positions such as large gaps and divergent regions at the N- and C-terminals were excluded from the phylogenetic analyses (supplementary data set S1, Supplementary Material online). DAMBE v 5.1.1 was used to check for substitution saturation for each codon position (Xia and Xie 2001), to reveal saturation of all positions and hence only a best-fit model of the amino acid sequences was tested. ProtTest version 2.4 (Abascal et al. 2005) was used to estimate the most appropriate model of amino acid substitution through both Akaike information criterion and Bayesian information criterion, suggesting that the JTT+G was the best-fit model. A rooted maximum likelihood (ML) tree was constructed using the PhyML v3.0 program (Guindon and Gascuel 2003) under the JTT+G model. The reliability of interior branches was assessed with 1,000 bootstrap resamplings and the gamma distribution parameter. Considering the limitations of PhyML in tree-space searches, Bayesian trees were also reconstructed with MrBayes (prset aamodelpr = mixed; ngen = 1000000) (Huelsenbeck and Ronquist 2001) and displayed using Treeview v0.4 (Page 1996). The Neighbor-joining (NJ) and ML methods (JTT model, bootstrap 100) in MEGA5 (Tamura et al. 2011) were used to reveal the clade relationship of the DA1 protein family using the characterized clade-specific residues.
Ancestral Character-State Reconstruction
To reveal the diversification process of DA1 family introns during the evolution, we conducted character-state reconstructions of the intron number and size using Mesquite version 2.75 (http://mesquiteproject.org, last accessed April 19, 2014). The phylogenetic topologies of these genes were used as input trees. The structure of the DA1-like genes possessed 14 character states (supplementary fig. S1, Supplementary Material online), with the ancestral states at the ancestral nodes of each phylogenetic tree traced by parsimony methods. Genome-wide evaluations of the variation in intron size suggest that introns could be divided into minimal and size-expandable categories (Yu et al. 2002; Wu et al. 2013). The minimal introns (50–150 bp) and the size-expandable introns (>150 bp) of the DA1-like genes were defined as previously described (Wu et al. 2013). For each gene, one of the two states (0 for minimal intron and 1 for size-expendable intron) was assumed and mapped onto the gene phylogenetic trees. Ancestral states at the ancestral nodes of each phylogenetic tree were traced by using both likelihood and parsimony methods in the “Trace Character History” function of Mesquite.
Evaluating Ancestral Duplication Events
Synteny analyses were performed in the Plant Genome Duplication Database (http://chibba.agtec.uga.edu/duplication/, last accessed April 19, 2014) using DA1-like (AthDA1-like) or Glycine max DA1 (GmaDA1-like) as queries. The Ks values of DA1-like genes were estimated using the Kumar method in MEGA 5 (Tamura et al. 2011). The absolute dates for the large-scale gene duplications were estimated using the assumed clock-like rates of synonymous substitution of 6.5 × 1.0−9 and 1.5 × 10⁻⁸ substitutions/synonymous site/year for cereals and dicots, respectively (Gaut et al. 1996; Koch et al. 2000).
Abiotic Stress Treatments in Soybean
“Suinong14” soybean seedlings were cultured with modified 50% Hoagland solution in a growth chamber under long-day conditions (16 h light/8 h dark at 23–25 °C), with the Hoagland solution changed every 3 days. For abiotic stress treatments, 2-week-old seedlings were transferred to the Hoagland solution supplemented with 20% PEG6000 or 200 mM NaCl for 4 h. For acid and alkaline stresses, the seedlings were initially grown in Hoagland solution at pH 6.0 and then transferred into Hoagland solution at pH 2.0 (acid) or pH 10.0 (alkaline) for 4 h. To analyze ABA responsiveness, the seedlings were transferred to Hoagland solution containing 10 μM ABA for 1, 3, 6, or 12 h. Each study set contained seedlings without any treatment to serve as controls, with the roots for each treatment harvested at the appropriate times for expression studies.
Quantitative Real-Time Polymerase Chain Reaction Analyses
Two micrograms of total RNA were treated with DNase I (Sigma-Aldrich) and used to synthesize the first strand cDNA using the M-MLV cDNA Synthesis Kit (Invitrogen). Quantitative real-time polymerase chain reaction (qRT-PCR) was conducted using SYBR Premix Ex TaqTM (TaKaRa) in an Mx3000P QPCR system (Stratagene), with ACTIN used to as an internal control and the primers used listed in supplementary table S4, Supplementary Material online. Each experiment was performed using three independent biological samples, with the priming efficiency and dissociation curve examined to ensure data quality. PCR was performed in a 25.0 µl reaction mixture containing 12.5 µl 2 × SYBR Premix Ex Taq (TaKaRa), 50 ng cDNA template, 0.5 µl of each primer (10.0 µM), and 10.5 µl of double distilled H2O. The optimized operational procedure was performed as follows: 30 s at 95 °C (1 cycle), 5 s at 95 °C and 40 s at 60 °C (40 cycles) and then 60 s at 95 °C, 30 s at 55 °C and 30 s at 95 °C (1 cycle for melting curve analysis). Relative gene expression was evaluated as previously described (Livak and Schmittgen 2001).
Results
Identification of a New Plant-Specific Group of LIM-Domain Proteins
Proteins containing LIM-domain were classified into three groups in fungi, yeast, animals, and plants (fig. 1). The LIM-domain protein DA1 in Arabidopsis features two UIMs proximal to the N-terminal, one zinc-binding LIM-domain followed by an LIM-associated unknown-function domain proximal to the C-terminal, thus being distinguished from all identified LIM-domain proteins (fig. 1). The proteins that shared these structural features were defined as DA1-like (and placed in the DA1 protein family). The latter two domains of DA1-like were also found to be shared by DAR6 and CHS3 (Li et al. 2008; Yang et al. 2010; Bi et al. 2011). These proteins were defined as DA1-related proteins (DAR-like). For this reason, these DA1-like and DAR-like homologs were defined as Group 4, a new LIM-domain protein group. To identify the members of this new group, the DA1 and DAR-like (DAR6 and CHS3) genes as queries to search all available sources, including Phytozome, EMBL, and NCBI databases. Altogether, genome sequences from 354 species including 33 plant species, 42 animals, 16 fungi, 14 yeasts, and 249 bacterial were surveyed. Ultimately, 142 DA1-like homologues were identified in the 33 plant genomes that have been currently sequenced, whereas a total of seven DAR-like genes were found to be unique to Arabidopsis thaliana, Malus domestica, and Brassica rapa (supplementary table S1, Supplementary Material online). For this reason, particular attention was paid to the DA1 gene family.
The coding sequence length of the identified DA1-like genes ranges from 1,356 to 1,695 bp. The N-terminals of the deduced putative proteins were variable, whereas the C-terminals, especially the LIM-containing C-domain, were highly conserved in both length and sequence (supplementary data set S1, Supplementary Material online). The diagnostic modular features of the DA1-like proteins were characterized as having two UIMs, one LIM-domain, and a conserved C-terminal (fig. 1B–D). Notably, the Group 4 LIM-domain homologs, including DA1-like, have not been identified in nonplant organisms, hinting a likely plant-specificity. The copy number of DA1-like genes varied from 2 (in Carica papaya) to 11 (in Glycine max) in the 33 plant genomes surveyed here (supplementary table S1, Supplementary Material online), suggesting different evolutionary histories after its origination in plants.
Phylogenetic Relationship of DA1-Like Proteins
To explore the evolution history of DA1-like genes, both Bayesian and ML methods were performed. Although the two phylogenetic trees had similar topologies, the Bayesian tree featured higher support values (fig. 2). The bases of the phylogenetic trees included Selaginella moellendorffii (SmoDA1) and Physcomitrella patens (PpaDA1) genes, with the PpaDA1 genes used as outgroups (fig. 2). Phylogenetically, these genes began to differentiate from the ancestral seed plant with 100% probability (fig. 2). Thus, the genes from both angiosperms and gymnosperms could be divided into Classes I and II, indicating a duplication event in the ancestor of seed plants (indicated by a star in fig. 2). However, the gene copy number and the phylogenetic topology were different in the two classes (supplementary table S1, Supplementary Material online; fig. 2). Class I contained 93 genes, with gymnosperm sequences forming a single group at the basal position and angiosperms separated into two subclades named Class I-M and Class I-D (M stands for monocots and D is for dicots). The Class I-M and Class I-D were further separated to two subclades, indicating that a duplication event may have occurred in both groups (indicated by arrows in fig. 2). The separation in the Class I-D was supported by a high probability (0.94), whereas a lower probability was noted for the Class I-M. However, most interior relationships within subclades were assured with high probabilities (fig. 2). Class II included 41 genes, with gymnosperm sequences forming a single group at the basal position and angiosperms divided into only two subclades called Class II-M and Class II-D with a 100% probability. Gene copy number variation between clades may be due to unequal frequencies of gene loss and gain following multiple duplication events.
Fig. 2.—

Phylogenetic tree of the DA1 gene family in plants. The tree was constructed with Bayesian method based on the amino acid sequences with the moss as outgroups. Posterior probabilities (>0.9) for this tree are shown on respective branches. The star means the gene family began to diverge at the ancestor of seed plants. The black arrows indicate the duplication events in dicots and monocots in Class I. The different clades are indicated in different colors lines: Class I (blue), Class II (pink), and SmoDA1 proteins and the outgroups (black). Class I was divided into Classes I-M and I-D and Class II into Classes II-M and II-D. Each of the genes is colored as follows: dicots (red), monocots (green), gymnosperms (orange), and BVP (black). Gene names and identifiers are shown in supplementary table S1, Supplementary Material online.
Collinearity analyses were performed to evaluate the effects of ancient large duplication events in the expansion of the DA1-like genes. Some DA1-like genes from the same class were found to be relatively collinear in some plant species, but no such collinearity was detected between Class I and Class II genes (supplementary fig. S2A–C, Supplementary Material online), indicating that the divergence of the two classes was not a consequence of the ancestral whole genome duplication. DA1-like genes in one class showed extensive synteny in closely related species such as in A. thaliana and A. lyrata, but the synteny of genes in more distantly related species was less pronounced (supplementary fig. S2A and B, Supplementary Material online), suggesting that the extent of synteny might be correlated to phylogenetic distance of plant species. No collinearity was observed in the DA1-like genes between Arabidopsis and soybeans. However, some collinear signals were detected between dicots and monocots within a given class (supplementary fig. S2B and C, Supplementary Material online), indicating that the DA1-like genes have different evolutionary histories in different plant lineages. The Ks values of DA1-like genes were also estimated. The Ks distribution displayed a huge and obvious peak (mode Ks = 1.5–1.9, marked in green) and a small bulge (mode Ks = 0.1–0.4, marked in pink) (supplementary fig. S2D, Supplementary Material online), hinting that two relatively large-scale duplication events occurred in this gene family at some point in 115–145 and 7.5–31 Myr in monocots, and 50–65 and 3.4–14 Myr in dicots. The present evaluations are not consistent with previous estimates that the ancestral whole genome duplication occurred in ancestors of seed plants (321 Myr) and angiosperms (210 Myr) (Blanc and Wolfe 2004; Jiao et al. 2011). In this way, separation of the DA1-like into Class I and Class II might be due to single gene duplication in the ancestor of the seed plants, and the expansion of these genes within each class might have been caused by multiple duplication events. However, the subsequent divergence in the coding region plays a key role in the origin of the observed phylogeny.
The Evolution of Clade-Specific Residues in DA1-Like Proteins
During evolution, the amino acids either remain conserved only undertaking amino acid changes with similar physicochemical property or undertake radical substitutions resulting in amino acid changes with different physicochemical property. To reveal substitutional patterns, the multiple sequence alignment of the DA1 protein family was examined (supplementary data set S1, Supplementary Material online). The residues at 13 positions (3, 148, 553, 571, 607, 621, 628, 629, 631, 660, 710, 714, and 783) were found to have distinguishing roles in the differentiation of the classes and subclades for DA1-like proteins with high support values (fig. 3). In basal vascular plants (BVP), two kinds of amino acids were often observed at these positions, one of which was often inherited and fixed in each subclade of the two classes during evolution (fig. 3). The residues at positions 3, 628, 710, and 714 in Class II were kept the same as those in BVP, whereas the proteins in Class I evolved new residues at these sites. Eight positions (148, 553, 571, 607, 621, 629, 660, and 783) in Class I shared residues with BVP, whereas the corresponding positions of a few Class II subclades were substituted with a new residue. Notably, both classes did not inherit the BVP position 631 residue, suggesting clade-specific residue development.
Fig. 3.—
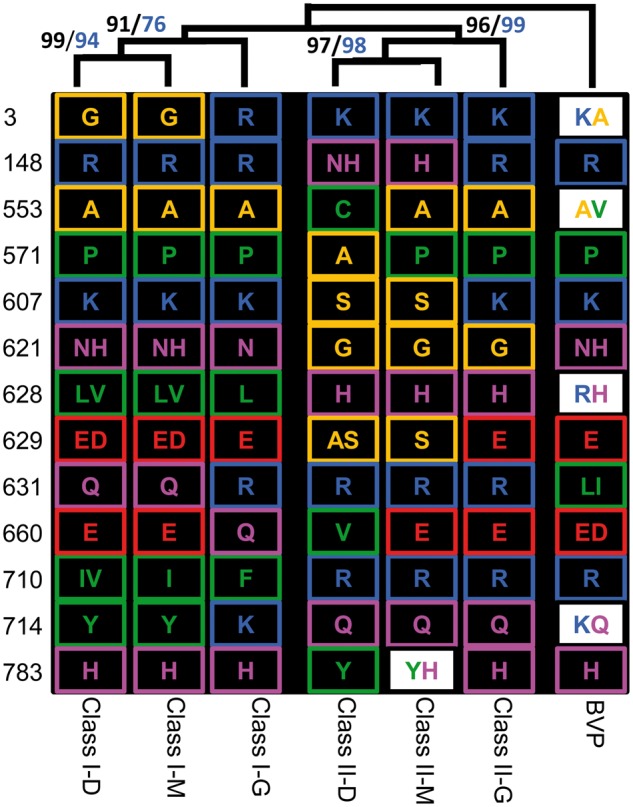
The evolution of clade-specific sites in the DA1 protein family. Multiple sequence alignments of the DA1 family characterized changes in 13 amino acids that can be used to separate the sequences into seven subclades: Class I-D, Class I-M, Class I-G, Class II-D, Class II-M, Class II-G, and BVP as determined by bootstrap values in ML (marked in black) and NJ (marked in blue). The color of amino acids are arranged so that small nonpolar residues (G, A, S, and T) are highlighted in orange, hydrophobic residues (C, V, I, L, P, F, Y, M, and W) are highlighted in green, polar residues (N, Q, and H) are highlighted in magenta, negatively charged residues (D and E) are highlighted in red, and positively charged residues (K and R) are highlighted in blue. White boxes represent cases where two different amino acids occurred in the subclade. Two amino acids that are boxed indicate that one of the two in this position is in other subclades.
The Evolution of Exon/Intron Structure in DA1-Like Genes
We further surveyed the exon/intron structures for Group 4 LIM-domain genes and found 84% of the identified genes contained 11 exons, whereas the remaining genes containing from 7 to 14 exons (supplementary fig. S1 and table S2, Supplementary Material online). Ancestral state reconstruction suggested that a ten-intron configuration might be an ancestral structure for DA1-like genes (supplementary fig. S1, Supplementary Material online; fig. 4). During evolution, each exon maintained a relatively constant length, whereas the ten introns exhibited significantly different lengths (supplementary fig. S1 and table S2, Supplementary Material online). The size of introns 2, 5, 6, 9, and 10 was statistically conserved (P > 0.5), but the others (introns 1, 3, 4, 7, and 8) were varied relative to the BVP intron size (supplementary fig. S3, Supplementary Material online). The first introns in Classes I-M and II-D were significantly longer (P < 0.01), whereas introns 7 and 8 in Classes I-M and II-D became significantly shorter (P < 0.0002) (supplementary fig. S3, Supplementary Material online). Additionally, in Class I-M, intron 3 was longer (P = 0.002), whereas intron 4 was shorter (P = 0.003) (supplementary fig. S3, Supplementary Material online).
Fig. 4.—
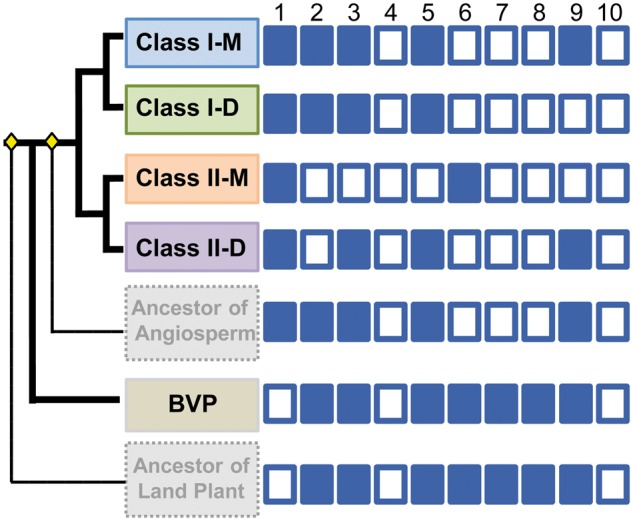
Intron evolution in the DA1 gene family. The intron number varied in the DA1 gene family; however, the ten-intron structure was plesiomorphic (supplementary fig. S1, Supplementary Material online). As such, the ancestral state of each intron size was also reconstructed by Mesquite to identify size-expandable introns (filled squares) and minimal introns (open squares). Yellow diamonds indicate the angiosperm and land plant ancestor. This figure was summarized from supplementary figure S4, Supplementary Material online.
The introns could be divided into minimal introns (50–150 bp) and size-expandable introns (>150 bp) in plants due to their sizes and functions (Wu et al. 2013). Based on this classification, 56.8% (631/1,110) of the 142 DA1-like genes comprised minimal introns and 43.2% (479/1,110) size-expandable introns. Unlike the intron size pattern of the DA1 genes from BVP, the angiosperm genes had six introns (introns 4, 6, 7, 8, 9, and 10) that contain more minimal than size-expandable introns that were mainly located toward the 3′-end of the genes. However, the remaining four introns (introns 1, 2, 3, and 5) showed the opposite trend and were biased toward the 5′-end of the genes (supplementary table S3, Supplementary Material online). Hence, the two kinds of introns had not randomly distributed among angiosperm genes, implying an evolutionary pattern. The ancestral state reconstruction showed that the ancestral intron size was consistent with the BVP-DA1-intron type, and that the ten DA1 introns had an overall transition pattern from size-expandable introns to minimal introns during the evolution of angiosperms (supplementary fig. S4, Supplementary Material online; fig. 4). Nonetheless, each intron has its own evolutionary pattern. Introns 4 and 10 were conserved as minimal introns during evolution, whereas the rests were changed. For the first intron, the minimal intron was an ancestral state (99.3% supported), but the intron ancestor in the ancestor of angiosperms changed to size-expandable introns (91.4% supported) and then was inherited. Conversely, the ancestral state of introns 6, 7, and 8 was the size-expandable in the ancestor of plants, but changed to the minimal intron in the ancestor of angiosperms and then was inherited. Intron 2 had a minimal intron ancestor, but changed to size-expandable introns in Class II (92.5% supported) during the evolution. Moreover, introns 3, 5, and 9 exhibited an evolutionary tendency similar to intron 2, but diverged into different classes (supplementary fig. S4, Supplementary Material online). These diverse evolutionary patterns in intron size of the DA1 genes in plants may hint at their functional diversifications in gene expression.
Genomic Organization of the GmaDA1 Genes in Soybean
Soybean is a staple crop for proteins and oils. In the soybean genome (Schmutz et al. 2010), 11 DA1 gene homologs were identified distributed on 8 of 20 chromosomes (fig. 5). Seven belonged to Class I and four were members of Class II. Two GmaDA1 genes were distributed on each of chromosome 2 (GmaDA1-2 and GmaDA1-3), 11 (GmaDA1-4 and GmaDA1-5), and 14 (GmaDA1-7 and GmaDA1-8) in the soybean genome. Interestingly, the two genes on each chromosome belonged to both Classes I and II, whereas the closely related GmaDA1-8 and GmaDA1-10 sequences, members of Class I, were located on different chromosomes (14 and 17, respectively). Although GmaDA1-4 and GmaDA1-7 contained 11 introns, other GmaDA1 genes featured ten introns, with intron size varied dramatically (fig. 5). These results suggest that GmaDA1 genes, as a miniature group of the Group 4 LIM-domain genes, may have undergone extensive divergence. The differences in gene expression of the DA1-like genes were investigated comprehensively in soybeans.
Fig. 5.—

Genomic organization of the GmaDA1 genes in soybean. The chromosomal (chr) location, type of class is given. Black boxes represent exons and lines represent introns.
Expressions of the GmaDA1 Genes during Soybean Development
Expressional divergence was examined via qRT-PCR. Total RNA was isolated from the roots, stems, and leaves of 2-week-old seedlings (cultivar Suinong14) and the floral organs (unfertilized flower buds and flowers) of 2-, 4-, and 6-day-old postfertilization fruits. Due to high sequence identity, one pair of primers was designed for GmaDA1-8 and GmaDA1-10 and their overall expression is here presented as GmaDA1-8/10. The results clearly showed that the GmaDA1 genes were expressed in roots, stems, and leaves at varying levels (fig. 6A). As GmaDA1-9 expression was relatively low in all of the tissues examined, its expression in the roots was used to normalize the gene expression in these assays. GmaDA1-2 and GmaDA1-4 in Class I and GmaDA1-7 in Class II had a relatively high expression in these three tissues (supplementary table S4, Supplementary Material online; fig. 6A). In Class II, GmaDA1-7 had a higher expression in leaves than in roots, with the opposite expressional pattern seen for the other genes, yet the Class I genes had a relatively high expression level in leaves relative to the roots.
Fig. 6.—

Expression of the GmaDA1 genes during soybean development. (A) Expression of GmaDA1 genes in different plant tissues. Total RNA was isolated from root (blue), stem (red), and leaf (yellow) tissues of 14-day-old seedlings. The GmaDA1-9 expression in roots was set as 1. (B) Expression of the GmaDA1 genes during flower and fruit development. Total RNA was isolated from unfertilized flower buds (magenta) and flowers (orange) and 2- (green), 4- (blue), and 6-day-old postfertilization fruit (purple). The GmaDA1-3 expression in flowers was set as 1. In (A) and (B), the ACTIN gene was used as an internal control. The experiments were repeated using three independent biological samples. Error bar: standard deviation. Significance was tested with the controls of roots (A) and the flower buds (B). Significance of *P < 0.05 and **P < 0.01.
During flower and fruit development, the expression levels of the GmaDA1 genes were also different (supplementary table S5, Supplementary Material online; fig. 6B). GmaDA1-3 and GmaDA1-6 peaked in 6-day-old fruits, whereas GmaDA1-5 and GmaDA1-11 exhibited significantly high expression levels (P < 0.0002) following fertilized and then declined to imply a regulatory role in fruit development (fig. 6B). Other GmaDA1 genes were declined with varying degrees during fruit development.
Expression of the GmaDA1 Genes in Response to Various Abiotic Stresses
In order to investigate various abiotic stress responses, 2-week-old seedlings were treated with salt, drought, acid and alkali for 4 h. The expression profiles of 11 GmaDA1 genes in roots were analyzed via qRT-PCR. We found that these genes showed different variation patterns in response to different stresses (supplementary table S5, Supplementary Material online; fig. 7). During the drought treatment with 20% PEG6000, the expression of GmaDA1-4, GmaDA1-6, and GmaDA1-9 in Class I and GmaDA1-5 and GmaDA1-7 in Class II was not significantly affected (P > 0.05), whereas the other genes were either up- or down-regulated (fig. 7A). During drought treatment, the expression of GmaDA1-3 and GmaDA1-11 in Class II and GmaDA1-8/10 in Class I was significantly up-regulated (P ≤ 3.1E-05), whereas GmaDA1-1 and GmaDA1-2 in Class II were significantly down-regulated (P ≤ 0.03). During the salt treatment (200 mM NaCl), the expression of GmaDA1-2 and GmaDA1-9 in Class I and GmaDA1-3 in Class II was significantly repressed (P < 0.03), whereas the expression of GmaDA1-4 in Class I, GmaDA1-5 and GmaDA1-11 in Class II was strongly induced (P ≤ 0.0002). The expressional changes of the other genes were indistinguishable from that of the nontreated samples. These observations suggest that the GmaDA1 genes might have different roles in response to drought and salinity.
Fig. 7.—
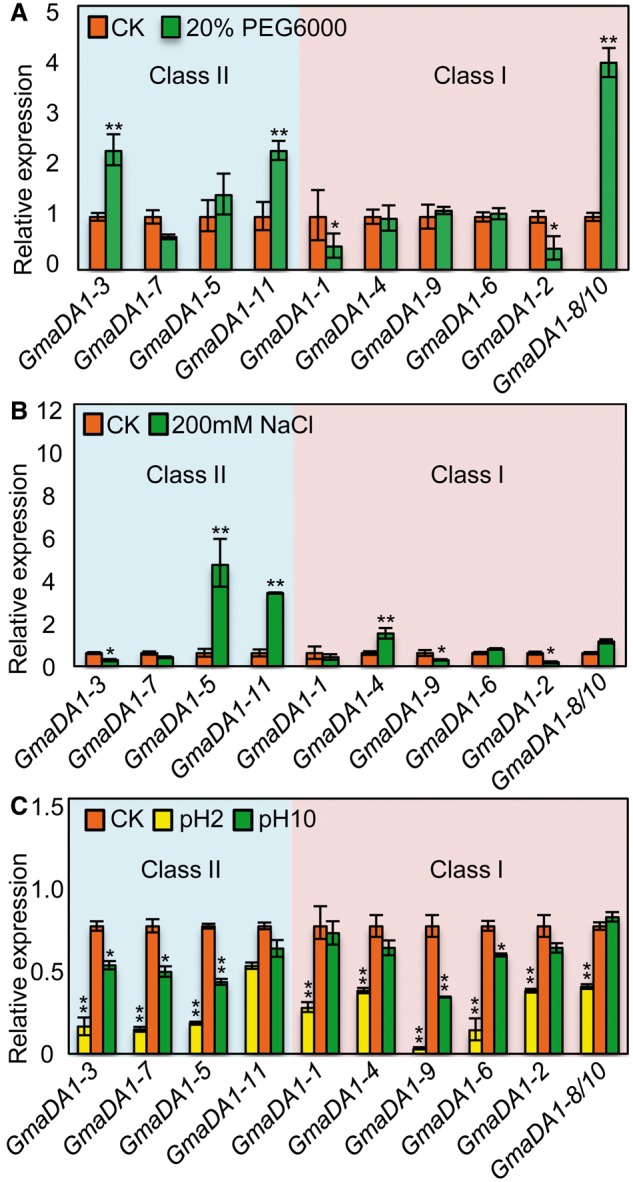
Expression of the GmaDA1 genes in response to various abiotic stresses. (A) Relative gene expression in response to 20% PEG6000. (B) Relative gene expression in response to 200 mM NaCl. (C) Relative gene expression in response to acid and alkali stresses. Total RNA from the roots 4-h posttreatment were subjected to qRT-PCR analyses. Gene Expression for the untreated samples (red column) were set as controls (CK), whereas their expression variation in response to stresses was shown as indicated, with ACTIN used as an internal control. The experiments were performed using three independent biological samples. Error bar: standard deviation. Significance was tested relative to each CK. Significance of *P < 0.05 and **P < 0.01.
The GmaDA1 genes had multiple responses to the different pH treatments. When the microenvironment around roots was acid (pH 2.0), nearly all the gene expression was significantly down-regulated (fig. 7C). GmaDA1-9 in Class I showed the most significant change, with a 20-fold decrease (P = 4.1E-05). However, during alkali treatments, the expression of some GmaDA1 genes (GmaDA1-3, GmaDA1-5 and GmaDA1-7 in Class II, and GmaDA1-6 and GmaDA1-9 in Class I) was repressed in the roots, whereas other genes were insensitive to the alkali environment (fig. 7C).
Diverse Expression of the GmaDA1 Genes in Response to ABA
We also investigated the messenger RNA (mRNA) expression of these GmaDA1 genes in response to ABA, an important hormonal player during abiotic stress. Again, different responding patterns occurred in Classes I and II. Diverse expression trends were observed in Class II (fig. 8A–D). The expression of GmaDA1-3 and GmaDA1-11 fluctuated: Induced significantly in short-time treatments but repressed or kept stable after long-time treatments (supplementary table S5, Supplementary Material online; fig. 8A and D). However, GmaDA1-5 and GmaDA1-7 were moderately up-regulated by all of the treatments (supplementary table S5, Supplementary Material online; fig. 8B and C). Unlike the genes in Class II, all of the Class I GmaDA1 genes showed significantly increased expression during the treatments, with different genes displaying different response levels (supplementary table S5, Supplementary Material online; fig. 8E–J). GmaDA1-1, GmaDA1-4, and GmaDA1-9 were all significantly repressed after the 1-h treatment (P < 0.01, fig. 8E, G, and J) and then became significantly induced. Nevertheless, the expression of GmaDA1-2, GmaDA1-6, and GmaDA1-8/10 was unchanged after the 1- or 3-h treatments, whereas they were steadily induced after 6-h treatment (fig. 8F, H, and I).
Fig. 8.—

Expression of the GmaDA1 genes in response to ABA. (A–D) Gene expression of Class II in response to ABA treatments. (E–J) Gene expression of Class I in response to ABA treatments. Total RNA from roots at 0, 1, 3, 6, and 12 h after ABA treatment analyzed via qRT-PCR analyses. Expression of each gene as indicated in the nontreated (0 h) was set as a control (CK) and the ACTIN gene was used as a loading control. The experiments were performed using three independent biological samples. Error bar: standard deviation. The significance was tested relative to each CK. Significance of *P < 0.05 and **P < 0.01.
Discussion
DA1-like genes, including DA1 and DAR1, are newly characterized genes found in Arabidopsis. They act redundantly in organ size regulation (Li et al. 2008; Xia et al. 2013). The DAR-like gene CHS3 plays a role in resistance signaling and cold response (Yang et al. 2010; Bi et al. 2011). In this study, we placed these sequence-related proteins containing one LIM-associated C-domain in Group 4 of the LIM-domain proteins. This group includes DA1-like (142 members) and DAR-like (seven members) subgroups in the currently sequenced plant genomes. The evolutionary patterns of the DA1-like genes, which form the dominant family in Group 4, were thoroughly characterized and the diverse gene expression patterns investigated in soybeans, thus supporting their functional diversification during the evolution of plants.
Evolutionary Implications of Intron Size Variation in the DA1 Gene Family
The DA1 gene family has experienced many gene loss and gain events since it first emerged. This caused considerable copy number variation among plant species. Substantial differentiations might have occurred during the evolution of this gene family. The divergence of their protein sequences contributed to the phylogenetic topology. The variation in intron size is also substantial. Introns of the DA1-like genes could be divided into minimal and size-expandable groups. In line with previous observations (Yu et al. 2002; Zhu et al. 2010; Wu et al. 2013), the minimal introns in the DA1 gene family were located at the 3′-end of genes, whereas the size-expandable introns were biased to the 5′-end. These introns exhibited diverse evolutionary patterns, with the state with more size-expandable introns being plesiomorphic and introns 1, 4, and 10 being ancestrally small. The minimal introns are small in size (≈100 bp). They evolved to be efficient in the coupled process of transcription–splicing–export (Wu et al. 2013). The minimal introns play an important regulatory role in enhancing the exportation rate of the highly abundant and large housekeeping genes which reside at the surface of chromatin territories, thus preventing entanglement with other genes interiorly located (Zhu et al. 2010). Furthermore, the small introns can improve transcription efficiency, splicing accuracy or reduce the cell sizes which increase the rate of gas exchange per unit volume (Hughes and Hughes 1995; Lynch 2002), whereas the size-expandable introns function in maintaining pre-mRNA secondary structure, thus playing a regulatory role in splicing and gene expression (Schaeffer and Miller 1993; Kirby et al. 1995; Leicht et al. 1995; Carlini et al. 2001; Haddrill et al. 2005). Moreover, the longer introns, especially the first intron, may reflect the different functional properties that they possess, such as intron-mediated enhancement of heterologous gene expression (Mascarenhas et al. 1990), insertion frequency of short interspersed nuclear elements (Majewski and Ott 2002), or proportion of conserved elements (Keightley and Gaffney 2003; Chamary and Hurst 2004). The temporal and spatial patterns of gene expression might have been diversified because of changes in the sequence and length of the introns. Therefore, the evolution patterns of the introns in the DA1 gene family reflected the diversifications of gene functions as the plant species evolved. This needs to be further substantiated with bioinformatic studies of the cis-elements and comparative evaluation of functional effects of the various introns in gene expression.
Evolution of the Novel Plant-Specific LIM-Domain Proteins
Three groups (designated Groups 1–3) of the LIM-domain superfamily widely existed in various multicellular and unicellular organisms (Dawid et al. 1998; Eliasson et al. 2000; Arnaud et al. 2007). However, the DA1- and DAR-like genes represent a new group of the LIM-domain proteins, thus defined as Group 4. An extensive survey in all available whole genome sequenced species revealed that DAR-like genes were only found in a few plant species, and DA1-like genes were prevalent in sequenced plant genomes despite having a different copy numbers. Notably, the Group 4 LIM-domain proteins were only found in land plants, thus indicating that it is a plant-specific gene family. The extant angiosperms have been attested to have experienced a rapid diversification in the Early Cretaceous period when the environment underwent tremendous changes (Stuessy 2004; Field and Arens 2005), resulting in the evolution of many plant-specific genes.
Many plant-specific transcription factors evolved to control flower (Theissen et al. 1996; Navaud et al. 2007) and leaf development (Bartholmes et al. 2012) to aid in their rapid radiation. To overcome the disadvantage of their immobility, plants also evolved many genes in response to various environmental stresses (Le et al. 2011; Mizoi et al. 2012). DA1 expression occurs in response to ABA in Arabidopsis (Li et al. 2008). The DAR-like gene CHS3 is associated with resistance signaling and cold response (Yang et al. 2010; Bi et al. 2011). This suggests that these genes might also function in other biological processes such as in abiotic and biotic stress responses. This was further verified by our observations that GmaDA1 gene expression in the roots showed clear and diverse responses to salt, drought, acid and alkali stresses and ABA in soybeans. This implies that DA1-like proteins underwent extensive functional diversifications during their evolution, possibly enhancing their adaptive abilities. Comparative gene expression of wild and the cultivated soybeans and extensive transgenic analyses will substantiate these assumptions.
Group 4 LIM-Domain Genes Encode Multifunctional Proteins
In addition to the roles they play in response to various environmental stimuli, these genes might have acquired other roles in plant development (Li et al. 2008; Yang et al. 2010; Bi et al. 2011). Arabidopsis DA1, the founder of the Group 4 LIM-domain protein superfamily, is involved in the regulation of seed and organ size (Li et al. 2008; Xia et al. 2013). During fruit development, the GmaDA1-5 and GmaDA1-11 expression peaked after fertilization, whereas GmaDA1-3 and GmaDA1-6 expression peaked in 6-day-old fruits, hinting that they might potentially have a role in fruit development. This assumption needs further functional analyses. Nonetheless, the evolution of the clade-specific residues, diverse and complicated variations in the intron size and gene expression play an essential role in the functional diversifications of the DA1-like genes. The evolution of these multifunctioning proteins in turn might play an essential role in the evolution and development of plants.
In summary, our genome-wide surveys and analyses suggest that the DA1 gene family, which is a dominant family within the Group 4 LIM-domain genes, is plant-specific and has been split into Classes I and II in the ancestor of seed plants. The copy number variation observed here was caused by different duplication events, and the distinct phylogenetic topology of the two classes increased because of substantial divergence in coding regions. Moreover, this gene family exhibits diverse intron size patterns that evolved after the transition from the size-expandable introns to the minimal ones during the emergence and diversification of angiosperms. Concomitantly, diverse gene expression was observed in this family in response to various developmental cues and abiotic stresses in soybeans. The reason why these DAR-like genes are only found in a few plant species needs further investigation, but the evolutionary features and the diversification processes of the Group 4 LIM-domain proteins are likely to have contributed to the successful radiation of plants.
Supplementary Material
Supplementary data set S1, figures S1–S4, and tables S1–S5 are available at Genome Biology and Evolution online.
Acknowledgments
C.Y.H. conceived and designed the experiments. M.Z. performed the experiments. L.H., Y.G., Y.W., and Q.C. participated in stress treatments, plant material preparation, and expression studies. M.Z. performed evolutionary analyses. M.Z. and C.Y. H. analyzed the data. M.Z. and C.Y.H. drafted the manuscript. All authors have read and approved the manuscript. This work was supported by the grants (the Hundred Talent Program and XDA08010105) from the Chinese Academy of Sciences.
Literature Cited
- Abascal F, Zardoya R, Posada D. ProtTest: selection of best-fit models of protein evolution. Bioinformatics. 2005;21:2104–2105. doi: 10.1093/bioinformatics/bti263. [DOI] [PubMed] [Google Scholar]
- Agulnick AD, et al. Interactions of the LIM-domain-binding factor Ldb1 with LIM homeodomain proteins. Nature. 1996;384:270–272. doi: 10.1038/384270a0. [DOI] [PubMed] [Google Scholar]
- Arnaud D, Déjardin A, Leplé JC, Lesage-Descauses MC, Pilate G. Genome-wide analysis of LIM gene family in Populus trichocarpa, Arabidopsis thaliana, and Oryza sativa. DNA Res. 2007;14:103–116. doi: 10.1093/dnares/dsm013. [DOI] [PMC free article] [PubMed] [Google Scholar]
- Baltz R, Evrard JL, Domon C, Steinmetz A. A LIM motif is present in a pollen-specific protein. Plant Cell. 1992;4:1465–1466. doi: 10.1105/tpc.4.12.1465. [DOI] [PMC free article] [PubMed] [Google Scholar]
- Baltz R, Schmit AC, Kohnen M, Hentges F, Steinmetz A. Differential localization of the LIM domain protein PLIM-1 in microspores and mature pollen grains from sunflower. Sex Plant Reprod. 1999;12:60–65. [Google Scholar]
- Bartholmes C, Hidalgo O, Gleissberg S. Evolution of the YABBY gene family with emphasis on the basal eudicot Eschscholzia californica (Papaveraceae) Plant Biol. 2012;14:11–23. doi: 10.1111/j.1438-8677.2011.00486.x. [DOI] [PubMed] [Google Scholar]
- Bi D, et al. Mutations in an atypical TIR-NB-LRR-LIM resistance protein confer autoimmunity. Front Plant Sci. 2011;2:71. doi: 10.3389/fpls.2011.00071. [DOI] [PMC free article] [PubMed] [Google Scholar]
- Blanc G, Wolfe KH. Widespread paleopolyploidy in model plant species inferred from age distributions of duplicate genes. Plant Cell. 2004;16:1667–1678. doi: 10.1105/tpc.021345. [DOI] [PMC free article] [PubMed] [Google Scholar]
- Carlini DB, Chen Y, Stephan W. The relationship between third-codon position nucleotide content, codon bias, mRNA secondary structure and gene expression in the Drosophilid alcohol dehydrogenase genes Adh and Adhr. Genetics. 2001;159:623–633. doi: 10.1093/genetics/159.2.623. [DOI] [PMC free article] [PubMed] [Google Scholar]
- Chamary JV, Hurst LD. Similar rates but different modes of sequence evolution in introns and at exonic silent sites in rodents: evidence for selectively driven codon usage. Mol Biol Evol. 2004;21:1014–1023. doi: 10.1093/molbev/msh087. [DOI] [PubMed] [Google Scholar]
- Chung G, Singh RJ. Broadening the genetic base of soybean: a multidisciplinary approach. CRC Crit Rev Plant Sci. 2008;27:295–341. [Google Scholar]
- Dawid IB, Breen JJ, Toyama R. LIM domains: multiple roles as adapters and functional modifiers in protein interactions. Trends Genet. 1998;14:156–162. doi: 10.1016/s0168-9525(98)01424-3. [DOI] [PubMed] [Google Scholar]
- Doebley J, Lukens L. Transcriptional regulators and the evolution of plant form. Plant Cell. 1998;10:1075–1082. doi: 10.1105/tpc.10.7.1075. [DOI] [PMC free article] [PubMed] [Google Scholar]
- Dreher K, Callis J. Ubiquitin, hormones and biotic stress in plants. Ann Bot. 2007;99:787–822. doi: 10.1093/aob/mcl255. [DOI] [PMC free article] [PubMed] [Google Scholar]
- Eliasson A, et al. Molecular and expression analysis of a LIM protein gene family from flolecula plants. Mol Gen Genet. 2000;264:257–267. doi: 10.1007/s004380000312. [DOI] [PubMed] [Google Scholar]
- Field TS, Arens NC. Form, function and environments of the early angiosperms: merging extant phylogeny and ecophysiology with fossils. New Phytol. 2005;166:383–408. doi: 10.1111/j.1469-8137.2005.01333.x. [DOI] [PubMed] [Google Scholar]
- Freyd G, Kim SK, Horvitz HR. Novel cysteine-rich motif and homeodomain in the product of the Caenorhabditis elegans cell lineage gene lin-11. Nature. 1990;344:876–879. doi: 10.1038/344876a0. [DOI] [PubMed] [Google Scholar]
- Gaut BS, Morton BR, McCaig BC, Clegg MT. Substitution rate comparisons between grasses and palms: synonymous rate differences at the nuclear gene Adh parallel rate differences at the plastid gene rbcL. Proc Natl Acad Sci U S A. 1996;93:10274–10279. doi: 10.1073/pnas.93.19.10274. [DOI] [PMC free article] [PubMed] [Google Scholar]
- Guindon S, Gascuel O. A simple, fast, and accurate algorithm to estimate large phylogenies by maximum likelihood. Syst Biol. 2003;52:696–704. doi: 10.1080/10635150390235520. [DOI] [PubMed] [Google Scholar]
- Haddrill PR, Charlesworth B, Halligan DL, Andolfatto P. Patterns of intron sequence evolution in Drosophila are dependent upon length and GC content. Genome Biol. 2005;6(8):R67. doi: 10.1186/gb-2005-6-8-r67. [DOI] [PMC free article] [PubMed] [Google Scholar]
- Hall TA. BioEdit: a user-friendly biological sequence alignment editor and analysis program for Windows 95/98/NT. Nucleic Acids Symp Ser. 1999;41:95–98. [Google Scholar]
- Hicke L, Schubert HL, Hill CP. Ubiquitin-binding domains. Nat Rev Mol Cell Biol. 2005;6(8):610–621. doi: 10.1038/nrm1701. [DOI] [PubMed] [Google Scholar]
- Huelsenbeck JP, Ronquist F. MRBAYES: Bayesian inference of phylogenetic trees. Bioinformatics. 2001;17(8):754–755. doi: 10.1093/bioinformatics/17.8.754. [DOI] [PubMed] [Google Scholar]
- Hughes AL, Hughes MK. Small genomes for better flyers. Nature. 1995;377:391. doi: 10.1038/377391a0. [DOI] [PubMed] [Google Scholar]
- Ikeda F, Dikic I. A typical ubiquitin chains: new molecular signals, ‘Protein modifications: Beyond the Usual Suspects’ review series. EMBO Rep. 2008;9:536–542. doi: 10.1038/embor.2008.93. [DOI] [PMC free article] [PubMed] [Google Scholar]
- Jiao Y, et al. Ancestral polyploidy in seed plants and angiosperms. Nature. 2011;473:97–102. doi: 10.1038/nature09916. [DOI] [PubMed] [Google Scholar]
- Karlsson O, Thor S, Norberg T, Ohlsson H, Edlund T. Insulin gene enhancer binding protein Isl-1 is a member of a novel class of proteins containing both a homeo- and a Cys-His domain. Nature. 1990;344:879–882. doi: 10.1038/344879a0. [DOI] [PubMed] [Google Scholar]
- Keightley PD, Gaffney DJ. Functional constraints and frequency of deleterious mutations in noncoding DNA of rodents. Proc Natl Acad Sci U S A. 2003;100:13402–13406. doi: 10.1073/pnas.2233252100. [DOI] [PMC free article] [PubMed] [Google Scholar]
- King RW, Deshaies RJ, Peters JM, Kirschner MW. How proteolysis drives the cell cycle. Science. 1996;274:1652–1659. doi: 10.1126/science.274.5293.1652. [DOI] [PubMed] [Google Scholar]
- Kirby DA, Muse SV, Stephan W. Maintenance of pre-mRNA secondary structure by epistatic selection. Proc Natl Acad Sci U S A. 1995;92:9047–9051. doi: 10.1073/pnas.92.20.9047. [DOI] [PMC free article] [PubMed] [Google Scholar]
- Koch MA, Haubold B, Mitchell-Olds T. Comparative evolutionary analysis of chalcone synthase and alcohol dehydrogenase loci in Arabidopsis, Arabis, and related genera (Brassicaceae) Mol Biol Evol. 2000;17:1483–1498. doi: 10.1093/oxfordjournals.molbev.a026248. [DOI] [PubMed] [Google Scholar]
- Le DT, et al. Genome-wide survey and expression analysis of the plant-specific NAC transcription factor family in soybean during development and dehydration stress. DNA Res. 2011;18:263–276. doi: 10.1093/dnares/dsr015. [DOI] [PMC free article] [PubMed] [Google Scholar]
- Leicht BG, Muse SV, Hanczyc M, Clark AG. Constraints on intron evolution in the gene encoding the myosin alkali light chain in Drosophila. Genetics. 1995;139:299–308. doi: 10.1093/genetics/139.1.299. [DOI] [PMC free article] [PubMed] [Google Scholar]
- Li Y, Zheng L, Corke F, Smith C, Bevan MW. Control of final seed and organ size by the DA1 gene family in Arabidopsis thaliana. Genes Dev. 2008;22:1331–1336. doi: 10.1101/gad.463608. [DOI] [PMC free article] [PubMed] [Google Scholar]
- Liu YC, Wu YR, Huang XH, Sun J, Xie Q. AtPUB19, a U-box E3 ubiquitin ligase, negatively regulates abscisic acid and drought responses in Arabidopsis thaliana. Mol Plant. 2011;4(6):938–946. doi: 10.1093/mp/ssr030. [DOI] [PMC free article] [PubMed] [Google Scholar]
- Livak KJ, Schmittgen TD. Analysis of relative gene expression data using real-time quantitative PCR and the 2−ΔΔCt method. Methods. 2001;25:402–408. doi: 10.1006/meth.2001.1262. [DOI] [PubMed] [Google Scholar]
- Lynch M. Intron evolution as a population-genetic process. Proc Natl Acad Sci U S A. 2002;99:6118–6123. doi: 10.1073/pnas.092595699. [DOI] [PMC free article] [PubMed] [Google Scholar]
- Lynch M, Conery JS. The evolutionary fate and consequences of duplicate genes. Science. 2000;290:1151–1155. doi: 10.1126/science.290.5494.1151. [DOI] [PubMed] [Google Scholar]
- Majewski J, Ott J. Distribution and characterization of regulatory elements in the human genome. Genome Res. 2002;12:1827–1836. doi: 10.1101/gr.606402. [DOI] [PMC free article] [PubMed] [Google Scholar]
- Mascarenhas D, Mettler U, Pierce DA, Lowe HW. Intron-mediated enhancement of heterologous gene expression in maize. Plant Mol Biol. 1990;15:913–920. doi: 10.1007/BF00039430. [DOI] [PubMed] [Google Scholar]
- Mizoi J, Shinozaki K, Yamaguchi-Shinozaki K. AP2/ERF family transcription factors in plant abiotic stress responses. Biochim Biophys Acta. 2012;1819:86–96. doi: 10.1016/j.bbagrm.2011.08.004. [DOI] [PubMed] [Google Scholar]
- Müller L, Xu G, Wells R, Hollenberg CP, Piepersberg W. LRG1 is expressed during sporulation in Saccharomyces cerevisiae and contains motifs similar to LIM and rho/racGAP domains. Nucleic Acids Res. 1994;22:3151–3154. doi: 10.1093/nar/22.15.3151. [DOI] [PMC free article] [PubMed] [Google Scholar]
- Mundel C, et al. A LIM-domain protein from sunflower is localized to the cytoplasm and/or nucleus in a wide variety of tissues and is associated with the phragmoplast in dividing cells. Plant Mol Biol. 2000;42:291–302. doi: 10.1023/a:1006333611189. [DOI] [PubMed] [Google Scholar]
- Navaud O, Dabos P, Carnus E, Tremousaygue D, Herve C. TCP transcription factors predate the emergence of land plants. J Mol Evol. 2007;65:23–33. doi: 10.1007/s00239-006-0174-z. [DOI] [PubMed] [Google Scholar]
- Page RD. TreeView: an application to display phylogenetic trees on personal computers. Comput Appl Biosci. 1996;12(4):357–358. doi: 10.1093/bioinformatics/12.4.357. [DOI] [PubMed] [Google Scholar]
- Perez-Alvarado GC, et al. Structure of the carboxy-terminal LIM domain from the cysteine rich protein CRP. Nat Struct Biol. 1994;1:388–398. doi: 10.1038/nsb0694-388. [DOI] [PubMed] [Google Scholar]
- Raasi S, Wolf DH. Ubiquitin receptors and ERAD: a network of pathways to the proteasome. Semin Cell Dev Biol. 2007;18:780–791. doi: 10.1016/j.semcdb.2007.09.008. [DOI] [PubMed] [Google Scholar]
- Sadler I, Crawford AW, Michelsen JW, Beckerle MC. Zyxin and cCRP: two interactive LIM domain proteins associated with the cytoskeleton. J Cell Biol. 1992;119:1573–1587. doi: 10.1083/jcb.119.6.1573. [DOI] [PMC free article] [PubMed] [Google Scholar]
- Santner A, Estelle M. The ubiquitin-proteasome system regulates plant hormone signaling. Plant J. 2010;61:1029–1040. doi: 10.1111/j.1365-313X.2010.04112.x. [DOI] [PMC free article] [PubMed] [Google Scholar]
- Schaeffer SW, Miller EL. Estimates of linkage disequilibrium and the recombination parameter determined from segregating nucleotide sites in the alcohol dehydrogenase region of Drosophila pseudoobscura. Genetics. 1993;135:541–552. doi: 10.1093/genetics/135.2.541. [DOI] [PMC free article] [PubMed] [Google Scholar]
- Schmeichel KL, Beckerle MC. The LIM domain is a modular protein-binding interface. Cell. 1994;79:211–219. doi: 10.1016/0092-8674(94)90191-0. [DOI] [PubMed] [Google Scholar]
- Schmutz J, et al. Genome sequence of the palaeopolyploid soybean. Nature. 2010;463:178–183. doi: 10.1038/nature08670. [DOI] [PubMed] [Google Scholar]
- Stuessy TF. A transitional-combinatorial theory for the origin of angiosperms. Taxon. 2004;53:3–16. [Google Scholar]
- Taira M, Evrard JL, Steinmetz A, Dawid IB. Classification of LIM proteins. Trends Genet. 1995;11:431–432. doi: 10.1016/s0168-9525(00)89139-8. [DOI] [PubMed] [Google Scholar]
- Tamura K, et al. MEGA5: molecular evolutionary genetics analysis using maximum likelihood, evolutionary distance, and maximum parsimony methods. Mol Biol Evol. 2011;28:2731–2739. doi: 10.1093/molbev/msr121. [DOI] [PMC free article] [PubMed] [Google Scholar]
- Theissen G, et al. A short history of MADS-box genes in plants. Plant Mol Biol. 2000;42:115–149. [PubMed] [Google Scholar]
- Theissen G, Kim JT, Saedler H. Classification and phylogeny of the MADS-box multigene family suggest defined roles of MADS-box gene subfamilies in the morphological evolution of eukaryotes. J Mol Evol. 1996;43:484–516. doi: 10.1007/BF02337521. [DOI] [PubMed] [Google Scholar]
- Thompson JD, Gibson TJ, Plewniak F, Jeanmougin F, Higgins DG. The CLUSTAL_X windows interface: flexible strategies for multiple sequence alignment aided by quality analysis tools. Nucleic Acids Res. 1997;25:4876–4882. doi: 10.1093/nar/25.24.4876. [DOI] [PMC free article] [PubMed] [Google Scholar]
- Trujillo M, Shirasu K. Ubiquitination in plant immunity. Curr Opin Plant Biol. 2010;13:402–408. doi: 10.1016/j.pbi.2010.04.002. [DOI] [PubMed] [Google Scholar]
- Vierstra RD. The ubiquitin-26S proteasome system at the nexus of plant biology. Nat Rev Mol Cell Biol. 2009;10:385–397. doi: 10.1038/nrm2688. [DOI] [PubMed] [Google Scholar]
- Way JC, Chalfie M. mec-3, a homeobox-containing gene that specifies differentiation of the touch receptor neurons in C. elegans. Cell. 1988;54:5–16. doi: 10.1016/0092-8674(88)90174-2. [DOI] [PubMed] [Google Scholar]
- Weiskirchen R, Günther K. The CRP/MLP/TLP family of LIM domain proteins: acting by connecting. BioEssays. 2003;25:152–162. doi: 10.1002/bies.10226. [DOI] [PubMed] [Google Scholar]
- Wu JY, et al. Systematic analysis of intron size and abundance parameters in diverse lineages. Sci China Life Sci. 2013;56:968–974. doi: 10.1007/s11427-013-4540-y. [DOI] [PubMed] [Google Scholar]
- Xia T, et al. The ubiquitin receptor DA1 interacts with the E3 ubiquitin ligase DA2 to regulate seed and organ size in Arabidopsis. Plant Cell. 2013;25:3347–3359. doi: 10.1105/tpc.113.115063. [DOI] [PMC free article] [PubMed] [Google Scholar]
- Xia X, Xie Z. DAMBE: software package for data analysis in molecular biology and evolution. J Hered. 2001;92:371–373. doi: 10.1093/jhered/92.4.371. [DOI] [PubMed] [Google Scholar]
- Yan N, Doelling JH, Falbel TG, Durski AM, Vierstra RD. The ubiquitin-specific protease family from Arabidopsis. AtuBP1 and 2 are required for the resistance to the amino acid analog canavanine. Plant Physiol. 2000;124:1828–1843. doi: 10.1104/pp.124.4.1828. [DOI] [PMC free article] [PubMed] [Google Scholar]
- Yang H, et al. A mutant CHS3 protein with TIR-NB-LRR-LIM domains modulates growth, cell death and freezing tolerance in a temperature-dependent manner in Arabidopsis. Plant J. 2010;63:283–296. doi: 10.1111/j.1365-313X.2010.04241.x. [DOI] [PubMed] [Google Scholar]
- Yao X, et al. Solution structure of the chicken cysteine-rich protein, CRP1, a double-LIM protein implicated in muscle differentiation. Biochemistry. 1999;38:5701–5713. doi: 10.1021/bi982036y. [DOI] [PubMed] [Google Scholar]
- Yu J, et al. Minimal introns are not “junks.”. Genome Res. 2002;12:1185–1189. doi: 10.1101/gr.224602. [DOI] [PMC free article] [PubMed] [Google Scholar]
- Zhang J. Evolution by gene duplication: an update. Trends Ecol Evol. 2003;18:292–298. [Google Scholar]
- Zhu J, et al. A novel role for minimal introns: routing mRNAs to the cytosol. PLoS One. 2010;5(4):e10144. doi: 10.1371/journal.pone.0010144. [DOI] [PMC free article] [PubMed] [Google Scholar]
Associated Data
This section collects any data citations, data availability statements, or supplementary materials included in this article.