

Abstract
DNA microarrays are used for gene-expression profiling, single-nucleotide polymorphism detection and disease diagnosis1–3. A persistent challenge in this area is the lack of microarray screening technology suitable for integration into routine clinical care4,5. Here, we describe a method for sensitive and label-free electrostatic readout of DNA or RNA hybridization on microarrays. The electrostatic properties of the microarray are measured from the position and motion of charged microspheres randomly dispersed over the surface. We demonstrate nondestructive electrostatic imaging with 10-μm lateral resolution over centimeter-length scales, which is four-orders of magnitude larger than that achievable with conventional scanning electrostatic force microscopy. Changes in surface charge density as a result of specific hybridization can be detected and quantified with 50-pM sensitivity, single base-pair mismatch selectivity and in the presence of complex background. Because the naked eye is sufficient to read out hybridization, this approach may facilitate broad application of multiplexed assays.
Effective medical care is often limited by the failure to diagnose diseases in resource-limited settings. For example, tuberculosis kills 2 million people each year, and, according to the 2006 Global Health Diagnostics Forum, 400,000 lives a year could be saved if a rapid and accurate diagnostic test requiring minimal instrumentation were available6. DNA microarray-based assays promise rapid on-site identification of multiple pathogens, which is particularly important for proper treatment of individuals afflicted by multiple diseases or drug-resistant strains of diseases3,7. However, microarray assays typically rely on fluorescence detection, which requires time-consuming chemical labeling, reverse transcription, high-power excitation sources and sophisticated instrumentation for scanning. Consequently, microarray assays tend to be performed by dedicated centers rather than by individual laboratories, and not by clinics in developing countries2,8. Many label-free DNA detection techniques such as surface plasmon resonance9,10, electrochemical sensing11,12, fluorescent polymers13, atomic force microscopy14,15, microcantilevers16 and electronic depletion of a field effect transistor17,18 have been introduced in efforts to circumvent some of the problems inherent to chemical labeling19–21. However, none of these have gained widespread use because each requires either complex device fabrication or sophisticated instrumentation for readout. Additionally, none are compatible with conventional DNA microarrays where up to 106 sequences can be interrogated in a single experiment21,22.
We report a fundamentally different, electrostatic-based DNA or RNA detection method that is label-free and can be massively multiplexed. In its first implementation, we demonstrate 50-pM sensitivity, single-base mismatch selectivity and native RNA expression profiling in a conventional microarray format. Complementary oligonucleotide binding strongly affects the electrostatic charge of the surface due to the negatively charged DNA phosphate backbone15,18. In this approach, hybridization is measured electrostatically using charged microspheres that are highly responsive to changes in charge density on the microarrayed surface (Fig. 1). Interactions between the microspheres and substrate can be imaged by a variety of optical methods that provide a rapid indicator of DNA hybridization. The role of each silica microsphere is analogous to that of an electrostatic force microscope (EFM) tip where the vertical deflection of the tip is used to report local electrostatic surface properties. EFM, however, is a serial technique that is practically limited to a field of view of 100 μm2 (refs. 15,23). Even state-of-the-art parallel scanning probe microscopy systems, which have as many as 4,096 integrated cantilevers, cannot address the length scales required for microarray analysis, not to mention the technological obstacles involved in operating such systems in EFM mode24. The particle-based technique described here is capable of parallel sampling of a microarray surface over centimeter-length scales, which is the largest area to be electrostatically imaged with micron-scale resolution to date.
Figure 1.
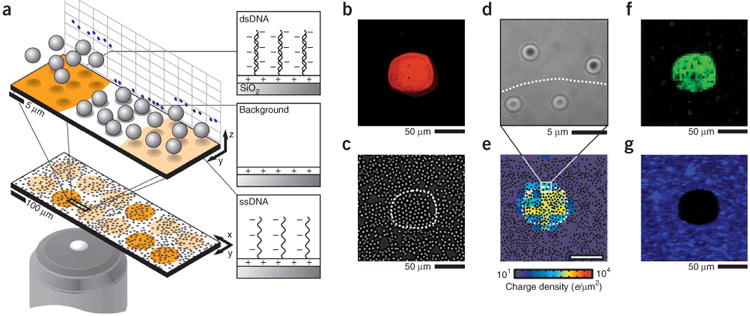
Electrostatic microarray readout using microparticle probes. (a) A suspension of negatively charged silica microspheres is gravitationally sedimented over a microarray surface. The positions and motions of a population of microspheres are used to image the surface charge of the microarray and detect hybridization. This is because areas displaying double-stranded DNA are highly negatively charged compared to areas displaying ssDNA, and both contrast with the positively charged background. (b) Typical epifluorescence image of a microspot displaying DNA A after hybridizing with 50 nM Cy3-labeled A′ (20 min, 1× SSC). (c) Brightfield image after 5.6-mm diameter silica microspheres are allowed to sediment gravitationally for 20 min. The dashed line indicates the spot's perimeter as determined by fluorescence. (d) Representative RICM image of 5.6-μm diameter silica spheres. Such interferograms are used to measure the height of microspheres, and, consequently, the magnitude of electrostatic repulsion over the surface. (e) The charge density map, as compiled from RICM observations of microspheres (black dots). (f) Over negatively charged areas, microspheres are laterally mobile as indicated by the variance of brightfield intensity over time (pixel size is 3 × 3 μm). (g) Microspheres that remain adhered after agitating the surface can be observed by darkfield microscopy to identify positively charged regions. Images b–g correspond to the same spot and were collected in 100 μM NaCl.
Due to nonlinear screening interactions in aqueous environments, charged microparticles are responsive to a limited range of surface charge densities (at experimental conditions, the range is ∼10 to 106 e/μm2)25. Thus, the charge density of hybridized spots must be tuned within this optimal range. This is achieved by positively biasing the glass support using an aminosilane modification, which balances the negative charge contributed by both the glass surface and the printed single strand (ss)DNA molecules (Fig. 1a). Substrates are rendered thiol reactive using a heterofunctional crosslinking reagent, and an oligoethylene glycol surface functionalization is used to minimize nonspecific adsorption. The optimal print concentration of ssDNA probes with the greatest sensitivity was determined by measuring the charge of each spot across a dilution series of spots.
In a typical experiment, a prepared substrate is mounted in a well chamber and hybridized. A fluorescence image of a representative spot after hybridization with Cy3-A′ (see Supplementary Table 1 online for sequences) is shown in Figure 1b. Note that fluorescence imaging and labeling of target DNA are not required, but are only performed for comparison. Unlabeled and negatively charged 5.6 μm–diameter silica (microparticles are then added and allowed to sediment above (or otherwise interact with) the array over a period of 20 min. Microspheres uniformly distribute across the entire surface (Fig. 1c) and adsorb to the positively charged background. However, over sufficiently negatively charged areas, they adopt an equilibrium height that is dictated by a balance between gravitational and local electrostatic forces. To determine the precise heights and positions of the population of levitated microspheres, we then acquired a collection of dual-wavelength reflection interference contrast microscopy (RICM) images (Fig. 1d) covering the entire array area26. Image acquisition was automated using a motorized translation stage, and a software-driven autofocus routine. At each stage position, 20 images were acquired (0.4 fps) yielding 20,000 images/mm2. On average, there were 20 microspheres per field of view (30 × 30 μm) resulting in 400,000 microparticle observations/mm2. The interference images corresponding to individual microspheres were used to determine their position with 1-nm vertical resolution and 16-nm lateral resolution27. Although this is an optical technique, the resolution is not diffraction limited; it is determined by the particle position resolution and the density of particle observations.
A quantitative spatial map of the surface charge density is generated by compiling the set of three-dimensional (3D) particle position measurements. The imaged area is divided into a grid of squares (10 μm; 40 ± 7 position observations per square), and the median height (5 nm s.e.m.) of particles was used to calculate the surface charge density within each square through an electrostatic force model (Supplementary Methods online) (Fig. 1e). The dashed line in the electrostatic charge density image (Fig. 1e) indicates the spot perimeter as determined by fluorescence (Fig. 1b). Notably, the highest charge density in Figure 1e is predominantly located within the confines of the dashed line, confirming agreement of both readouts.
To quantify the electrostatic response across a range of DNA surface densities, a series of spots was printed using binary mixtures of oligonucleotide sequences, A and B, with linearly varying molar ratios. In each series, the total ssDNA concentration was maintained while linearly adjusting the mole fraction of A from 0 to 1. Because both A and B strands are electrostatically and sterically identical, the hybridization efficiency at each spot remains constant28. Therefore, after hybridization, the density of AA′ duplexes is linearly related to the density of A strands at each spot, and the total DNA density varies linearly. The charge density map of two of these series, printed with total ssDNA concentrations of 5 and 6 μM, shows a gradual increase in charge density as a function of the mole fraction of A (Fig. 2a). The charge density corresponds with fluorescence intensities and doubles as the mole fraction of A changes from 0 to 1 (Fig. 2b). The measured surface charge densities agree with results quoted in the literature for comparable systems16,18.
Figure 2.
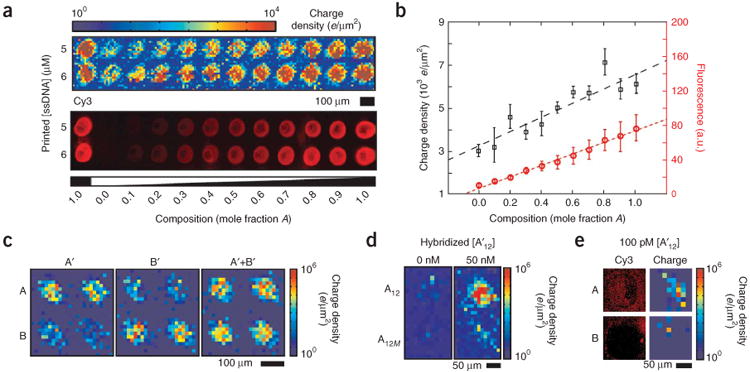
Electrostatic response to DNA surface density. (a) A graded DNA density was generated by printing spots with a mixture of specific, A, and control, B, DNA while maintaining a constant total DNA concentration (5 or 6 μM, as indicated). Charge density and fluorescence images of the same array are shown after hybridization with 50 nM A′. (b) Plot of the average charge density and fluorescence intensity in spots along the 5-μM lane in a. The dashed lines are linear fits. The charge density roughly doubles as the molar fraction of A increases from 0 to 1. This is consistent with the expectation that complementary DNA binding should double the ssDNA charge density. (c) Electrostatic response of a 2 × 2 array of A and B DNA to specific hybridization with target DNA A′, B′ or both A′ and B′ strands. (d) Image of A12 (5′-TACCACATCATC-3′) and A12m (5′-TACCAAATCATC-3′) spots before and after hybridization with 50 nM A′ for 20 min, which indicates that electrostatic imaging can resolve a single base-pair mismatch. (e) Epifluorescence and electrostatic images of A and B spots after overnight hybridization with 100 pM A′ DNA. All hybridizations were performed in 1× SSC and images were collected in 100 μM NaCl.
To investigate the specificity of electrostatic-based imaging, we examined two cases where nonspecific binding can affect electrostatic response. First, a 2 × 2 array of A and B spots was hybridized with 50 nM A′, 50 nM B′, or both. This resulted in a specific increase in charge density (3 × 10³ e/μm2) of complementary spots relative to noncomplementary spots, which were only mildly charged (150 e/μm2) (Fig. 2c). Second, probe sequences of A12 (5′-TACCACATCATC-3′) and A12M (5′-TACCAAATCATC-3′) differing by a single base were imaged before and after hybridization with 50 nM A12′ (Fig. 2d). Each of these spots can be distinguished electrostatically, which is important for diagnostic and genotyping applications involving single nucleotide polymorphisms (SNP). Additionally, by hybridizing overnight, 100 pM AA′ hybridization could also be differentiated electrostatically (Fig. 2e). These results indicate that surface charge imaging is a powerful approach to selectively detect DNA hybridization in a conventional microarray format.
However, practical diagnostics require rapid and simple quantitative readouts that do not use dedicated instrumentation or intensive image processing. To develop such a readout strategy we take advantage of the fact that silica microspheres respond to the surface charge in an easily observable manner. If the surface is negatively charged, microparticles remain laterally mobile and can be easily visualized by monitoring the intensity variance in a time series of brightfield images (Fig. 1f). Alternatively, positively charged areas can be identified by the presence of electrostatically adhered microspheres. This can be rapidly imaged using darkfield (Fig. 1g) or brightfield microscopy. Therefore, adhesion of charged particles provides a simple test to map the sign of the surface charge.
To develop this binary readout into a quantitative assay, we generated a gradient of surface charge densities by printing a series of DNA spots with a linear range of concentrations (1–25 μM). This effectively tunes the net charge of DNA spots from positive to negative (Fig. 3a). When the negative charge contribution from ssDNA is equivalent to the positive charge contribution of the aminosilane background, the spot will be neutral. This is analogous to an equivalence point and, for the present purposes, is defined as such. Upon hybridization with DNA, complementary spots become more negatively charged causing a shift in the location of the equivalence point along a series of spots relative to a noncomplementary control series (Fig. 3b). This shift can be easily imaged by examining the mobility of microspheres using low-magnification optics, without the need for complex instrumentation (Supplementary Figs. 1–3 online). In these experiments, DNA can be detected at a concentration as low as 50 pM using 30-mer capture sequences under standard hybridization conditions, with a dynamic range extending over three orders of magnitude (Fig. 3c). Direct comparison between fluorescence and electrostatic detection on the same substrates, under identical conditions reveals comparable figures of merit, indicating that sensitivity is primarily limited by hybridization, not the readout. State-of-the-art fluorescence imaging for microarrays using confocal scanners and specialized hybridization conditions has been reported to achieve sensitivities of 1–5 pM (http://www.affymetrix.com/support/technical/technotes/25mer_technote.pdf). As was demonstrated by the classic Millikan oil-drop experiment, particle-based electrostatic readout can resolve the fundamental unit of charge (one electron) (Supplementary Note online). Thus similar detection limits as fluorescence may also be anticipated using electrostatic readout under appropriately optimized substrate and hybridization conditions. Notably, the electrostatic approach enables array readout over large areas such as a 1″ × 3″ microscope slide (3,000 spots/cm2) using darkfield imaging of adsorbed microspheres (Fig. 3d). Because microparticles are unlabeled, detection can be rapidly performed with low-power, low-magnification systems or even the naked eye (Fig. 3e).
Figure 3.
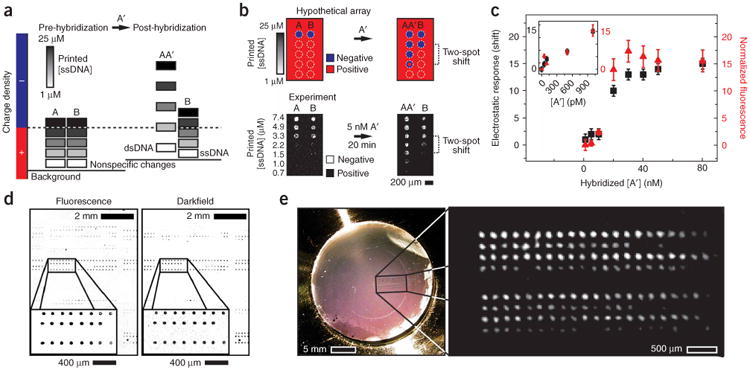
Simplified readout using charged microparticles. (a) A series of microarray spots are printed with a gradient of ssDNA densities to titrate the surface charge from net positive to net negative. After hybridization (in 1× SSC), complementary spots become more negatively charged. In each series, the change in DNA density can be identified by a shift in the number of negatively biased spots relative to a control series. (b) Schematic and experimental data demonstrate this concept. Images of the variance in brightfield intensity over 30 s indicate where sedimented 2.34-μm diameter silica spheres remain mobile. Negatively charged areas appear bright due to the lateral motion of microspheres repelled by the surface. Relative to the control DNA series, B, two additional spots in the AA′ row appear negatively biased, indicating a specific change in charge density due to hybridization. (c) The observed shift is dependent on the concentration of target A′. The plot compares this label-free readout with fluorescence data obtained on the same substrate under identical conditions. Inset points were hybridized overnight, and all others were performed for 20 min. (d) Darkfield and epifluorescence (inverse contrast) micrographs of a representative area from a 7,000-spot microarray hybridized (20 min, 1× SSC, 50 nM A′). This suggests that this assay is compatible with conventional microarrays that cover cm2 areas. (e) Photograph of a side-illuminated microarray after hybridization and development with 2.34-μm diameter silica spheres. On average, there are 200–300 microparticles/spot. Inset, right, shows a digitally magnified region of the array (inverse contrast with subtracted background). Bright areas indicate regions of high DNA density. All images collected in 100 μM NaCl.
Because gene expression profiling is the most widely implemented application of microarray technology, it is important to demonstrate that electrostatic readout can be applied to physiological samples to identify a specific transcript in a complex background of cellular mRNA. We focused on detection of human aldolase A (ALD, also known as ABCD1) and methionine-tRNA synthetase (MARS) mRNA in purified but unamplified poly(A)-RNA extracted from human breast adenocarcinoma MCF-7 cells. Prior to the measurements, the unamplified poly(A)-RNA was randomly fragmented to 60–200 bp in length to match the length of probe strands, and hybridization was performed for 20 min with 100 ng of RNA in 30 μl of 1 × SSC heated to 60 °C (Fig. 4a). Brightfield variance (Fig. 1f) of a 4 × 4 array interrogated with 2.34-μm diameter silica spheres indicates the electrostatic response of the MARS probe spot is larger than that of the ALD probe spot after hybridization (Fig. 4b). To date, the only other demonstration of primary mRNA detection in surface array format without amplification or labeling has been performed using microcantilever arrays16. However, microcantilevers cannot be multiplexed to the level of standard DNA microarrays because of the technological difficulties and cost associated with microfabrication, chemical modification and integration of large numbers of cantilevers16.
Figure 4.
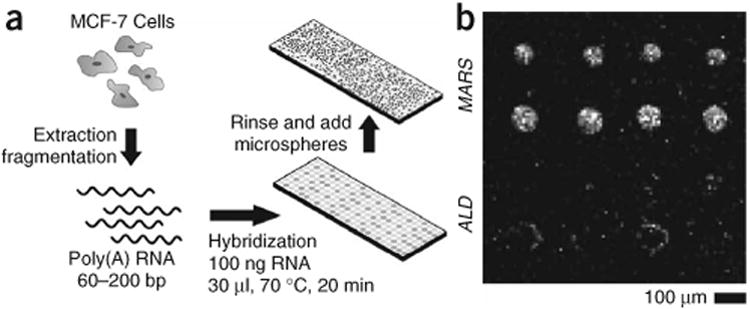
Label-free expression profiling with primary mRNA. (a) Scheme of procedure used to measure mRNA expression in breast adenocarcinoma MCF-7 cells. (b) A brightfield intensity variance image of 2.34-μm silica microspheres shows the differential expression of human aldolase A gene (ALD) and human methionine-tRNA synthetase (MARS) gene in a 4 × 4 array of spots (in 100 μM NaCl). This indicates that MARS is more highly expressed compared to ALD in this sample of cells.
This particle-based electrostatic detection method offers multiple advantages over existing microarray detection methods. First, expression profiling and SNP detection using primary mRNA can now be performed without reverse transcription and fluorescent tagging. Second, electrostatic detection is compatible with conventional microarrays as well as unconventional arrays fabricated on injection-molded plastic or embedded within microfluidic architectures29,30. Third, imaging by pixel-by-pixel statistical averaging of colloidal particle positions is not diffraction limited, which suggests a strategy to take advantage of DNA nanoarrays that can hold 104 more features per unit area than conventional microarrays15,30,31. Finally, microarrays consisting of proteins32, small molecules33, polymers34 and heterogeneous catalysts35 are rapidly coming online and might benefit from the electrostatic readout platform we describe herein.
Methods
Microarrays
Oligonucleotide microarrays were generated using a conventional robotic spotter to deposit ssDNA on activated glass coverslips. Substrates were prepared by etching for 15 min in piranha (1:3 30% H2O2:H2SO4), washing six times in ultrapure (18.2 MΩ/cm) water and three times in ethanol. The silica surface was then functionalized with aminopropyltrimethoxysilane (Fluka > 97%) by incubation in a 2% (vol/vol) ethanol solution for 1 h. Subsequently, substrates were rinsed with ethanol, dried under a stream of N2 and annealed at 80 °C for 1 h. Finally, substrates were activated with succinimidyl-4-(N-maleimidomethyl)cyclohexane-1-carboxylate (Pierce) by incubating in a 2 mg/ml DMSO solution overnight.
Microarrays were generated by using an in-house robotic arrayer (Functional Genomics Facility, UC Berkeley) with silicon microcontact printing pins (Parallel Synthesis). The DNA print concentrations ranged from 1 to 25 μM in 3× SSC. After printing, substrates were passivated against nonspecific DNA adsorption by incubating in a 2 mg/ml 11-mercaptoundecyl-hexa(ethylene glycol) DMSO solution overnight. Finally, substrates were rinsed in ethanol, dried with an N2 stream and stored under dry N2 until final use. Similar results were obtained by immobilizing ssDNA on aminosilane-treated coverslips with UV crosslinking (300 mJ/cm2), and followed by blocking with an N-hydroxysuccinimide methyl-capped ethylene oxide reagent (methyl-PEO12-NHS ester, Pierce).
Oligonucleotides
All DNA sequences purified by high-performance liquid chromatography (Supplementary Table 1) were purchased from Integrated DNA Technologies. Disulfide-modified DNA was treated with a tris(2-carboxyethyl)phosphine hydrochloride reducing gel (Pierce) before use. Hybridizations with target DNA in the nM range of concentrations were performed in 1× SSC solution where the analyte DNA was heated to ∼70 C° and then allowed to cool for 20 min. Alternatively, hybridization was allowed to proceed overnight when pM target DNA concentrations were present to maximize signal. After hybridization, microarrays were rinsed with 50 ml 1× SSC followed by a rinse with 50 ml deionized (18.2 MΩ/cm) water. We considered the possibility that dehybridization may occur in the deionized water during rinsing and particle-based readout. This is not the case, and hybridized DNA is stable under low ionic strength conditions for weeks, which is also confirmed by literature precedent18. Nonetheless, DNA crosslinking reagents (such as psoralen) covalently couple duplexes and eliminate the possibility of dehybridization.
Microarray imaging
Silica particles (Bangs Labs) with diameters ranging from 5.68 μm to 0.97 μm were used for imaging. To collect darkfield images, we allowed silica particles to sediment onto the surface of the microarray. The substrate was subsequently inverted for a period of 10 min and then a 4× objective was used to collect darkfield images of the substrate. The scattering from 2.34-μm diameter silica particles was sufficiently intense that a cell phone camera could be used to image a side-illuminated microarray through a magnifying glass. To collect brightfield variance data, 2.34-μm silica particles were allowed to sediment for ∼20 min, and then particle positions were measured by collecting time-lapse images for a total of 30 s. The variance in these images was used to distinguish between laterally mobile and immobile silica microparticles.
RICM
Dual-wavelength RICM was performed using a Nikon TE-2000 inverted fluorescence microscope fitted with a 100× plan apo oil immersion objective (NA 1.3). Sample illumination was provided by a mercury arc lamp and filtered using a dual-band pass (460–480 nm and 510–550 nm) excitation filter (Chroma). The aperture diaphragm was set to provide a small illumination numerical aperture (INA 0.496) and, hence, minimal angular variation in the incident light. This is important for maximizing the contrast between interference fringes. The field diaphragm was partially closed to facilitate reproducible focusing on the coverslip-water interface. Reflected light was imaged onto separate halves of a single CCD camera (Quantix 57, Roper Scientific) using a DualView (Optical Insights) image splitter interposed between the body of the microscope and the camera. Microspheres imaged by dual-wavelength RICM produce interferograms that depend on the particle height and the illumination wavelength regardless of the presence of neighboring microspheres. The height of an individual microsphere is estimated by correlating interferograms from respective color channels with interferograms calculated according to an image formation theory. The absolute height is determined by finding the pair of correlation maxima that coincide across each color channel. Image pairs lacking unique agreement correspond to malformed or partially imaged particles and are excluded from further analysis. Lateral positions within an image are measured independently in each color channel by image correlation. By accounting for the lateral location where the image was acquired, microspheres across the entire array could be localized. A distributed image processing framework was developed that allowed processing of data sets to generate 3D particle positions using a flexible number of workstations as each application demanded.
Large area scanning
The acquisition protocol for RICM imaging of a microarray involved several steps that were automated using Matlab together with μManager. An ASI-MS2000 translation stage equipped with a linear encoder was used for translating the sample with 200-nm precision over the imaged area. At each location, an autofocus routine was used to ensure reproducible focusing, and 40 images were acquired at a rate of 0.4 Hz. The frame rate was chosen to ensure that the vertical fluctuations of beads were uncorrelated from frame to frame.
Expression profiling
Both breast adenocarcinoma (MCF-7) poly(A) RNA and RNA fragmentation reagents were acquired from Ambion. RNA fragmentation was performed using a zinc acetate reagent according to the manufacturer's instructions. All hybridizations were performed with 100 ng of RNA in 30 μl of 1× SSC buffer heated to 70 C°. Probe sequences used for expression profiling were obtained from http://www.Affymetrix.com/.
3D particle tracking
Surface charge density can be quantitatively determined using an electrostatic model (Supplementary Methods and Supplementary Fig. 4 online) to interpret the heights of microspheres above the array. For this approach to succeed, the 3D position of tens of the thousands of microparticles must be determined over centimeter-length scales. RICM was used here because it facilitates determination of the absolute separation distance between the microarray surface and individual particles with 5-nm resolution without complications due to closely neighboring particles. A caveat of RICM is that image contrast is generated using a single wavelength according to the phase of interfering rays; absolute phase information has been lost introducing ambiguity into height measurements26. Dual-wavelength RICM was developed to overcome this problem26. Recently, we introduced an RICM-based method capable of localizing the 3D positions of a population of microspheres using an image correlation technique27. By adapting this methodology to the analysis of dual-wavelength RICM images, the absolute 3D particle positions can be determined unambiguously.
Supplementary Material
Acknowledgments
We thank Lance Kizer and the UC Berkeley Functional Genomics Laboratory for assistance in generating microarrays. This work was supported by the Director, Office of Science, Office of Basic Energy Sciences of the US Department of Energy under Contract No. DE-AC03-76SF00098. N.G.C. also received partial support from the National Science Foundation through The Center on Polymer Interfaces and Macromolecular Assemblies.
Footnotes
Author Contributions: N.G.C. and K.S. designed and implemented all experiments. N.G.C., K.S. and J.T.G. conceived of ideas and wrote the paper.
Note: Supplementary information is available on the Nature Biotechnology website.
References
- 1.McGuire A, Cho M, McGuire S, Caulfield T. Medicine: the future of personal genomics. Science. 2007;317:1687. doi: 10.1126/science.1147475. [DOI] [PMC free article] [PubMed] [Google Scholar]
- 2.Cobb JP, et al. Application of genome-wide expression analysis to human health and disease. Proc Natl Acad Sci USA. 2005;102:4801–4806. doi: 10.1073/pnas.0409768102. [DOI] [PMC free article] [PubMed] [Google Scholar]
- 3.Barken K, Haagensen JJ, Tolker-Nielsen T. Advances in nucleic acid-based diagnostics of bacterial infections. Clin Chim Acta. 2007;384:1–11. doi: 10.1016/j.cca.2007.07.004. [DOI] [PubMed] [Google Scholar]
- 4.Aitman TJ. Science, medicine, and the future: DNA microarrays in medical practice. Br Med J. 2001;323:611–615. doi: 10.1136/bmj.323.7313.611. [DOI] [PMC free article] [PubMed] [Google Scholar]
- 5.Abdullah-Sayani A, Bueno-de-Mesquita JM, van de Vijver Marc J. Technology insight: tuning into the genetic orchestra using microarrays—limitations of DNA microarrays in clinical practice. Nat Clin Pract Oncol. 2006;3:501–516. doi: 10.1038/ncponc0587. [DOI] [PubMed] [Google Scholar]
- 6.Global Health Diagnostics Forum. The right tools can save lives. Nature. 2006;444:681. doi: 10.1038/444681a. [DOI] [PubMed] [Google Scholar]
- 7.Mabey D, Peeling RW, Ustianowski A, Perkins MD. Diagnostics for the developing world. Nat Rev Microbiol. 2004;2:231–240. doi: 10.1038/nrmicro841. [DOI] [PubMed] [Google Scholar]
- 8.Steinmetz LM, Davis RW. Maximizing the potential of functional genomics. Nat Rev Genet. 2004;5:190–201. doi: 10.1038/nrg1293. [DOI] [PubMed] [Google Scholar]
- 9.Fang S, Lee HJ, Wark AW, Corn RM. Attomole microarray detection of microRNAs by nanoparticle-amplified SPR imaging measurements of surface polyadenylation reactions. J Am Chem Soc. 2006;128:14044–14046. doi: 10.1021/ja065223p. [DOI] [PMC free article] [PubMed] [Google Scholar]
- 10.Cooper MA. Optical biosensors in drug discovery. Nat Rev Drug Discov. 2002;1:515–528. doi: 10.1038/nrd838. [DOI] [PubMed] [Google Scholar]
- 11.Fan C, Plaxco KW, Heeger AJ. Electrochemical interrogation of conformational changes as a reagentless method for the sequence-specific detection of DNA. Proc Natl Acad Sci USA. 2003;100:9134–9137. doi: 10.1073/pnas.1633515100. [DOI] [PMC free article] [PubMed] [Google Scholar]
- 12.Drummond TG, Hill MG, Barton JK. Electrochemical DNA sensors. Nat Biotechnol. 2003;21:1192–1199. doi: 10.1038/nbt873. [DOI] [PubMed] [Google Scholar]
- 13.Nilsson KP, Inganas O. Chip and solution detection of DNA hybridization using a luminescent zwitterionic polythiophene derivative. Nat Mater. 2003;2:419–424. doi: 10.1038/nmat899. [DOI] [PubMed] [Google Scholar]
- 14.Zhou D, Sinniah K, Abell C, Rayment T. Label-free detection of DNA hybridization at the nanoscale: a highly sensitive and selective approach using atomic-force microscopy. Angew Chem Int Ed. 2003;42:4934–4937. doi: 10.1002/anie.200352178. [DOI] [PubMed] [Google Scholar]
- 15.Sinensky AK, Belcher AM. Label-free and high-resolution protein//DNA nanoarray analysis using Kelvin probe force microscopy. Nat Nanotechnol. 2007;2:653–659. doi: 10.1038/nnano.2007.293. [DOI] [PubMed] [Google Scholar]
- 16.Zhang J, et al. Rapid and label-free nanomechanical detection of biomarker transcripts in human RNA. Nat Nanotechnol. 2006;1:214–220. doi: 10.1038/nnano.2006.134. [DOI] [PubMed] [Google Scholar]
- 17.Hahm Ji, Lieber CM. Direct ultrasensitive electrical detection of DNA and DNA sequence variations using nanowire nanosensors. Nano Lett. 2004;4:51–54. [Google Scholar]
- 18.Fritz J, Cooper E, Gaudet S, Sorger PK, Manalis SR. Electronic detection of DNA by its intrinsic molecular charge. Proc Natl Acad Sci USA. 2002;99:14142. doi: 10.1073/pnas.232276699. [DOI] [PMC free article] [PubMed] [Google Scholar]
- 19.Hood L, Heath J, Phelps M, Lin B. Systems biology and new technologies enable predictive and preventative medicine. Science. 2004;306:640–643. doi: 10.1126/science.1104635. [DOI] [PubMed] [Google Scholar]
- 20.Drummond TG, Hill MG, Barton JK. Electrochemical DNA sensors. Nat Biotechnol. 2003;21:1192–1199. doi: 10.1038/nbt873. [DOI] [PubMed] [Google Scholar]
- 21.'t Hoen PC, deKort F, vanOmmen GJB, denDunnen J. Fluorescent labelling of cRNA for microarray applications. Nucleic Acids Res. 2003;31:e20. doi: 10.1093/nar/gng020. [DOI] [PMC free article] [PubMed] [Google Scholar]
- 22.Dove A. Business office feature: from morgan to microarrays: gene mapping hits the big time. Science. 2007;318:473–478. [Google Scholar]
- 23.Butt HJ, Capella B, Kappl M. Force measurements with the atomic force microscope: technique, interpretation and applications. Surf Sci Rep. 2005;59:1–152. [Google Scholar]
- 24.Despont M, Drechsler U, Yu R, Pogge HB, Vettiger P. Wafer-scale microdevice transfer/interconnect: its application in an AFM-based data-storage system. J Mem S. 2004;13:895–901. [Google Scholar]
- 25.Russel WB, Saville DA, Schowalter WR. Electrostatics. In: Batchelor GK, editor. Colloidal Dispersions. Cambridge University Press; Cambridge, UK: 1991. [Google Scholar]
- 26.Schilling J, Sengupta K, Goennenwein S, Bausch AR, Sackmann E. Absolute interfacial distance measurements by dual-wavelength reflection interference contrast microscopy. Phys Rev E. 2004;69:021901. doi: 10.1103/PhysRevE.69.021901. [DOI] [PubMed] [Google Scholar]
- 27.Clack NG, Groves JT. Many-particle tracking with nanometer resolution in three dimensions by reflection interference contrast microscopy. Langmuir. 2005;21:6430–6435. doi: 10.1021/la050372r. [DOI] [PubMed] [Google Scholar]
- 28.Peterson A, Heaton R, Georgiadis R. The effect of surface probe density on DNA hybridization. Nucleic Acids Res. 2001;29:5163–5168. doi: 10.1093/nar/29.24.5163. [DOI] [PMC free article] [PubMed] [Google Scholar]
- 29.Heyries KA, Marquette CA, Blum LJ. Straightforward protein immobilization on Sylgard 184 PDMS microarray surface. Langmuir. 2007;23:4523–4527. doi: 10.1021/la070018o. [DOI] [PubMed] [Google Scholar]
- 30.Yu AA, et al. High resolution printing of DNA feature on poly(methyl methacrylate) substrates using supramolecular nano-stamping. J Am Chem Soc. 2005;127:16774–16775. doi: 10.1021/ja055762e. [DOI] [PubMed] [Google Scholar]
- 31.Salaita K, Wang YH, Mirkin CA. Applications of dip-pen nanolithography. Nat Nano. 2007;2:145–155. doi: 10.1038/nnano.2007.39. [DOI] [PubMed] [Google Scholar]
- 32.MacBeath G. Protein microarrays and proteomics. Nat Genet. 2002;32:526–532. doi: 10.1038/ng1037. [DOI] [PubMed] [Google Scholar]
- 33.Winssinger N, Pianowski Z, Debaene F. Probing biology with small molecule microarrays (SMM) Top Curr Chem. 2007;278:311–342. [Google Scholar]
- 34.de Gans BJ, Schubert US. Inkjet printing of polymer micro-arrays and libraries: instrumentation, requirements, and perspective. Macromol Rapid Commun. 2003;24:659–666. [Google Scholar]
- 35.Cassell AM, Verma S, Delzeit L, Meyyappan M, Han J. Combinatorial optimization of heterogeneous catalysts used in the growth of carbon nanotubes. Langmuir. 2001;17:260–264. [Google Scholar]
Associated Data
This section collects any data citations, data availability statements, or supplementary materials included in this article.