

Abstract
Nuclear factor E2–related factor-2 (Nrf2) transcription factor is one of the main regulators of intracellular redox balance and a sensor of oxidative and electrophilic stress. Low Nrf2 activity is usually associated with carcinogenesis, but Nrf2 is also considered as an oncogene because it increases survival of transformed cells. Because intracellular redox balance alterations are involved in both senescence and tumorigenesis, we investigated the impact of Nrf2 genetic deletion on cellular immortalization and life span of murine embryonic fibroblasts. We report that Nrf2 genetic deletion promotes immortalization due to an early loss of p53-dependent gene expression. However, compared with control cells, immortalized Nrf2−/− murine embryonic fibroblasts exhibited decreased growth, lower cyclin E levels, and impaired expression of NQO1 and cytochrome b5 reductase. Moreover, SirT1 was also significantly reduced in immortalized Nrf2−/− murine embryonic fibroblasts, and these cells exhibited shorter life span. Our results underscore the dual role of Nrf2 in protection against carcinogenesis and in the delay of cellular aging.
Keywords: Cellular immortalization, Life span, MEFs, Nrf2, Replicative senescence
MOST primary mammalian cells have a limited ability to proliferate in tissue culture, a property known as the Hayflick limit (1). After a variable number of cell divisions, primary cells will undergo a form of growth arrest in the G1 phase of the cell cycle and become refractory to further growth factor stimulation. In this state of growth arrest, referred to as senescence, cells adopt a typical large and flat morphology and express a number of senescence-associated (SA) markers, such as SA-acid β-galactosidase, p53, p19ARF, and p21CIP. Induction of senescence differs between human and mouse cells. In vitro propagation of primary human cells is associated with erosion of the telomeres, leading to DNA damage–like antiproliferative signals when telomeres become critically short. On the other hand, senescence in cultured rodent fibroblasts is mostly a response to reactive oxygen species (ROS)–mediated DNA damage. With continuous culture, clones of immortal cells arise, a process characterized by the loss of p53 function (2–4).
Accumulating lines of evidence now indicate that senescence also takes place in vivo, suggesting important implications for tumor development (5,6). In fact, it is now believed that senescence is part of a fail-safe mechanism that protects cells from oncogenic transformation (7–11). Consistent with the loss of p53 expression during immortalization of cultured cells in vitro (3), a decline of p53 function could explain the increased incidence of cancer with aging in vivo (12).
Nuclear factor E2–related factor-2 (Nrf2) (13,14) is a basic leucine zipper (bZIP) transcription factor, which serves as cellular sensor of oxidative and electrophilic stress generated from endogenous reactions and exogenous chemicals, xenobiotics, drugs, ultraviolet, and ionizing radiations. Upon its activation and stabilization, Nrf2 rapidly translocates to the nucleus where it activates its target genes by binding to the antioxidant response element, a common regulatory element found in the 5′-flanking regions of genes coding for antioxidant and detoxification enzymes. Nrf2-mediated signaling is thus critical for regulation of intracellular redox balance, particularly under stress conditions (15–18).
Nrf2 signaling has been suggested to abate the consequences of oxidative stress, including aging-associated diseases like neurodegeneration, chronic inflammation, and cancer in rodents and humans. Moreover, constitutive activation of Nrf2 signaling has a prolongevity effect in Drosophila males (19,20). Using a cellular model, it has been shown recently that Nrf2 has a declined function in senescence of human fibroblasts, its silencing leading to premature senescence. Treatment with an Nrf2 inducer resulted in the enhanced survival of cells following oxidative stress, whereas continuous treatment led to lifespan extension of human fibroblasts (21). Interestingly, Nrf2-dependent signaling has been also recognized as a major determinant of cellular stress resistance in long-lived mice (22). Moreover, Nrf2 activation has been related with the extension of life span observed in glutathione transferase mGSTA4-null mice (23).
To date, no study has addressed the putative role of Nrf2 in senescence and immortalization of murine embryonic fibroblasts (MEFs). Our results show that the lack of Nrf2 promoted the immortalization of MEFs due to an early loss of p53 and p53-dependent gene expression, but cells lacking Nrf2 exhibited shorter life span, likely due to their enhanced genomic instability. Our results can give us new insights to explain why Nrf2 deficiency is associated with tumorigenesis and aging.
METHODS
Unless otherwise indicated, all chemicals were purchased from Sigma (Madrid, Spain). Colonies of wild-type (Wt) and Nrf2−/− mice in an Institute of Cancer Research background were maintained at the Laboratory of Experimental Gerontology (National Institute of Aging, National Institutes of Health, Baltimore, MD). Mice were cared for in accordance to National Institutes of Health ACUC guidelines.
MEFs Preparation and Culture
MEFs were obtained from fetuses at Day 13 postcoitum. Pregnant female mice were be killed by cervical dislocation, and the uterus was dissected, rapidly washed in 70% ethanol, and then in Hank’s saline solution. Each embryo was separated from its placenta and surrounding membranes, brain, and dark red organs were also separated. After washing, embryos were finely minced and cells were then suspended in 1–2 mL of Trypsin–EDTA per embryo. Non-disaggregated tissue was eliminated, and the cellular suspension was washed with 2 volumes of fresh culture medium. After centrifugation, the cell pellet was suspended in Dulbecco’s modified essential medium supplemented with 10% bovine serum, 10,000 U/mL penicillin, 10 mg/mL streptomycin, 25 μg/mL amphotericin B, 2 mM L-glutamine, and 0.2% glucose (MEFs medium), and cells from each embryo were plated in 10-cm diameter dishes (Passage 0). The medium was changed after 24 hours, being fibroblasts the only cells capable to adhere to the culture surface. Cellular confluence was obtained after few days. Cells were then frozen and maintained under liquid nitrogen until used for the different determinations.
After thawing, cells were cultured in MEFs medium at 37°C in a humidified atmosphere of 5% CO2 and 95% air. Passages of cell cultures were carried out according to the procedure of Todaro and Green (4) for obtaining the 3T3 cell line. Primary fibroblasts were cultured in 75-cm2 bottles at 4,000 viable cells/cm2. Passages were performed each 3 days, avoiding cell confluence. After each passage, cells were detached from culture plates and the number of viable cells counted with a hemocytometer. The number of doublings for each passage was calculated from the formula log(Nf/Ni)/log2, where Nf is the final number of cells after the passage and Ni is the initial number of viable cells seeded. Viability of cells was estimated by the trypan blue-exclusion assay after separation of cells from culture dishes using a Trypsin–EDTA detaching solution.
SA β-galactosidase staining
SA β-galactosidase staining was used as a positive marker of senescence and negative marker of immortalization. Briefly, cells were cultured in six-well plates, washed with sterile phosphate-buffered saline, and then fixed in 2% formaldehyde/0.2% glutaraldehyde and incubated with staining solution (1 mg/mL X-Gal, 5 mM K3[Fe(CN)6], 5 mM K4[Fe(CN)6].3H20, 2 mM MgCl2, and 150 mM NaCl in 40 mM citric acid/sodium phosphate, pH 6.0) for 4–6 hours at 37°C. Cells were then observed under a phase-contrast microscope and photographed. Quantification of positively stained cells was carried out on micrographs taken at a 200× magnification.
Preparation of Cell Extracts
Cells were separated from culture dishes using Trypsin–EDTA. Subsequent extraction procedures were carried out at 4°C. MEFs were disrupted by homogenization in RIPA buffer (Tris–HCl 50 mM, pH 8; NaCl 150 mM; 0.5% deoxycholate; 0.1% sodium dodecyl sulfate; 1 mM dithiothreitol [DTT]; 1% Triton X-100; and 20 μg/μL of each of the following protease inhibitors: chymostatin, leupeptin, antipain, and pepstatin A [CLAP]). For extraction, about 10 × 106 cells were centrifuged at 500g for 5 minutes, washed with phosphate-buffered saline, and centrifuged again under the same conditions. The cell pellet was resuspended in 250 μL of RIPA buffer, and after a gentle agitation for 15 seconds, the suspension was centrifuged at 10,000g for 15 minutes. The supernatant was saved for determination of protein expression by Western blot (see below).
Preparation of Cytosolic and Membranous Fractions
All extraction procedures were carried out at 4°C. For preparation of membranous fractions, 2 to 10 × 106 cells were recovered by centrifugation at 500g for 5 minutes and washed with cold 130 mM Tris–HCl (pH 7.6), containing 1 mM EDTA, 0.1 mM DTT, and 1 mM phenylmethylsulfonyl fluoride. Cells were centrifuged again and resuspended in 1 mL of hypotonic lysis buffer (10 mM Tris–HCl [pH 7.6], containing 1 mM EDTA, 0.1 mM DTT, 1 mM phenylmethylsulfonyl fluoride, and 20 μg/mL CLAP). Homogenization of cells was carried out for 5 minutes with the aid of a Teflon-glass Potter. After disruption of cells, the concentration of the lysis buffer was risen to 100 mM Tris by adding enough volume of 250 mM Tris buffer (pH 7.6), containing 1 mM EDTA, 0.1 mM DTT, 1 mM phenylmethylsulfonyl fluoride, and 20 μg/mL CLAP. Unbroken cells and debris were separated by centrifugation at 500g for 5 minutes, and the supernatant was saved. Cytosolic fractions were separated from membranous material by ultracentrifugation at 100,000g for 30 minutes.
Determination of NQO1 Activity
NQO1 activity in cytosolic fractions was measured from the dicoumarol-inhibitable NADH and menadione-dependent reduction of cytochome c. Assays were carried at 37°C with constant gentle stirring. The assay mixture (1 mL) contained 70 μg of cytosolic protein in 50 mM Tris–HCl (pH 7.5), 0.08% Triton X-100, 0.5 mM NADH, 10 μM menadione, and 77 μM cytochrome c. Assays were carried out either in the absence or in the presence of 10 μM dicoumarol, and absorbance was recorded at 550 nm in a Beckman DU-640 UV-vis spectrophotometer. NQO1 activity was calculated from the difference in reaction rates obtained with and without dicoumarol. An extinction coefficient of 18.5 mM/cm was used in calculations of specific activities (24). Protein measurements were carried out by the Bradford method.
Electrophoretic Separation of Proteins and Immunodetection
Levels of p53, p21CIP, cyclin E, cyclin A, and SirT1 were determined in whole extracts (see Preparation of Cell Extracts section), whereas NADH–cytochrome b5 reductase (b5R) was measured in membranous fractions (see Preparation of Cytosolic and Membranous Fractions section). The amount of sample used for each determination was previously optimized to allow for quantification in the linear range (see Table 1).
Table 1.
Electrophoresis and Western Blot Conditions for the Different Proteins Analyzed in this Study
| Antigen | Protein Sample (μg) | Polyacrylamide Concentration (%) | Primary Antibody | Dilution | Source |
| p53 | 100 | 15.0 | Monoclonal mouse IgG | 1:500 | Oncogene (Cambridge, MA) |
| p21 | 50 | 15.0 | Polyclonal rabbit IgG | 1:600 | Santa Cruz (Santa Cruz, CA) |
| Cyclin E | 50 | 10.0 | Polyclonal rabbit IgG | 1:200 | Santa Cruz |
| Cyclin A | 20 | 10.0 | Polyclonal rabbit IgG | 1:200 | Santa Cruz |
| Sirt1 | 50 | 7.5 | Polyclonal rabbit IgG | 1:200 | Santa Cruz |
| b5R | 40 | 12.5 | Polyclonal rabbit IgG | 1:1,000 | Navarro and colleagues (25) |
The required amount of sample was mixed with concentrated sodium dodecyl sulfate–DTT loading buffer (final concentration, 10% sucrose, 2 mM EDTA, 1.5% [wt/vol] sodium dodecyl sulfate, 20 mM DTT, 0.01% [wt/vol] bromophenol blue, and 60 mM Tris–HCl [pH 6.8]) and then boiled for 5 minutes, except in the case of b5R in which samples were not boiled but heated at 40°C for 15 minutes to avoid aggregation of this membrane protein. After the boiling/heating step, samples were separated by sodium dodecyl sulfate–polyacrylamide gel electrophoresis (see Table 1 for specific conditions) and blotted onto nitrocellulose sheets.
Blots were stained with Ponceau S for visualization of protein lanes and verification of equal protein loading and then stained with the corresponding primary antibodies (Table 1). In the case of b5R, we used a secondary anti-rabbit IgG coupled to alkaline phosphatase, binding sites being revealed by colorimetric developing of alkaline phosphatase activity on the blots. For the rest of proteins studied, we used goat secondary anti-rabbit (or anti-mouse for p53) antibodies coupled to horseradish peroxidase, at a dilution of 1:2,000. In these cases, developing of images was performed by enhanced chemiluminescence (ECL Plus; Amersham Bioscience, Uppsala, Sweden).
Photographic films obtained after ECL autoradiography and blots revealed for alkaline phosphatase were scanned in a Bio-Rad GS800 densitometer to obtain digital images for quantification of intensity reaction using Quantity One software (Bio-Rad, Hercules, CA). Data obtained from quantification of stained bands (in arbitrary units) were normalized to that of the corresponding lane stained with Ponceau S to correct for minor differences in protein loading between samples because we have proven previously that this method offers linear results in a wide range of protein load (26), whereas immunostaining of an abundant protein such as actin as loading control yields unreliable results at the protein loads required for detection of low-abundance proteins (27).
Statistical Analysis
Data shown in this article are means ± SDs from at least three different determinations. Significant differences between means were assessed using Student’s t test. Differences were considered significant with p < .05. Data were analyzed using Graphpad InStat (Graphpad Software Inc., San Diego, CA).
RESULTS
The Nrf2 Status Affects Senescence of MEFs
First, we studied the normal pattern of senescence and immortalization establishment in our cultures of Wt MEFs. As depicted in Figure 1A, during the first four passages, the growth of Wt MEFs was stabilized at about 1 doubling per passage. Then, the ability of cells to grow declined and became minimal at Passages 6–8. The existence of senescent cells at these passages was confirmed by their flattened structure and a positive staining for SA-β-galactosidase (Figure 1B and C). From Passage 8, growth rates increased again, reaching values of about 3 doublings at Passage 20, indicating the emergence of immortalized clones (Figure 1A). For our study, cells from passages more than 15 were considered immortalized. In accordance, they were negative in the SA-β-galactosidase test (Figure 1B and C). Occurrence of MEFs senescence between Passages 5 and 9 and immortalization at passages more than 15 is in accordance with previous results obtained by other authors with the same cell type (6,11,28).
Figure 1.
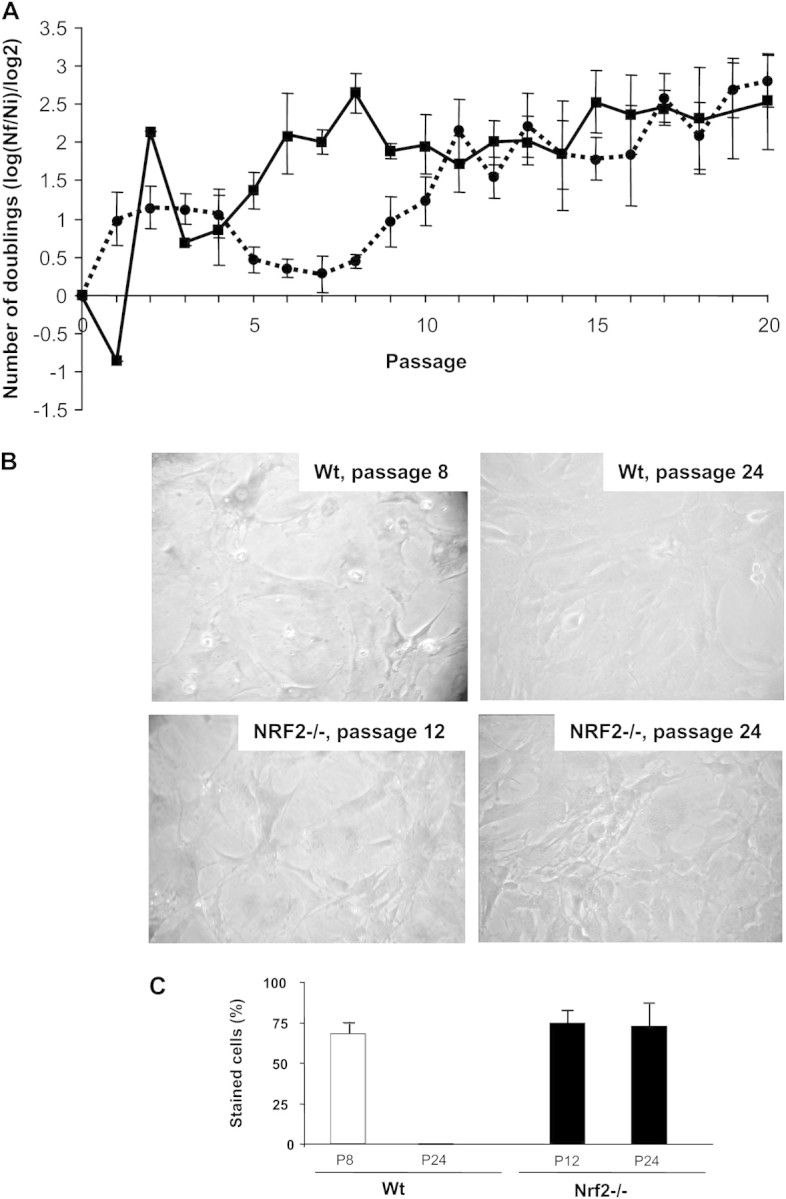
(A) Number of doublings per passage of wild-type (Wt) and Nrf2−/− murine embryonic fibroblasts (MEFs). Cells were cultured according to a 3T3 protocol. After each passage, cells were detached from culture plates and counted. Data are means ± SDs of measures taken at least in triplicate. A decline of Wt MEFs growth was observed between Passages 6 and 8. Cells resumed growth from Passage 9. Immortalization of Nrf2−/− was observed earlier (from Passage 5). (B) Senescence-associated (SA)-β-galactosidase staining. Wt cells harvested from passages with decreased cell growth were positive for SA-β-galactosidase, and the staining was lost in cells obtained from later passages, as an indicative of cellular immortalization. However, SA-β-galactosidase staining was still observed in immortalized Nrf2−/− MEFs. (C) Quantification of the number of cells positively stained for SA-β-galactosidase activity. About 150 cells in three different fields were counted. Differences between Wt and Nrf2−/− MEFs at P assage 24 were statistically different with p < .0001.
We then studied the growth of Nrf2−/− MEFs as a function of cell passage and found that, after a worse response to thawing resulting in decreased growth at Passage 1, the cells quickly resumed their ability to growth at Passage 2 and the establishment of immortalized clones was readily observed after Passage 3. However, cells still retained some of the features of senescent MEFs, such as SA-β-galactosidase staining, despite their ability to growth at rates of 2–3 populations doublings per passage. Strikingly, some SA-β-galactosidase staining was still observed in Nrf2−/− MEFs harvested at passages more than 20, although Wt MEFs were completely negative (Figure 1B and C).
An increase of p53 levels and p53-dependent gene expression is considered the hallmark of MEFs senescence. Furthermore, it is firmly established that MEFs immortalization is mainly due to a loss of p53 function (2,3). Thus, we decided to study how the lack of Nrf2 affected expression of p53 and p21CIP, one of the main targets of p53-dependent gene expression, which determines the cessation of cell growth. As depicted in Figure 2A, compared with young cells (Passage 4), levels of p53 increased significantly in cells obtained from Passage 9, and as expected, expression of p53 was almost completely lost in immortalized cells. Expression of p21CIP was also maximal in senescent cells, and its levels decreased in immortalized MEFs (Figure 2B). When we studied the levels of p53 and p21CIP in Nrf2−/− cells, we found that they had very low levels of p53 at all passages, and p21CIP was also considerably decreased compared with control cells (Figures 2A and B). These results support that the early loss of p53 function might be mechanistically linked to an early immortalization of Nrf2−/− MEFs.
Figure 2.

p53 and p21 levels. Cell extracts were prepared from wild-type (Wt) or Nrf2−/− murine embryonic fibroblasts (MEFs) obtained from the passages depicted in the figure and then probed for p53 (A) or p21 (B) by immunoblot. Results from a representative blot are shown for each case. Genetic deletion of Nrf2 resulted in the early loss of p53 and p21, the main hallmarks of MEFs immortalization.
Taken together, our observations support that ablation of Nrf2 gene expression results in the promotion of cell immortalization and the surpassing of senescence in MEFs.
Immortalized Nrf2−/− MEFs Have Reduced Growth Rate and Decreased Cyclin E Levels
Next, we compared growth rates of Wt and Nrf2−/− MEFs obtained from passages more than 20. As shown in Figure 3, growth rate of immortalized Nrf2−/− MEFs showed a slight but statistically significant decrease when compared with Wt cells. In accordance with the observed decrease of cell growth, levels of cyclin E, which regulates G1 to S transition, were also significantly lower in Nrf2−/− cells (Figure 4A). However, cyclin A, which regulates the triggering of the S-phase and entering into mitosis, was unchanged in cells lacking Nrf2 (Figure 4B).
Figure 3.

Genetic deletion of Nrf2 decreases growth of immortalized murine embryonic fibroblasts (MEFs). The figure depicts the mean values of doublings number per passage. Data from all passages between 20 and 43 were used for calculations. Wild-type (Wt) MEFs, n = 142; Nrf2−/− MEFs, n = 94. Differences between Wt and Nrf2−/− MEFs were statistically different with p < .0001.
Figure 4.

Cyclin E and A levels. Cell extracts were prepared from immortalized wild-type (Wt) or Nrf2−/− murine embryonic fibroblasts and then probed by immunoblot for cyclin levels. (A) Cyclin E. Both Wt and Nrf2−/− cells were obtained from Passage 27. (B) Cyclin A. Wt cells were obtained from Passage 29, whereas Nrf2−/− cells were obtained from Passage 28. For each antibody, the immunostained band was quantified with Quantity one software (Bio-Rad), and the results normalized to the density of the corresponding lane stained with Ponceau S. Results from representative blots are shown. Genetic deletion of Nrf2 resulted in a significant decrease of the levels of cyclin E but not of cyclin A.
Nrf2−/− MEFs Display Defective Induction of Extramitochondrial Quinone Reductases
NAD(P)H:quinone oxidoreductase 1 is one of the best-characterized targets of Nrf2-mediated gene expression (29). To our knowledge, no study has addressed putative changes of NQO1 activity in young, senescent, or immortalized MEFs. Thus, we measured NQO1 activity as a function of cell passage in Wt and Nrf2−/− MEFs. As depicted in Figure 5A, NQO1 activity was dramatically induced in Wt MEFs obtained from Passages 10–15, that is, when the growth of immortalized clones was being established. On the other hand, NQO1 activity in Nrf2−/− MEFs was fairly low and constant with the cell passages.
Figure 5.

NQO1 and b5R levels. (A) Cytosolic fractions were obtained from wild-type (Wt) or Nrf2−/− murine embryonic fibroblasts (MEFs) obtained from the indicated passages and then assayed for NQO1 enzymatic activity. A significant increase of NQO1 activity was observed in Wt MEFs from Passages 10 to 15, at the beginning of cellular immortalization. On the other hand, as expected, NQO1 activity remained low in Nrf2−/− cells at any passage. Data are means ± SDs of measures taken in triplicate. (B) Membranous fractions were obtained from Wt or Nrf2−/− MEFs obtained from the indicated passages. Proteins were separated by sodium dodecyl sulfate–polyacrylamide gel electrophoresis and blotted onto nitrocellulose. Blots were then probed for b5R with a specific antiserum. The immunostained 34-kDa band was quantified with Quantity one software (Bio-Rad), and the results normalized to the density of the corresponding lane stained with Ponceau S. Results from a representative blot are shown.
NADH–cytochrome b5 reductase (b5R) is another enzyme that plays a role in maintaining the levels of antioxidant hydroquinones in extramitochondrial membranes. This antioxidant system in the plasma membrane has been observed to participate in the healthy aging induced by calorie restriction (30,31). We show here that, for all passages tested, levels of b5R were significantly decreased in Nrf2−/− compared with Wt MEFs (Figure 5B).
Nrf2−/− MEFs Display Shorter Life Span
MEFs accumulate cellular damage with continuous culture, mostly due to their exposition to higher oxygen conditions (32,33). Thus, we decided to study the ability to grow in long-term cultures of MEFs. Given the general defect of Nrf2−/− cells in eliciting an antioxidant response (29), we found it interesting to compare life span of Wt MEFs with that of Nrf2−/− cells. As shown is Figure 6, Wt MEFs grew steadily until Passage 62 at a rate of more than 3 population doublings per passage. However, a proliferation limit for these primary MEFs was observed at 64 passages, from which the culture could not be continued. Interestingly, Nrf2−/− cells had a considerably shorter life span, and the culture could not be recovered beyond Passage 54.
Figure 6.
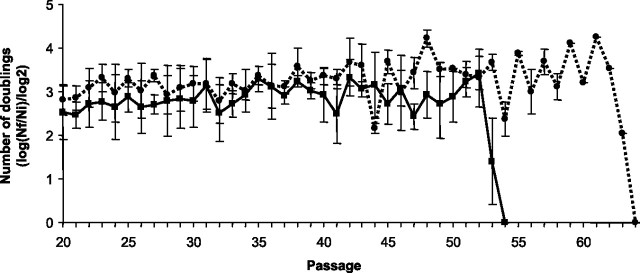
Number of doublings per passage of wild-type (Wt) and Nrf2−/− murine embryonic fibroblasts in long-term cultures. Cells were cultured according to a 3T3 protocol. After each passage cells were detached from culture plates and counted. Data are means ± SDs of measures taken in triplicate. Genetic deletion of Nrf2 resulted in a significant shortening of cellular life span.
DNA damage response is activated in MEFs undergoing replicative senescence and following spontaneous immortalization (34). Because immortalized MEFs are characterized by the loss of p53 and p53-dependent gene expression (see above), we wanted to study how the lack of Nrf2 affected levels of SirT1, a histone deacetylase, which plays a major role in the maintenance of genomic stability (35). As shown in Figure 7, the profile of SirT1 expression was dependent on the culture passage. In Wt MEFs, SirT1 levels were minimal in young cells but then increased significantly with culture immortalization. When SirT1 levels were measured in Nrf2−/− MEFs we found that, compared with passage-matched controls, SirT1 was significantly elevated during the first passages of the culture but not at late passages. In this case, immortalized Nrf2−/− MEFs had significantly lower levels of SirT1 than their Wt counterparts, supporting that Nrf2−/− might accumulate more DNA damage with continuous culture, which, in turn, would result in shorter life span.
Figure 7.

SirT1 levels. Cell extracts were prepared from murine embryonic fibroblasts obtained from the passages depicted in the figure and then probed for SirT1 by immunoblot. The immunostained band was quantified with Quantity one software (Bio-Rad), and the results normalized to the density of the corresponding lane stained with Ponceau S. Results from a representative blot are shown. Whereas SirT1 levels were higher in Nrf2−/− cells at passages less than 9, genetic deletion of Nrf2 resulted in a significant decrease of SirT1 levels in late passage immortalized cells.
DISCUSSION
Changes in the intracellular redox balance are involved both in the cessation of growth that accompanies senescence and in the uncontrolled cell growth associated with tumorigenesis (36). MEFs senescence is mostly a response to ROS-mediated DNA damage (2,3). However, senescence is not a stable condition, but MEFs cultures invariably resume proliferation because of the spontaneous outgrowth of mutant clones bearing aberrant numbers of chromosomes and DNA lesions (34). Thus, replicative senescence and spontaneous immortalization of cells could be viewed as two faces of the same phenomenon because DNA lesions elicit a DNA damage response, which halts cell growth, but further genetic alterations result in spontaneous immortalization.
Because Nrf2 is critical for regulation of intracellular redox balance, particularly under stress conditions (15,29,37), we decided to investigate the impact of Nrf2 genetic deletion on MEFs immortalization and life span. Interestingly, we observed that Nrf2−/− MEFs were prone to immortalization due to an early loss of p53 and p53-dependent gene expression. Although Nrf2−/− cells underwent a rapid immortalization, we found a slight but statistically significant decrease of growth in Nrf2−/− MEFs, which correlated with a decreased of cyclin E levels. In addition, Nrf2−/− MEFs displayed shorter life span when compared with their Wt counterparts. Strikingly, positive staining for SA-β-galactosidase was still observed in Nrf2−/− MEFs obtained from passages more than 20, with Wt MEFs being completely negative. These results could indicate that the lack of Nrf2 expression could affect the physiology of the lysosomal compartment. Besides being a basic transcription factor responsible for the regulation of the cellular antioxidant response, Nrf2 also regulates the expression of several proteasome subunits in mice (21). The possibility exists that a deficiency in proteosomal degradation in Nrf2−/− cells could be compensated, at least partially, by induction of lysosomal hydrolytic enzymes, which could explain the increase of SA-β-galactosidase staining in proliferating cells.
Our observation that Nrf2−/− MEFs rapidly undergo immortalization is in accordance with their defects in antioxidant protection and their greater genetic instability. NQO1 activity was dramatically induced in Wt MEFs obtained from Passages 10–15, that is, when the growth of immortalized clones was being established, and b5R levels were also lower in Nrf2−/− MEFs. Deficient induction of NQO1 and other antioxidant and detoxification enzymes due to the lack of Nrf2 might give rise to the occurrence of clones with augmented oxidative stress and genetic damage, resulting in rapid immortalization of the cells. The lack of Nrf2 also led to oxidative stress and DNA lesions in primary alveolar Type II epithelial cells isolated from Nrf2−/− mice, with an impairment of cell cycle progression (38). The cellular context is very important in defining the impact of Nrf2 deficiency on the growth of primary normal cells. Renal epithelial cells isolated from Nrf2−/− mice could proliferate, although at slower rate than the controls, and these cells showed less oxidative stress than pulmonary Type II cells (38). Of note, Reddy and colleagues (39) reported that, unlike alveolar Type II epithelial cells isolated from Nrf2−/− animals (with decreased growth compared with the controls), MEFs isolated from the same animals proliferated even more rapidly than their Wt counterparts. Although no information was given by these authors about the passage from which these Nrf2−/− MEFs were obtained, their results would be in accordance with our observation that Nrf2−/− cells grew faster at Passages 5–10 and exhibited decreased p53-dependent gene expression than passage-matched controls (see Figure 1).
Pleiotropic and cell-specific effects of Nrf2 genetic deletion could be explained, at least partially, on the basis of the role played by Nrf2-regulated enzymes in decreasing ROS levels because responses elicited by ROS in cells are diverse and include growth stimulation, transient or permanent growth arrest, senescence, apoptosis or necrosis, depending on the intensity and duration of the stimulus, the specific site where ROS are generated and the cell type (36). In normal MEFs, ROS are mitogenic at moderate levels, promoting G1 to S transition (40,41). In accordance with a role for Nrf2-regulated ROS levels in promoting cell proliferation, Nrf2 overexpression suppresses growth of primary cultures of smooth muscle cells (42).
The fact that the lack of Nrf2 renders cells prone to immortalization may be relevant to understand the role of Nrf2 in carcinogenesis. It has been recently reported that the loss of Nrf2 leads to increased oxidative stress and DNA damage in the initiation of cellular transformation in prostate cancer (43). There are many examples showing that low levels of Nrf2 activity predispose cells to chemical carcinogenesis, which has been generally interpreted on the basis of poor detoxification in Nrf2-deficient or null animals, and upregulation of Nrf2-mediated signaling has been shown to protect against different types of cancer (44–46). Interestingly, Nrf2−/− animals are not protected by calorie restriction against carcinogenesis (47).
Although Nrf2−/− MEFs were prone to immortalization, they also showed shorter life span in long-term cultures, indicating that the function of Nrf2 is needed for maintaining cell viability after long exposures to environmental stressors. We found that SirT1 levels increased significantly with culture immortalization in Wt MEFs. In the case of Nrf2−/− MEFs, SirT1 was significantly elevated during the first passages of the culture, which is in accordance with the earlier immortalization of these cells. However, elevated expression of SirT1 was not maintained in MEFs obtained from late passages, but SirT1 was significantly decreased in Nrf2−/− cells. SirT1 represses repetitive DNA and a functionally diverse set of genes across the mouse genome. In response to DNA damage, SirT1 dissociates from these loci and relocalizes to DNA breaks to promote repair. Increased SirT1 expression promotes survival in a mouse model of genomic instability and suppresses age-dependent transcriptional changes (35). Thus, decreased SirT1 levels in the immortalized MEFs (which completely lack p53) may result in genetic instability, which leads to shorter life span. Our results also agree with a recent report showing that Nrf2 has a declined function in senescence of human fibroblasts, its silencing leading to premature senescence. In this in vitro model, treatment with an Nrf2 inducer resulted in the enhanced survival of human fibroblasts following oxidative stress, whereas continuous treatment led to lifespan extension of the cells (21). Interestingly, Nrf2-dependent signaling has been also recognized as a major determinant of cellular stress resistance in long-lived mice (22) and as a factor contributing to lifespan extension in mGSTA4-null mice (23).
Nrf2 also plays a prominent role protecting normal cells from ROS-induced apoptosis (48). Because cultured MEFs are continually exposed to the deleterious effect of ROS, an increase of cell death is expected in MEFs lacking Nrf2, which could contribute to their shorter life span. On the other hand, alterations in intracellular redox balance in MEFs from different passages could also contribute to differences in cell survival associated to the Nrf2 status. In this way, excessive ROS may promote damage and shorten life span. However, it must be also taken into account that, at moderate levels, ROS are mitogenic for the MEFs, and a decrease of ROS levels has been also associated with the cessation of growth in this cell type (40,41). These aspects deserve further experimentation.
The role played by Nrf2 in maintaining long-term viability of the MEFs may be also relevant for cancer. In this way, upregulation of Nrf2 has been also observed in some cancers, such as human lung adenocarcinoma, where increased constitutive levels of Nrf2 (and its targets heme oxigenase-1 and peroxiredoxin) protect cancer cells against apoptosis (49–52). Several recent studies have demonstrated elevated levels of ROS and antioxidant gene expression in human cancer cell lines and have indicated that suppression of antioxidant gene expression can block cancer cell growth (53,54). In accordance to these observations, it has been suggested that Nrf2 may act as a proto-oncogene and targeting Nrf2 activity by inhibitors may have a therapeutic value (38). However, according to our results, and those from others (see above), a point of caution should be taken in this regard because the impact of Nrf2 on cell transformation (like a double-edged sword) is cell lineage specific and depends on the cellular context. In this way, Nrf2 is also considered as a prominent target for drug discovery, and Nrf2-activating agents are in clinical trials for cancer chemoprevention (19). The results shown in our article are a clear example of the dual role of Nrf2 inhibiting cellular transformation and aging.
FUNDING
This work was supported by grants BFU2008-00559/BMC (Spanish Ministerio de Ciencia Tecnología), a Proyectos Internacionales grant from the Junta de Andalucía, BIO-276 (Junta de Andalucía and the University of Córdoba), and in part by the Intramural Research Program of the National Institute on Aging. L.J. was funded by Group BIO-276 (University of Córdoba and Junta de Andalucía). J.A. was recipient of a predoctoral contract funded by the Junta de Andalucía (Proyectos Internacionales grant).
References
- 1.Hayflick L. The limited in vitro lifetime of human diploid cell strains. Exp Cell Res. 1965;37:614–636. doi: 10.1016/0014-4827(65)90211-9. [DOI] [PubMed] [Google Scholar]
- 2.Sherr CJ, DePinho RA. Cellular senescence: mitotic clock or culture shock? Cell. 2000;102:407–410. doi: 10.1016/s0092-8674(00)00046-5. [DOI] [PubMed] [Google Scholar]
- 3.Dirac AM, Bernards R. Reversal of senescence in mouse fibroblasts through lentiviral suppression of p53. J Biol Chem. 2003;278:11731–11734. doi: 10.1074/jbc.C300023200. [DOI] [PubMed] [Google Scholar]
- 4.Todaro GJ, Green H. Quantitative studies of the growth of mouse embryo cells in culture and their development into established lines. J Cell Biol. 1963;17:299–313. doi: 10.1083/jcb.17.2.299. [DOI] [PMC free article] [PubMed] [Google Scholar]
- 5.Kiyono T. Molecular mechanisms of cellular senescence and immortalization of human cells. Expert Opin Ther Targets. 2007;11:1623–1637. doi: 10.1517/14728222.11.12.1623. [DOI] [PubMed] [Google Scholar]
- 6.Leal JF, Fominaya J, Cascón A, et al. Cellular senescence bypass screen identifies new putative tumor suppressor genes. Oncogene. 2008;27:1961–1970. doi: 10.1038/sj.onc.1210846. [DOI] [PubMed] [Google Scholar]
- 7.Campisi J. Cellular senescence as a tumor-suppressor mechanism. Trends Cell Biol. 2001;11:S27–S31. doi: 10.1016/s0962-8924(01)02151-1. [DOI] [PubMed] [Google Scholar]
- 8.Michaloglou C, Vredeveld LC, Soengas MS, et al. BRAFE600-associated senescence-like cell cycle arrest of human naevi. Nature. 2005;436:720–724. doi: 10.1038/nature03890. [DOI] [PubMed] [Google Scholar]
- 9.Chen Z, Trotman LC, Shaffer D, et al. Crucial role of p53-dependent cellular senescence in suppression of Pten-deficient tumorigenesis. Nature. 2005;436:725–730. doi: 10.1038/nature03918. [DOI] [PMC free article] [PubMed] [Google Scholar]
- 10.Vom Brocke J, Schmeiser HH, Reinbold M, Hollstein M. MEF immortalization to investigate the ins and outs of mutagenesis. Carcinogenesis. 2006;27:2141–2147. doi: 10.1093/carcin/bgl101. [DOI] [PubMed] [Google Scholar]
- 11.Kilbey A, Blyth K, Wotton S, et al. Runx2 disruption promotes immortalization and confers resistance to oncogene-induced senescence in primary murine fibroblasts. Cancer Res. 2007;67:11263–11271. doi: 10.1158/0008-5472.CAN-07-3016. [DOI] [PMC free article] [PubMed] [Google Scholar]
- 12.Feng Z, Hu W, Teresky AK, Hernando E, Cordon-Cardo C, Levine AJ. Declining p53 function in the aging process: a possible mechanism for the increased tumor incidence in older populations. Proc Natl Acad Sci U S A. 2007;104:16633–16638. doi: 10.1073/pnas.0708043104. [DOI] [PMC free article] [PubMed] [Google Scholar]
- 13.Moi P, Chan K, Asunis I, Cao A, Kan YW. Isolation of NF-E2-related factor 2 (Nrf2), a NF-E2-like basic leucine zipper transcriptional activator that binds to the tandem NF-E2/AP1 repeat of the beta-globin locus control region. Proc Natl Acad Sci U S A. 1994;91:9926–9930. doi: 10.1073/pnas.91.21.9926. [DOI] [PMC free article] [PubMed] [Google Scholar]
- 14.Alam J, Stewart D, Touchard C, Boinapally S, Choi AM, Cook JL. Nrf2, a Cap‘n’Collar transcription factor, regulates induction of the heme oxygenase-1 gene. J Biol Chem. 1999;274:26071–26078. doi: 10.1074/jbc.274.37.26071. [DOI] [PubMed] [Google Scholar]
- 15.Kwak MK, Wakabayashi N, Greenlaw JL, Yamamoto M, Kensler TW. Antioxidants enhance mammalian proteasome expression through the Keap1-Nrf2 signaling pathway. Mol Cell Biol. 2003;23:8786–8794. doi: 10.1128/MCB.23.23.8786-8794.2003. [DOI] [PMC free article] [PubMed] [Google Scholar]
- 16.Jaiswal AK. Nrf2 signaling in coordinated activation of antioxidant gene expression. Free Radic Biol Med. 2004;36:1199–1207. doi: 10.1016/j.freeradbiomed.2004.02.074. [DOI] [PubMed] [Google Scholar]
- 17.Lee JM, Li J, Johnson DA, et al. Nrf2, a multi-organ protector? FASEB J. 2005;19:1061–1066. doi: 10.1096/fj.04-2591hyp. [DOI] [PubMed] [Google Scholar]
- 18.Jain AK, Jaiswal AK. Phosphorylation of tyrosine 568 controls nuclear export of Nrf2. J Biol Chem. 2006;281:12132–12142. doi: 10.1074/jbc.M511198200. [DOI] [PubMed] [Google Scholar]
- 19.Sykiotis GP, Bohmann D. Keap1/Nrf2 signaling regulates oxidative stress tolerance and lifespan in Drosophila. Dev Cell. 2008;14:76–85. doi: 10.1016/j.devcel.2007.12.002. [DOI] [PMC free article] [PubMed] [Google Scholar]
- 20.Sykiotis GP, Bohmann D. Stress-activated cap‘n’collar transcription factors in aging and human disease. Sci Signal. 2010;3:re3. doi: 10.1126/scisignal.3112re3. [DOI] [PMC free article] [PubMed] [Google Scholar]
- 21.Kapeta S, Chondrogianni N, Gonos ES. Nuclear erythroid factor 2-mediated proteasome activation delays senescence in human fibroblasts. J Biol Chem. 2010;285:8171–8184. doi: 10.1074/jbc.M109.031575. [DOI] [PMC free article] [PubMed] [Google Scholar]
- 22.Leiser SF, Miller RA. Nrf2 signaling, a mechanism for cellular stress resistance in long-lived mice. Mol Cell Biol. 2010;30:871–884. doi: 10.1128/MCB.01145-09. [DOI] [PMC free article] [PubMed] [Google Scholar]
- 23.Singh SP, Niemczyk M, Saini D, Sadovov V, Zimniak L, Zimniak P. Disruption of the mGsta4 gene increases life span of C57BL mice. J Gerontol A Biol Sci Med Sci. 2010;65:14–23. doi: 10.1093/gerona/glp165. [DOI] [PMC free article] [PubMed] [Google Scholar]
- 24.Lind C, Cadenas E, Hochstein P, Ernster L. DT-diaphorase: purification, properties, and function. Methods Enzymol. 1990;186:287–301. doi: 10.1016/0076-6879(90)86122-c. [DOI] [PubMed] [Google Scholar]
- 25.Navarro F, Villalba JM, Crane FL, MacKellar WC, Navas P. A phospholipid-dependent NADH-coenzyme Q reductase from liver plasma membrane. Biochem Biophys Res Commun. 1995;212:138–143. doi: 10.1006/bbrc.1995.1947. [DOI] [PubMed] [Google Scholar]
- 26.Bello RI, Alcaín FJ, Gómez-Díaz C, López-Lluch G, Navas P, Villalba JM. Hydrogen peroxide and cell density-regulated expression of cytochrome b5 reductase in HeLa cells. J Bioenerg Biomembr. 2003;35:169–179. doi: 10.1023/a:1023702321148. [DOI] [PubMed] [Google Scholar]
- 27.Dittmer A, Dittmer J. β-Actin is not a reliable loading control in Western blot analysis. Electrophoresis. 2006;27:2844–2845. doi: 10.1002/elps.200500785. [DOI] [PubMed] [Google Scholar]
- 28.Debidda M, Williams DA, Zheng Y. Rac1 GTPase regulates cell genomic stability and senescence. J Biol Chem. 2006;281:38519–38528. doi: 10.1074/jbc.M604607200. [DOI] [PubMed] [Google Scholar]
- 29.Thimmulappa RK, Mai KH, Srisuma S, Kensler TW, Yamamoto M, Biswal S. Identification of Nrf2-regulated genes induced by the chemopreventive agent sulforaphane by oligonucleotide microarray. Cancer Res. 2002;62:5196–5203. [PubMed] [Google Scholar]
- 30.Navas P, Villalba JM, de Cabo R. The importance of plasma membrane coenzyme Q in aging and stress responses. Mitochondrion. 2007;7S:S34–S40. doi: 10.1016/j.mito.2007.02.010. [DOI] [PubMed] [Google Scholar]
- 31.Hyun D-H, Emerson SS, Jo D-G, Mattson MP, de Cabo R. Calorie restriction up-regulates the plasma membrane redox system in brain cells and suppresses oxidative stress during aging. Proc Natl Acad Sci U S A. 2006;103:19908–19912. doi: 10.1073/pnas.0608008103. [DOI] [PMC free article] [PubMed] [Google Scholar]
- 32.Parrinello S, Samper E, Krtolica A, Goldstein J, Melov S, Campisi J. Oxygen sensitivity severely limits the replicative lifespan of murine fibroblasts. Nature Cell Biol. 2003;5:741–747. doi: 10.1038/ncb1024. [DOI] [PMC free article] [PubMed] [Google Scholar]
- 33.Collavitti R, Finkel T. Reactive oxygen species as mediators of cellular senescence. IUBMB Life. 2005;57:277–281. doi: 10.1080/15216540500091890. [DOI] [PubMed] [Google Scholar]
- 34.Di Micco R, Cicalese A, Fumagalli M, et al. DNA damage response activation in mouse embryonic fibroblasts undergoing replicative senescence and following spontaneous immortalization. Cell Cycle. 2008;7:3601–3606. doi: 10.4161/cc.7.22.7152. [DOI] [PubMed] [Google Scholar]
- 35.Oberdoerffer P, Michan S, McVay M, et al. SIRT1 redistribution on chromatin promotes genomic stability but alters gene expression during aging. Cell. 2008;135:907–918. doi: 10.1016/j.cell.2008.10.025. [DOI] [PMC free article] [PubMed] [Google Scholar]
- 36.Allen RG, Tresini M. Oxidative stress and gene regulation. Free Radic Biol Med. 2000;28:463–499. doi: 10.1016/s0891-5849(99)00242-7. [DOI] [PubMed] [Google Scholar]
- 37.Reddy NM, Kleeberger SR, Yamamoto M, et al. Genetic dissection of the Nrf2-dependent redox signaling-regulated transcriptional programs of cell proliferation and cytoprotection. Physiol Genomics. 2007;32:74–81. doi: 10.1152/physiolgenomics.00126.2007. [DOI] [PubMed] [Google Scholar]
- 38.Reddy NM, Kleeberger SR, Bream JH, et al. Genetic disruption of the Nrf2 compromises cell-cycle progression by impairing GSH-induced redox signalling. Oncogene. 2008;27:5821–5832. doi: 10.1038/onc.2008.188. [DOI] [PMC free article] [PubMed] [Google Scholar]
- 39.Reddy NM, Kleeberger SR, Cho HY, et al. Deficiency in Nrf2-GSH signaling impairs type II cell growth and enhances sensitivity to oxidants. Am J Respir Cell Mol Biol. 2007;37:3–8. doi: 10.1165/rcmb.2007-0004RC. [DOI] [PMC free article] [PubMed] [Google Scholar]
- 40.Pani G, Colavitti R, Bedogni B, Anzevino R, Borrello S, Galeotti T. A redox signaling mechanism for density-dependent inhibition of cell growth. J Biol Chem. 2000;275:38891–38899. doi: 10.1074/jbc.M007319200. [DOI] [PubMed] [Google Scholar]
- 41.Menon SG, Sarsour EH, Spitz DR, et al. Redox regulation of the G1 to S transition in the mouse embryo fibroblast cell cycle. Cancer Res. 2003;63:2109–2117. [PubMed] [Google Scholar]
- 42.Levonen AL, Inkala M, Heikura T, et al. Nrf2 gene transfer induces antioxidant enzymes and suppresses smooth muscle cell growth in vitro and reduces oxidative stress in rabbit aorta in vivo. Arterioscler Thromb Vasc Biol. 2007;27:741–747. doi: 10.1161/01.ATV.0000258868.80079.4d. [DOI] [PubMed] [Google Scholar]
- 43.Frohlich DA, McCabe MT, Arnold RS, Day ML. The role of Nrf2 in increased reactive oxygen species and DNA damage in prostate tumorigenesis. Oncogene. 2008;27:4353–4362. doi: 10.1038/onc.2008.79. [DOI] [PubMed] [Google Scholar]
- 44.Jeong WS, Jun M, Kong AN. Nrf2: a potential molecular target for cancer chemoprevention by natural compounds. Antioxid Redox Signal. 2006;8:99–106. doi: 10.1089/ars.2006.8.99. [DOI] [PubMed] [Google Scholar]
- 45.Giudice A, Montella M. Activation of the Nrf2-ARE signaling pathway: a promising strategy in cancer prevention. Bioessays. 2006;28:169–181. doi: 10.1002/bies.20359. [DOI] [PubMed] [Google Scholar]
- 46.Iida K, Itoh K, Maher JM, et al. Nrf2 and p53 cooperatively protect against BBN-induced urinary bladder carcinogenesis. Carcinogenesis. 2007;28:2398–2403. doi: 10.1093/carcin/bgm146. [DOI] [PubMed] [Google Scholar]
- 47.Pearson KJ, Lewis KN, Price NL, et al. Nrf2 mediates cancer protection but not prolongevity induced by caloric restriction. Proc Natl Acad Sci U S A. 2008;105:2325–2330. doi: 10.1073/pnas.0712162105. [DOI] [PMC free article] [PubMed] [Google Scholar]
- 48.Schäfer M, Dütsch S. auf dem Keller U, et al. Nrf2 establishes a glutathione-mediated gradient of UVB cytoprotection in the epidermis. Genes Dev. 2010;24:1045–1058. doi: 10.1101/gad.568810. [DOI] [PMC free article] [PubMed] [Google Scholar]
- 49.Kweon MH, Adhami VN, Lee JS, Mukhtar H. Constitutive overexpression of Nrf2-dependent heme oxygenase-1 in A549 cells contributes to resistance to apoptosis induced by epigallocatechin 3-gallate. J Biol Chem. 2006;281:33761–33772. doi: 10.1074/jbc.M604748200. [DOI] [PubMed] [Google Scholar]
- 50.Padmanabhan B, Tong KI, Ohta T, et al. Structural basis for defects of Keap1 activity provoked by its point mutations in lung cancer. Mol Cell. 2006;21:689–700. doi: 10.1016/j.molcel.2006.01.013. [DOI] [PubMed] [Google Scholar]
- 51.Hayes JD, McMahon M. The double-edged sword of Nrf2: subversion of redox homeostasis during the evolution of cancer. Mol Cell. 2006;21:732–734. doi: 10.1016/j.molcel.2006.03.004. [DOI] [PubMed] [Google Scholar]
- 52.Kim YJ, Ahn JY, Liang P, Ip C, Zhang Y, Park YM. Human prx1 gene is a target of Nrf2 and is up-regulated by hypoxia/reoxygenation: implication to tumor biology. Cancer Res. 2007;67:546–554. doi: 10.1158/0008-5472.CAN-06-2401. [DOI] [PubMed] [Google Scholar]
- 53.Trachootham D, Zhou Y, Zhang H, et al. Selective killing of oncogenically transformed cells through a ROS-mediated mechanism by beta-phenylethyl isothiocyanate. Cancer Cell. 2006;10:241–252. doi: 10.1016/j.ccr.2006.08.009. [DOI] [PubMed] [Google Scholar]
- 54.Dolado I, Swat A, Ajenjo N, de Vita G, Cuadrado A, Nebreda AR. p38α MAP kinase as a sensor of reactive oxygen species in tumorigeneris. Cancer Cell. 2007;11:191–205. doi: 10.1016/j.ccr.2006.12.013. [DOI] [PubMed] [Google Scholar]