

Abstract
Objectives. We assessed the effects of levels and duration of exposure to televised antismoking advertising on cognitive and behavioral changes.
Methods. We used data from a serial cross-sectional telephone survey with weekly interviews of adult smokers and recent quitters in New South Wales, Australia (n = 13 301), between April 2005 and December 2010. We merged survey data with commercial TV ratings data to estimate individuals’ exposure to antismoking advertising.
Results. Logistic regression analyses indicated that after adjustment for a wide range of potential confounders, exposure to antismoking advertising at levels between 100 and 200 gross rating points per week on average over 6 to 9 weeks was associated with an increased likelihood of having (1) salient quitting thoughts and (2) recent quit attempts. Associations between exposure for shorter periods and these outcomes were not significant.
Conclusions. Broadcasting schedules may affect the success of antismoking ads. Campaign planners should ensure advertising exposure at adequate frequency over relatively sustained periods to maximize impact.
In the Australian state of New South Wales, adult smoking prevalence declined from 20.1% in 2005 to 15.8% in 2010,1 during a period of implementation of tax increases on tobacco products, graphic health warnings on packs, clean indoor air legislation, and point-of-sale display bans. In addition, the government has made significant investments in televised antismoking mass media campaigns. Studies that merge commercial TV ratings data at the market level with individual-level data have demonstrated that increases in an individual’s potential exposure to televised antismoking campaigns are associated with improved youth smoking-related attitudes, beliefs, and behaviors2–6; increased calls to quitlines7–13; increased quitting behaviors among adults14–16; and decreased adult smoking prevalence.17 It is increasingly recognized that the response of smokers to mass media campaigns is likely to be influenced by the kinds of messages broadcast.11,13,15 The extent of population exposure to those messages is also an important factor in determining the impact of media campaigns.16 Identifying the level and duration of campaign media placement to achieve optimum population response is a critical question of efficiency for campaign planners and funders.
Despite a consensus that advertising must reach the audience a sufficient number of times to be effective,18–20 attempts to quantify the advertising intensity that can most efficiently influence behavior have not yet resulted in firm conclusions. Among adult smokers, one estimate suggested that for every 2 exposures to anti-tobacco advertisements per month, the quit rate increased by approximately 10%.14 A more recent study showed that the likelihood of quitting within a 2-year period increased 49% with an additional 2 exposures per month.15
Less attention has been paid to how population response to antismoking advertising builds and decays. Although some advertisements may be recalled long after the end of a campaign, campaign effects on the most critical outcome of behavioral response are detectable only while they are being broadcast or for a short time after.17,21,22 Although public health researchers have started to address the issue of advertising decay, studies to date have not addressed questions relating to the “build” or “wear in” of advertising effects on smoking-related behaviors. Studies exploring the impact of different levels of advertising on smoking behaviors have typically examined associations between advertising exposure and behavior changes over differing periods, ranging from 3 months to 2 years. For this reason, it is not clear whether the effect of increased antismoking advertising on population smoking behavior occurs within a few weeks or requires longer durations of exposure.
We investigated the effect of differing levels and durations of exposure to antismoking advertising on quitting outcomes, focusing on proximal indicators of behavior change expected to vary contemporaneously with advertising.22 Public health media campaigns have been theorized to affect audiences in 1 of 2 ways: by providing new information that changes existing beliefs or by increasing the salience or accessibility of an existing belief.23 In countries with long-running tobacco control programs, such as Australia, many smokers already possess favorable beliefs about quitting.24 Therefore, we expected that the effects of antismoking advertising would be evident in increased salience of quitting-related thoughts. We also examined the relationship between advertising exposure and quit attempts, because it has been shown that increasing the rate of quit attempts in a population has been shown to be critical for reducing overall smoking prevalence.25
METHODS
We merged weekly estimates of population exposure to antismoking advertising from commercial TV ratings data with serial cross-sectional weekly telephone surveys of smokers and recent quitters.
The Cancer Institute NSW Tobacco Tracking Survey is a telephone survey of adult smokers and recent quitters (in the past 12 months). The survey monitors smoking-related cognitions and behaviors in the New South Wales population and responses to tobacco control policies and programs. For continuous tracking, the survey conducts 50 interviews most weeks of the year. Households are recruited through random-digit dialing (landline telephone numbers only), and a random selection procedure recruits participants within households (selecting the nth oldest eligible adult). We analyzed data from respondents interviewed between April 2005 and December 2010 (n = 13 301), with an overall response rate of 40% (according to American Association for Public Opinion Research response rate method 4).26 Sample characteristics are shown in Table 1.
TABLE 1—
Sample Characteristics: Cancer Institute NSW Tobacco Tracking Survey, Australia, 2005–2010
| No. (%) or Mean ±SD | |
| Gender | |
| Female | 6858 (49) |
| Male | 6443 (51) |
| Age, y | |
| 18–29 | 2338 (23) |
| 30–55 | 7319 (50) |
| ≥ 55 | 3573 (27) |
| SESa | |
| Low | 5778 (42) |
| Moderate | 3225 (25) |
| High | 4187 (33) |
| Neighborhood SES | |
| Low | 5742 (42) |
| Moderate–high | 7115 (58) |
| Media market | |
| Sydney | 6475 (57) |
| Northern NSW | 3403 (23) |
| Southern NSW | 3423 (20) |
| Current smoker | |
| Yes | 11 807 (89) |
| No | 1494 (11) |
| Recent quit attempt | |
| Yes | 1640 (14) |
| No | 10 407 (86) |
| Cigarette consumptionb | |
| Low | 4661 (42) |
| Moderate | 4359 (36) |
| High | 2720 (22) |
| Salient quitting thoughtsb | |
| Yes | 4334 (36) |
| No | 7385 (64) |
| Cumulative GRPs | |
| 1 wk | 120 ±102 |
| 2 wk | 244 ±184 |
| 3 wk | 365 ±254 |
| 4 wk | 488 ±318 |
| 5 wk | 610 ±378 |
| 6 wk | 730 ±435 |
| 7 wk | 849 ±491 |
| 8 wk | 968 ±545 |
| 9 wk | 1083 ±594 |
| 10 wk | 1197 ±639 |
| 11 wk | 1310 ±685 |
| 3 mo | 1425 ±732 |
| 6 mo | 2794 ±1232 |
| 12 mo | 5435 ±2265 |
Note. GRPs = gross rating points; NSW = New South Wales; SES = socioeconomic status. Numbers are unweighted; percentages are weighted; some numbers do not add to total because of missing data or exclusions from coded variables. The sample size was n = 13 301.
Calculated from combined education and income responses.
Smokers only.
To measure salience of quitting thoughts, smokers were asked, “During the past 2 weeks, how often have you thought about quitting?” We classified respondents who thought about quitting at least once per day as having salient quitting thoughts.
To determine recent quitting activity, (1) smokers were asked if they had ever tried to quit smoking before, and, if they had, when they last tried to quit (in the past 2 weeks, month, 6 months, or 12 months), and (2) recent quitters were asked how long ago they quit smoking. We then categorized respondents as (1) smokers who had made a quit attempt and quitters who stopped smoking in the month preceding their interview or (2) smokers who made no quit attempt during that time. We excluded recent quitters who stopped smoking before this time from analyses that used this variable.
Advertisements
A total of 32 cessation-focused antismoking advertisements were broadcast in New South Wales during the study period. The vast majority of antismoking messages in New South Wales are aimed at adult smokers and use graphic imagery, personal stories, and simulated demonstrations to depict the negative health effects of smoking (examples at http://www.cancerinstitute.org.au/cancer_inst/campaigns/antismoke.html). Some of these advertisements also presented advice and information about cessation support services available to smokers.
We ascertained gross rating points (GRPs) for each of the cessation-focused ads from OzTAM Australian TV audience measurements27 for adults aged 18 years and older for free-to-air and cable TV. GRPs are a product of the percentage of the target audience exposed to an advertisement (reach) and the average number of times a target audience member would be exposed (frequency). Hence, 200 GRPs might represent 100% of the target audience receiving the message an average of 2 times over a specified period or 50% reached 4 times. The ads lasted for 15 to 60 seconds; we accounted for different spot lengths by calculating GRPs equivalent to a 30-second spot for each ad.28
We used the total weekly GRP values for each media market to compute several GRP variables for each respondent. We created measures of cumulative GRPs for each of the previous 12 weeks, then for the previous 6 months and the previous 12 months. We did not include GRPs from the week of interview, because respondents could be interviewed either before or after the potential exposures for that week, and we coded GRP variables to ensure that exposure occurred before the outcomes of interest (in analyses relating to salient quitting thoughts, we excluded GRPs from the week of interview and the preceding week, and for analyses relating to recent quit attempts, we excluded GRPs from the week of interview and the preceding 3 weeks). To aid in interpretation of these variables, we divided each cumulative GRP value by a multiple of 100 so that a 1-unit increase in the GRP measure represented an average of 1 additional potential exposure per week for 100% of the target audience (e.g., we divided the 2-week cumulative GRP variable by 200).
Potential Confounders
The survey incorporated demographic items measuring age, gender, household income, and level of education. We combined the income and education variables into dummy variables indicating low, middle, or high individual socioeconomic status. We linked post codes with the Socio-Economic Indices for Areas,29 an index of relative disadvantage, to indicate neighborhood socioeconomic status (quintiles 4–5 = low; quintiles 1–3 = moderate–high). A dummy variable indicated media market (metropolitan, northern, or southern New South Wales). For smokers, we measured cigarette consumption with a 3-level variable (low ≤ 10, moderate = 11–20, high ≥ 21 cigarettes/day).
Following Wakefield et al.,17 we calculated a variable indicating cigarette costliness as the ratio of the average quarterly recommended retail pack price of the 2 top-selling Australian cigarette brands (obtained from the retail trade magazine Australian Retail Tobacconist30) to the average weekly earnings in the same quarter.31 To account for the influence of seasonal variations in the outcomes of interest, we created dummy variables to identify respondents interviewed in January of each year (vs other months) and in the 2 weeks around World No Tobacco Day (vs other dates). A dummy variable also indicated the first 4 weeks of the launch of a new ad to account for potential novelty effects. We included a linear time variable to account for the gradually increasing strength of social norms against smoking (numbered consecutively with 1 as the first survey week).
We accounted for the introduction of tobacco control policies during this time by additional dummy variables indicating respondents interviewed after (vs before) the introduction of smoke-free licensed premises legislation and point-of-sale display bans. We categorized respondents interviewed prior to the introduction of graphic health warnings on cigarette packs separately from those interviewed during the airing of set A and set B and the change-over periods when both sets were in rotation.32,33
Statistical Analyses
Following Hosmer and Lemeshow,34 we first used logistic regression analyses to assess univariate associations between the dependent variables (salient quitting thoughts and recent quit attempts) and the potential covariates. We selected covariates to enter into the multivariable models if they were associated with the dependent variables at P < .25. Each of the multivariable models included the linear time variable. Next, we conducted univariate logistic regressions to test for associations between the dependent variables and the cumulative GRP variables of differing exposure durations. For GRP variables with an association of P < .25, we then fit separate multivariable logistic regression models with the relevant set of covariates. To test for diminishing returns at increasing levels of advertising exposure, we also ran these models with a quadratic term entered (squared GRPs). However, the squared GRP terms were not significant, and so we reported the models without them. We also tested other functional forms of GRPs (log and square root), which were not significant.
Because this strategy resulted in many separate multivariable models, for each dependent variable, we reported the full set of results only for the first model in which cumulative GRPs were a significant predictor at P < .01 (i.e., for the shortest duration of exposure). For subsequent models (with cumulative GRPs over longer durations), we reported odds ratios (ORs) and 95% confidence intervals (CIs) only for the GRP variable. The pattern of significant covariates remained the same in each of the separate models.
Having identified the shortest duration at which cumulative GRPs were associated with each outcome, we examined the impact of differing levels of GRPs over these durations on the outcomes of interest. We created categorical cumulative GRP variables according to both data distributions (Table 1) and practical applications (1 < 50, 2 = 50–100, 3 = 101–150, 4 > 150 GRPs/week). We reran the logistic regression models with the categorical variable as the predictor to provide estimates of effects for each of these GRP levels.
We conducted all analyses with Stata version 11 (StataCorp LP, College Station, TX). We applied weights in all analyses (with svy commands with p weights) to adjust for a slight overrepresentation of women, older respondents, and regional residents relative to the New South Wales population.35
RESULTS
Exposure to antismoking advertising over the study period was relatively high and varied considerably (Table 1). On average, 53% of all respondents were potentially exposed to 1 or more antismoking ads in the previous week. Total weekly GRPs (averaged across the media markets) are shown in Figure 1.
FIGURE 1—
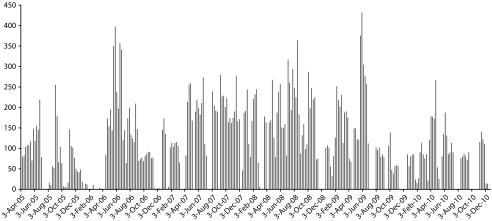
Weekly gross ratings points for antismoking TV campaign in New South Wales (NSW): Cancer Institute NSW Tobacco Tracking Survey, Australia, 2005–2010.
Note. The weekly gross rating points were averaged across media markets.
Table 2 shows that cumulative GRPs were associated with salient quitting thoughts; however, in the multivariable models, this relationship was only significant after 9 weeks of cumulative exposure. An increase of 1 antismoking advertising exposure per week (on average) over a period of 9 weeks was associated with a 13% increase in the likelihood of having salient quitting thoughts in the subsequent 2 weeks. The association between GRPs and salient quitting thoughts was maintained through 6 months of cumulative exposure.
TABLE 2—
Results From Logistic Regression Analyses Predicting Salient Quitting Thoughts: Cancer Institute NSW Tobacco Tracking Survey, Australia, 2005–2010
| Univariate Models |
Multivariable Modela |
|||
| Variable | OR (95% CI) | P | OR (95% CI) | P |
| Gender | ||||
| Female (Ref) | 1.00 | <.001 | 1.00 | |
| Male | 0.88 (0.81, 0.95) | 0.89 (0.81, 0.97) | .005 | |
| Age, y | ||||
| 18–29 (Ref) | 1.00 | <.001 | 1.00 | <.001b |
| 30–55 | 1.43 (1.27, 1.61) | 1.41 (1.25, 1.59) | <.001 | |
| ≥ 55 | 0.65 (0.55, 0.77) | 0.65 (0.55, 0.77) | <.001 | |
| Cigarette consumption | ||||
| Low (Ref) | 1.00 | .115 | 1.00 | .801b |
| Moderate | 1.09 (0.99, 1.20) | 1.03 (0.94, 1.14) | .509 | |
| High | 1.10 (0.99, 1.22) | 1.01 (0.90, 1.14) | .821 | |
| SESc | ||||
| Low (Ref) | 1.00 | .24 | 1.00 | .329b |
| Moderate | 0.92 (0.83, 1.02) | 0.97 (0.87, 1.08) | .6 | |
| High | 0.97 (0.88, 1.07) | 1.06 (0.95, 1.17) | .285 | |
| Neighborhood SES | ||||
| Low (Ref) | 1.00 | .017 | 1.00 | |
| Moderate–high | 0.90 (0.83, 0.98) | 0.95 (0.87, 1.04) | .301 | |
| Media market | ||||
| Sydney (Ref) | 1.00 | <.001 | 1.00 | <.001b |
| Northern NSW | 1.21 (1.09, 1.33) | 1.17 (1.05, 1.30) | .004 | |
| Southern NSW | 1.12 (1.02, 1.24) | 1.18 (1.06, 1.31) | .003 | |
| Cigarette costliness | 0.97 (0.58, 1.63) | .905 | … | … |
| January interview | ||||
| No (Ref) | 1.00 | .658 | … | … |
| Yes | 0.96 (0.78, 1.17) | … | … | |
| WNTD | ||||
| No (Ref) | 1.00 | .655 | … | … |
| Yes | 0.95 (0.78, 1.17) | … | … | |
| Campaign launch | ||||
| No (Ref) | 1.00 | .726 | … | … |
| Yes | 0.98 (0.90, 1.08) | … | … | |
| Graphic health warnings on cigarette packs | ||||
| None (Ref) | 1.00 | .046 | 1.00 | .271b |
| Set A | 1.30 (1.09, 1.55) | 1.18 (0.98, 1.42) | .086 | |
| Set B | 1.25 (1.05, 1.49) | 1.10 (0.90, 1.33) | .343 | |
| Sets A and B | 1.21 (1.01, 1.45) | 1.12 (0.93, 1.36) | .237 | |
| Smoke-free licensed venue legislation | ||||
| Before (Ref) | 1.00 | .257 | … | … |
| After | 1.09 (0.94, 1.27) | … | … | |
| Point-of-sale display ban | ||||
| Before (Ref) | 1.00 | .807 | … | … |
| Phase 1 | 1.00 (0.86, 1.16) | … | … | |
| Phase 2 | 1.05 (0.90, 1.22) | … | … | |
| Cumulative GRPsd | ||||
| 1 wk | 1.05 (0.97, 1.14) | .205 | 1.05 (0.96, 1.14) | .304 |
| 2 wk | 1.06 (0.99, 1.13) | .099 | 1.05 (0.98, 1.13) | .186 |
| 3 wk | 1.05 (0.98, 1.12) | .152 | 1.04 (0.97, 1.12) | .271 |
| 4 wk | 1.05 (0.98, 1.12) | .109 | 1.05 (0.98, 1.13) | .199 |
| 5 wk | 1.07 (1.00, 1.14) | .051 | 1.06 (0.99, 1.14) | .109 |
| 6 wk | 1.08 (1.01, 1.15) | .019 | 1.08 (0.99, 1.16) | .058 |
| 7 wk | 1.09 (1.02, 1.16) | .008 | 1.09 (1.01, 1.17) | .033 |
| 8 wk | 1.11 (1.04, 1.18) | .003 | 1.11 (1.02, 1.20) | .012 |
| 9 wk | 1.12 (1.05, 1.20) | .001 | 1.13 (1.04, 1.22) | .004 |
| 10 wk | 1.13 (1.06, 1.22) | <.001 | 1.14 (1.05, 1.24) | .002 |
| 11 wk | 1.14 (1.06, 1.22) | <.001 | 1.15 (1.06, 1.25) | .001 |
| 3 mo | 1.14 (1.06, 1.23) | <.001 | 1.15 (1.06, 1.26) | .001 |
| 6 mo | 1.14 (1.05, 1.23) | .002 | 1.15 (1.03, 1.27) | .009 |
| 12 mo | 1.11 (1.02, 1.22) | .015 | 1.17 (1.02, 1.34) | .021 |
Note. CI = confidence interval; GRPs = gross rating points; NSW = New South Wales; OR = odds ratio; WNTD = World No Tobacco Day. Ellipses indicate variable not entered into multivariable model. Variables were selected for entry into multivariate models if P < .25 in initial models; separate multivariable models were conducted for each of the cumulative GRP variables.
ORs for covariates in multivariable model were for the earliest model in which cumulative GRPs were significant at P < .01 (cumulative 9-wk GRPs).
P is Wald test of joint significance for multilevel variables
Calculated from combined education and income responses.
GRPs are expressed in units of an average of 100 GRPs per week, excluding week of interview and preceding week; multivariable analyses included a variable indicating time (week of interview) as a covariate, but this was not a significant predictor.
The logistic regression analysis that incorporated the categorical cumulative 9-week GRP variable showed that respondents with 100 to 150 GRPs per week (OR = 1.27; 95% CI = 1.10, 1.47; P = .001) or more than 150 GRPs per week (OR = 1.30; 95% CI = 1.13, 1.50; P < .001) were more likely than respondents with an average exposure of fewer than 50 GRPs per week to have salient quitting thoughts (data not shown). The effect of 50 to 100 GRPs per week was not significantly different than the effect of fewer than 50 GRPs per week (OR = 1.10; 95% CI = 0.97, 1.25; P = .135). We calculated the predicted probability of having salient quitting thoughts for differing levels of 9-week cumulative GRPs. Thirty-two percent of smokers with no exposure to antismoking advertising over the preceding 9 weeks and 40% of smokers who were potentially exposed to an average of 2 advertisements per week over that period had salient quitting thoughts.
GRPs were significantly associated with quit attempts (Table 3). This association appeared after 6 weeks of cumulative exposure and continued through 3 months of cumulative exposure. The logistic regression analysis that used the categorical cumulative 6-week GRP variable showed that respondents with an average exposure of 50 to 100 GRPs per week (OR = 1.22; 95% CI = 1.05, 1.41; P = .01), 100 to 150 GRPs per week (OR = 1.20; 95% CI = 1.03, 1.40; P = .02), or more than 150 GRPs per week (OR = 1.31; 95% CI = 1.06, 1.61; P = .01) were more likely than respondents exposed to fewer than 50 GRPs per week to report recent quit attempts. In our calculation of predicted probability of making a quit attempt in the 4 weeks following differing levels of 6-week cumulative GRPs, 17% of respondents who were potentially exposed to 2 or more advertisements per week over the previous 6 weeks and 13% of those with no exposures reported a quit attempt in the following month.
TABLE 3—
Results From Logistic Regression Analyses Predicting Recent Quit Attempts: Cancer Institute NSW Tobacco Tracking Survey, Australia, 2005–2010
| Univariate Models |
Multivariable Modela |
|||
| Variable | OR (95% CI) | P | OR (95% CI) | P |
| Gender | ||||
| Female (Ref) | 1.00 | .605 | … | … |
| Male | 1.03 (0.92, 1.15) | … | … | |
| Age, y | ||||
| 18–29 (Ref) | 1.00 | <.001 | 1.00 | <.001b |
| 30–55 | 0.80 (0.69, 0.92) | 0.80 (0.69, 0.93) | .005 | |
| ≥ 55 | 1.11 (0.88, 1.39) | 1.11 (0.88, 1.40) | .385 | |
| SESc | ||||
| Low (Ref) | 1.00 | .009 | 1.00 | .133b |
| Moderate | 1.07 (0.92, 1.23) | 1.00 (0.86, 1.16) | .995 | |
| High | 1.23 (1.07, 1.40) | 1.14 (0.99, 1.30) | .065 | |
| Neighborhood SES | ||||
| Low (Ref) | 1.00 | .035 | 1.00 | |
| Moderate–high | 1.13 (1.01, 1.27) | 1.09 (0.97, 1.23) | .139 | |
| Media market | ||||
| Sydney (Ref) | 1.00 | .576 | … | … |
| Northern NSW | 0.97 (0.85, 1.12) | … | … | |
| Southern NSW | 0.93 (0.81, 1.07) | … | … | |
| Cigarette costliness | 1.00 (0.58, 1.74) | .992 | … | … |
| January interview | ||||
| No (Ref) | 1.00 | .053 | 1.00 | |
| Yes | 1.24 (1.00, 1.54) | 1.38 (1.10, 1.73) | .006 | |
| WNTD | ||||
| No (Ref) | 1.00 | .869 | … | … |
| Yes | 0.98 (0.73, 1.30) | … | … | |
| Campaign launch | ||||
| No (Ref) | 1.00 | .917 | … | … |
| Yes | 1.01 (0.89, 1.14) | … | … | |
| Graphic health warnings on cigarette packs | ||||
| None (Ref) | 1.00 | .436 | … | … |
| Set A | 1.16 (0.96, 1.42) | … | … | |
| Set B | 1.07 (0.88, 1.32) | … | … | |
| Sets A and B | 1.06 (0.90, 1.36) | … | … | |
| Smoke-free licensed venue legislation | ||||
| Before (Ref) | 1.00 | … | … | |
| After | 0.94 (0.83, 1.06) | .29 | … | … |
| Point-of-sale display ban | ||||
| Before (Ref) | 1.00 | .299 | … | … |
| Phase 1 | 1.08 (0.89, 1.32) | … | … | |
| Phase 2 | 0.88 (0.71, 1.09) | … | … | |
| Cumulative GRPsd | ||||
| 1 wk | 1.18 (0.95, 1.47) | .143 | 1.26 (1.01, 1.57) | .04 |
| 2 wk | 1.12 (0.97, 1.30) | .128 | 1.18 (1.02, 1.38) | .028 |
| 3 wk | 1.11 (0.98, 1.27) | .095 | 1.18 (1.04, 1.35) | .012 |
| 4 wk | 1.09 (0.97, 1.22) | .155 | 1.16 (1.03, 1.31) | .017 |
| 5 wk | 1.09 (0.97, 1.21) | .149 | 1.15 (1.03, 1.29) | .015 |
| 6 wk | 1.11 (0.99, 1.23) | .075 | 1.17 (1.05, 1.31) | .006 |
| 7 wk | 1.11 (1.00, 1.24) | .054 | 1.18 (1.05, 1.32) | .004 |
| 8 wk | 1.12 (1.00, 1.25) | .05 | 1.18 (1.05, 1.32) | .005 |
| 9 wk | 1.24 (1.01, 1.26) | .039 | 1.18 (1.06, 1.33) | .004 |
| 10 wk | 1.13 (1.01, 1.26) | .033 | 1.19 (1.06, 1.33) | .003 |
| 11 wk | 1.13 (1.01, 1.26) | .033 | 1.18 (1.06, 1.33) | .004 |
| 3 mo | 1.12 (1.00, 1.25) | .044 | 1.18 (1.05, 1.32) | .005 |
| 6 mo | 1.06 (0.95, 1.20) | .295 | … | … |
| 12 mo | 1.05 (0.93, 1.19) | .408 | … | … |
Note. CI = confidence interval; GRPs = gross rating points; NSW = New South Wales; OR = odds ratio; WNTD = World No Tobacco Day. Ellipses indicate variable not entered into multivariable model. Variables selected for entry into multivariate models if P < .25 in initial models; separate multivariable models were conducted for each of the cumulative GRP variables;
ORs for covariates in multivariable model were for the earliest model in which cumulative GRPs were significant at P < .01 (cumulative 6-wk GRPs).
bP is Wald test of joint significance for multilevel variables
Calculated from combined education and income responses.
GRPs are expressed in units of an average of 100 GRPs per week, excluding week of interview and preceding 3 weeks; multivariable analyses included a variable indicating time (week of interview) as a covariate, but this was not a significant predictor.
DISCUSSION
Adding to the accumulating evidence that increasing exposure to antismoking advertising is associated with positive smoking-related outcomes among adults, we found that the association between increasing advertising exposure and our quitting indicators was apparent only after 6 to 9 weeks of cumulative exposure. This finding is broadly consistent with recent time-series analyses that indicate that an increase in advertising exposure is associated with an accelerated decline in smoking prevalence up to 2 months later17 and with recent research showing that the likelihood of making a quit attempt in the previous 3 months is associated with increased exposure to tobacco control advertising during the same period.16 In combination, these findings suggest that campaign planners should use repeated cycles of advertising to provide both recent and sustained exposure to maximize the likelihood of achieving the desired effects on quitting. The cumulative GRP variables we used refer to an average exposure over the specified periods and do not imply that campaigns need to air continuously at the same GRP level for 6 to 9 weeks to have an effect. Rather, campaign planners should aim to ensure an adequate level of average exposure, which may be configured in several different ways, such as higher levels of initial exposure followed by slightly lower levels of exposure in subsequent weeks or a more constant level of exposure. Our analysis considered cumulative exposure to a series of campaign advertisements. During most of the 6- to 9-week intervals in the study period, more than 1 advertisement was on air.
Our findings suggested that the highest levels of exposure correlated with the greatest likelihood of change. We did not find any significant quadratic effects of GRPs for either outcome, suggesting that campaign effects did not diminish at the highest observed levels of GRPs. Despite observing the greatest changes at the highest level of GRPs, we found in our post hoc analyses that respondents with potential exposure to 100 to 150 GRPs per week over the relevant periods were more likely than individuals exposed to an average of fewer than 50 GRPs per week to have salient quitting thoughts or recent quit attempts. From these findings, we might infer that the optimal GRP level that will most efficiently influence these outcomes is somewhere between 100 and 200 GRPs per week.
Strengths and Limitations
Strengths of our study were the length of the study period and the resulting variation in antismoking advertising exposure, the use of weekly survey and advertising data, the use of proximal quitting indicators likely to be influenced by televised campaigns, and the inclusion of tobacco policy indicators and a wide range of other potential covariates. Although tobacco policy indicators were not associated with quitting outcomes in our multivariable analyses, this finding should not be interpreted as demonstrating that these policies have no effect. Like media campaigns, graphic health warnings provide widespread repeated exposure to a strong health message likely to influence smokers’ thoughts about quitting, and in our univariate analyses, respondents interviewed in the periods following the introduction of graphic health warnings were more likely to have salient quitting thoughts than those interviewed prior to their introduction. The other policies, however, have other aims, such as reducing social norms about smoking, reducing exposure to secondhand smoke (smoke-free laws), or limiting impulse purchases (point-of-sale display bans), and should be evaluated against such outcomes.
The survey used only landline telephone numbers and had a relatively low response rate, possibly leading to some bias in sample composition. Both these sampling issues were consistent across the study period, limiting their influence on the observed pattern of results, and our inclusion of the linear time variable in all analyses helped to account for any gradual differences over time. The rate of mobile-only households in Australia was recently estimated at 14%, limiting concerns about excluding these individuals from the sample.36 The response rate was similar to that of other recent population telephone surveys in Australia37 and the United States,38 and the overall rates of quitting in our sample were similar to those of larger population surveys of New South Wales smokers,39 suggesting that the smoker sample was representative in this respect. Although GRPs provide estimates of potential exposure to ads, they do not equate to actual individual exposure; however, research shows that they correlate well with individual recall of ads.40 A strength of our study was that the campaign exposure and outcome measures were not related to a specific campaign, but rather averaged across several cessation-focused campaigns with strong health effects messages. However, we did not account for the potential impact of different styles of advertising on quitting outcomes, and future research might consider whether longer or shorter periods of cumulative exposure to different styles of advertising are required before increases in the desired outcomes are achieved.
Conclusions
It is known that higher levels of population exposure to televised antismoking campaigns are associated with improved smoking-related outcomes; our results add to the sketchier information about the role of broadcasting schedules. Optimal and efficient media scheduling is critical to implementing cost-effective mass media campaigns. Our results suggest that adequate frequency of exposure over relatively sustained periods will maximize the possibility that they will affect cognitive and behavioral outcomes.
Human Participant Protection
The Cancer Institute NSW Tobacco Tracking Survey was approved by the institutional review board of New South Wales Population Health Services.
References
- 1.Centre for Epidemiology and Research. New South Wales Population Health Survey 2010 (HOIST) Sydney, Australia: Population Health Division, New South Wales Department of Health; 2011. [Google Scholar]
- 2.Emery S, Wakefield MA, Terry-McElrath Y et al. Televised state-sponsored antitobacco advertising and youth smoking beliefs and behavior in the United States 1999–2000. Arch Pediatr Adolesc Med. 2005;159(7):639–645. doi: 10.1001/archpedi.159.7.639. [DOI] [PubMed] [Google Scholar]
- 3.Wakefield M, Terry-McElrath Y, Emery S et al. Effect of televised, tobacco company–funded smoking prevention advertising on youth smoking-related beliefs, intentions, and behavior. Am J Public Health. 2006;96(12):2154–2160. doi: 10.2105/AJPH.2005.083352. [DOI] [PMC free article] [PubMed] [Google Scholar]
- 4.Davis KC, Nonnemaker JM, Farrelly MC. Association between national smoking prevention campaigns and perceived smoking prevalence among youth in the United States. J Adolesc Health. 2007;41(5):430–436. doi: 10.1016/j.jadohealth.2007.05.008. [DOI] [PubMed] [Google Scholar]
- 5.Farrelly MC, Davis KC, Haviland ML, Messeri P, Healton CG. Evidence of a dose-response relationship between “truth” antismoking ads and youth smoking prevalence. Am J Public Health. 2005;95(3):425–431. doi: 10.2105/AJPH.2004.049692. [DOI] [PMC free article] [PubMed] [Google Scholar]
- 6.Terry-McElrath YM, Wakefield MA, Emery S et al. State anti-tobacco advertising and smoking outcomes by gender and race/ethnicity. Ethn Health. 2007;12(4):339–362. doi: 10.1080/13557850701300723. [DOI] [PubMed] [Google Scholar]
- 7.Miller CL, Wakefield M, Roberts L. Uptake and effectiveness of the Australian telephone Quitline service in the context of a mass media campaign. Tob Control. 2003;12(suppl 2) doi: 10.1136/tc.12.suppl_2.ii53. ii53–ii58. [DOI] [PMC free article] [PubMed] [Google Scholar]
- 8.Carroll T, Rock B. Generating Quitline calls during Australia’s National Tobacco Campaign: effects of television advertisement execution and programme placement. Tob Control. 2003;12(suppl 2) doi: 10.1136/tc.12.suppl_2.ii40. ii40–ii44. [DOI] [PMC free article] [PubMed] [Google Scholar]
- 9.Wilson N, Grigg M, Graham L, Cameron G. The effectiveness of television advertising campaigns on generating calls to a national Quitline by Māori. Tob Control. 2005;14(4):284–286. doi: 10.1136/tc.2004.010009. [DOI] [PMC free article] [PubMed] [Google Scholar]
- 10.Mosbaek CH, Austin DF, Stark MJ, Lambert LC. The association between advertising and calls to a tobacco quitline. Tob Control. 2007;16(suppl 1):i24–i29. doi: 10.1136/tc.2007.020222. [DOI] [PMC free article] [PubMed] [Google Scholar]
- 11.Farrelly MC, Davis KC, Nonnemaker JM, Kamyab K, Jackson C. Promoting calls to a quitline: quantifying the influence of message theme, strong negative emotions and graphic images in television advertisements. Tob Control. 2011;20(4):279–284. doi: 10.1136/tc.2010.042234. [DOI] [PubMed] [Google Scholar]
- 12.Farrelly MC, Hussin A, Bauer UE. Effectiveness and cost effectiveness of television, radio and print advertisements in promoting the New York smokers’ quitline. Tob Control. 2007;16(suppl 1):i21–i23. doi: 10.1136/tc.2007.019984. [DOI] [PMC free article] [PubMed] [Google Scholar]
- 13.Durkin SJ, Wakefield MA, Spittal MJ. Which types of televised anti-tobacco campaigns prompt more quitline calls from disadvantaged groups? Health Educ Res. 2011 doi: 10.1093/her/cyr048. 26(6)998–1009. [DOI] [PubMed] [Google Scholar]
- 14.Hyland A, Wakefield M, Higbee C, Szczypka G, Cummings KM. State-sponsored anti-tobacco television advertising and indicators of smoking cessation in adults: a cohort study. Health Educ Res. 2006;21(2):296–302. doi: 10.1093/her/cyh068. [DOI] [PubMed] [Google Scholar]
- 15.Durkin SJ, Biener L, Wakefield MA. Effects of different types of antismoking ads on reducing disparities in smoking cessation among socioeconomic subgroups. Am J Public Health. 2009;99(12):2217–2223. doi: 10.2105/AJPH.2009.161638. [DOI] [PMC free article] [PubMed] [Google Scholar]
- 16.Wakefield MA, Spittal MJ, Yong HH, Durkin SJ, Borland R. Effects of mass media campaign exposure intensity and durability on quit attempts in a population-based cohort study. Health Educ Res. 2011;26(6):988–997. doi: 10.1093/her/cyr054. [DOI] [PMC free article] [PubMed] [Google Scholar]
- 17.Wakefield MA, Durkin S, Spittal MJ et al. Impact of tobacco control policies and mass media campaigns on monthly adult smoking prevalence. Am J Public Health. 2008;98(8):1443–1450. doi: 10.2105/AJPH.2007.128991. [DOI] [PMC free article] [PubMed] [Google Scholar]
- 18.Levy DT, Chaloupka F, Gitchell J. The effects of tobacco control policies on smoking rates: a tobacco control scorecard. J Public Health Manag Pract. 2004;10(4):338–353. doi: 10.1097/00124784-200407000-00011. [DOI] [PubMed] [Google Scholar]
- 19.Friend K, Levy DT. Reductions in smoking prevalence and cigarette consumption associated with mass-media campaigns. Health Educ Res. 2002;17(1):85–98. doi: 10.1093/her/17.1.85. [DOI] [PubMed] [Google Scholar]
- 20.Hopkins DP, Briss PA, Richard CJ et al. Reviews of evidence regarding interventions to reduce tobacco use and exposure to environmental tobacco smoke. Am J Prev Med. 2001;20(2 suppl):16–66. doi: 10.1016/s0749-3797(00)00297-x. [DOI] [PubMed] [Google Scholar]
- 21.Tellis GJ. Effective Advertising: Understanding When, How, and Why Advertising Works. Thousand Oaks, CA: Sage; 2004. [Google Scholar]
- 22.Donovan RJ, Boulter J, Borland R, Jalleh G, Carter O. Continuous tracking of the Australian National Tobacco Campaign: advertising effects on recall, recognition, cognitions, and behaviour. Tob Control. 2003;12(suppl 2) doi: 10.1136/tc.12.suppl_2.ii30. ii30–ii39. [DOI] [PMC free article] [PubMed] [Google Scholar]
- 23.Fishbein M, Yzer MC. Using theory to design effective health behavior interventions. Commun Theory. 2006;13(2):164–183. [Google Scholar]
- 24.Fong GT, Hammond D, Laux FL et al. The near-universal experience of regret among smokers in four countries: findings from the International Tobacco Control Policy Evaluation Survey. Nicotine Tob Res. 2004;6(suppl 3):S341–S351. doi: 10.1080/14622200412331320743. [DOI] [PubMed] [Google Scholar]
- 25.Chapman S. Accelerating smoking cessation and prevention in whole communities. In: Chapman S, editor. Public Health Advocacy and Tobacco Control: Making Smoking History. Malden, MA: Blackwell Publishing; 2007. pp. 127–152. [Google Scholar]
- 26.American Association for Public Opinion Research. Standard Definitions: Final Dispositions of Case Codes and Outcome Rates for Surveys. Lenexa, KS: AAPOR; 2008. [Google Scholar]
- 27. 2011 Weekly TARP data for all television markets in NSW, Australia, 2005-2010. Prepared for The Cancer Institute NSW. North Sydney, Australia: OzTAM Pty Ltd. [Google Scholar]
- 28.Broadbent S. Modelling with adstock. J Mark Res Soc. 1984;26(4):295–312. [Google Scholar]
- 29.Census of population and housing: socio-economic indexes for areas (SEIFA), Australia—data only, 2006. 2008 Australian Bureau of Statistics. Available at: http://www.abs.gov.au/ausstats/abs@.nsf/mf/2033.0.55.001. Accessed April 11, 2011. [Google Scholar]
- 30.New South Wales Retail Tobacco Traders’ Association. Australian Retail Tobacconist. 2005–2010:65–79. [Google Scholar]
- 31.Australian Bureau of Statistics. Average weekly earnings. 2010 Available at: http://www.abs.gov.au/ausstats/abs@.nsf/mf/6302.0. Accessed April 11 2011. [Google Scholar]
- 32.Set A. health warnings—cigarette packs. Department of Health and Ageing. Available at: http://www.health.gov.au/internet/main/publishing.nsf/Content/tobacco-warn-A. Accessed April 13, 2011.
- 33.Set B. health warnings—cigarette packs. Department of Health and Ageing. Available at: http://www.health.gov.au/internet/main/publishing.nsf/Content/tobacco-warn-B. Accessed April 13, 2011.
- 34.Hosmer DW, Lemeshow S. Applied Logistic Regression. 2 ed. New York, NY: Wiley and Sons; 2000. [Google Scholar]
- 35.Population by age and sex, Australian states and territories, June 2010. Australian Bureau of Statistics. Available at: http://www.abs.gov.au/Ausstats/abs@.nsf/mf/3201.0. Accessed May 1, 2011. [Google Scholar]
- 36.Pennay DW. Profiling the “mobile phone only” population: a study of Australians with a mobile phone and no landline telephone. 2010 Available at: http://www.srcentre.com.au/docs/publications/dual_frame-survey_acspri-conference-paper_finalv2.pdf?sfvrsn=0. Accessed February 27, 2013. [Google Scholar]
- 37.Thompson ME, Fong GT, Hammond D et al. Methods of the International Tobacco Control (ITC) Four Country Survey. Tob Control. 2006;15(suppl 3) doi: 10.1136/tc.2005.013870. iii12–iii18. [DOI] [PMC free article] [PubMed] [Google Scholar]
- 38.Cantor D, Coa K, Crystal-Mansour S, Davis T, Dipko S, Sigman R. Health Information National Trends Survey (HINTS) 2007: final report. 2009 Available at: http://hints.cancer.gov/docs/HINTS2007FinalReport.pdf. Accessed January 18, 2011. [Google Scholar]
- 39.New South Wales Smoking and Health Survey 2009. Cancer Institute NSW. Available at: http://www.cancerinstitute.org.au/publications/i/new-south-wales-smoking-and-health-survey-2009. Accessed April 11, 2011.
- 40.Southwell BG, Barmada CH, Hornik RC, Maklan DM. Can we measure encoded exposure? Validation evidence from a national campaign. J Health Commun. 2002;7(5):445–453. doi: 10.1080/10810730290001800. [DOI] [PMC free article] [PubMed] [Google Scholar]