Abstract
Mapping protein hotspots and analysis of the binding free energy associated with each hotspot can provide critical information for drug design. In the present study, we have performed computational analysis for the two known hotspots in thermolysin. Our data showed that the free energy double-decoupling method can determine the binding free energy of different probe molecules associated with the same hotspot or different hotspots with the same probe molecule. The less expensive cosolvent mapping method can be used to readily identify known protein hotspots without prior knowledge and also provide a good estimate of the binding free energy, as compared to the more expensive free energy double-decoupling method. Hence, the combination of the cosolvent mapping method to identify potential protein hotspots followed by more rigorous calculation of the binding free energy associated with each hotspot using the double-decoupling method can provide very useful information for drug design.
Keywords: Computational analysis, protein hotspots, binding free energy, double-decoupling method, cosolvent mapping method
Protein−protein interfaces (PPIs) are typically much larger than the “active sites” in enzymes and receptors, making it a challenging task to design small molecule inhibitors of PPIs.1,2 A study3 systematically mutating amino acids at the PPI of the hormone−receptor complex to alanine showed that some smaller regions at the PPI played dominant roles in binding between proteins, thus hotspots. Because the sizes of the hotspots are comparable to small organic molecules, information concerning hotspots at the PPIs is critical for developing small molecule inhibitors to disrupt PPIs. To determine the hotspots at PPIs, both the site locations and their associated binding free energy contribution are needed.
To detect locations of binding sites in proteins, organic functional groups mimicking the side chain atoms of amino acids have been used as probe molecules. For example, isopropanol (IPA) and ethanol were used to mimic side chains of threonine and serine. An experimental approach, named the multiple solvent crystal structures (MSCS) method,4 maps multiple binding sites on proteins simultaneously using different organic solvents. In MSCS, protein crystals are soaked in different concentrations of organic cosolvents. Crystal structures thus determined reveal binding sites of the probe molecules. The number of probe molecules resolved in the crystal structures increases as the ratio of the organic solvent versus water increases. Although binding sites can be detected, organic solvents have weak binding affinities and can bind to multiple sites in one protein. Site-specific binding affinity is difficult to determine experimentally. Cosolvent molecules can also be trapped at the protein interface caused by crystal packing. These issues are challenges for using the MSCS method to identify protein hotspots.
The binding affinity of probe molecules at the protein binding sites can be estimated by computational methods. A computational approach similar to the concept of the MSCS method is called multiple copy simultaneous search (MCSS).5 Based on MCSS, binding free energy of functional groups identified at different binding sites are determined empirically. Potent groups are selected as a combinatorial basis in ligand design.6 A recent method, the “cosolvent mapping method”,7 employs cosolvent molecular dynamics simulations aiming to detect binding sites and estimate the theoretical maximum binding free energy at each site in one simulation. Sites with binding free energy exceeding a cutoff value are considered as hotspots. The cosolvent mapping method has the advantage of detecting de novo hotspots without prior knowledge of the protein−protein/ligand structures and does not have the issue of identifying sites formed by crystal contacts in the MSCS approach.
To this date, the binding free energy of the probe molecules at the potential hotspots has been calculated empirically,5,7,8 and experimental measurements are unavailable. To advance the MSCS approach and related computational methods toward wider applications in developing PPI inhibitors, a rigorous evaluation of the binding free energy of probe molecules at the hotspots is necessary. Herein, we employed a double-decoupling method9,10 to study the standard free energy associated with decoupling a probe molecule from two binding sites in a well-known protein, thermolysin, identified by the MSCS approach. We then employed the cosolvent mapping method7 to evaluate the maximum binding affinity of multiple hotspots in proteins. Errors of the empirical estimates at the two sites determined by MSCS were determined by comparing them with values obtained from the double-decoupling method.
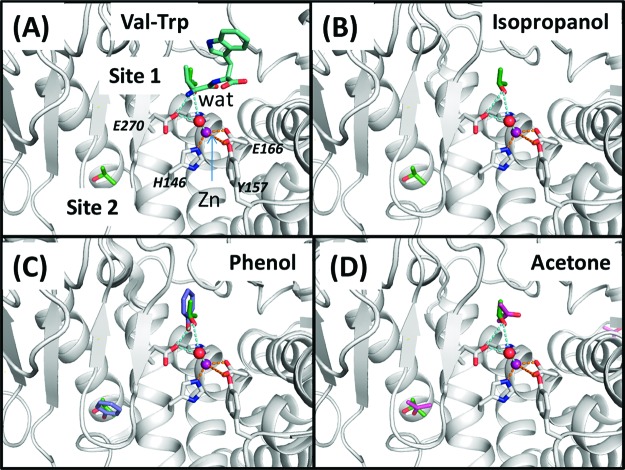
Fifteen crystal structures of thermolysin soaked in aqueous organic cosolvents have been reported. These include thermolysin in 2 (PDB ID: 1TLI), 5 (2TLI), 10 (3TLI), 25 (4TLI), 60 (5TLI and 6TLI), 90 (7TLI), and 100% (8TLI) IPA,11 50 (1FJ3), 60 (1FJO), and 70% (1FJQ) acetone (ACN),12 50 (1FJT), 60 (1FJV), and 80% (1FJU) acetonitrile,12 and 50 mM phenol (IPH) (1FJW).12 Structural alignment of thermolysin from the 15 crystal structures in Figure 1 shows that its native conformation is unchanged at these different concentrations of cosolvent and that organic solvent molecules cluster at two primary sites, or hotspots, denoted sites 1 and 2. In the thermolysin/IPA case, site 2 is detected at IPA concentrations of 2 and 5%. At higher concentrations, site 1 began to be resolved, and at still higher cosolvent concentrations, other binding sites could be detected on the protein surface. Site 1 is known to be the substrate binding site. The zinc ion in site 1 has a catalytic role to cleave the peptide bond of its substrate. It has been suggested to coordinate the carbonyl group of the substrate and a water molecule or a hydroxide ion in the reaction.13 From the 15 crystal structures, we found that a water molecule coordinated with the zinc ion is always present (see Figure 2). However, no direct interaction between the zinc ion and the cosolvent was found from the crystal structures. In Figure 2A, Val of a hydrolyzed product (Val-Trp)14 was shown to align closely with an IPA molecule. At site 1, the IPA molecule forms a hydrogen bond with a water molecule, which bonds with the zinc ion via another hydrogen bond (see Figure 2B). A similar bonding interaction is also seen with an IPH molecule but not with an ACN molecule in Figure 2C,D.
Figure 1.
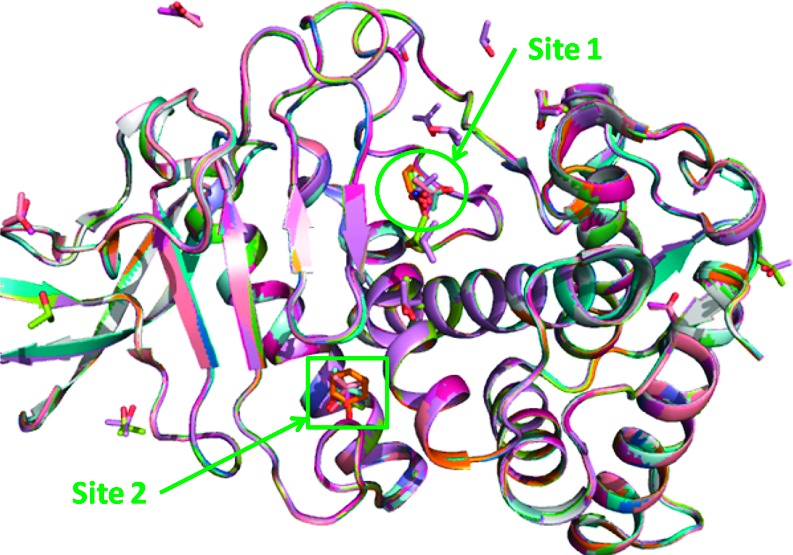
Alignment of thermolysin crystal structures soaked in different organic solvents at v/v percentage concentration. IPA at 2, 5, 10, 25, 60, 90, and 100%; ACN at 50, 60, and 70%; acetonitrile at 50, 60, and 80%; and IPH at 50 mM.
Figure 2.
Comparison of the binding of (A) a hydrolyzed product (l-Val-l-Trp) (PDB ID: 3TMN), (B) IPA, (C) IPH, and (D) ACN at site 1 (catalytic site) and site 2 of thermolysin. The IPA molecules at both sites are shown for comparison.
Data obtained from crystal structures showed that the first binding site detected at the lowest cosolvent concentration using different probe molecules is site 2. Inspection of the thermolysin structure indicates that site 2 is a cavity site buried within a loop in thermolysin and is distant from the catalytic site. To demonstrate the effects of the observed structural differences between sites 1 and 2 on binding free energy of the same probe molecule, we used the IPA. Figure 1 also highlights another limitation of the MSCS approach. The preference of binding of different probe molecules at site 1 cannot be directly obtained because they bind to the site at different cosolvent ratio concentrations. To address this question quantitatively, we studied the binding free energy of IPA, IPH, and ACN at site 1.
To estimate the limitation of the parameters used for the probe molecules, we first calculated the hydration free energy of IPA, IPH, and ACN. The calculated hydration free energies of IPA, IPH, and ACN in aqueous condition are −4.11, −5.90, and −4.40 kcal/mol, respectively, as shown in Table 1. The reported experimental values of the three molecules are −4.76, −6.62, and −3.85 kcal/mol, respectively.15,16 The differences between the calculated and the experimental values are 0.65, 0.72, and −0.55 kcal/mol for the three molecules. The errors are similar to the average error of 1 kcal/mol reported by a recent study in which a thermodynamics integration method was used to calculate the hydration free energy of 44 small neutral molecules.17
Table 1. Hydration Free Energy of Three Probe Molecules in Aqueous Conditiona.
| probe molecule | experiment | calculation | error |
|---|---|---|---|
| IPA | −4.7616 | −4.11 ± 0.37 | 0.65 |
| IPH | −6.6216 | −5.90 ± 0.03 | 0.72 |
| ACN | −3.8515 | −4.40 ± 0.61 | −0.55 |
The unit is in kcal/mol.
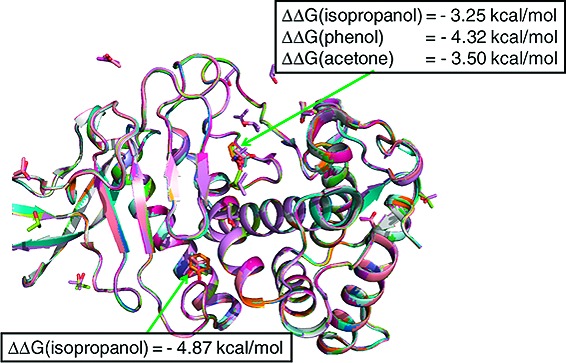
We next determined the binding free energy of an IPA molecule at sites 1 and 2 by the double-decoupling approach. In the double-decoupling method, the interaction between the molecule and its environment is slowly turned off (decoupling) by changing a parameter via the perturbation theory.18 In the process, the system (the molecule and its environment) is changed from a state with the molecule present to another state with the molecule absent. The net change of the energy between two states gives the free energy of the molecule in the system. The free energy difference of the molecule in solvent and at the protein binding site with solvent (thus double decoupling) yields the binding free energy of the molecule to the protein in solution. Here, we found that decoupling an IPA molecule in bulk water gave a standard free energy, ΔG0 (IPA), of 23.35 kcal/mol (Table 2). In comparison, decoupling a water molecule in bulk water based on the double-decoupling approach has been reported to give a standard free energy of 5.9−6.0 kcal/mol,10,19 close to the experimental value of 6.3 kcal/mol.20 These data are consistent with the fact that the excluded volume of an IPA molecule is about four times that of a water molecule. When decoupling the IPA molecule at sites 1 and 2, we found a standard free energy loss (ΔΔG) of −3.25 and −4.87 kcal/mol, respectively, with respect to ΔG0 (IPA) in bulk water (Table 2). Both values are associated with the binding free energy of an IPA molecule at site 1 or 2 in an IPA-dilute equilibrium system. The greater binding free energy at site 2 can be attributed to the fact that site 2 is buried in the protein, while site 1 is exposed to solvent.
Table 2. Standard Free Energy of Removing a Probe Molecule, That Is, IPA, IPH, and ACN, from Bulk Water and at Sites 1 and 2 in Thermolysin Calculated Using the Double-Decoupling Methoda.
| ΔG0 |
||||
|---|---|---|---|---|
| water | IPA | IPH | ACN | |
| bulk water | 5.9 ± 0.1019 | 23.35 ± 0.42 | 11.53 ± 0.01 | 43.75 ± 0.02 |
| site 1 | 26.60 ± 0.17 | 15.85 ± 0.11 | 47.25 ± 0.39 | |
| ΔΔG (ref bulk water) | −3.25 ± 0.45 | −4.32 ± 0.11 | −3.50 ± 0.39 | |
| site 2 | 28.22 ± 0.40 | |||
| ΔΔG (ref bulk water) | −4.87 ± 0.58 | |||
The unit is in kcal/mol.
IPH and ACN were selected to investigate the difference of binding free energy of other probe molecules at site 1 (the substrate binding site). A free energy loss of −4.32 kcal/mol was obtained for IPH and −3.50 kcal/mol for ACN (Table 2). Our calculations thus showed that the binding free energy at the substrate binding site of the three different organic solvent molecules ranges from −3.25 to −4.32 kcal/mol. On the basis of the three molecule probes and the double-decoupling method, the maximum binding free energy of a small molecule at site 1 is approximately −4.32 kcal/mol.
We next employed the cosolvent mapping method7 using IPA as probes to detect hotspots in thermolysin. The cosolvent mapping method does not require the knowledge of the hotspot locations in the protein and has the advantage of probing multiple hotspots in the same simulation. However, its accuracy has not been well established.7
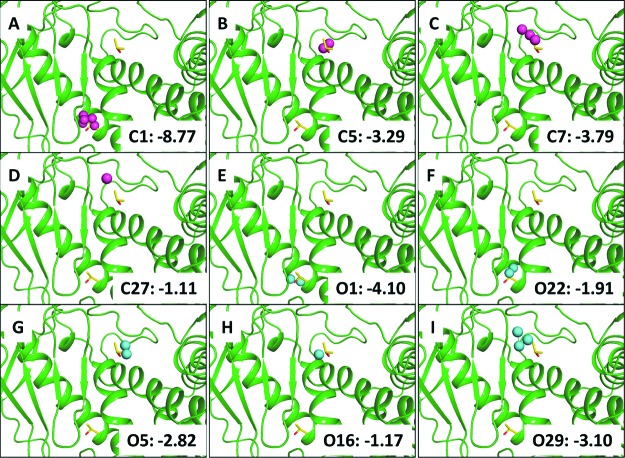
In the cosolvent mapping approach,7 carbons of the terminal methyl groups and the oxygen atom in IPA were used to probe the binding sites. The observed frequency (Np) of the probe atom at a grid point around the protein was compared with an expected frequency (N0) in a pure cosolvent mixture to give an estimate of the binding free energy of the probe atom at that grid point, that is, ΔGCM = −kT log (Np/N0) (or see eq S5 in the Supporting Information). Grid points with binding free energies higher than −0.83 kcal/mol were collected to form pseudo atoms (vertices with a radius = 1.4 Å), and a bonding distance of 2.5 Å between pseudo atoms (edge) was used to generate chemical graphs. These graphs represent locations (or hotspots) in the binding sites with high affinity to the probe atoms and are influenced by the dynamical changes of the protein conformation at the binding sites. From these analyses, we identified three chemical graphs at site 1 (Figure 3B−-D) and one at site 2 (Figure 3A) using carbon atom probes. When the oxygen atom probe was used, we found three chemical graphs at site 1 (Figure 3G−I) and two at site 2 (Figure 3E,F). The empirical estimates of binding free energy suggest that the chemical graphs determined by carbon atom probes yield values from −1.11 (one atom) to −3.79 kcal/mol (three atoms) at site 1 and −8.77 kcal/mol (five atoms) at site 2. The chemical graphs determined by oxygen atom probes give values from −1.17 (one atom) to −3.10 kcal/mol (three atoms) at site 1 and −1.91 or −4.10 kcal/mol (both two atoms) at site 2. Figure 3 shows the maximum binding free energy at site 1 by carbon atoms is −3.79 kcal/mol, whereas using groups of oxygen atoms for ligands may potentially contribute −3.10 kcal/mol to the binding free energy at site 1.
Figure 3.
Identification and estimates of binding free energy of the hotspots in thermolysin based on chemical graphs using carbon atom probes (A−D, purple spheres) and oxygen atom probes (E−I, cyan spheres) analyzed from the 20% v/v IPA cosolvent simulation. The unit is in kcal/mol.
However, chemical graphs do not translate directly into a molecular structure. To compare these results with data from the double-decoupling calculations, we used the average value of the binding free energy of these pseudo atoms at each site to form a moiety consisting of two pseudo carbon atoms and one pseudo oxygen atom. On the basis of this estimate, we obtained a binding free energy of −3.91 for site 1 and −5.01 kcal/mol for site 2. These values are slightly larger than those calculated from the rigorous double-decoupling method. The empirical formula of ΔGCM accounts for the difference of the probe molecule interacting with two environments, that is, at the protein binding site and in the cosolvent mixture. It is theoretically analogous to the double-decoupling approach in which the difference of standard free energy of the probe molecule at the protein binding site and in water yields the binding free energy of the probe molecule at the binding site. Although the double-decoupling approach rigorously determines the binding free energy of the probe molecule at binding sites, it depends on prior knowledge of the binding sites. In contrast, the cosolvent mapping method has the advantage of detecting de novo multiple hotspots on the protein surface and estimating their relative importance in a single simulation. Furthermore, the chemical graphs generated from the analyses encompass greater regions of the binding site than are provided by a single probe molecule. Clusters of chemical graphs at a site can yield a larger chemical fragment and may be used as the starting points for fragment-based drug design (see Figure 4).
Figure 4.
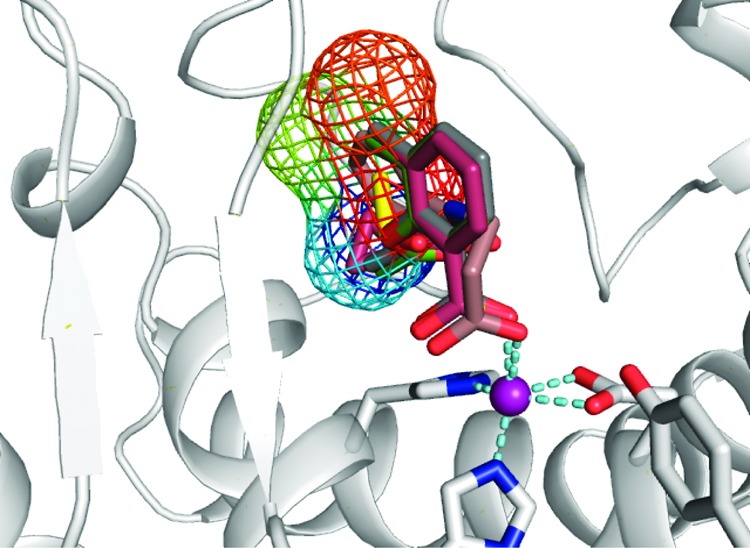
Overlap of the chemical graphs C5 and C7 (mesh contour) with the small inhibitor fragments bound to the binding site of thermolysin. The color of the contour map reflects the binding affinity contribution of the pseudo atoms with the red color yielding a lower binding free energy than the blue color region. The PDB entries for the superimposed crystal structures are 3FGD, 3FCQ, 3F28, and 3F2P. The zinc ion is shown in the purple sphere.
Ligand binding sites detections and evaluations on protein surfaces have been implemented in several modeling programs, including LIGSITEcsc21 and SiteMap,22 the α-shape-based approach23 in MOE,24 and CASTp.25 These methods assess the hotspots on proteins based on single static structures as opposed to the cosolvent mapping method in which the dynamical changes of the protein binding sites are included. A comparison of these different methods on the same protein systems will be important to understand the impact of the protein flexibility at the binding sites on hotspot evaluations and will be pursued in future studies.
Using the double-decoupling approach, we have determined that the binding free energies of three organic probe molecules at the substrate binding site in thermolysin vary from −3.25 to −4.32 kcal/mol. Estimates based on two carbon atoms and one oxygen atom analogous to an IPA molecule calculated from the cosolvent mapping method gave a slightly larger but comparable binding free energy at the same site. Although the assessments to the binding sites in thermolysin are agreeable between both methods, binding sites at the protein−protein binding interface are large. The cosolvent mapping method can give chemical graphs comparable to large chemical groups. Because entropy effects of restraining the bonds in the chemical graphs are not explicitly accounted for in the cosolvent mapping method, the expensive double-decoupling calculation can provide accurate values of larger fragments and be used as references for parametrization in the empirical cosolvent mapping method.
Our present study shows that a combination of these computational methods should provide an efficient and reliable means of probing hotspots in proteins without prior knowledge of the active sites. Hence, one useful computational strategy to assist structure-based drug design efforts is to first employ the cosolvent mapping method to identify potential protein hotspots and chemical graphs of ligands, followed by the double-decoupling calculations of chemical fragments to analyze the binding free energy associated with each protein hotspot. We are currently investigating the utility of these methods for detection of hotspots in protein−protein interactions and for structure-based drug design.
Acknowledgments
We thank Dr. George W. A. Milne for his critical reading of the manuscript and Dr. Xavier Barril, Universitat de Barcelona, Spain, for helpful discussions and for providing parameters used in the cosolvent mapping calculations.
Supporting Information Available
Material detailing the computational methods and breakdown of the standard free energy calculations. This material is available free of charge via the Internet at http://pubs.acs.org.
Supplementary Material
References
- Wells J. A.; McClendon C. L. Reaching for high-hanging fruit in drug discovery at protein-protein interfaces. Nature 2007, 450, 1001. [DOI] [PubMed] [Google Scholar]
- Fry D. C. Protein-protein interactions as targets for small molecule drug discovery. Pept. Sci. 2006, 84, 535. [DOI] [PubMed] [Google Scholar]
- Clackson T.; Wells J. A hot spot of binding energy in a hormone-receptor interface. Science 1995, 267, 383. [DOI] [PubMed] [Google Scholar]
- Mattos C.; Ringe D. Locating and characterizing binding sites on proteins. Nat. Biotechnol. 1996, 14, 595. [DOI] [PubMed] [Google Scholar]
- Miranker A.; Karplus M. Functionality maps of binding sites: a multiple copy simultaneous search method. Proteins 1991, 11, 29. [DOI] [PubMed] [Google Scholar]
- Joseph-McCarthy D.; Tsang S. K.; Filman D. J.; Hogle J. M.; Karplus M. Use of MCSS to design small targeted libraries: Application to picornavirus ligands. J. Am. Chem. Soc. 2001, 123, 12758. [DOI] [PubMed] [Google Scholar]
- Seco J.; Luque F. J.; Barril X. Binding Site Detection and Druggability Index from First Principles. J. Med. Chem. 2009, 52, 2363. [DOI] [PubMed] [Google Scholar]
- Dennis S.; Kortvelyesi T.; Vajda S. Computational mapping identifies the binding sites of organic solvents on proteins. Proc. Natl. Acad. Sci. U.S.A. 2002, 99, 4290. [DOI] [PMC free article] [PubMed] [Google Scholar]
- Gilson M. K.; Given J. A.; Bush B. L.; McCammon J. A. The statistical-thermodynamic basis for computation of binding affinities: A critical review. Biophys. J. 1997, 72, 1047. [DOI] [PMC free article] [PubMed] [Google Scholar]
- Hamelberg D.; McCammon J. A. Standard free energy of releasing a localized water molecule from the binding pockets of proteins: Double-decoupling method. J. Am. Chem. Soc. 2004, 126, 7683. [DOI] [PubMed] [Google Scholar]
- English A. C.; Done S. H.; Caves L. S. D.; Groom C. R.; Hubbard R. E. Locating interaction sites on proteins: The crystal structure of thermolysin soaked in 2% to 100% isopropanol. Proteins: Struct., Funct., Genet. 1999, 37, 628. [PubMed] [Google Scholar]
- English A. C.; Groom C. R.; Hubbard R. E. Experimental and computational mapping of the binding surface of a crystalline protein. Protein Eng. 2001, 14, 47. [DOI] [PubMed] [Google Scholar]
- Matthews B. W. Structural basis of the action of thermolysin and related zinc peptidases. Acc. Chem. Res. 1988, 21, 333. [Google Scholar]
- Holden H. M.; Matthews B. W. The binding of L-valyl-L-tryptophan to crystalline thermolysin illustrates the mode of interaction of a product of peptide hydrolysis. J. Biol. Chem. 1988, 263, 3256. [DOI] [PubMed] [Google Scholar]
- Rankin K. N.; Sulea T.; Purisima E. O. On the transferability of hydration-parametrized continuum electrostatics models to solvated binding calculations. J. Comput. Chem. 2003, 24, 954. [DOI] [PubMed] [Google Scholar]
- Sulea T.; Wanapun D.; Dennis S.; Purisima E. O. Prediction of SAMPL-1 hydration free energies using a continuum electrostatics-dispersion model. J. Phys. Chem. B 2009, 113, 4511. [DOI] [PubMed] [Google Scholar]
- Mobley D. L.; Dumont E.; Chodera J. D.; Dill K. A. Comparison of charge models for fixed-charge force fields: small-molecule hydration free energies in explicit solvent. J. Phys. Chem. B 2007, 111, 2242. [DOI] [PubMed] [Google Scholar]
- Pearlman D. A. In Free Energy Calculations in Rational Drug Design; Reddy M. R., Erion M. D., Eds.; Kluwer Academic/Plenum Publishers: New York, 2001, p 9. [Google Scholar]
- Lu Y.; Yang C. Y.; Wang S. Binding free energy contributions of interfacial waters in HIV-1 protease/inhibitor complexes. J. Am. Chem. Soc. 2006, 128, 11830. [DOI] [PubMed] [Google Scholar]
- Bennaim A.; Marcus Y. Solvation Thermodynamics of Nonionic Solutes. J. Chem. Phys. 1984, 81, 2016. [Google Scholar]
- Huang B.; Schroeder M. LIGSITEcsc: Predicting ligand binding sites using the Connolly surface and degree of conservation. BMC Struct. Biol. 2006, 6, 19. [DOI] [PMC free article] [PubMed] [Google Scholar]
- Halgren T. A. Identifying and Characterizing Binding Sites and Assessing Druggability. J. Chem. Inf. Model. 2009, 49, 377–389. [DOI] [PubMed] [Google Scholar]
- Edelsbrunner H.; Mucke E. P. Three-dimensional alpha shapes. ACM Trans. Graph. 1994, 13, 43–72. [Google Scholar]
- MOE; Chemical Computing Group: Montreal, Quebec, Canada, 2009. [Google Scholar]
- Dundas J.; Ouyang Z.; Tseng J.; Binkowski A.; Turpaz Y.; Liang J. CASTp: Computed atlas of surface topography of proteins with structural and topographical mapping of functionally annotated residues. Nucleic Acids Res. 2006, 34, W116. [DOI] [PMC free article] [PubMed] [Google Scholar]
Associated Data
This section collects any data citations, data availability statements, or supplementary materials included in this article.


