

Abstract
Aims/Introduction: Islets in type 2 diabetes are characterized by deposition of islet amyloid polypeptide (IAPP) as well as β‐cell dysfunction. The unique amyloidogenic character of human (h)IAPP is associated with cytotoxicity. Autophagy is a ubiquitous system of cellular recycling that contributes to cell survival. Thus, we examined whether autophagy could ameliorate hIAPP‐associated cytotoxicity.
Materials and Methods: First, we used a COS‐1 cell model, lacking endogenous IAPP that might affect cytotoxicity related to exogenous hIAPP. Next, we used the mouse β‐cell line, MIN‐6 cells. Both cells were transfected with hIAPP or rat (r)IAPP expression constructs, or transfected with bicistronic vectors expressing green fluorescent protein (GFP) and either hIAPP or rIAPP for flow cytometry analysis. Cell viability and apoptosis markers were studied in relation to chemical or genetic modulation of autophagy.
Results: The viability of cells expressing hIAPP was significantly decreased as compared with those expressing rIAPP and the cleavage of pro‐caspase‐3 was elevated in hIAPP‐transfected cells. The formation of autophagosomes and the conversion of microtubule‐associated protein light chain 3B I to II were elevated in hIAPP‐expressing cells. The viability of hIAPP‐expressing cells was increased after treatment with rapamycin, an inducer of autophagy, and decreased after treatment with 3‐methyladenine, an inhibitor of autophagy. In MIN‐6 cells, annexin positive cells were increased by 3‐methyladenine and decreased by rapamycin using flow cytometry. Knocking down of the autophagy protein 5 gene decreased hIAPP‐transfected cell viability.
Conclusions: Autophagy is co‐localized with hIAPP expression and it plays a protective role in hIAPP‐associated apoptosis. (J Diabetes Invest, doi: 10.1111/j.2040‐1124.2010.00065.x, 2010)
Keywords: Autophagy, Islet amyloid polypeptide, Type 2 diabetes
Introduction
The islets of patients with type 2 diabetes (T2D) are characterized by the deposition of islet amyloid1,2 as well as β‐cell dysfunction3. Human (h) islet amyloid polypeptide (IAPP), a 37 amino acid peptide, is co‐secreted with insulin from β‐cells and is a main component of islet amyloid deposits. We isolated and characterized hIAPP cDNA4 and genomic DNA5. We also described a missense mutation (S20G) in the hIAPP gene, which was associated with premature onset diabetes6, providing genetic evidence for a role of IAPP in the pathogenesis of T2D. In autopsy studies of the pancreas of T2D patients, a positive relationship between the amount of islet amyloid and β‐cell loss has been suggested3,7. Our in vitro studies using COS‐1 cells as a model system have shown that the intracellular deposition of hIAPP amyloid is accompanied by cell death through apoptosis8–10. In contrast, expression of rat (r)IAPP, which is not amyloidogenic, does not show cytotoxicity in COS‐1 cells8–10.
Autophagy represents a cellular quality control mechanism and plays an essential role in the maintenance of cell viability by removing abnormal cellular organelles and proteins11. Autophagy occurs constitutively in most tissues and contributes to the routine turnover of cytoplasmic components. Paradoxically, autophagy can play a protective role in damaged cells, but might also contribute to cell death12–14. Recent studies have shown that autophagic mechanisms might play important roles in the prevention of diabetes through their ability to provide an adaptive response to stress, such as that incurred in insulin resistant states15–17.
Thus, we carried out in vitro studies to determine whether hIAPP cytotoxicity could be related to autophagy and how autophagy would affect the cytotoxicity of hIAPP.
Materials and Methods
Materials
Anti‐IAPP mouse monoclonal antibodies were purchased from Cerotec (Oxford, UK). Anti‐microtubule‐associated protein light chain 3B (LC3) rabbit polyclonal antibodies, anti‐pro‐caspase‐3 rabbit polyclonal antibodies, anti‐cleaved‐caspase‐3 rabbit polyclonal antibodies, anti‐ATG5 rabbit polyclonal antibodies and anti‐β‐actin rabbit monoclonal antibodies were from Cell Signaling Technology (Beverly, MA, USA). Anti‐β‐actin mouse monoclonal antibodies were from Sigma‐Aldrich (St. Louis, MO, USA). Alexa488‐conjugated anti‐rabbit IgG donkey antibodies and Alexa546‐conjugated anti‐mouse IgG goat antibodies were from Invitrogen (Carlsbad, CA, USA). Tunicamycin and 3‐methyladenine (3‐MA) were purchased from Sigma‐Aldrich. Rapamycin was from Merck Bioscience (Darmstadt, Germany). The chemicals were dissolved in appropriate media or DMSO and treated at the requisite working dilutions. All chemicals were handled in accordance with the manufacturer’s recommendations.
Cell Culture and Transfection
COS‐1 cells were purchased from Riken Cell Bank (Tsukuba, Japan). MIN‐6 cells were kindly provided by J Miyazaki (Osaka University, Osaka, Japan). COS‐1 cells were cultured as described previously10, and MIN‐6 cells were cultured in DMEM containing 25 mmol/L glucose (Life Technologies Japan, Tokyo, Japan) with 10% FBS (Hyclone, Logan, UT, USA), 100 U/mL of penicillin (Life Technologies Japan), 100 μg/mL of streptomycin‐sulfate (Life Technologies Japan) and 2 mmol/L of l‐glutamine (Life Technologies Japan) at 37°C in 100% humidified air containing 5% CO2. All cells in the present study were used within passage 10. Transfection of cells with plasmids was carried out with Fugene 6 (Roche Diagnosis Corporation, Indianapolis, IN, USA) or Lipofectamine LTX (Life Technologies Japan) transfection reagent according to the manufacturer’s instructions. Cells were rinsed with PBS and harvested by trypsinization with 0.5× trypsin‐EDTA solution (Sigma‐Aldrich).
Plasmids
Human IAPP and rIAPP cDNA encoding the full‐length human and rat IAPP precursor protein were subcloned into the expression vector pMT2, respectively, as described previously10. Both cDNA were also ligated into pIRES‐GFP vector (Clontech, Palo Alto, CA, USA), which contains the internal ribosome entry site (IRES) and is designed for the simultaneous expression of a green fluorescent protein (GFP) and human or rat IAPP protein. The hIAPP‐ or the rIAPP‐ inserted pIRES‐GFP vector was prepared only for flow cytometry assay, assessing chemical modulation of autophagy. All cDNA were verified by sequencing.
Cell Viability Assay
Viability of the cells was assessed using a modified 3‐(4, 5‐dimethylthiazolyl‐2)‐2, 5‐diphenyltetrazolium bromide (MTT) colorimetric assay (Cell Counting Kit; Dojindo Laboratories, Kumamoto, Japan), according to the manufacturer’s instructions.
Immunostaining
To detect IAPP expression, cells were grown in Lab‐Tek chambered slides (Nalgene Nunc International, Rochester, NY, USA). Cells that had been transfected for 48 h were fixed in 100% ethanol and permeabilized with 0.2% (v/v) Triton X‐100. Non‐specific immunoreactivity was blocked with 10% (v/v) normal horse serum. Specimens were incubated with anti‐hIAPP antibodies (diluted 1:400) followed by incubation with Alexa546‐conjugated anti‐mouse IgG goat antibodies (diluted 1:200). Cells were shielded and the nuclei were visualized with mounting medium (VECTASHIELD Mounting Medium with DAPI; Vector Laboratories, Burlingame, CA, USA) containing DAPI. Specimens were immediately analyzed by fluorescence microscopy (BZ‐9000; KEYENCE, Osaka, Japan).
Western Blot Analysis
Cells were incubated for 48 h after transfection and harvested as described earlier. Cells were lysed in protein extraction reagent (Tissue Protein Extraction Kit; Pierce, Rockford, IL, USA) containing protease inhibitor cocktail (Halt Protease Inhibitor Cocktail; Pierce), and the lysates were extracted by centrifugation. Equal amounts of protein were loaded per sample in each experiment, separated by SDS‐PAGE and transferred to polyvinylidene difluoride membranes by electroblotting. The membranes were incubated with appropriate dilutions of primary antibodies and labeled with the application of appropriate peroxidase‐conjugated second antibodies. The signals were visualized using LumiGLO Reserve chemiluminescence substrate kit (KPL, Gaithersburg, MD, USA) and recorded by densitometry (Light‐Capture, ATTO, Tokyo, Japan). Anti‐β‐actin antibodies were used for the internal control. To compare the levels of proteins, the density of each signal was evaluated by image analysis software (CS Analyzer, ATTO).
Real‐time Quantitative Reverse Transcription Polymerase Chain Reaction
Total RNA was extracted from COS‐1 cells 48 h after transfection with each plasmid. RNA was extracted using a kit (RNeasy Plus Mini Kit; QIAGEN, Valencia, CA, USA) according to the manufacturer’s instructions. Total RNA was reverse‐transcribed using iScript Select cDNA Synthesis Kit (Bio‐Rad Laboratories, Hercules, CA, USA). Expression of hIAPP and rIAPP mRNA were determined by the real‐time quantitive reverse transcription polymerase chain reaction (RT–PCR) technique using the TaqMan system (ABI Prism 7000; Life Technologies Japan) as per the manufacturer’s instructions. The probe and primer sets of hIAPP (Assay ID Hs00169095_m1) and rIAPP (Assay ID Rn00561411_m1) were purchased from Life Technologies Japan. pMT2‐rIAPP plasmid and pMT2‐hIAPP plasmid were used as standard samples, respectively. Samples were run in triplicate.
Electron Microscopy
Transmission electron microscopy was carried out with some modifications, as described previously18. Briefly, 48 h after transfection, COS‐1 cells were fixed in phosphate buffer (pH 7.4) containing 2.5% (v/v) glutaraldehyde and 2% (v/v) paraformaldehyde at an ambient temperature for 60 min. After postfixing with the fixative solution containing 1% (w/v) osmium tetroxide and 1.5% (w/v) potassium ferrocyanide for 1 h, the cells were dehydrated with 50–100% (v/v) ethanol and stained en bloc with 0.5% (w/v) uranyl acetate. The cells were then embedded in Quetol 812 (Nisshin EM, Tokyo, Japan) and polymerized, after which they were sectioned and stained with uranyl acetate and lead citrate. The cells were observed and photographed using a transmission electron microscope (JEM1220, Japan Electron Optics Laboratories, Tokyo, Japan).
Chemical Modulation of Autophagy
First, cell viability assay and western blot analysis of LC3 were carried out after treatment with rapamycin, an inducer of autophagy, or 3‐MA, an inhibitor of autophagy in COS‐1 cells. The cells were transfected with hIAPP or rIAPP plasmid 96 h before MTT assays. The cells were transfected with the hIAPP and rIAPP plasmids 48 h before LC3 western blot analysis. Next, we investigated the induction of apoptosis after chemical modulation, detecting annexin positive cells by flow cytometry, as described later. Annexin positive cells in GFP positive COS‐1 or MIN‐6 cells were analyzed 48 h after transfection with hIAPP‐ or rIAPP‐IRES‐GFP plasmid. In each experiment, 1 h after transfection, cells were washed with PBS and cultured in medium including rapamycin or 3‐MA for 24 h. Data were expressed by percentage of untreated cells. All data were adjusted by rIAPP in each condition.
Flow Cytometry
We used PE Annexin V Apoptosis Detection Kit (BD Biosciences, Franklin Lakes, NJ, USA) for staining the cells as per manufacturer’s instructions. Flow cytometry was carried out using a FACSCalibur (BD Biosciences) with Cell Quest Software (BD biosciences).
RNA Interference
The nucleotide small interfering the autophagy protein 5 (ATG5) RNA duplexes for monkeys (siRNA ID s18158) and non‐silencing RNA duplexes as the control were purchased from Life Technologies Japan. The ATG5‐specific small interfering RNA (siRNA) or non‐silencing RNA constructs were co‐transfected with hIAPP or rIAPP plasmid into the COS‐1 cells using siPORT NeoFX Transfection Agent (Life Technologies Japan) as per the manufacturer’s instructions.
Statistical Analysis
Data are given as means ± SEM for the number of experiments shown. Differences between means were evaluated using either the paired Student’s t‐test or one‐way anova. A P‐value of <0.05 was considered statistically significant.
Results
Expression of hIAPP and rIAPP
Using immnostaining methods, both human and rat IAPP were equally detected by anti‐IAPP antibodies (Figure 1a). In contrast, IAPP was not detected in vehicle‐transfected cells (Figure 1a). Expression levels of hIAPP and rIAPP mRNA were also analyzed by real‐time quantitive RT–PCR and were detected at comparable levels (data not shown). Expression levels of GFP positive cells per total cells showed no difference between rIAPP‐GFP‐ and hIAPP‐GFP‐transfected COS‐1 or MIN‐6 cells as analyzed by flow cytometry (rIAPP vs hIAPP; 11.9 ± 3.16 vs 17.5 ± 3.78% in COS‐1 cells, 1.23 ± 0.110 vs 1.32 ± 0.528% in MIN‐6 cells, n = 3, respectively).
Figure 1.
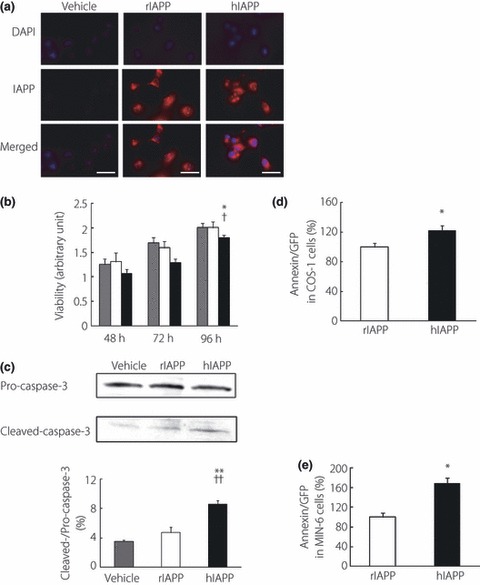
(a) Immunostaining of COS‐1 cells 48 h after transfection with pMT2 vector (vehicle), pMT2‐rat islet amyloid polypeptide (rIAPP) and pMT2‐human islet amyloid polypeptide (hIAPP) by anti‐IAPP antibodies. Nuclei were labeled with DAPI. Bar, 50 μm. (b) Modified 3‐(4, 5‐dimethylthiazolyl‐2)‐2, 5‐diphenyltetrazolium bromide (MTT) assays of COS‐1 cells transfected with vehicle (gray bars), rIAPP (white bars) and hIAPP (black bars). Composite histogram profiles represent the ratios of absorbance units of live cells to those 24 h after transfection with designated plasmids (n = 17). *P < 0.05 vs vehicle, †P < 0.05 vs rIAPP. (c) Representative western blot of pro‐ and cleaved‐caspase‐3 of cell lysates 48 h after transfection of each plasmid. The intensity ratios of cleaved‐ to pro‐caspase‐3 are shown. All values represent the mean ± SEM (n = 3). **P < 0.01 vs vehicle, ††P < 0.01 vs rIAPP. (d,e) Annexin positive cells per green fluorescent protein (GFP) positive cell 96 h after transfection of hIAPP‐ or rIAPP‐GFP plasmid in (d) COS‐1 or (e) MIN‐6 cells as analyzed by flow cytometry. All values represent the mean ± SEM (n = 4, respectively). *P < 0.05 vs rIAPP.
COS‐1 and MIN‐6 Cell Apoptosis and hIAPP
We tested the viability of COS‐1 cells using a modified MTT assay 48, 72 and 96 h after transfection of each plasmid. A significant reduction of cell viability was found in hIAPP‐expressing cells as compared with vehicle or rIAPP‐expressing cells 96 h after transfection (Figure 1b). In addition, the intensity ratio of cleaved‐ to pro‐caspase‐3 was elevated in COS‐1 cell lysates expressing hIAPP (Figure 1c). Using flow cytometry, we also detected increased relative annexin positive cells per GFP positive cells in hIAPP‐GFP‐transfected both COS‐1 and MIN‐6 cells (Figure 1d,e). These findings showed that exogenous hIAPP expressions were associated with COS‐1 and MIN‐6 cell apoptosis.
Autophagy and hIAPP
To detect the formation of autophagosomes, we carried out an electron microscopic analysis in COS‐1 cells 48 h after hIAPP or rIAPP plasmid transfection. A large number of autophagosomes, which were recognized as double‐membrane vacuolar structures containing visible cytoplasmic contents, appeared in hIAPP‐transfected cells (Figure 2a,b), whereas there were few autophagosomes in rIAPP‐transfected cells (Figure 2c). Autophagosomes in hIAPP‐transfected cells outnumbered those in rIAPP‐transfected cells (Figure 2d). In COS‐1 cell lysates expressing hIAPP, the conversion of soluble LC3‐I to lipid bound LC3‐II, which accompanies the formation of autophagosomes, was also confirmed by western blot analysis (Figure 2e). These results showed that hIAPP expression drives autophagy in COS‐1 cells.
Figure 2.
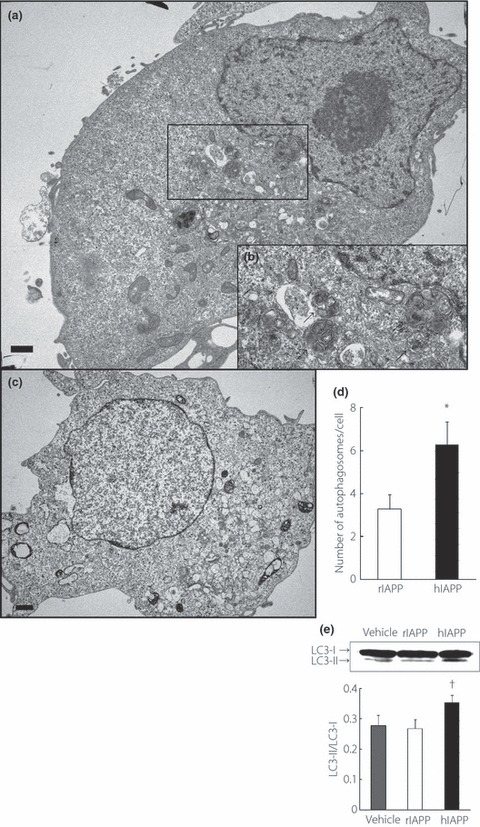
Electron micrographs of COS‐1 cells 48 h after transfection of (a,b) hIAPP or (c) rIAPP plasmid. Panel (b) is high magnification images of panel (a). Bar, 1.0 μm. (b) Typical autophagosomes are shown (arrows). (d) Number of autophagosomes per cell in rIAPP‐ or hIAPP‐transfected COS‐1 cells. All values represent the mean ± SEM (n = 15, respectively). *P < 0.05 vs rat islet amyloid polypeptide (rIAPP). (e) Western blot analysis of light chain 3B (LC3). The intensity ratios of LC3‐II to LC3‐I are shown. All values represent the mean ± SEM (n = 7). †P < 0.05 vs rIAPP.
Effect of Chemical Modulation of Autophagy on Viability and Apoptosis in hIAPP Expressing COS‐1 and MIN‐6 Cells
To determine the effects of autophagy on hIAPP‐induced cytotoxicity, we modulated autophagy by treatment with rapamycin, an inducer, and 3‐MA, an inhibitor of autophagy. First, we measured the relative viability of cells transfected with hIAPP or rIAPP. 3‐MA decreased and rapamycin increased relative cell viability, respectively (Figure 3a,b). In both experiments, modulation of autophagy was confirmed by the conversion of LC3‐I to LC3‐II, whereby 3‐MA decreased and rapamycin increased LC3‐II levels, respectively (Figure 3c,d). Next, we compared the relative annexin positive cells in hIAPP‐GFP positive COS‐1 and MIN‐6 cells. Rapamycin (100 nmol/L) decreased annexin positive cells in MIN‐6 cells and 3‐MA (0.5 mmol/L) increased annexin positive cells in both COS‐1 and MIN‐6 cells (Figure 3e). These results show that modulation of autophagy affects the viability of hIAPP expressing COS‐1 cells, and also apoptosis of both COS‐1 and MIN‐6 cells that express hIAPP.
Figure 3.
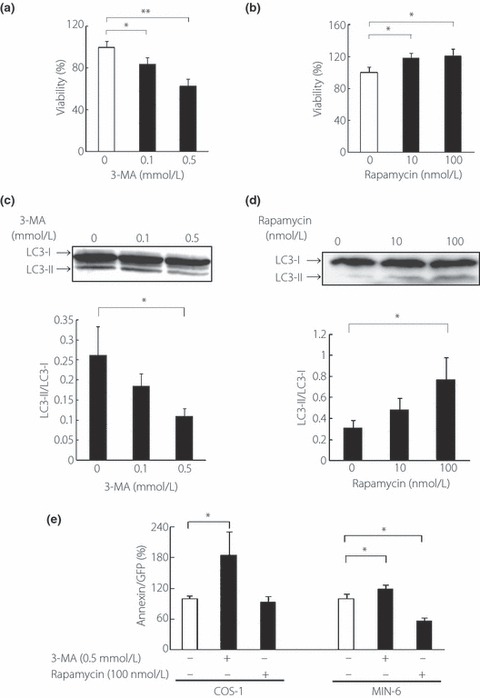
(a,c) Cell viability expressing human islet amyloid polypeptide (hIAPP) after treatment with 3‐MA or rapamycin in COS‐1 cells (percentage of untreated cells). All values represent the mean ± SEM (n = 7, respectively). (b,d) Western blot analysis of light chain 3B (LC3) in hIAPP expressing COS‐1 cells. The intensity ratios of LC3‐II to LC3‐I are shown. All values represent the mean ± SEM (n = 4, respectively). (e) Annexin positive cells per green fluorescent protein positive cells after the treatment with 3‐MA or rapamycin in COS‐1 or MIN‐6 cells as analyzed by flow cytometry (percent of untreated conditions). All values represent the mean ± SEM (n = 4, respectively). *P < 0.05, **P < 0.01 for the differences between the indicated groups.
Effect of RNA Interference of ATG5 Gene
To determine the effects of autophagy on hIAPP‐associated cytotoxicity, we reduced the induction of autophagy by knocking down the ATG5 gene. The transient transfection of ATG5 siRNA reduced the protein level of ATG5 and significantly reduced LC3 conversion in hIAPP‐transfected COS‐1 cells (Figure 4a,b). Relative viabilities of hIAPP‐ to rIAPP‐transfected cells were greater in non‐silencing RNA than ATG5 siRNA (80.0 ± 2.30 vs 64.8 ± 4.60%, P < 0.05, n = 24, Figure 4c). These data show that downregulation of ATG5 decreases the viability of the COS‐1 cells that express hIAPP.
Figure 4.
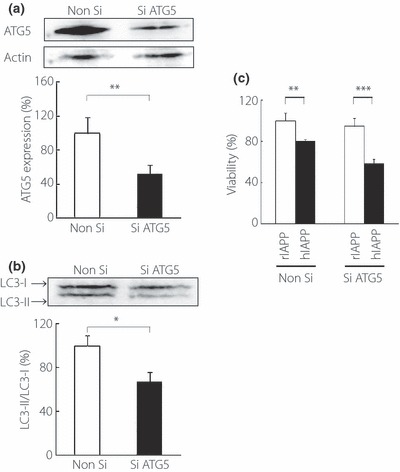
Knockdown of ATG5 gene in rIAPP‐ or hIAPP‐transfected COS‐1 cells. (a) ATG5 protein expression in COS‐1 cells co‐transfected with hIAPP and either ATG5 siRNA (Si ATG5) or non‐silencing RNA (Non Si) was analyzed by western blot with anti‐ATG5 antibodies 48 h after transfection (n = 5). (b) Cell viability 96 h after co‐transfection with each plasmid and siRNA (n = 24). (c) Western bolt analysis of light chain 3B (LC3) 48 h after co‐transfection with siRNA and hIAPP plasmid (n = 3). All values represent the mean ± SEM. *P < 0.05, **P < 0.01, ***P < 0.001 for the differences between the indicated groups. hIAPP, human islet amyloid polypeptide; rIAPP, rat islet amyloid polypeptide.
Discussion
In previous studies of Japanese families, we reported that patients who have missense mutation (S20G) of the hIAPP gene showed a relatively early onset and rapid development of insulin‐requiring diabetes6. The mutant hIAPP was shown to exhibit greater and more rapid amyloidogenicity than wild‐type hIAPP by the thioflavin T binding assay10. The relative amyloidogenicity of mutant and wild‐type hIAPP were also well correlated with their cytotoxicity in COS‐1 cells10. These data provide genetic evidence of a role for hIAPP in the pathogenesis of T2D, likely through affecting β‐cell function and viability. In the current study, we wished to evaluate whether autophagy plays a role in hIAPP‐mediated apoptosis. We first used COS‐1 cells, because endogenous mouse IAPP has been reported to inhibit formation of fibrils from exogenous hIAPP in the mouse islet19. Next, we used the mouse β‐cell line MIN‐6 cells to confirm the effect of autophagy with cells that possess a regulated secretary pathway.
The association between islet amyloid fibril formation and autophagy has not been pursued with the same intensity as compared with amyloidogenesis in Alzheimer’s disease. Autophagy is induced in the brains of Alzheimer’s disease model mice, which leads to the accumulation of A‐β‐containing autophagic vacuoles at early stages of that disease12. Similar to studies of Alzheimer’s disease20, we first showed the induction of autophagy in hIAPP‐expressing COS‐1 cells by confirming the presence of autophagosomes and the conversion of LC3‐I to LC3‐II. Though the mechanisms are unknown, these findings might suggest that there exists an association between the expression of hIAPP, which has amyloidogenicity, and induction of autophagy.
For the studies using chemical modulation of autophagy, we employed a flow cytometry system with the use of the bicistronic vector expressing GFP and hIAPP or rIAPP to allow sensitive detection of annexin positive, apoptotic cells to compensate for the relatively low transfection efficiency of MIN‐6 cells. When COS‐1 cell expressing hIAPP were treated with 3‐MA, cell viability was reduced (Figure 3a) and apoptosis was induced (Figure 3e, left panel). Next, we confirmed the cell protective effects of autophagy by examining cell viability and apoptosis after the treatment with rapamycin. The cell viability of COS‐1 cells expressing hIAPP was significantly enhanced by rapamycin treatment (Figure 3b), though the induction of apoptosis was not decreased (Figure 3e, left panel), suggesting rapamycin might decrease a negative effect of hIAPP expression on cellular proliferation. In contrast, we detected the induction and inhibition of apoptosis by 3‐MA and rapamycin treatments, respectively in MIN‐6 cells (Figure 3e, right panel). These data suggest that in MIN‐6 cells, apoptosis is dominant over cell proliferation in determining the relative cell viability.
However, the results of experiments in which 3‐MA is used as an autophagic inhibitor should be evaluated cautiously, because this reagent can affect other signaling pathways, including class I phosphatidylinositol 3‐kinase, c‐Jun N‐terminal kinase and mitogen‐activated protein kinase21. Thus, to confirm the effect of autophagy on hIAPP‐associated cytotoxicity, we also detected the deterioration of cell viability under the condition of downregulating ATG5 expression, which is required for autophagosome formation22. Although in this system we did not directly detect the apoptosis, these results support the concept that induction of autophagy might prevent or ameliorate β‐cell dysfunction acquired by hIAPP‐mediated amyloidogenesis or through excess accumulation of ubiquitinated proteins and/or damaged organelles, that may occur from the stress through the excess demand for β‐cells induced by insulin resistance15–17,23
Although we have shown the protective effect of autophagy against hIAPP‐associated apoptosis, the present study should be interpreted carefully, because it has been mainly carried out using COS‐1 cells derived from SV40‐transformed monkey kidney cells, rather than β‐cells or islets. In addition, to deal with the low transfection efficiency of MIN‐6 cells, we used COS‐1 cells to avoid the potential confounding influence of the amelioration of hIAPP‐associated apoptosis by endogenous mouse IAPP19. Accordingly, despite its limitations, we have shown the annexin detection assay by using MIN‐6 and COS‐1 cells, with which the results were consistent with those of the cell viability assay in COS‐1 cells (Figure 1b,d,e). Elucidation of the effects of autophagy on hIAPP transgenic mouse islets and/or human β‐cell lines expressing hIAPP awaits further investigation.
In conclusion, we have shown the protective potential of autophagy for hIAPP‐mediated apoptosis. Although the present study is limited to in vitro studies, it suggests that similar mechanisms might control autophagy in human β‐cells undergoing hIAPP‐mediated cellular dysfunction. The data also suggest that interventions directed at controlling autophagy might have the therapeutic potential to preserve β‐cell function and prevent type 2 diabetes in humans.
Acknowledgements
We thank Michiya Inagaki, Ai Suzuki, Akihiko Kimura and Yoshito Ihara for excellent technical support. There is no conflict of interest in all the authors listed.
References
- 1.Westermark P, Wernstedt C, Wilander E, et al. Amyloid fibrils in human insulinoma and islets of Langerhans of the diabetic cat are derived from a neuropeptide‐like protein also present in normal islet cells. Proc Natl Acad Sci USA 1987; 84: 3881–3885 [DOI] [PMC free article] [PubMed] [Google Scholar]
- 2.Cooper GJ, Willis AC, Clark A, et al. Purification and characterization of a peptide from amyloid‐rich pancreases of type 2 diabetic patients. Proc Natl Acad Sci USA 1987; 84: 8628–8632 [DOI] [PMC free article] [PubMed] [Google Scholar]
- 3.Butler AE, Janson J, Bonner‐Weir S, et al. Beta‐cell deficit and increased beta‐cell apoptosis in humans with type 2 diabetes. Diabetes 2003; 52: 102–110 [DOI] [PubMed] [Google Scholar]
- 4.Sanke T, Bell GI, Sample C, et al. An islet amyloid peptide is derived from an 89‐amino acid precursor by proteolytic processing. J Biol Chem 1988; 263: 17243–17246 [PubMed] [Google Scholar]
- 5.Nishi M, Sanke T, Seino S, et al. Human islet amyloid polypeptide gene: complete nucleotide sequence, chromosomal localization, and evolutionary history. Mol Endocrinol 1989; 3: 1775–1781 [DOI] [PubMed] [Google Scholar]
- 6.Sakagashira S, Sanke T, Hanabusa T, et al. Missense mutation of amylin gene (S20G) in Japanese NIDDM patients. Diabetes 1996; 45: 1279–1281 [DOI] [PubMed] [Google Scholar]
- 7.Westermark P, Wilander E. The influence of amyloid deposits on the islet volume in maturity onset diabetes mellitus. Diabetologia 1978; 15: 417–421 [DOI] [PubMed] [Google Scholar]
- 8.Hiddinga HJ, Eberhardt NL. Intracellular amyloidogenesis by human islet amyloid polypeptide induces apoptosis in COS‐1 cells. Am J Pathol 1999; 154: 1077–1088 [DOI] [PMC free article] [PubMed] [Google Scholar]
- 9.O’Brien TD, Butler PC, Kreutter DK, et al. Human islet amyloid polypeptide expression in COS‐1 cells. A model of intracellular amyloidogenesis. Am J Pathol 1995; 147: 609–616 [PMC free article] [PubMed] [Google Scholar]
- 10.Sakagashira S, Hiddinga HJ, Tateishi K, et al. S20G mutant amylin exhibits increased in vitro amyloidogenicity and increased intracellular cytotoxicity compared to wild‐type amylin. Am J Pathol 2000; 157: 2101–2109 [DOI] [PMC free article] [PubMed] [Google Scholar]
- 11.Levine B, Klionsky DJ. Development by self‐digestion: molecular mechanisms and biological functions of autophagy. Dev Cell 2004; 6: 463–477 [DOI] [PubMed] [Google Scholar]
- 12.Rubinsztein DC, DiFiglia M, Heintz N, et al. Autophagy and its possible roles in nervous system diseases, damage and repair. Autophagy 2005; 1: 11–22 [DOI] [PubMed] [Google Scholar]
- 13.Kroemer G, Levine B. Autophagic cell death: the story of a misnomer. Nat Rev Mol Cell Biol 2008; 9: 1004–1010 [DOI] [PMC free article] [PubMed] [Google Scholar]
- 14.Gosselin K, Deruy E, Martien S, et al. Senescent keratinocytes die by autophagic programmed cell death. Am J Pathol 2009; 174: 423–435 [DOI] [PMC free article] [PubMed] [Google Scholar]
- 15.Choi SE, Lee SM, Lee YJ, et al. Protective role of autophagy in palmitate‐induced INS‐1 beta‐cell death. Endocrinology 2009; 150: 126–134 [DOI] [PubMed] [Google Scholar]
- 16.Ebato C, Uchida T, Arakawa M, et al. Autophagy is important in islet homeostasis and compensatory increase of beta cell mass in response to high‐fat diet. Cell Metab 2008; 8: 325–332 [DOI] [PubMed] [Google Scholar]
- 17.Fujitani Y, Kawamori R, Watada H. The role of autophagy in pancreatic beta‐cell and diabetes. Autophagy 2009; 5: 280–282 [DOI] [PubMed] [Google Scholar]
- 18.Kimura A, Ishida Y, Wada T, et al. The absence of interleukin‐6 enhanced arsenite‐induced renal injury by promoting autophagy of tubular epithelial cells with aberrant extracellular signal‐regulated kinase activation. Am J Pathol 2010; 176: 40–50 [DOI] [PMC free article] [PubMed] [Google Scholar]
- 19.Westermark GT, Gebre‐Medhin S, Steiner DF, et al. Islet amyloid development in a mouse strain lacking endogenous islet amyloid polypeptide (IAPP) but expressing human IAPP. Mol Med 2000; 6: 998–1007 [PMC free article] [PubMed] [Google Scholar]
- 20.Nixon RA. Autophagy, amyloidogenesis and Alzheimer disease. J Cell Sci 2007; 120: 4081–4091 [DOI] [PubMed] [Google Scholar]
- 21.Tasdemir E, Galluzzi L, Maiuri MC, et al. Methods for assessing autophagy and autophagic cell death. Methods Mol Biol 2008; 445: 29–76 [DOI] [PubMed] [Google Scholar]
- 22.Kuma A, Hatano M, Matsui M, et al. The role of autophagy during the early neonatal starvation period. Nature 2004; 432: 1032–1036 [DOI] [PubMed] [Google Scholar]
- 23.Hartley T, Brumell J, Volchuk A. Emerging roles for the ubiquitin‐proteasome system and autophagy in pancreatic beta‐cells. Am J Physiol Endocrinol Metab 2009; 296: E1–E10 [DOI] [PubMed] [Google Scholar]