Abstract
Acute myeloid leukemia and myelodysplastic syndrome with inv(3)(q21q26.2)/t(3;3)(q21;q26.2) have a poor prognosis. Indeed, the inv(3)(q21q26.2)/t(3;3)(q21;q26.2) has been recognized as a poor risk karyotype in the revised International Prognostic Scoring System. However, inv(3)(q21q26.2)/t(3;3)(q21;q26.2) is not among the cytogenetic abnormalities pathognomonic for diagnosis of acute myeloid leukemia irrespective of blast percentage in the 2008 WHO classification. This multicenter study evaluated the clinico-pathological features of acute myeloid leukemia/myelodysplastic syndrome patients with inv(3)(q21q26.2)/t(3;3)(q21;q26.2) and applied the revised International Prognostic Scoring System to myelodysplastic syndrome patients with inv(3)(q21q26.2)/t(3;3)(q21;q26.2). A total of 103 inv(3)(q21q26.2)/t(3;3)(q21;q26.2) patients were reviewed and had a median bone marrow blast count of 4% in myelodysplastic syndrome (n=40) and 52% in acute myeloid leukemia (n=63) (P<0.001). Ninety-one percent of patients showed characteristic dysmegakaryopoiesis. There was no difference in overall survival between acute myeloid leukemia and myelodysplastic syndrome patients with inv(3)(q21q26.2)/t(3;3)(q21;q26.2) (12.9 vs. 7.9 months; P=0.16). Eighty-three percent of patients died (median follow up 7.9 months). Complex karyotype, monosomal karyotype and dysgranulopoiesis (but not blast percentage) were independent poor prognostic factors in the entire cohort on multivariable analysis. The revised International Prognostic Scoring System better reflected overall survival of inv(3)(q21q26.2)/t(3;3)(q21;q26.2) than the International Prognostic Scoring System but did not fully reflect the generally dismal prognosis. Our data support consideration of myelodysplastic syndrome with inv(3)(q21q26.2)/t(3;3)(q21;q26.2) as an acute myeloid leukemia with recurrent genetic abnormalities, irrespective of blast percentage.
Introduction
Acute myeloid leukemia (AML) with inv(3)(q21q26.2)/t(3;3)(q21;q26.2) [inv(3)/t(3;3)] is a distinct subtype of AML with recurrent genetic abnormalities in the 2008 WHO classification, comprising 1–2.5% of all AML cases.1–5 However, AML with inv(3)/t(3;3) is not considered as a subgroup of AML irrespective of blast percentage. Myelodysplastic syndrome (MDS) with inv(3)/t(3;3) is also a rare aggressive disorder which occurs in less than 1% of all MDS cases and has a high risk of progression to AML.2,6,7 The inv(3)/t(3;3) can occur rarely in other myeloid neoplasms, such as myeloproliferative neoplasms (MPN) including chronic myelogenous leukemia (CML), mostly during accelerated phase or in blast crisis, and overlap MDS/MPNs including chronic myelomonocytic leukemia. AML with inv(3)/t(3;3) is commonly refractory to conventional chemotherapy and has poor prognosis. Similarly, the prognosis of MDS with inv(3)/t(3;3) is also poor.5,8,9 Indeed, the revised International Prognostic Scoring System (IPSS-R) for MDS includes inv(3)/t(3;3) among its poor risk cytogenetic abnormalities.10,11
Inv(3)/t(3;3) abnormalities involve EVI1 and MDS1 at chromosome 3q26 and RPN1, GATA2 and other genes at chromosome 3q21.5,6,12 EVI1/RPN1 fusion or a longer variant MDS1/EVI1 transcript lead to overexpression of EVI1 and/or GATA2. Recent single nucleotide polymorphism microarray, sequencing and fluorescence in situ hybridization analyses revealed the molecular heterogeneity of EVI1 gene rearrangements including cryptic rearrangement with a variety of partner chromosomes or genes and several splicing variants.6,7,12–14 Dysregulation of EVI1 plays an important role in stem cell self-renewal and leukemogenesis. Overexpression of EVI1 promotes myeloid cell proliferation and impairment of differentiation, and may be related to the adverse prognosis of myeloid neoplasms with inv(3)/t(3;3).4,5,13,15,16 Aberrant expression of EVI1 mainly as a consequence of EVI1 gene rearrangement has been reported in previous studies. Lugthart et al.5 reported aberrant expression of EVI1 in 95% (54 of 57) of inv(3)/t(3;3) AML patients. Other studies showed a similarly high expression of EVI1 from 91% to 100% in inv3/t(3;3) AML and MDS patients.4,8,12,14,17 However, overexpression of EVI1 was reported in 5–10% of de novo AML patients.8,12
In vivo studies and rare case reports involving complications of gene therapy demonstrated that overexpression of EVI1 caused extensive myeloid proliferation and myelodysplasia.15,16,18–22 Transgenic mouse models have confirmed the important role of EVI1 in leukemogenesis, as well as the requirement for collaborating factors.18,19
Since inv(3)/t(3;3) in AML and MDS is very rare, only a few small series have reported the clinical and pathological features of AML and MDS with inv(3)/t(3;3) patients. Furthermore, there are only limited data on the application of IPSS-R in inv(3)/t(3;3) MDS patients. The objective of this multicenter study was to characterize the clinico-pathological characteristics of a large series of inv(3)/t(3;3) MDS and AML patients in order to compare the features of AML and MDS with this genetic abnormality and to evaluate the performance of current prognostic schemes in inv(3)/t(3;3) MDS patients.
Methods
This multicenter investigation was conducted after approval by the Institutional Review Board at each institution and in accordance with the Declaration of Helsinki. Patients with a pathological diagnosis of de novo or therapy-related MDS and AML, with initial demonstration of inv(3)/t(3;3) by conventional karyotyping in bone marrow (BM), and available clinical follow up were included. Patients with a prior history or diagnosis of any MPNs or overlapping MDS/MPNs were not included in this study. Patients who had unknown previous karyotype at initial diagnosis of AML and MDS prior to inv(3)/t(3;3) diagnosis were also excluded. Therapy-related AML and MDS patients included patients who had received prior chemotherapy and/or radiation therapy for non-myeloid neoplasms. A total of 103 patients from 8 medical centers who met the inclusion criteria were selected for analysis.
Data collection
The medical records were reviewed for clinical features including age, gender, date of diagnosis, presence of hepatosplenomegaly at the time of diagnosis of inv(3)/t(3;3), type of therapy, length of follow up since initial diagnosis of inv(3)/t(3;3) and duration of transformation to AML in inv(3)/t(3;3) MDS. Length of follow up was measured from the day of the diagnostic BM biopsy with inv(3)/t(3;3) to the expiration date or the most recent follow up date in living patients. Type of therapy in inv(3)/t(3;3) patients was divided into 3 subgroups including chemotherapy alone (high- and low-intensity), chemotherapy with allogeneic stem cell transplant (SCT), and supportive therapy (Online Supplementary Table S1). Data for complete remission status were not collected in these cases. Laboratory findings recorded were WBC (×109/L), hemoglobin (Hb, g/dL), MCV (fL), platelet count (×109/L), and absolute neutrophil counts (ANC, ×109/L). The bone marrow (BM) findings include blast percentage (%), cellularity, presence or absence of dysplasia in each cell line, and any evolution to AML in MDS patients. AML evolution was defined as the occurrence of equal to or greater than 20% blasts in BM or blood after an initial diagnosis of MDS. Dysmegakaryopoiesis, dyserythropoiesis and dysgranulopoiesis were considered to be present when dysplasia was present in over 10% of cells in the specific cell lineage. AML and MDS cases were classified by the WHO classification.1 Inv(3)/t(3;3) MDS patients were further analyzed by the IPSS and IPSS-R systems to compare their prognostic significance.11,23 All pathological features were derived from institution-specific expert review.
Conventional cytogenetic analysis at the time of diagnosis was performed at participating institutions following standard procedures. The findings were described using the International System for Human Cytogenetic Nomenclature (ISCN).24 The cytogenetic findings included any additional abnormalities in addition to inv(3)/t(3;3), and any cytogenetic evolution in subsequent karyotypes during the follow up. A monosomal karyotype is defined as two or more distinct autosomal chromosome monosomies or a single autosomal monosomy in the presence of structural abnormalities.25,26 A structurally complex karyotype is defined as a complex karyotype characterized by more than or equal to 3 chromosomal aberrations including at least one structural aberration.27 Additional molecular studies related to EVI1 gene rearrangement were not performed in these cases because it was a retrospective analysis.
Statistical analysis
The χ2 test, Fisher’s Exact test, or two-tailed t-test was performed to compare between groups. P<0.05 was considered significant. The Kaplan-Meier method was used for overall survival estimates (log rank test) from the time of initial demonstration of inv(3)/t(3;3). Cox proportional hazards (PH) regression model was used to generate hazard ratios (HR) and 95% confidence intervals (CI). Factors with P<0.05 in univariable model were considered for the multivariable Cox PH model. Complete details of the statistical method are provided in the Online Supplementary Appendix.
Results
Clinical and pathological characteristics in patients with inv(3)/t(3;3) MDS and AML
One hundred and three inv(3)/t(3;3) patients (40 MDS and 63 AML) were included in the analysis. The clinico-pathological characteristics of inv(3)/t(3;3) MDS and AML patients are summarized in Table 1. The median age at diagnosis was 57.1 years and the median follow up for the cohort was 7.9 months. Patients were slightly older in the MDS group compared to the AML group but this was not statistically significant (P=0.07). Most patients presented with cytopenias but there was no difference in Hb level or platelet count at diagnosis between MDS and AML. Sixty-eight percent of inv(3)/t(3;3) patients had a decreased platelet count and 5% had an elevated platelet count. Inv(3)/t(3;3) MDS patients had a lower WBC than inv(3)/t(3;3) AML (median 3.1 vs. 5.9×10⁹/L; P<0.001).
Table 1.
Comparison of clinical and pathological features in patients with inv(3)/t(3;3) MDS and AML (n=103).
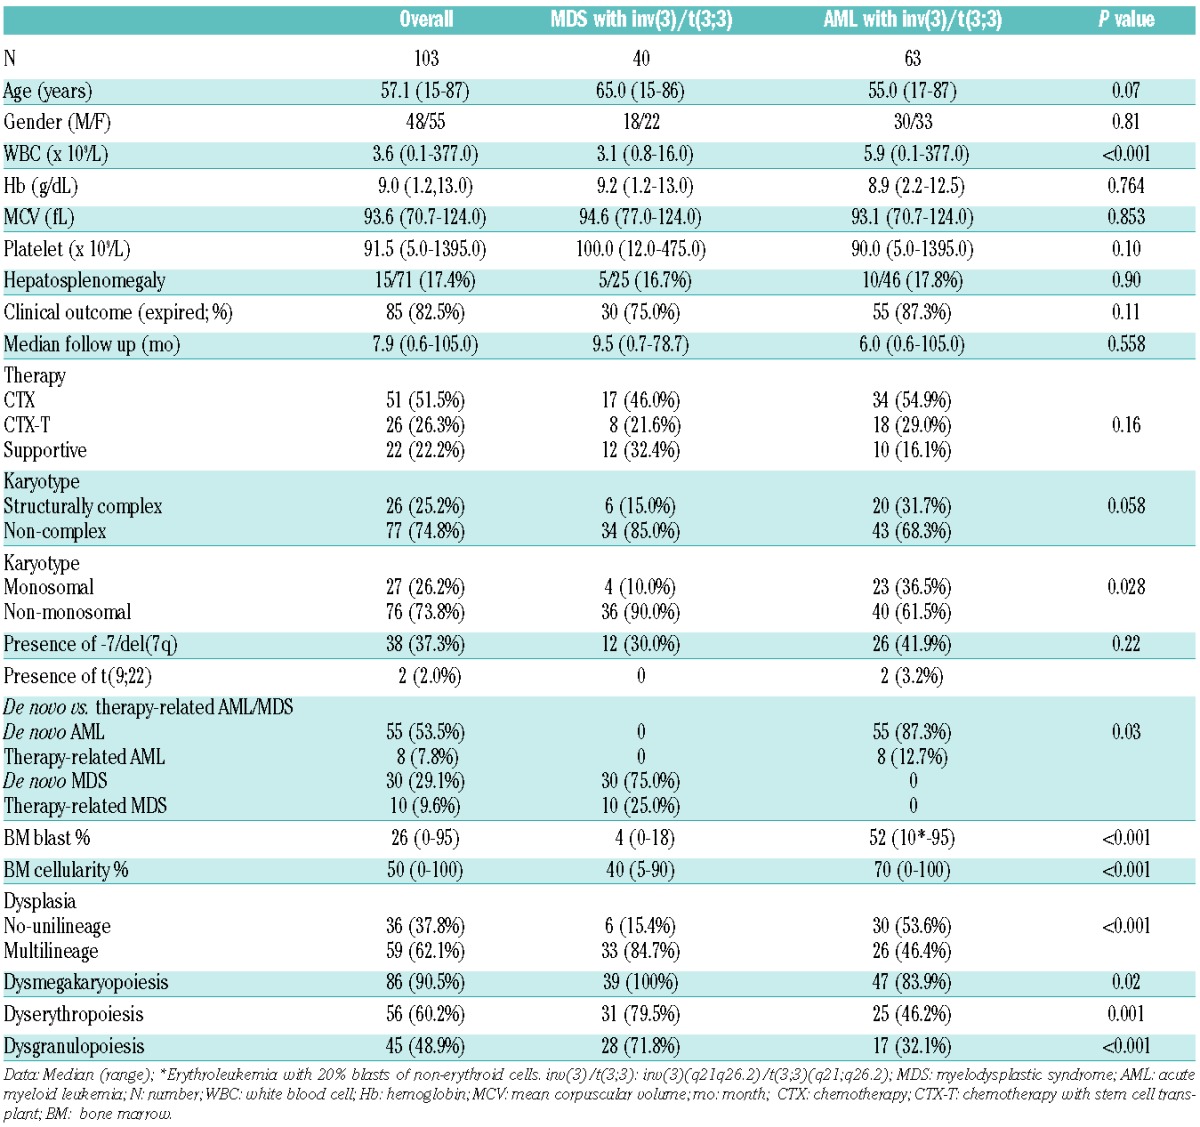
The great majority of inv(3)/t(3;3) patients had de novo MDS and AML (82.6%), while the remainder (17.4%) occurred after prior therapy for solid tumors or lymphomas. Inv(3)/t(3;3) MDS patients included 30 de novo MDS and 10 therapy-related MDS patients. These de novo MDS patients were morphologically subclassified as refractory anemia with unilineage dysplasia (n=4), refractory cytopenia with multilineage dysplasia (n=13), and refractory anemia with excess blasts (RAEB; n=13) including 4 RAEB-1 and 9 RAEB-2. Therapy-related MDS patients received previous chemotherapy related to Hodgkin or non-Hodgkin B-cell lymphomas. Inv(3)/t(3;3) AML patients included 55 de novo AML and 8 therapy-related AML patients. The de novo AML patients spanned a wide range of morphologies. Two cases could not be reevaluated due to lack of available material. The therapy-related AML patients received chemotherapy and/or radiation therapy related to various solid tumors or B-cell lymphomas.
The median BM blast percentage was 4% in inv(3)/t(3;3) MDS and 52% in inv(3)/t(3;3) AML. Among inv(3)/t(3;3) AML patients, one patient was diagnosed as acute erythroleukemia by WHO criteria with 10% total blasts but 20% blasts of the non-erythroid cells. The BM morphological features in inv(3)/t(3;3) patients are shown in Figure 1. Most inv(3)/t(3;3) patients (90.5%) showed dysmegakaryopoiesis with characteristic small unilobated or bilobated megakaryocytes. Dysgranulopoiesis (48.9%) and dyserythropoiesis (60.2%) were common in BM of inv(3)/t(3;3) MDS and AML patients. Multilineage dysplasia in two or more lineages is common in inv(3)/t(3;3) patients (62.1%).
Figure 1.
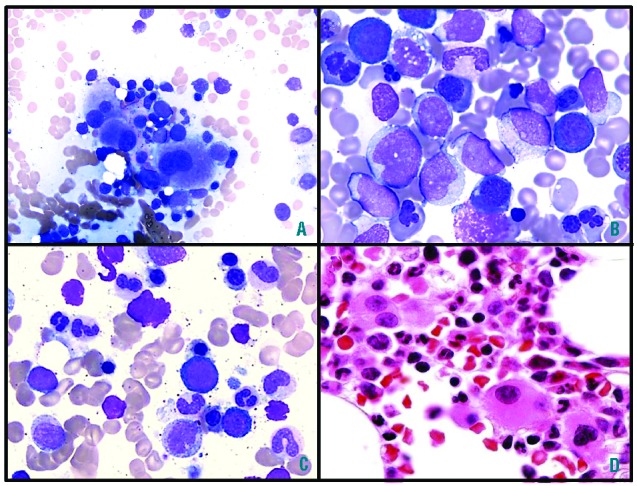
(A) Characteristic small megakaryocytes with mono-/bi-lobated nuclei, (B) prominent dyserythropoiesis and (C) prominent dysgranulopoiesis in the BM aspirate smears of MDS with inv(3)/t(3;3) patients (Wright stain, (A) ×50, (B–C) ×100). (D). Small megakaryocytes with mono-/bi-lobated nuclei in the BM core biopsy (H&E stain, ×50). BM: bone marrow, MDS: myelodysplastic syndrome.
The cytogenetic analysis showed isolated inv(3)/t(3;3) in 43.7% of patients in this group. The most frequently observed additional cytogenetic abnormality was -7/del(7q) (37.3%). Philadelphia chromosome [t(9;22)] was noted in 2 de novo patients of inv(3)/t(3;3) AML. The first patient had inv(3) in the stemline, and t(9;22) was noted as the sideline in addition to inv(3). The second patient had single abnormal clone with complex karyotype including both inv(3) and t(9;22); however, the patient had no history of CML and presented clinically as de novo AML. A complex karyotype was found in 25.2% of inv(3)/t(3;3) patients, and was more frequently found in inv(3)/t(3;3) AML patients compared to inv(3)/t(3;3) MDS, although this did not reach statistical significance (P=0.058). There was also no difference in the frequency of complex karyotype in inv(3)/t(3;3) patients with de novo and therapy-related MDS and AML (38.9% vs. 22.6%; P=0.151). A monosomal karyotype was noted in 26.2% of inv(3)/t(3;3) patients, and inv(3)/t(3;3) AML patients were more likely to have a monosomal karyotype compared to inv(3)/t(3;3) MDS (P=0.028). Additional cytogenetic abnormalities were observed in 37.3% of inv(3)/t(3;3) MDS and AML patients during follow up.
Most patients with inv(3)/t(3;3) received chemotherapy either alone (51.5%) or an allogeneic SCT in addition to chemotherapy (26.3%). The type of therapy including high- and low-intensity chemotherapy, SCT, and supportive treatment in inv(3)/t(3;3) MDS and AML patients are summarized in Online Supplementary Table S1. Inv(3)/t(3;3) AML patients received more frequently SCT and high-intensity chemotherapy than inv(3)/t(3;3) MDS patients (P=0.012 and 0.021, respectively). Thirteen of 40 (32.5%) of the inv(3)/t(3;3) MDS patients received high-intensity chemotherapy or SCT. Among them, 10 of 13 (77%) died during follow up (median 8.5 months). Eight of 13 (61.5%) inv(3)/t(3;3) MDS patients treated with high-intensity chemotherapy or SCT transformed to AML with median duration of five months from diagnosis of MDS. However, no information related to achievement of complete remission was collected in these cases, and their outcome data would provide somewhat limitation to overall survival.
Fifty-four percent of inv(3)/t(3;3) MDS patients subsequently transformed to AML with median duration of nine months from diagnosis of MDS. The clinico-pathological characteristics of inv(3)/t(3;3) MDS patients with and without transformation to AML are summarized in Online Supplementary Table S2. There is no significant difference in clinico-pathological features between the two groups.
Evaluation of overall survival
Inv(3)/t(3;3) patients had a short overall survival (OS) and poor prognosis; 82.5% of patients (75.0% of inv(3)/t(3;3) MDS and 87.3% of inv(3)/t(3;3) AML) died with median follow up of 7.9 months. Univariable and multivariable Cox PH analysis was used to determine the influence of different variables on patient’s OS (Table 2). Notably, there was no difference in OS according to AML or MDS diagnosis. However, complex karyotype, monosomal karyotype, dysgranulopoiesis, and presence of -7/del(7q) were significant predictors of short survival in univariable analysis (P<0.05). Type of therapy showed statistical significance as a prognostic factor in univariable analysis in that inv(3)/t(3;3) patients receiving chemotherapy with SCT (HR 0.52; P=0.019) had a relatively better outcome compared to patients receiving chemotherapy alone or supportive therapy.
Table 2.
Univariable and multivariable Cox PH regression models for overall survival in patients with inv(3)/t(3;3) MDS and AML (N=103).
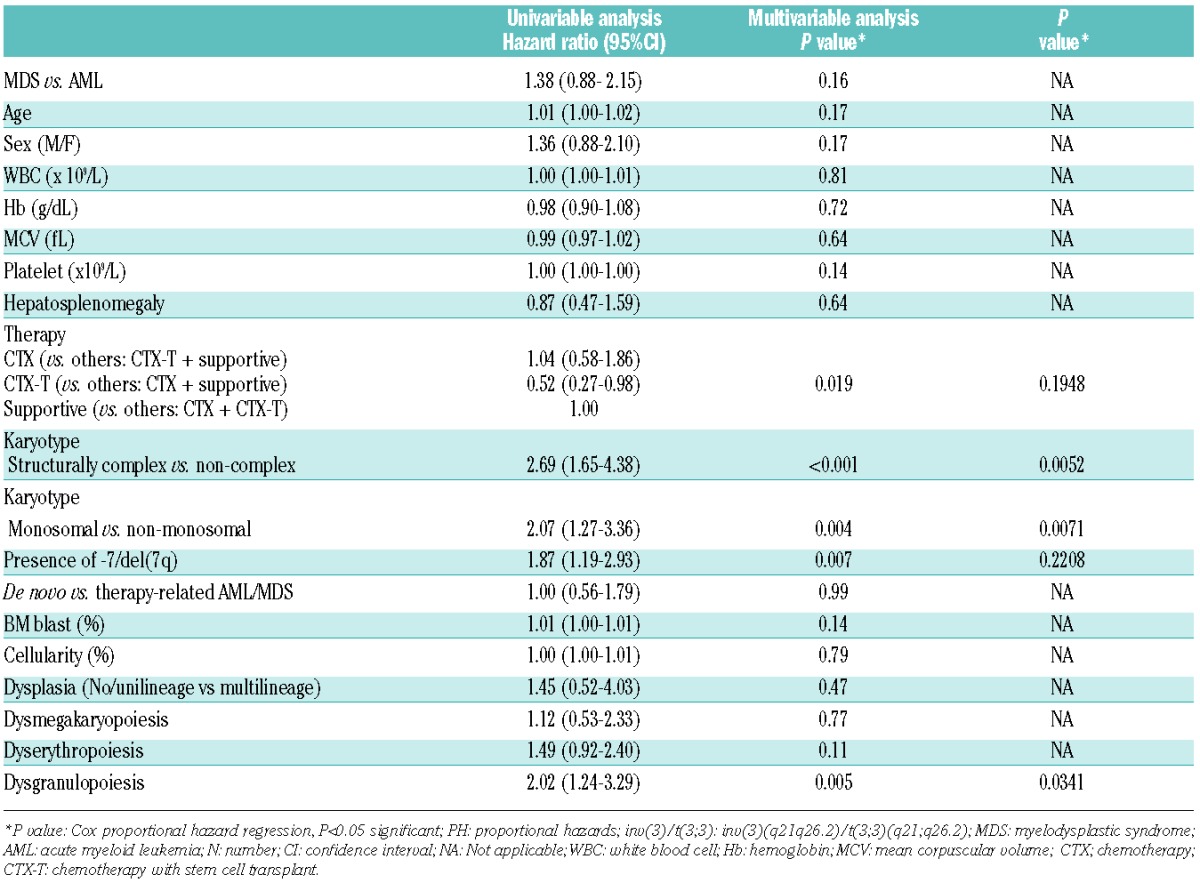
Survival curves using Kaplan-Meier analysis were used to estimate OS in inv(3)/t(3;3) patients and illustrate the Cox models (Figure 2). In the entire cohort, the median OS was ten months (n=103). Inv(3)/t(3;3) MDS and AML patients showed no significant difference in OS (12.9 vs. 7.9 months; P=0.149 log rank) (Figure 2A). There is no significant difference in OS between inv(3)/t(3;3) MDS patients with and without transformation to AML (13.0 vs. 10.0 months; P=0.727 log rank), and between inv(3)/t(3;3) MDS patients who received and did not receive high-intensity chemotherapy or SCT (10.0 vs. 7.9 months; P=0.373 log rank). De novo (82.6%) and therapy-related (17.4%) MDS and AML patients with inv(3)/t(3;3) abnormality were included in this cohort; however, there was no significant difference in OS between the two groups (9.0 vs. 11.0 months; P=0.991 log rank). Patients with complex or monosomal karyotype had shorter OS compared to patients with non-complex or non-monosomal karyotype (4.5 vs. 11.0 months; P<0.001 log rank; 6.0 vs. 11.0 months; P=0.002 log rank, respectively) (Figure 2C and D). Patients with dysgranulopoiesis showed shorter OS than those without dysgranulopoiesis (10.0 vs. 14.0 months; P=0.003 log rank). In this cohort, the patients who received chemotherapy with allogeneic SCT appeared to have a relatively better OS than patients receiving chemotherapy alone or supportive therapy (15.0, 9.0 vs. 3.2 months, respectively; P=0.029 log rank) (Figure 2B). However, in pairwise comparison between patients who received chemotherapy with allogeneic SCT and those who received either chemotherapy alone or supportive therapy, the prognostic significance of type of therapy was lost in multivariable analysis (P=0.195). Multivariable analysis showed that monosomal karyotype, complex karyotype and presence of dysgranulopoiesis were independent predictors of poor outcome in inv(3)/t(3;3) patients while type of therapy remained non-significant (P=0.93).
Figure 2.
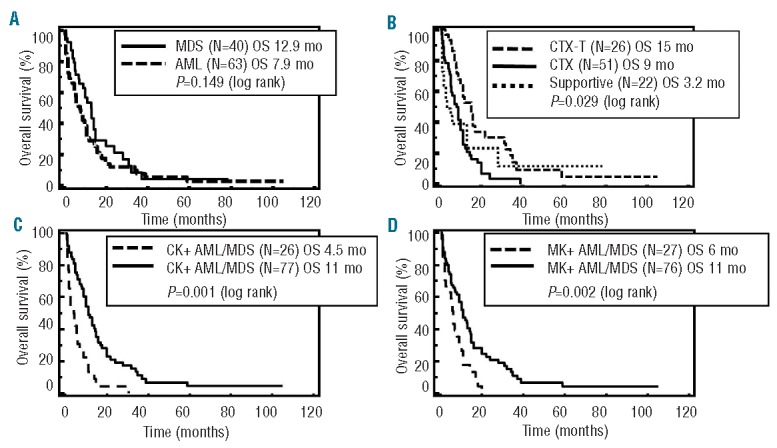
Survival curves using Kaplan-Meier analysis in 103 patients with inv(3)/t(3;3) MDS and AML. (A) OS in inv(3)/t(3;3) MDS vs. inv(3)/t(3;3) AML. (B) OS in chemotherapy with allogeneic stem cell transplant vs. chemotherapy alone vs. supportive therapy (P=0.029 log rank). (C) OS in complex vs. non-complex karyotype (P<0.001 logrank). (D) OS in monosomal vs. non-monosomal karyotype (P=0.002 log rank) inv(3)/t(3;3): inv(3)(q21q26.2)/t(3;3)(q21;q26.2). MDS: myelodysplastic syndrome; AML: acute myeloid leukemia; OS: overall survival; CTX-T: chemotherapy with stem cell transplant; CTX: chemotherapy; CK: complex karyotype; MK: monosomal karyotype.
The IPSS-R and IPSS in inv(3)/t(3;3) MDS patients (n=40)
Inv(3)/t(3;3) MDS patients presented with median ANC 1.09×10⁹/L), Hb 9.2 g/dL, and platelet count 100×109/L. Table 3 summarizes the stratification and median OS of the inv(3)/t(3;3) MDS patients according to the IPSS and IPSS-R systems. Inv(3)/t(3;3) MDS patients were classified into IPSS intermediate (Int)-1 (52.5%), Int-2 (32.5%) and high (15.0%) risk groups with a median score of 1.3, and had an expected OS of 1.2–3.5 years. Application of the IPSS-R resulted in categorization of inv(3)/t(3;3) MDS patients into low (7.5%), Int (15.0%), high (35.0%) and very high (42.5%) risk groups with a median score of 5.5, which had an expected OS of 1.6 years. Figure 3 shows the distribution of prognostic risk categories in inv(3)/t(3;3) MDS patients using the IPSS-R system compared to the IPSS. IPSS Int-2 and high-risk group patients remained in the high or very high-risk group in the IPSS-R. However, 57% (12/21) of IPSS Int-1 risk group patients (expected OS 3.5 years) were reclassified to high or very high-risk group in IPSS-R (expected OS<1.6 year). The IPSS-R scores in inv(3)/t(3;3) MDS patients were higher relative to the IPSS score by signed rank test (P<0.001). When we compared actual median OS in inv(3)/t(3;3) MDS patients with expected OS using IPSS and IPSS-R systems, 72.5% (29 of 40) and 77.5% (31 of 40) of inv(3)/t(3;3) MDS patients had shorter OS than expected OS by the IPSS-R and the IPSS scores.
Table 3.
Classification and median overall survival by IPSS and IPSS-R in inv(3)/t(3;3) MDS patients (n=40).
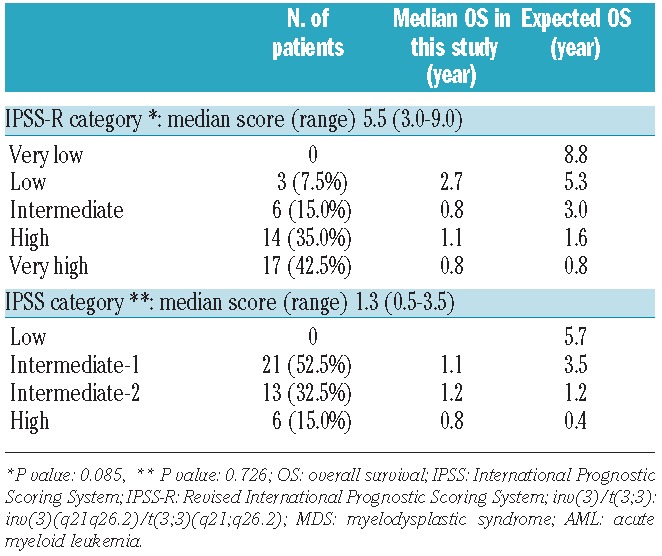
Figure 3.
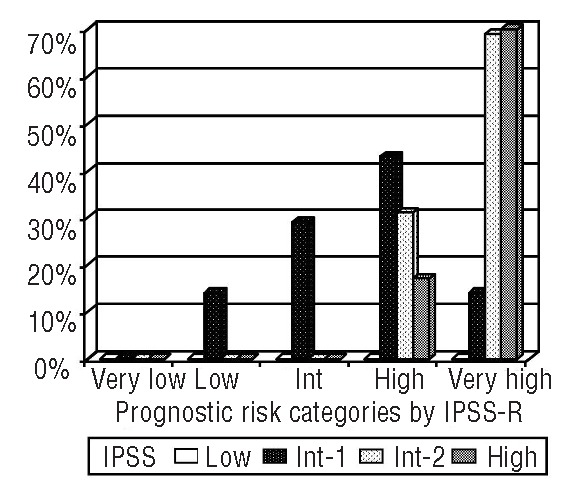
Changes of prognostic risk categories using IPSS-R compared to IPSS in 40 inv(3)/t(3;3) MDS patients. Int: intermediate; IPSS-R: the Revised International Prognostic Scoring System; IPSS: the International Prognostic Scoring System; MDS: myelodysplastic syndrome.
Discussion
Much has been learned about the pathobiology of inv(3)/t(3;3) abnormalities, which result in aberrant overexpression of the oncogenic transcription factor EVI1 by EVI1/RPN1 fusion or a longer variant MDS1/EVI1 (also called MECOM) transcript by chimeric translocation. The resulting overexpression of EVI1 promotes proliferation and impairs differentiation of myeloid cells.2,6,14,15,28–30 Animal models demonstrate that forced overexpression of EVI1 results in myeloid hyperproliferation, downregulation of genes related to myeloid differentiation, and cause a fatal disorder resembling human MDS.20,21,30,31 In humans, rare cases have been reported of myelodysplasia with monosomy 7 related to overexpression of EVI1 caused by retroviral insertional activation during gene therapy.22 Thus, the biological importance of the inv(3)/t(3;3) in the development of myeloid malignancy is known and can be used as a unifying theme for considering AML and MDS with this abnormality as a discrete entity.
Indeed, inv(3)/t(3;3) AML is included under the group of AMLs with recurrent genetic abnormalities in the 2008 WHO classification. A subset of these are recognized as AML regardless of the blast count, such as AML with t(8;21)(q22;q22), AML with inv(16)(p13.1q22) or t(16;16)(p13.1;q22), and acute promyelocytic leukemia with t(15;17)(q24.1;q21.1). The latter recurrent genetic abnormalities were considered to define AML in the original 2001 AML classification because the clinical behavior of cases with less than 20% blasts was similar to those with greater than 20% blasts.1,32,33 However, inv(3)/t(3;3) is not considered among this group of AML-defining cytogenetic abnormalities. Inv(3)/t(3;3) AML is known to have an extremely poor prognosis and has distinct clinical and pathological features. Patients often present with anemia and normal or increased platelet counts. However, 7–22% of the patients can have decreased platelet counts. Some patients may also develop hepatosplenomegaly. Pathologically, the BM in inv(3)/t(3;3) AML has characteristic small, monolobated or hypolobated megakaryocytes. Dysgranulopoiesis such as hypogranular neutrophils and pseudo-Pelger-Huet nuclear abnormalities may present in the peripheral blood or BM and inv(3)/t(3;3) cases typically demonstrate multilineage dysplasia.1–2,5,9,28 Advanced age and high initial WBC in inv(3)/t(3;3) AML patients have been reported to be associated with poor clinical outcome.3 Inv(3)/t(3;3) MDS share similar clinico-pathological features. Such cases have a poor prognosis with a short median OS, and propensity to rapidly progress to AML.1,5,6 Indeed the WHO 2008 recommends close follow up of these patients due to the aggressive clinical course and frequent development of AML. We undertook this multicenter study to collect a large number of de novo myeloid neoplasms with inv(3)/t(3;3) in order to better understand the clinical and pathological features of this disease.
As expected, the basic clinical and pathological features of our patient population were in keeping with prior series.2–5,9,34,35 Inv(3)3/t(3;3) patients were old with a median age of 57 years and had a M:F ratio of 0.87. However, inv(3)/t(3;3) patients are slightly younger than the reported average age of adult AML or MDS in general. Cytopenias were common and thrombocytosis was seen in some patients, as has been reported.5,6,9,35 Dysplastic features were common, including the characteristic dysmegakaryopoiesis. While some laboratory or pathological features (WBC, BM cellularity, BM blast percentage, degree of dysplasia) differed between MDS and AML, these can be argued to be more a consequence of the definitions used for classification than a reflection of any true biological difference between MDS and AML with inv(3)/t(3;3).
Data in this cohort demonstrated dismal prognosis (82.5% died) with a short OS (median 10 months) in inv(3)/t(3;3) MDS and AML patients. There is no significant difference in OS between inv(3)/t(3;3) MDS and AML patients, or between inv(3)/t(3;3) MDS patients with and without transformation to AML. While therapies were not uniform in this retrospective series, OS was very short and exemplified the poor outcomes that are recognized with this entity.2,4,6,14,36 Other previous studies suggested a better outcome by chemotherapy with allogeneic SCT in inv(3)/t(3;3) patients.5,6,8,14 However, chemotherapy with allogeneic SCT in this cohort lost prognostic significance in multivariable analysis. Although OS by Kaplan-Meier survival curve showed a relatively better OS (15 months) than chemotherapy alone or supportive therapy, outcome is dismal and there is no significant improvement of OS in this cohort.
From a genetic standpoint, isolated inv(3)/t(3;3) was noted in 43.7% of patients in our series and was similarly observed in both inv(3)/t(3;3) MDS and AML patients but additional abnormalities might also convey important prognostic significance. Common secondary cytogenetic abnormalities include monosomy 7, 5q abnormality, a complex karyotype in approximately one-third of the inv(3)/t(3;3) patients, and t(9;22) in some cases.1,22 Monosomy 7, in particular, is reported in approximately 40–60% of inv(3)/t(3;3) AML patients and is associated with dismal prognosis.2,6,22,37 In our series, -7/del(7q) abnormality (37.3%) was the most common additional abnormality and while this was a poor prognostic factor on univariable analysis, it did not retain statistical significance in the multivariable model. Other karyotypic features such as a structurally complex or monosomal karyotype have been reported as a strong negative prognostic indicator in overall MDS and AML.10,25–27,36,37 We found that these were also independent indicators of poor prognosis inv(3)/t(3;3) MDS and AML. Interestingly, t(9;22) was noted in 2 inv(3)/t(3;3) AML patients as secondary clonal evolution or part of complex karyotype in a de novo AML patient without history of CML. The late appearance of t(9;22) is a rare event in AML and has been closely associated with an aggressive clinical course.38
Accumulating information regarding the prognostic significance of certain cytogenetic abnormalities has led to a refinement of the cytogenetic prognostic subgroup in the IPSS-R. In this system, inv(3)/t(3;3) is assigned to the poor risk cytogenetic subgroup with a score of 3 (range 0–4).10–11 Making use of refined cytogenetic groups and a large multicenter dataset, the IPSS-R has improved stratification of MDS patients into 5 rather than 4 prognostic risk groups. However, even with such a large database, relatively few inv(3)/t(3;3) patients were included in the models. Schanz et al.10 included 12 MDS patients with 3q abnormalities (0.4%) among 2902 MDS patients and Greenberg et al.11 included 23 MDS with inv(3)/t(3;3) patients (0.3%) among 7012 MDS patients in the evaluation of the IPSS-R. We applied the IPSS-R to our inv(3)/t(3;3) MDS patients to assess the performance of prognostic impact. This study had some limitations such as small numbers of inv(3)/t(3;3) MDS patients (n=40) and different blast percentage. IPSS and IPSS-R included 20–30% blasts as MDS patients. Our cohort includes less than 20% blasts as MDS according to the WHO 2008 classification. The IPSS-R appears to be a better prognostic indicator in this cohort, reclassifying the IPSS scores of a large number of intermediate-1 risk patients with inv(3)/t(3;3) MDS patients to high or very high risk in IPSS-R. However, it appears that the IPSS-R does not adequately capture the aggressive nature of the disease in these patients and still underestimates the dismal prognosis in this group.
In conclusion, we evaluated the clinico-pathological characteristics of a large series of MDS and AML with inv(3)/t(3;3). Our data emphasized that inv(3)/t(3;3) MDS and AML patients have similar clinical and pathological characteristics with a short OS and no significant difference in OS between MDS and AML with inv(3)/t(3;3) patients. Complex karyotype, monosomal karyotype and dysgranulopoiesis were independent negative prognostic factors in MDS and AML with inv(3)/t(3;3) patients. Our MDS and AML patients with inv(3)/t(3;3) indeed showed a poor outcome regardless of blast percentage or treatment (i.e. therapy type or early treatment). These inv(3)/t(3;3) patients behave differently from other AML with t(8;21), inv(16) or t(15;17) which have a favorable prognosis. Dysregulated EVI1 caused by inv(3)/t(3;3) abnormality is considered a primary driver event playing an important role in leukemogenesis in myeloid malignancy. In addition, the presence of inv(3)/t(3;3) in MDS and AML defines a distinct and common morphology and clinical behavior. Recognition of MDS and AML with inv(3)/t(3;3) as an entity without regard to blast count further emphasizes the need to study the novel therapies, perhaps targeting EVI1 expression as a therapeutic strategy. Understanding the molecular mechanisms underlying the disease may hold the key to improvement in therapeutic outcomes. Our study contributes to the body of literature in this disease and suggests that an arbitrary blast count is not a useful way to categorize these patients and that, as is the case for other recurrent genetic abnormalities, inv(3)/t(3;3) should be considered as a single entity regardless of the blast count.
Acknowledgments
The authors thank Dr. Ali Tabarroki, Taussig Cancer Institute, Cleveland Clinic for elaborating supplementary table for types of therapy.
Footnotes
The online version of this article has a Supplementary Appendix.
Authorship and Disclosures
Information on authorship, contributions, and financial & other disclosures was provided by the authors and is available with the online version of this article at www.haematologica.org.
References
- 1.Arber DA, Vardiman JW, Brunning DR, Porwit A, Le Beau MM, Thiele J, et al. Acute myeloid leukaemia with inv(3)(q21q26.2) or t(3;3)(q21;q26.2). In: Swerdlow SH, Campo E, Harris NL, Jaffe ES, Pileri SA, Stein H, et al. eds. WHO Classification of Tumours of Haematopoietic and Lymphoid Tissues. 4th ed Lyon, France: IARC Press; 2008, p110–8 [Google Scholar]
- 2.Cui W, Sun J, Cotta CV, Medeiros LJ, Lin P. Myelodysplastic syndrome With inv(3)(q21q26.2) or t(3;3)(q21;q26.2) has a high risk for progression to acute myeoid leukemia. Am J Clin Pathol. 2011;136(2):282–8 [DOI] [PubMed] [Google Scholar]
- 3.Weisser M, Haferlach C, Haferlach T, Schnittger S. Advanced age and high initial WBC influence the outcome of inv(3) (q21q26)/t(3;3) (q21;q26) positive AML. Leuk Lymphoma. 2007;48(11):2145–51 [DOI] [PubMed] [Google Scholar]
- 4.Testoni N, Borsaru G, Martinelli G, Carboni C, Ruggeri D, Ottaviani E, et al. 3q21 and 3q26 cytogenetic abnormalities in acute myeloblastic leukemia: biological and clinical features. Haematologica. 1999;84(8):690–4 [PubMed] [Google Scholar]
- 5.Lugthart S, Groschel S, Beverloo HB, Kayser S, Valk PJ, van Zelderen-Bhola SL, et al. Clinical, molecular, and prognostic significance of WHO type inv(3)(q21q26.2)/t(3;3)(q21;q26.2) and various other 3q abnormalities in acute myeloid leukemia. J Clin Oncol. 2010;28(24):3890–8 [DOI] [PubMed] [Google Scholar]
- 6.Sun J, Konoplev SN, Wang X, Cui W, Chen SS, Medeiros LJ, et al. De novo acute myeloid leukemia with inv(3)(q21q26.2) or t(3;3)(q21;q26.2): a clinicopathologic and cytogenetic study of an entity recently added to the WHO classification. Mod Pathol. 2011;24(3):384–9 [DOI] [PubMed] [Google Scholar]
- 7.Rockova V, Abbas S, Wouters BJ, Erpelinck CA, Beverloo HB, Delwel R, et al. Risk stratification of intermediate-risk acute myeloid leukemia: Integrative analysis of a multitude of gene mutation and gene expression markers. Blood. 2011;118(4):1069–76 [DOI] [PubMed] [Google Scholar]
- 8.Groschel S, Lugthart S, Schlenk RF, Valk PJM, Eiwen K, Goudswaard C, et al. High EVI1 expression predicts outcome in younger adult patients with acute myeloid leukemia and is associated with distinct cytogenetic abnormalities. J Clin Oncol. 2010;28:2101–7 [DOI] [PubMed] [Google Scholar]
- 9.Shi G, Weh H-J, Diihrsen U, Zeller W, Hossfeld DK. Chromosomal abnormality inv(3)(q21q26) associated with multilineage hematopoietic progenitor cells in hematopoietic malignancies. Cancer Genet Cytogenet. 1997;96(1):58–63 [DOI] [PubMed] [Google Scholar]
- 10.Schanz J, Tüchler H, Solé F, Mallo M, Luño E, Cervera J, et al. New comprehensive cytogenetic scoring system for primary myelodysplastic syndromes (MDS) and oligoblastic acute myeloid leukemia after MDS derived from an international database merge. J Clin Oncol. 2012;30(8):820–9 [DOI] [PMC free article] [PubMed] [Google Scholar]
- 11.Greenberg PL, Tuechler H, Schanz J, Sanz G, Garcia-Manero G, Solé F, et al. Revised international prognostic scoring system for myelodysplastic syndromes. Blood. 2012;120(12):2454–65 [DOI] [PMC free article] [PubMed] [Google Scholar]
- 12.Haferlach C, Bacher U, Grossmann V, Schindela S, Zenger M, Kohlmann A, et al. Three novel cytogenetically cryptic EVI1 rearrangements associated with increased EVI1 expression and poor prognosis identified in 27 acute myeloid leukemia cases. Genes Chrosomosomes Cancer. 2012;51:1079–85 [DOI] [PubMed] [Google Scholar]
- 13.Lahortiga I, Vazquez I, Agirre X, Larrayoz MJ, Vizmanos JL, Gozzetti A, et al. Molecular Heterogeneity in AML/MDS Patients with 3q21q26 Rearrangements. Genes Chromosomes Cancer. 2004;40(3):179–89 [DOI] [PubMed] [Google Scholar]
- 14.Martinelli G, Ottaviani E, Buonamici S, Isidori A, Borsaru G, Visani G, et al. Association of 3q21q26 syndrome with different RPN1/EVI1 fusion transcripts. Haematologica. 2003;88(11):1221–8 [PubMed] [Google Scholar]
- 15.Kataoka K, Kurokawa M. Ecotropic viral integration site 1, stem cell self-renewal and leukemogenesis. Cancer Sci. 2012;103(8):1371–7 [DOI] [PMC free article] [PubMed] [Google Scholar]
- 16.Wieser R. The oncogene and developmental regulator EVI1: expression, biochemical properties, and biological functions. Gene. 2007;396(2):346–57 [DOI] [PubMed] [Google Scholar]
- 17.Poppe B, Dastugue N, Vandesompele J, Cauwelier B, De Smet B, Yigit N, et al. EVI1 is consistently expressed as principal transcript in common and rare recurrent 3q26 rearrangements. Genes Chromosomes Cancer. 2006;45(4):349–56 [DOI] [PubMed] [Google Scholar]
- 18.Watanabe-Okochi N, Yoshimi A, Sato I, Ikeda T, Kumano K, Taoka K, et al. The shortest isoform of C/EBP liver inhibitory protein (LIP), collaborates with Evi1 to induce AML in a mouse BMT model. Blood. 2013;121(20):4142–55 [DOI] [PubMed] [Google Scholar]
- 19.Goyama S, Kurokawa M. Evi-1 as a critical regulator of leukemic cells. Int J Hematol. 2010;91(5):753–7 [DOI] [PubMed] [Google Scholar]
- 20.Konrad TA1, Karger A, Hackl H, Schwarzinger I, Herbacek I, Wieser R. Inducible expression of EVI1 in human myeloid cells causes phenotypes consistent with its role in myelodysplastic syndromes. J Leukoc Biol. 2009;86(4):813–22 [DOI] [PMC free article] [PubMed] [Google Scholar]
- 21.Buonamici S, Li D, Chi Y, Zhao R, Wang X, Brace L, et al. EVI1 induces myelodysplastic syndrome in mice. J Clin Invest. 2004;114(5):713–9 [DOI] [PMC free article] [PubMed] [Google Scholar]
- 22.Stein S, Ott MG, Schultze-Strasser S, Jauch A, Burwinkel B, Kinner A, et al. Genomic instability and myelodysplasia with monosomy 7 consequent to EVI1 activation after gene therapy for chronic granulomatous disease. Nat Med. 2010;16(2):198–204 [DOI] [PubMed] [Google Scholar]
- 23.Greenberg P, Cox C, LeBeau MM, Fenaux P, Morel P, Sanz G, et al. International scoring system for evaluating prognosis in myelodysplastic syndromes. Blood. 1997;89(6):2079–88 [PubMed] [Google Scholar]
- 24.Shaffer LG, Slovak ML, Campbell LJ, eds. An international system for human cytogenetic nomenclature: Recommendations of the international standing committee on human cytogenetic nomenclature. Basel, Switzerland: Karger; 2009 [Google Scholar]
- 25.Patnaik MM, Hanson CA, Hodnefield JM, Knudson R, Van Dyke DL, Tefferi A. Monosomal karyotype in myelodysplastic syndromes, with or without monosomy 7 or 5, is prognostically worse than an otherwise complex karyotype. Leukemia. 2011;25(2):266–70 [DOI] [PubMed] [Google Scholar]
- 26.Breems DA, Löwenberg B. Acute myeloid leukemia with monosomal karyotype at the far end of the unfavorable prognostic spectrum. Hematologica. 2011;96(4):491–3 [DOI] [PMC free article] [PubMed] [Google Scholar]
- 27.Gohring G, Michalova K, Beverloo HB, Betts D, Harbott J, Haas OA, et al. Complex karyotype newly defined: the strongest prognostic factor in advanced childhood myelodysplastic syndrome. Blood. 2010;116(19):3766–9 [DOI] [PubMed] [Google Scholar]
- 28.Bitter MA, Neilly ME, Le Beau MM, Pearson MG, Rowley JD. Rearrangements of chromosome 3 involving bands 3q21 and 3q26 are associated with normal or elevated platelet counts in acute nonlymphocytic leukemia. Blood. 1985;66(6):1362–70 [PubMed] [Google Scholar]
- 29.Laricchia-Robbio L, Nucifora G. Significant increase of self-renewal in hematopoietic cells after forced expression of EVI1. Blood Cells Mol Dis. 2008;40(2):141–7 [DOI] [PMC free article] [PubMed] [Google Scholar]
- 30.Kilbey A, Alzuherri H, McColl J, Calés C, Frampton J, Bartholomew C. The Evi1 proto-oncoprotein blocks endomitosis in megakaryocytes by inhibiting sustained cyclin-dependent kinase 2 catalytic activity. Br J Haematol. 2005;130(6):902–11 [DOI] [PubMed] [Google Scholar]
- 31.Bindels EM, Havermans K, Lugthart S, Erpelinck C, Wocjtowicz E, Krivtsov AV, et al. EVI1 is critical for the pathogenesis of a subset of MLL-AF9-rearranged AMLs. Blood. 2012;119(24):5838–49 [DOI] [PMC free article] [PubMed] [Google Scholar]
- 32.Estey E, Thall P, Beran M, Kantarjian H, Pierce S, Keating M. Effect of diagnosis (refractory anemia with excess blasts, refractory anemia with excess blasts in transformation, or acute myeloid leukemia [AML]) on outcome of AML-type chemotherapy. Blood. 1997;90(8):2969–77 [PubMed] [Google Scholar]
- 33.Arber DA. Realistic pathologic classification of acute myeloid leukemias. Am J Clin Pathol. 2001;115(4):552–60 [DOI] [PubMed] [Google Scholar]
- 34.Fonatsch C, Gudat H, Lengfelder E, Wandt H, Silling-Engelhardt G, Ludwig WD, et al. Correlation of cytogenetic findings with clinical features in 18 patients with inv(3)(q21q26) or t(3;3)(q21;q26). Leukemia. 1994;8(8):1318–26 [PubMed] [Google Scholar]
- 35.Medeiros BC, Kohrt HE, Arber DA. Immunophenotypic features of acute myeloid leukemia with inv(3)(q21q26.2)/t(3;3)(q21;q26.2). Leuk Res. 2010;34(5):594–7 [DOI] [PMC free article] [PubMed] [Google Scholar]
- 36.Haferlach C, Bacher U, Haferlach T, Dicker F, Alpermann T, Kern W, et al. The inv(3)(q21q26)/t(3;3)(q21;q26) is frequently accompanied by alterations of the RUNX1, KRAS and NRAS and NF1 genes and mediates adverse prognosis both in MDS and in AML: a study in 39 cases of MDS or AML. Leukemia. 2011;25:874–7 [DOI] [PubMed] [Google Scholar]
- 37.Haferlach C, Alpermann T, Schnittger S, Kern W, Chromik J, Schmid C, et al. Prognostic value of monosomal karyotype in comparison to complex aberrant karyotype in acute myeloid leukemia: a study on 824 cases with aberrant karyotype. Blood. 2012;119(9):2122–5 [DOI] [PubMed] [Google Scholar]
- 38.Yagyu S, Morimoto A, Kakazu N, Tamura S, Fujiki A, Nakase Y, et al. Late appearance of a Philadelphia chromosome in a patient with therapy-related acute myeloid leukemia and high expression of EVI1. Cancer Genetics Cytogenetics. 2008;180(2):115–20 [DOI] [PubMed] [Google Scholar]


