Abstract
Multi-dose protein formulations require an effective antimicrobial preservative (AP) to inhibit microbial growth during long-term storage of unused formulations. m-cresol is one such AP, but has been shown to cause protein aggregation. However, the fundamental physical mechanisms underlying such AP-induced protein aggregation are not understood. In this study, we used a model protein cytochrome c to identify the protein unfolding that triggers protein aggregation. m-cresol induced cytochrome c aggregation at preservative concentrations that are commonly used to inhibit microbial growth. Addition of m-cresol decreased the temperature at which the protein aggregated and increased the aggregation rate. However, m-cresol did not perturb the tertiary or secondary structure of cytochrome c. Instead, it populated an “invisible” partially unfolded intermediate where a local protein region around the methionine residue at position 80 was unfolded. Stabilizing the Met80 region drastically decreased the protein aggregation, which conclusively shows that this local protein region acts as an aggregation “hot-spot”. Based on these results, we propose that APs induce protein aggregation by partial rather than global unfolding. Because of the availability of site-specific probes to monitor different levels of protein unfolding, cytochrome c provided a unique advantage in characterizing the partial protein unfolding that triggers protein aggregation.
Keywords: Physical stability, protein structure, protein unfolding, protein aggregation, antimicrobial preservative, proteins, spectroscopy, formulation, cytochrome c, cresol
Introduction
Approximately one-third of pharmaceutical formulations are of multi-dose1. Multi-dose protein formulations are desirable for reasons of economics, patient compliance, and safety. Therapeutic proteins provide numerous unique and critical treatments for human diseases and conditions. However, if a protein product cannot be stabilized adequately, its benefit to human health will never be realized. A shelf life of 18 to 24 months is required to make a typical protein pharmaceutical product economically viable2. Because of the risk of microbial growth after the first dose has been removed from the product vial, multi-dose formulations require an effective antimicrobial preservative (AP)1,3,4. Protein formulations that contain APs are critical for many therapeutic and vaccine applications. Preservatives are also required for drug delivery systems such as injection pens that are used in multiple doses5, minipumps that are used for continuous infusion6, and topical applications for wound healing7.
m-cresol (CR) is an effective AP and is used at low levels (0.3%) in peptide and protein formulations1,4,8. However, CR has been shown to cause protein aggregation4,9–13, leading to a decreased concentration of the functional monomer. More often these protein aggregates induce serious immunogenicity and toxicity14–17. The fundamental physical mechanisms underlying such preservative-induced protein aggregation remain less understood. A mechanistic understanding of these processes is needed to develop rational approaches to inhibit the aggregation, which will help in selecting the right AP for multi-dose protein formulations and drug delivery systems. Earlier studies have shown that these preservatives do not significantly alter the global protein structure and stability18–21, and it has been proposed that partial protein unfolding might be the factor that triggers protein aggregation. In this paper, we tested this hypothesis by studying CR induced aggregation of a model protein cytochrome c (Cyt c).
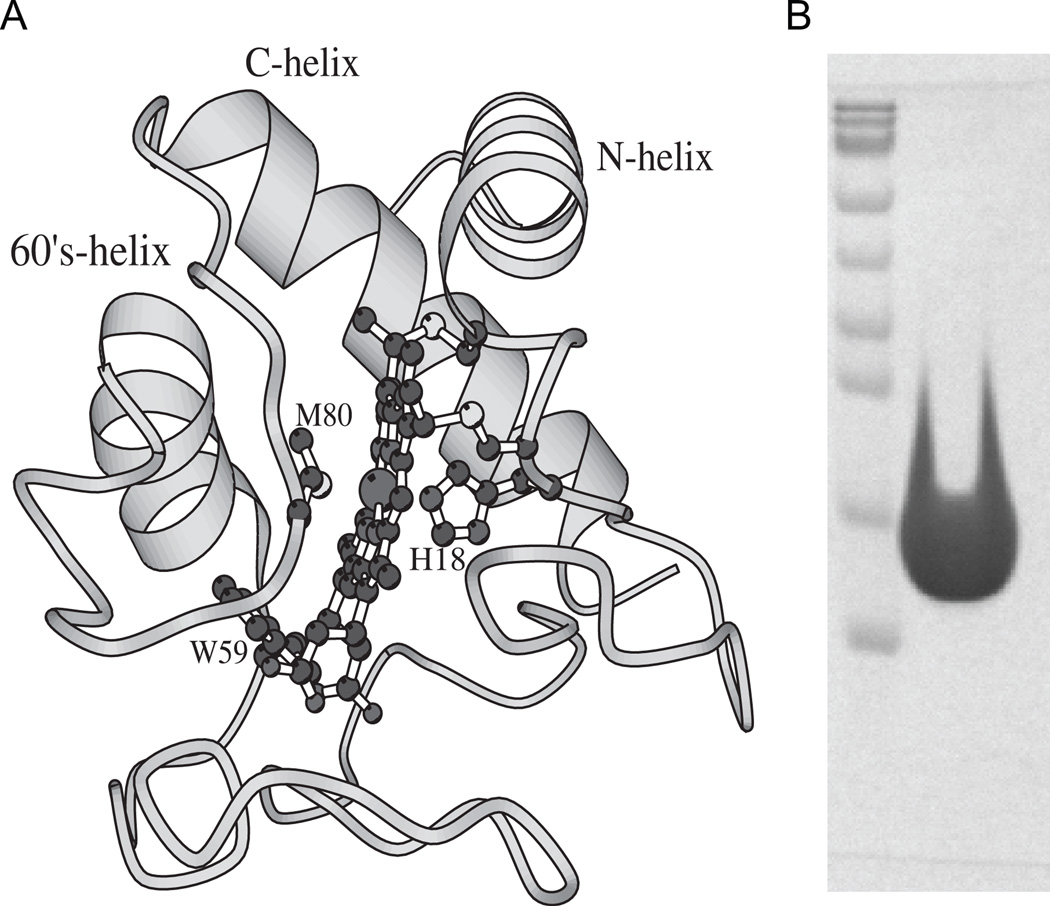
Model proteins offer several advantages over pharmaceutical proteins because they are well-behaved and their biophysics has been well characterized. The mechanistic principles we learn from model proteins can lead to the hypotheses about how APs trigger protein aggregation that can later be tested with pharmaceutical proteins. Among several model proteins available for biophysical studies, Cyt c (Fig. 1A) is unique because it provides optical probes to measure both global and local unfolding22. Tryptophan fluorescence and circular dichroism (CD) at 222 nm probe the global stability of the protein23. However, CD at 222 nm, which is a measure of the α-helicity of the protein, cannot be used in the present study because m-cresol absorbs strongly in the wavelength region around 222 nm. Cyt c has a single tryptophan residue at position 59 (Trp59) and its fluorescence measures the loss of compactness or the global unfolding of the entire protein. This is because the Trp59 fluorescence is quenched in the native state due to resonance energy transfer to the covalently linked heme (Förster distance R0 = 34 Å24). For the fluorescence to be seen, Trp59 has to be significantly displaced away from the heme, which is only possible with the complete unfolding of the protein. In agreement, the increase in fluorescence with the addition of denaturant measures the same global stability as that measured by CD at 222 nm23. In contrast to these two global probes, the absorption band at 695 nm measures the stability of a local protein region in Cyt c. This absorption band corresponds to the charge transfer from the side chain sulfur of the methionine residue at position 80 (Met80) to the heme ferric iron to which Met80 is liganded. This band is absent when the protein region surrounding Met80 is unfolded due to the lack of ligation to the heme, and hence is a measure of the local stability of the Met80 region. In addition, NMR solution structure and chemical shifts of individual amino acids are known25,26, and these signals can be used to monitor site-specific structural changes. We used these various optical and structural probes to monitor the effects of m-cresol on global and local protein stability, and on the aggregation of Cyt c.
Fig. 1.
(A) Structure of Cyt c (PDB ID: 1HRC). The protein consists of three α-helices and three Ω-loops. The figure also shows the covalently linked heme, its two axial ligands His18 and Met80, and the single Trp residue at position 59 which fluoresces in the unfolded state. The structure was generated using the MOLSCRIPT59 program. (B) SDS/PAGE of Cyt c used in this study. Lane 1 shows the protein molecular weight markers (bottom to top: 10, 17, 26, 34, 43, 56, 72, 95, and 130 kDa respectively). Lane 2 was overloaded with Cyt c, whose expected molecular weight is 12.4 kDa, to see whether or not other protein impurities are present in the sample.
Materials and Methods
Materials
Equine Cyt c (type VI) was obtained from Sigma Chemical Co (St. Louis, Missouri, USA). Prior to experiments, the protein was freshly oxidized using potassium ferricyanide to remove any trace amounts of the reduced form. It was dialyzed extensively against the desired buffer and filtered through a 0.22 µm filter. The purity of the protein was checked by running a denaturant gel on which the protein showed a single band (Fig. 1B), and from the ratio of 409 nm (heme Soret band) to 280 nm (aromatic absorption band) absorbance which was 4.6 expected for a pure oxidized protein27. In addition, the absence of the reduced form was confirmed from the absorbance values at 339, 526.5, 541.74, and 550 nm using a previously described method27,28. For experiments with the reduced form, ascorbate was used to reduce Cyt c. CR was obtained from Sigma and deuterated CR was obtained from Isotec (Miamisburg, Ohio, USA). Optical grade guanidinium chloride (GdmCl) was purchased from MP Biomedicals (Solon, Ohio, USA). All other reagents used in this study were of the highest grade available from either Fisher Scientific (Fair Lawn, New Jersey, USA) or Sigma Chemicals.
Isothermal incubation experiments
Cyt c solution was incubated at the desired temperature (55°C or 65°C), and the changes in optical density at 800 nm were monitored as a function of the incubation time using a Chirascan Plus spectrometer (Applied Photophysics, Leatherhead, Surrey, UK). For these experiments, the cuvette containing buffer solution was initially equilibrated at the required temperature before adding Cyt c (300 µM final concentration) to the cuvette. At longer incubation times, the aggregates began to settle to the bottom of the cuvette resulting in decreased optical density, and the experiment was stopped at this point.
Thermal scanning method
Changes in the optical density of Cyt c solutions were monitored as a function of increasing temperature using an Agilent 8453 UV-Visible spectrophotometer (Agilent, Waldbronn, Baden-Württemberg, Germany). Cyt c (300 µM) in 0.1 M sodium phosphate, 0.15 M NaCl, pH 7 was used for these experiments. The solution temperature was steadily increased at a rate of 1°C/min followed by a 1 min equilibration before collecting the signal, and the signal was integrated for 0.5 seconds. The first derivative of the optical density increase was used to calculate the midpoint aggregation temperature (TmAgg) using the software provided with the instrument.
To measure changes in Trp fluorescence while simultaneously measuring the increase in optical density due to protein aggregation, an Applied Photophysics Chirascan Plus spectrometer and a lower protein concentration of 25 µM was used. CR strongly fluoresces below 350 nm, so an emission wavelength of 380 nm was used where Trp fluorescence in the unfolded state dominates over the CR fluorescence.
Denaturant melts
GdmCl was used as the denaturant for these experiments. Protein solutions at varying GdmCl concentration were prepared and equilibrated overnight before measuring changes in their optical signals as a function of the denaturant concentration. The concentration of the denaturant was determined using refractive index measurements29. Changes in the fluorescence signal were measured using 25 µM Cyt c in 0.1 M sodium phosphate, 0.15 M NaCl, pH 7 with the excitation and emission wavelengths set at 280 nm and 380 nm respectively, using a SPEX Fluorolog-3 fluorometer (Horiba Jobin Yvon, Edison, New Jersey, USA). As described above, the longer emission wavelength was chosen to be in the region where the Trp fluorescence signal dominated the CR fluorescence. To measure changes in the 695 nm absorbance, 300 µM Cyt c in 0.1 M sodium phosphate, 0.15 M NaCl, pH 7 was used. The ΔG values were determined by fitting the changes in the optical signals measured as a function of the denaturant concentration to a Santoro-Bolen 2-state equilibrium unfolding model30,31.
To globally analyze the denaturant melting transitions recorded at various CR concentrations, the data were fit to a 3-state unfolding equilibrium model:
where N, I and U represent the native, partially unfolded intermediate, and fully unfolded states, and KNI and KIU are the thermodynamic equilibrium constants connecting the N & I states and the I & U states respectively. We used the following equations which describe the relative populations of the three species N, U & I as a function of the denaturant and CR concentration:
where Q is the partition function, R is the universal gas constant, T is the absolute temperature, ΔG0NI and ΔG0IU are the Gibb’s free energies at zero denaturant and zero CR concentrations, mNI,CR and mIU,CR are the slopes of the decrease in ΔGNI and ΔGIU with the CR concentration, and mNI,D and mIU,D are the slopes of the decrease in ΔGNI and ΔGIU with the denaturant D concentration, respectively. The above equations assume that the effects of CR and denaturant on protein stability are independent of each other.
FT-IR experiments
IR spectra of Cyt c solutions (1 mM in 0.1 M sodium phosphate, 0.15 M NaCl, pH 7, H2O, room temperature) were recorded using a Biomem MB-series FT-IR spectrometer (ABB Biomem Inc., Quebec City, Quebec, Canada) and a CaF2 cell (Biotools, USA). To record the IR spectra of Cyt c aggregates, they were initially washed three times with the above buffer. For each sample, 128 scans were acquired in single beam mode with 4 cm−1 resolution. IR absorbance spectra were processed using GRAMS/AI 7.00 software (Thermo Galactic, Thermo Electron Co., USA).
NMR titration experiments
Two-dimensional (2D) gradient NMR 1H-1H Correlation Spectroscopy (COSY) experiments were performed to monitor changes in Cyt c amide crosspeaks as a function of CR concentration using a Varian Inova 500 MHz NMR instrument. These experiments used 3 mM Cyt c (0.1 M sodium phosphate, 0.15 M NaCl, pH 7), and deuterated CR to suppress proton signals from unlabeled CR. NMR spectra were collected with 8000 Hz spectral width and 512 points in each direction. The spectra were processed in magnitude mode using the NMRPipe software32 with zero filling to twice their real points, apodization with nonshifted sine multiplication, exponential broadening, and Gaussian transformation. The spectra were base line corrected in both dimensions and the chemical shifts were referenced with the NMR standard 4,4-dimethyl-4-silapentane-1-sulfonic acid (DSS).
Results
CR induces Cyt c aggregation
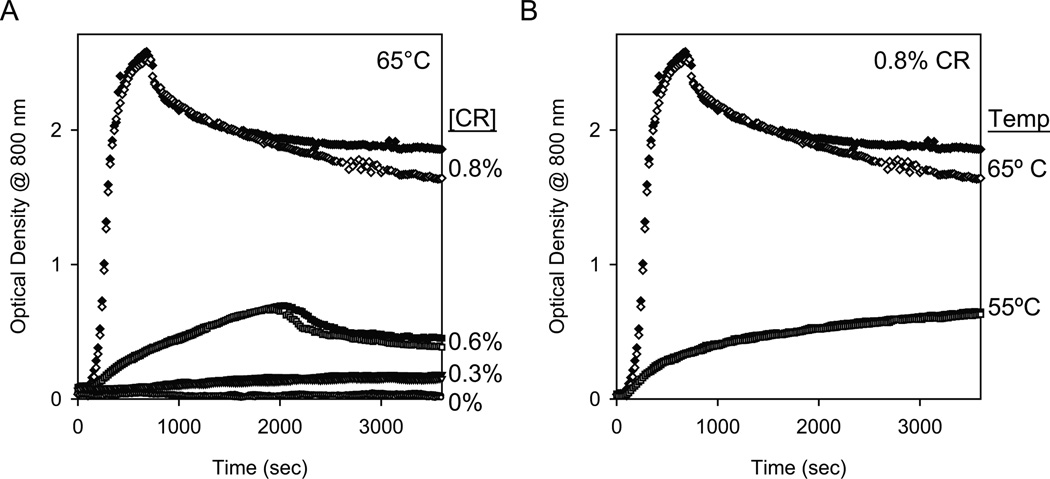
One common technique that has been used in the literature to conveniently monitor protein aggregation on a laboratory timescale is to incubate the protein at elevated temperatures, and then analyze the aggregation using biophysical methods. We used high temperatures of 55°C or 65°C and monitored protein aggregation by measuring the increase in optical density due to increased solution turbidity. For these measurements, we chose a wavelength at which Cyt c does not absorb. Cyt c contains a covalently linked heme that absorbs over nearly all wavelengths below 800 nm, and hence this longer wavelength was used. At 65°C, the optical density at 800 nm showed an increase due to increased solution turbidity within 10 min in the presence of CR indicating protein aggregation, whereas no such increase was observed in the absence of CR (Fig. 2A). The aggregation rate and the extent of aggregation increased with the increase in the CR concentration from 0% to 0.8% vol/vol. To show that the effect of CR on protein aggregation is independent of the solution temperature, a similar experiment was performed at a lower temperature of 55°C with 0.8% vol/vol CR. Cyt c did aggregate at 55°C (Fig. 2B), but with slower aggregation kinetics compared to 65°C.
Fig. 2.
Cyt c aggregation kinetics under isothermal conditions measured by the increase in optical density at 800 nm. (A) Kinetics at 65°C as a function of the CR concentration, and (B) kinetics at 0.8% vol/vol CR as a function of the temperature. In both panels, solid and hollow symbols represent duplicate runs.
CR decreases the temperature at which Cyt c aggregates
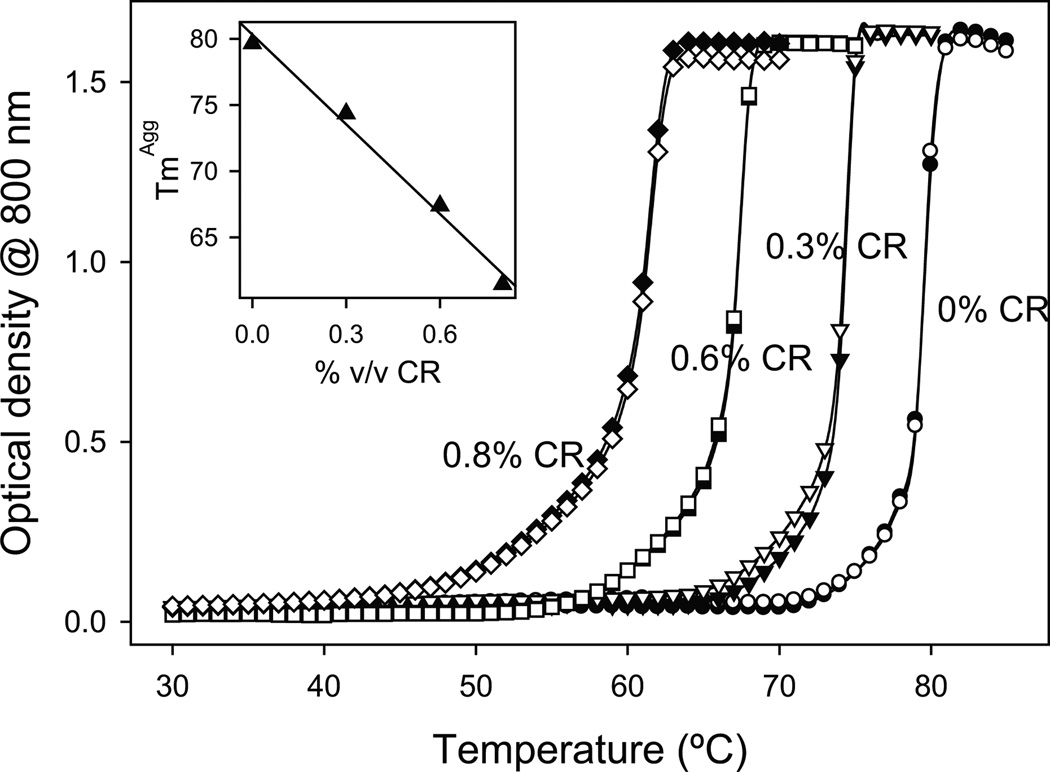
Proteins tend to aggregate at higher temperatures because of the increased contribution of hydrophobic effects. Using a thermal scanning method (see Methods), we explored the effects of CR on the temperature at which Cyt c aggregates. Similar to the above measurements, the optical density at 800 nm was used because Cyt c does not absorb at that wavelength. In the absence of CR, an increase in the optical density was observed at temperatures above 75°C indicating increased protein aggregation (Fig. 3). With the addition of CR, the temperature at which the protein aggregated shifted to lower values. The temperature at which the optical density is half of the maximum value, defined as the midpoint aggregation temperature or TmAgg, was 80°C in the absence of CR. The addition of CR decreased the TmAgg from 80°C to 61°C (at 0.8% vol/vol CR) with a linear slope of 23°C/%vol/vol CR. This result indicates that CR induces Cyt c aggregation at lower temperatures, which is consistent with the data presented in Fig. 2.
Fig. 3.
Cyt c aggregation measured by the increase in the optical density at 800 nm as a function of increasing temperature in thermal scanning experiments at different CR concentrations. Solid and hollow symbols represent duplicate runs. The inset shows that the midpoint aggregation temperature (TmAgg) decreases with increasing CR concentration with a slope of 23 ± 2°C/%vol/vol CR.
CR does not cause global unfolding prior to aggregation
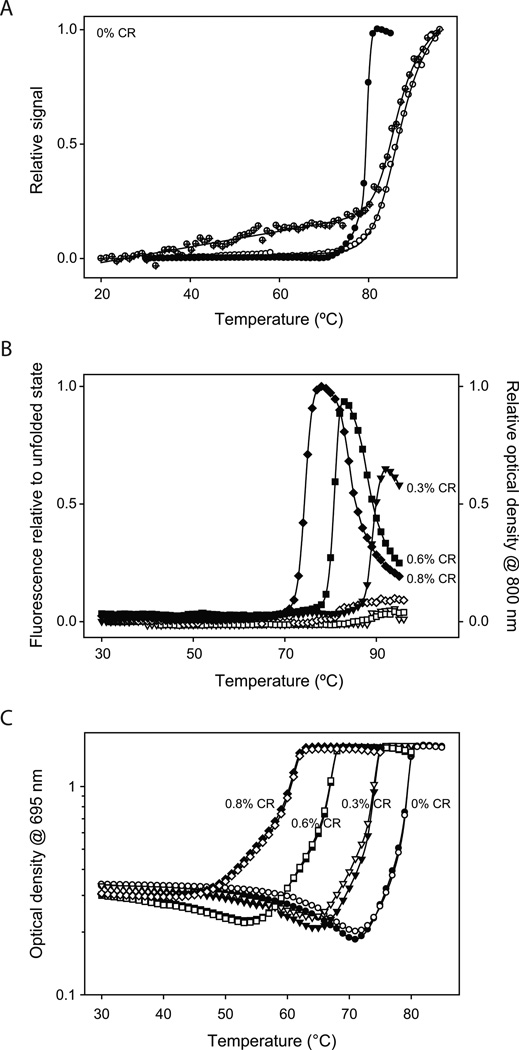
We used Trp fluorescence to measure changes in the native tertiary structure of the protein while Cyt c was aggregating in thermal scanning experiments. For these experiments, a lower protein concentration (25 µM) was used compared to Figs. 2 & 3 (300 µM) to avoid inner filter effects on the fluorescence33. In the absence of CR, Cyt c did not aggregate at this low protein concentration, perhaps because of the decreased collision frequency between individual Cyt c molecules. However, the fluorescence intensity did increase with an increase in the solution temperature (Fig. 4A), and the transition is completely reversible upon decreasing the temperature. This variation in fluorescence matched the changes in the CD signal at 222 nm which measures the melting of the α-helical secondary structure (Fig. 4A), and the correlation indicates that the increase in fluorescence is due to the global unfolding of the protein. Both fluorescence and CD measurements resulted in the same midpoint unfolding temperature of 86°C, which closely matches the value reported in the literature34,35. A comparison of the global unfolding, measured by fluorescence and CD, with the Cyt c aggregation measured in Fig. 3 indicates that the protein does not unfold globally prior to its aggregation (Fig. 4A).
Fig. 4.
(A) Comparison of the protein aggregation curve measured in the absence of CR (solid circles, data from Fig. 3) and the global protein unfolding measured by both Trp fluorescence (hollow circles) and CD at 222 nm (crossed circles). (B) Changes in fluorescence intensity and optical density at 800 nm measured simultaneously while the protein (25 µM) was aggregating at various CR concentrations. Solid and hollow symbols represent the changes in optical density and fluorescence respectively. (C) Changes in the 695 nm optical density during thermal scanning at 300 µM protein concentration. Solid and hollow symbols represent duplicate runs.
Further evidence for the absence of global unfolding came from experiments done in the presence of CR (Fig. 4B). In contrast to the absence of protein aggregation with no CR present in solution, the addition of CR promoted protein aggregation with increasing temperature (Fig. 4B) even at low protein concentrations of 25 µM. However, the protein aggregated at higher temperatures compared to the experiments in Fig. 3, which indicates that CR-induced protein aggregation depends on the protein concentration. No considerable increase in native fluorescence was observed prior to the increase in optical density at 800 nm, indicating that the protein does not undergo global unfolding before aggregation (Fig. 4B). In addition, no significant increase in Trp fluorescence was observed during or after aggregation. This could occur either because the protein has retained its overall compact native structure in the aggregate or due to inner filter effects33 where the fluorescence intensity from one protein molecule was quenched by the neighboring protein molecules due to their close proximity in the aggregate.
CR unfolds a local protein region around Met80 prior to aggregation
We next tracked changes in the 695 nm absorbance while the protein was aggregating in the thermal scanning experiments (Fig. 4C). These experiments were done at a protein concentration of 300 µM, similar to that used in Figs. 2 & 3. In buffer without CR, 695 nm absorbance initially decreased with the increase in solution temperature, followed by an increase in the optical density at temperatures above 75°C. The later part of this increase is identical to the transition measured at 800 nm (Fig. 3), indicating that the increase is not caused by the increase in 695 nm absorbance but is due to the increased optical density as a result of protein aggregation. That means, the Met80 region unfolds prior to protein aggregation. With the increase in CR concentration, the 695 nm absorbance melted at lower temperatures, indicating decreased stability of the local protein region around Met80, and the proceeding protein aggregation followed the same trend. At 0.8% CR, there was no clear separation between 695 nm melting and protein aggregation, indicating that the rate of aggregation was faster than the 1 min equilibration time used in the thermal scanning experiments. At CR concentrations above 1% vol/vol, instantaneous protein aggregation was observed even at room temperature upon vortexing the samples.
CR does not affect the secondary and tertiary structure of Cyt c
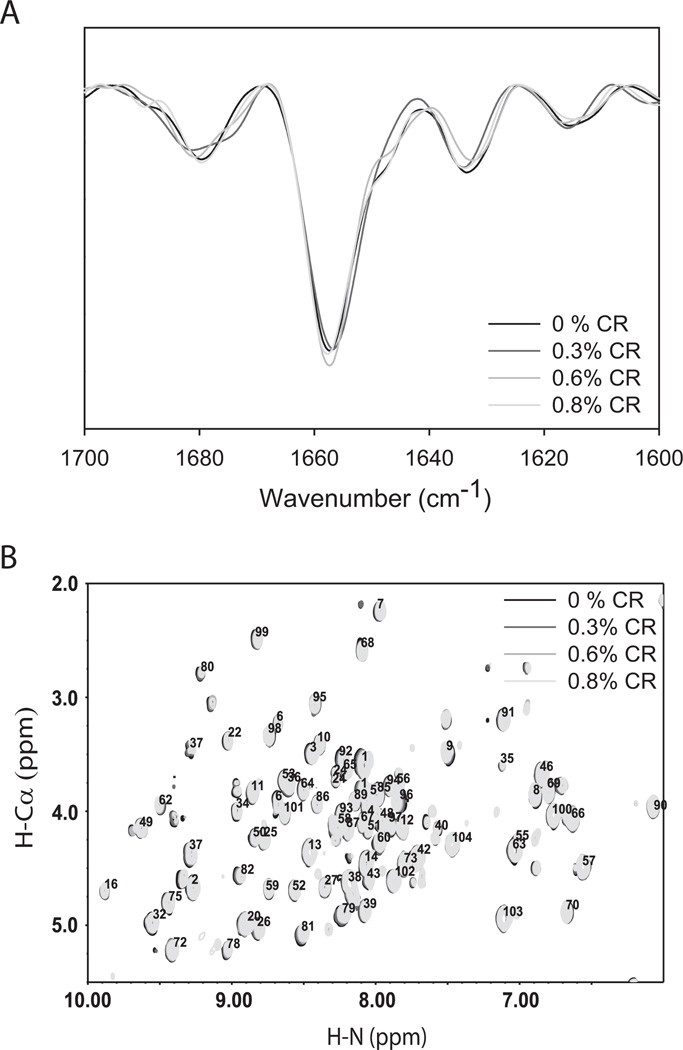
We measured the changes in protein secondary structure using second derivative FT-IR spectroscopy (Fig. 5A). Cyt c showed an intense band at 1654 cm−1 that is characteristic of an α-helix36. The band at 1680 cm−1 is characteristic of turns, the band at 1632 cm−1 originates from the β-sheet and/or extended (random-coil) polypeptide chain, and the less intense band at 1616 cm−1 is due to the absorption of amino acid sidechains37. Adding CR did not change the peak positions or intensities of these individual bands within the experimental error. This indicates that the addition of CR does not induce a change in the protein secondary structure.
Fig. 5.
(A) Second derivative FT-IR spectra and (B) 2D NMR COSY fingerprint region as a function of CR concentration.
As observed earlier (Fig. 4B), the addition of CR did not increase Cyt c’s fluorescence at room temperature and hence did not perturb the tertiary structure of the protein. We later measured the effect of CR on the structure of local protein regions using NMR chemical shifts of the mainchain amide and α-carbon protons in the fingerprint region of 2D COSY spectra (Fig. 5B). No significant changes in the crosspeak positions of individual residues were observed with the addition of CR, indicating that CR did not perturb the global backbone structure of Cyt c. This includes the Met80 region, which is consistent with Fig. 4C where there was relatively little change in the 695 nm absorbance with the addition of CR at room temperature (Fig. 4C).
CR preferentially populates a partially unfolded intermediate where the local region around Met80 is unfolded
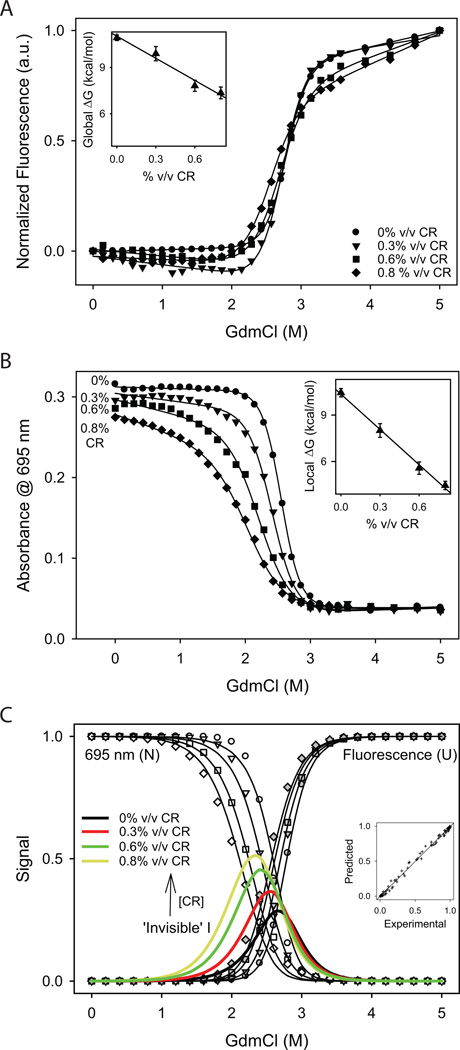
We measured changes in global stability using denaturant melts with GdmCl as the denaturant and Trp fluorescence as the optical signal at various CR concentrations (Fig. 6A). Although these melting curves seem to overlap with one another, the denaturant concentration at which half of the protein melted was slightly shifted to lower values and the melting transition became shallower, indicating a decrease in global stability with increasing CR concentration. Fitting these melts to a 2-state equilibrium unfolding model30,31 resulted in a decrease in global ΔG with a slope (m-value) of 4.8 kcal/mol/ % vol/vol CR (Fig. 6A Inset).
Fig. 6.
Changes in (A) Trp fluorescence (global probe) and (B) 695 nm absorbance (local probe) with GdmCl measured at various CR concentrations. Insets show the variation in ΔG values with the CR concentration obtained by fitting the observed changes in optical signals to a 2-state equilibrium unfolding model30,31. Slopes (m-values) are −4.8 ± 0.6 and −7.6 ± 0.4 kcal/mol/% vol/vol CR for Trp fluorescence (global stability) and 695 nm absorbance (local stability) respectively. (C) Results from global analysis of the eight melting transitions shown in panels A and B. The data in panels A and B were normalized from 0 to 1 after subtracting native and unfolded baselines. Circles, triangles, squares and diamonds show the data at 0, 0.3, 0.6, and 0.8% vol/vol CR. Inset shows the correlation between the experimental and predicted values to indicate the goodness of the global fit. The obtained parameters are ΔGNI = 5.9 ± 0.1 kcal/mol, mNI,CR = −1.6 ± 0.1 kcal/mol/%vol/vol CR, mNI,D = −2.2 ± 0.1 kcal/mol/M GdmCl, ΔGIU = 6.9 ± 0.2 kcal/mol, mIU,CR = −0.4 ± 0.1 kcal/mol/% vol/vol CR, and mIU,D = −2.6 ± 0.1 kcal/mol/M GdmCl. The colored lines show the relative population of the “invisible” intermediate at various CR concentrations.
The local stability of the protein region around Met80 was measured using 695 nm absorbance. In contrast to the fluorescence melting curves (Fig. 6A), 695 nm absorbance melts recorded at various CR concentrations did not overlap with one another (Fig. 6B). The absorbance melt progressively shifted to lower denaturant concentrations with increasing CR concentration, indicating a decrease in the stability of the Met80 region. Fitting these individual curves to a 2-state equilibrium unfolding model30,31 assuming no intermediates between the native and unfolded states resulted in a linear decrease of local ΔG of the Met80 region with an m-value of 7.6 kcal/mol/%vol/vol CR (Fig. 6B Inset), which is much higher than the m-value observed for global unfolding (Fig. 6A Inset). That means, CR destabilizes the Met80 region much more than the entire protein.
The results presented in Figs. 4, 6A, and 6B indicate that a more appropriate way to analyze the denaturant melting curves is through the use of a 3-state unfolding model with a partially unfolded intermediate existing between the native and unfolded states. Because we did not see a significant change in fluorescence prior to protein aggregation at various CR concentrations (Fig. 4B), we assumed that the intermediate has a native-like compact structure and thus does not fluoresce similar to the native state. Because the melting of 695 nm absorbance preceded the protein aggregation (Fig. 4C), this intermediate lacks the Met80-bound heme and hence has no 695 nm absorbance. This means, the fluorescence and 695 nm absorbance signals recorded at various denaturant and CR concentrations represent the relative populations of the unfolded and native states. We normalized the fluorescence (Fig. 6A) and 695 nm absorbance (Fig. 6B) melting curves from 0 to 1 after subtracting the sloped native and unfolded state baselines, and analyzed them globally with a 3-state model (mathematical equations given in the Methods section). Fig. 6C shows the fits from the global analysis and the inset shows the correlation between the experimental and predicted values which indicates the good quality of the fit. Parameters obtained from the fit are given in the Fig. 6C legend. The results show that ΔGNI decreases with CR concentration with a slope of mNI,CR = −1.6 kcal/mol/% vol/vol CR, which is 4 times higher than the slope of ΔGIU decrease with CR (mIU,CR = −0.4 kcal/mol/% vol/vol CR). That means, CR preferentially affects the N ← → I equilibrium compared to the I ← → U equilibrium, resulting in a significant population of the partially unfolded intermediate which has a compact ‘native-like’ structure but has the local protein region around Met80 unfolded. Note that although the individual melting curves (Figs. 6A & B) can be fit to a 2-state unfolding model, the combined analysis of all eight curves led to the detection of an “invisible” partially unfolded intermediate that cannot be detected either by fluorescence or by 695 nm absorbance. With the increase in CR concentration, the intermediate population (colored lines in Fig. 6C) increases significantly and shifts to lower denaturant concentrations indicating decreased stability, and hence results in increased protein aggregation (Fig. 4C).
The above global analysis also indicates that the partial unfolding that triggers protein aggregation is not just limited to a single residue Met80 but involves unfolding of a much larger protein region. As seen from the results (Fig. 6C legend), ΔGNI decreases with the increase in the denaturant concentration at a slope of mNI,D = −2.2 kcal/mol/M GdmCl, which is 46% of the total m-value corresponding to the global unfolding of the protein (mNU,D = mNI,D + mIU,D = −2.2–2.6 = −4.8 kcal/mol/M GdmCl). The m-value in denaturant melts is a measure of the amount of protein surface area exposed upon unfolding38. That means, the partially unfolded intermediate populated by CR has a significant protein region unfolded much beyond the single residue Met80.
Stabilizing the Met80 region reduces protein aggregation
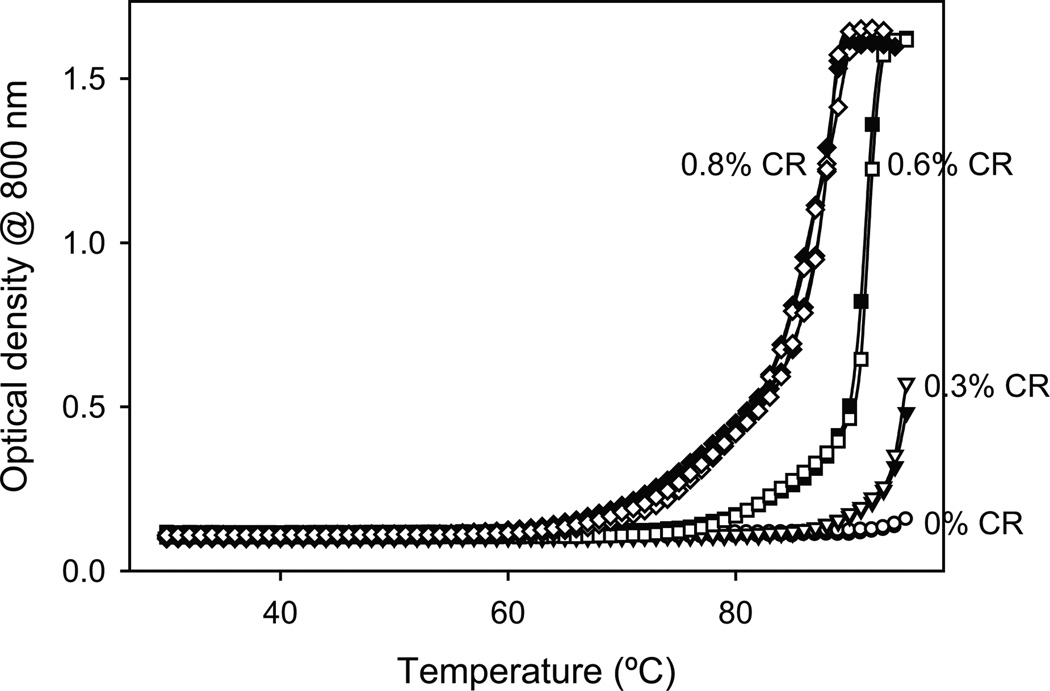
The above thermal scanning (Fig. 4) and equilibrium denaturant melts (Fig. 6) show that the unfolding of a protein region that includes Met80 precedes protein aggregation. CR preferentially populates an intermediate with this local region unfolded, suggesting that it might be an aggregation “hot-spot” whose unfolding leads to protein aggregation. In such a case, stabilizing this local region should decrease the protein aggregation or increase the temperature at which the protein aggregates. The best method that has been demonstrated in the literature to stabilize specifically the Met80 region is to reduce the heme to which Met80 is liganded39,40. In the reduced form, the stability of the Met80-heme bond increases by 3.2 kcal/mol compared to its oxidized form39. As before, thermal scanning experiments were used to measure the protein aggregation of the reduced form of Cyt c (Fig. 7). Reduced Cyt c aggregated at much higher temperatures compared to the oxidized form at all CR concentrations (compare Fig. 7 with Fig. 3). At 0% and 0.3% vol/vol CR, the reduced form did not melt up to 95°C whereas the oxidized form melted before 85°C. In the case of 0.6% and 0.8% vol/vol CR, the reduced form melted with a TmAgg of 92°C and 88°C whereas the oxidized form melted with a TmAgg of 67°C and 61°C respectively. These results conclusively show that the Met80 region is the aggregation “hot-spot” for Cyt c aggregation.
Fig. 7.
Aggregation of reduced Cyt c measured by the increase in optical density at 800 nm in thermal scanning experiments at different CR concentrations. Solid and hollow symbols represent duplicate runs.
Structure of CR-induced Cyt c aggregates
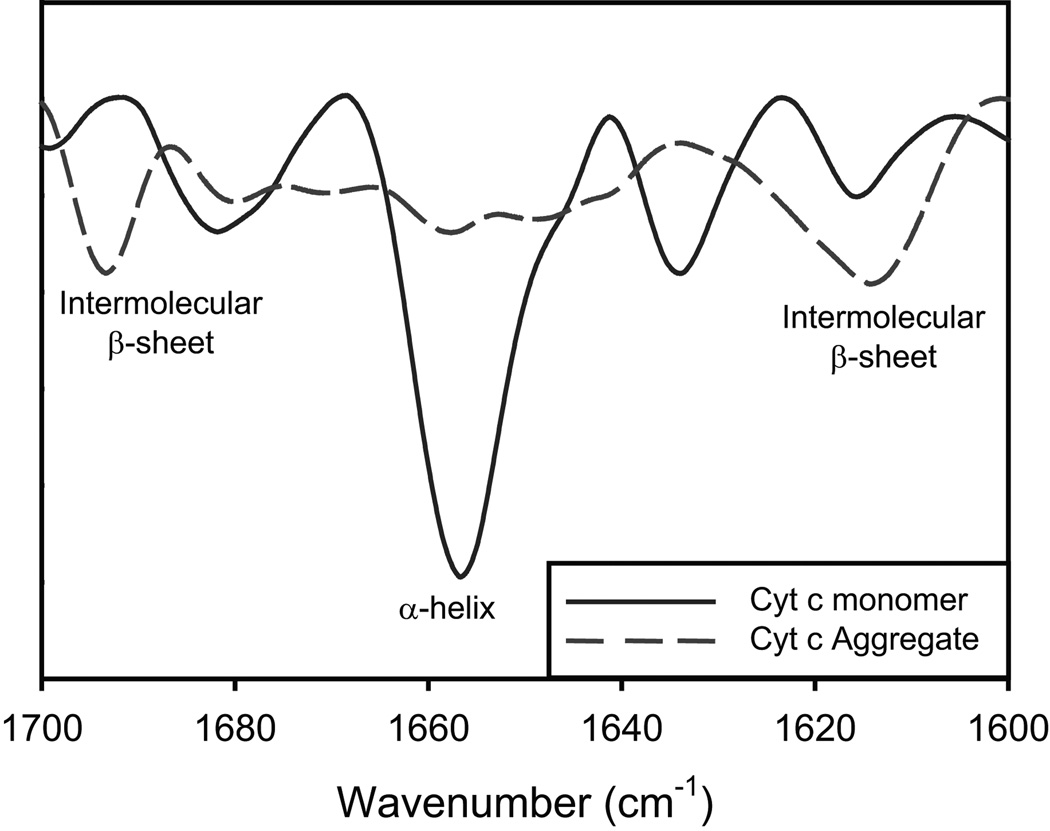
FT-IR was used to characterize the secondary structure of the protein aggregates (Fig. 8). As discussed before, Cyt c in solution has a strong IR band at 1654 cm−1 which is a signature of α-helical proteins. In contrast, CR-induced Cyt c aggregates show no 1654 cm−1 band indicating the absence of α-helix. Two new bands appear at 1614 cm−1 and 1694 cm−1 that are characteristic of an intermolecular β-sheet41–43. These results indicate that the CR-induced Cyt c aggregates are of cross-β structure.
Fig. 8.
Second derivative FT-IR spectra of Cyt c monomers (solid line) and CR-induced protein aggregates (dashed line).
Discussion
CR is an effective AP used in protein and peptide formulations1,4,8. However, CR has been shown to aggregate proteins, for example, aggregation of human growth hormone9,10, interleukin-1 receptor11, and a monoclonal antibody12, and the mechanisms underlying such AP-induced aggregation are not understood. Here we used a model protein Cyt c to show that CR causes protein aggregation by partial rather than global protein unfolding. Cyt c is a unique model protein because it offers various optical and structural probes to monitor its global and local unfolding. Trp fluorescence indicates no change in tertiary structure whereas 695 nm absorbance indicates that a local protein region around Met80 is unfolded prior to CR-induced aggregation (Fig. 4). FT-IR and NMR measurements support the above observation that CR does not significantly perturb Cyt c’s global structure (Fig. 5). Global analysis of all the fluorescence and 695 nm melting curves recorded at various CR concentrations using a 3-state equilibrium unfolding model allowed us to detect an “invisible” partially unfolded intermediate that has essentially the same compact structure as that of the native state but has a local protein region around Met80 unfolded (Fig. 6C). The population of this intermediate increases with the CR concentration leading to more protein aggregation. We further showed that stabilizing this region decreases the CR-induced Cyt c aggregation (Fig. 7).
The results presented here indicate that the local unfolding of the Met80 region leads to protein aggregation. The Ω-loop (residues 70–85; Fig. 1A) that includes the Met80 residue is one of the most hydrophobic regions in the protein44, which might be the reason why its unfolding triggers Cyt c aggregation. Notably, similar partially unfolded forms have been detected in earlier protein folding studies on Cyt c. Amide hydrogen exchange experiments identified the Ω-loop containing the Met80 residue, the so called Red foldon45–47, as one of the least stable and fastest unfolding units in Cyt c40,45,46,48,49. The acid molten globule state populated at low pH under high salt conditions has a native-like Trp fluorescence and far-UV CD similar to the intermediate detected here, but the 695 nm absorbance is not completely absent50–52. The partially unfolded form that is populated when Cyt c interacts with lipid membranes has no 695 nm absorbance and has a decreased far-UV CD and increased fluorescence compared to the native state53, indicating an intermediate with a larger surface area exposed than that of the intermediate populated by CR. It will be interesting to examine in detail how these different partially unfolded intermediates control CR-induced Cyt c aggregation, which will provide insight into the mechanisms of AP-induced protein aggregation under different experimental conditions.
Because of the various optical and structural probes available to monitor Cyt c unfolding, we could identify the nature of the partial unfolding that triggers Cyt c aggregation. It will be interesting to probe how the unfolding of the Met80 region leads to subsequent conformational changes which in turn result in aggregate formation. In addition, determining the structure of AP-induced protein aggregates and comparing them with the structure of the soluble protein might also help in understanding the underlying mechanisms. Our FT-IR results indicate that the aggregates contain a cross-β structure with no presence of an α-helix (Fig. 8), even though the soluble protein is α-helical with no β-sheet (Fig. 1A).
Much of our earlier understanding of how APs induce protein aggregation came from studies on benzyl alcohol (BA). Similar to CR, BA also aggregates proteins, in particular, interferon-γ20, interleukin-1 receptor antagonist21, and human granulocyte colony stimulating factor54. However, BA does not significantly affect global protein stability and structure18,19,21. These studies have proposed that partial rather than global protein unfolding is the cause for protein aggregation, but have not provided any structural insight into the nature of such specific partial unfolding. In our recent work on BA-induced Cyt c aggregation55, we showed that BA causes the local protein region around Met80 to unfold, which results in protein aggregation. Comparing with the results presented here on CR, it seems that the same protein region might act as the “hot-spot” for protein aggregation induced by different APs. This finding suggests that identifying the aggregation “hot-spot” for one AP and stabilizing it might also reduce protein aggregation caused by other APs.
CR differs from BA in terms of the extent to which it causes Cyt c aggregation. The aggregation temperature TmAgg varies with CR at a rate of 23°C/%vol/vol CR (Fig. 3 Inset), whereas for BA, it is 8°C/%vol/vol BA55. At a particular AP concentration, CR aggregates Cyt c at lower temperatures compared to BA, indicating that the AP-induced protein aggregation depends on the nature of the AP. It will be interesting to probe which physical properties of APs control protein aggregation. Such an understanding will help in choosing the right AP in protein formulations that will not cause serious protein aggregation yet offers the desired AP effect. One parameter that will influence the protein aggregation is the hydrophobicity of the AP, because the aggregation of native proteins is caused by the exposure of hydrophobic residues to the solvent upon protein unfolding. There are several parameters that measure the hydrophobicity of small molecules. Solubility is one such parameter. Lower solubility in water is an indication of higher hydrophobicity. CR is soluble in water at concentrations below 2.5% weight/volume, which is less than that of BA (4% weight/volume)56. This might be the reason why CR causes more protein aggregation compared to BA. A more detailed quantitative study is needed to understand the effects of various physical parameters of APs on protein aggregation.
The extent of protein aggregation induced by an AP varies from protein to protein1. Since our results show that the stability of local protein regions rather than the global protein stability controls AP-induced protein aggregation, the variation in the aggregation behavior of proteins might come from the differential stabilities of the aggregation ‘hot-spots’ in those proteins. Two proteins may have similar global stability, but their aggregation pattern can be different because of the differences in the stabilities of their aggregation ‘hot-spots’. In addition, a few exceptions exist in which certain APs were shown to stabilize some proteins57,58 in contrast to what has been observed in general. It will be interesting to probe the differences between these two types of contradictory behaviors to gain further insight into AP-protein interactions.
Acknowledgements
We acknowledge the help of Biophysics and NMR cores in carrying out this work. We thank John Carpenter and Michael Akers for helpful discussions. This work was funded by the School of Pharmacy, University of Colorado Denver. Regina Hutchings was funded by a NIH Leadership training grant in Pharmaceutical Biotechnology (T32GM008732).
Abbreviations
- AP
antimicrobial preservative
- CR
m-cresol
- Cyt c
Cytochrome c
- FT-IR
Fourier transform infrared spectroscopy
- GdmCl
Guanidinium chloride
- ΔG
Gibb’s free energy or thermodynamic stability
- m-value
slope of the decrease of ΔG with denaturant concentration
- NMR
nuclear magnetic resonance
- TmAgg
midpoint aggregation temperature
- aggregation “hot-spot”
a local protein region whose unfolding leads to protein aggregation
Footnotes
The authors declare no conflicts of interest.
References
- 1.Meyer BK, Ni A, Hu B, Shi L. Antimicrobial preservative use in parenteral products: Past and present. J Pharm Sci. 2007;96:3155–3167. doi: 10.1002/jps.20976. [DOI] [PubMed] [Google Scholar]
- 2.Cleland JL, Powell MF, Shire SJ. The development of stable protein formulations - A close look at protein aggregation, deamidation and oxidation. Crit Rev Ther Drug Carrier Syst. 1993;10:307–377. [PubMed] [Google Scholar]
- 3.Akers MJ. Considerations in selecting antimicrobial agents for parental product development. Pharm Technol. 1984;8:36–46. [Google Scholar]
- 4.Akers MJ. Excipient - drug interactions in parental formulations. J Pharm Sci. 2002;91:2283–2300. doi: 10.1002/jps.10154. [DOI] [PubMed] [Google Scholar]
- 5.Jorgensen JT, Mortensen HB, Jorgensen JO. Patient acceptance of Nordiject: A new drug delivery system for growth hormone. DICP: Annals Pharmcother. 1991;25(585–588) doi: 10.1177/106002809102500603. [DOI] [PubMed] [Google Scholar]
- 6.Batorova A, Martinowitz U. Continuous infusion of coagulation factors. Haemophilia. 2002;8:170–177. doi: 10.1046/j.1365-2516.2002.00635.x. [DOI] [PubMed] [Google Scholar]
- 7.Tan EL, Shah HS, Leister KJ, Kozick LM, Pasciak P, Vanderlaan RK, Yu CD, Patel B. Transforming growth factor-alpha (TGF-alpha) in a semisolid dosage form: preservative and vehicle selection. Pharm Res. 1993;10:1238–1242. doi: 10.1023/a:1018940907187. [DOI] [PubMed] [Google Scholar]
- 8.Akers MJ, Vasudevan V, Stickelmeyer M. Formulation development of protein dosage forms. In: Nail SL, Akers MJ, editors. Development and Manufacture of Protein Pharmaceuticals. New York: Kluwer Academic/ Plenum Publishers; 2002. pp. 47–127. [Google Scholar]
- 9.Maa YF, Hsu CC. Aggregation of recombinant human growth hormone induced by phenolic compounds. Int J Pharm. 1996;140:155–168. [Google Scholar]
- 10.Katakam M, Banga AK. Use of poloxamer polymers to stabilize recombinant human growth hormone against various processing stresses. Pharm Dev Technol. 1997;2:143–149. doi: 10.3109/10837459709022619. [DOI] [PubMed] [Google Scholar]
- 11.Remmele RL, Jr, Nightlinger NS, Srinivasan S, Gombotz WR. Interleukin-1 receptor (IL-1RA) liquid formulation development using differential scanning calorimetry. Pharm Res. 1998;15:200–208. doi: 10.1023/a:1011902215383. [DOI] [PubMed] [Google Scholar]
- 12.Gupta S, Kaisheva E. Development of a multidose formulation for a humanized monoclonal antibody using experimental design techniques. AAPS Pharm Sci. 2003;5:1–9. doi: 10.1208/ps050208. [DOI] [PMC free article] [PubMed] [Google Scholar]
- 13.Chi EY, Krishnan S, Randolph TW, Carpenter JF. Physical stability of proteins in aqueous solution: Mechanism and driving forces in nonnative protein aggregation. Pharmaceutical Res. 2003;20:1325–1336. doi: 10.1023/a:1025771421906. [DOI] [PubMed] [Google Scholar]
- 14.Moore WV, Leppert P. Role of aggregated human growth hormone (Hgh) in development of antibodies to Hgh. J Clin Endocrin Metab. 1980;51:691–697. doi: 10.1210/jcem-51-4-691. [DOI] [PubMed] [Google Scholar]
- 15.Ratner RE, Phillips TM, Steiner M. Persistent cutaneous insulin allergy resulting from high molecular weight insulin aggregates. Diabetes. 1990;39:728–733. doi: 10.2337/diab.39.6.728. [DOI] [PubMed] [Google Scholar]
- 16.Thornton CA, Ballow M. Safety of intravenous immunoglobulin. Arch Neurol. 1993;50:135–136. doi: 10.1001/archneur.1993.00540020013009. [DOI] [PubMed] [Google Scholar]
- 17.Fradkin AH, Carpenter JF, Randolph TW. Immunogenicity of aggregates of recombinant human growth hormone in mouse models. J Pharm Sci. 2009;98:3247–3264. doi: 10.1002/jps.21834. [DOI] [PubMed] [Google Scholar]
- 18.Lam XM, Patapoff TW, Nguyen TH. The effect of benzyl alcohol on recombinant human interferon-γ. Pharm Res. 1997;14:725–729. doi: 10.1023/a:1012190120061. [DOI] [PubMed] [Google Scholar]
- 19.Zhang Y, Roy S, Jones LS, Krishnan S, Kerwin BA, Chang BS, Manning MC, Randolph TW, Carpenter JF. Mechanism for benzyl alcohol-induced aggregation of recombinant human interleukin-1-receptor antagonist in aqueous solution. J Pharm Sci. 2004;93:3076–3089. doi: 10.1002/jps.20219. [DOI] [PubMed] [Google Scholar]
- 20.Tobler SA, Holmes BW, Cromwell MEM, Fernandez EJ. Benzyl alcohol-induced destabilization of interferon-γ. J Pharm Sci. 2004;93:1605–1617. doi: 10.1002/jps.10589. [DOI] [PubMed] [Google Scholar]
- 21.Roy S, Katayama D, Dong A, Kerwin BA, Randolph TW, carpenter JF. Temperature dependence of benzyl alcohol - and 8-anilinonaphthalene-1-sulfonate - induced aggregation of recombinant human interleukin-1 receptor antagonist. Biochemistry. 2006;45:3898–3911. doi: 10.1021/bi052132g. [DOI] [PubMed] [Google Scholar]
- 22.Krishna MMG, Lin Y, Mayne L, Englander SW. Intimate view of a kinetic protein folding intermediate: Residue-resolved structure, interactions, stability, folding and unfolding rates, homogeneity. J Mol Biol. 2003;334:501–513. doi: 10.1016/j.jmb.2003.09.070. [DOI] [PubMed] [Google Scholar]
- 23.Mayne L, Englander SW. Two-state vs. multistate protein unfolding studies by optical melting and hydrogen exchange. Protein Sci. 2000;9:1873–1877. doi: 10.1110/ps.9.10.1873. [DOI] [PMC free article] [PubMed] [Google Scholar]
- 24.Sanchez KM, Schlamadinger DE, Gable JE, Kim JE. Förster resonance energy transfer and conformational stability of proteins. An advanced biophysical module for physical chemistry students. J Chem Ed. 2008;85:1253–1256. doi: 10.1021/ed085p1253. [DOI] [PMC free article] [PubMed] [Google Scholar]
- 25.Banci L, Bertini I, Gray HB, Luchinat C, Reddig T, Rosato A, Turano P. Solution structure of oxidized horse heart cytochrome c. Biochemistry. 1997;36:9867–9877. doi: 10.1021/bi970724w. [DOI] [PubMed] [Google Scholar]
- 26.Feng Y, Roder H, Englander SW, Wand AJ, Stefano DLD. Proton resonance assignments of horse ferricytochrome c. Biochemistry. 1989;28:195–203. doi: 10.1021/bi00427a027. [DOI] [PubMed] [Google Scholar]
- 27.Margoliash E, Frohwirt N. Spectrum of horse-heart cytochrome c. Biochem J. 1959;71:570–572. doi: 10.1042/bj0710570. [DOI] [PMC free article] [PubMed] [Google Scholar]
- 28.Bowler BE, May K, Zaragoza T, York P, Dong A, Caughey WS. Destabilizing effects of replacing a surface lysine of cytochrome c with aromatic amino acids: Implications for the denatured state. Biochemistry. 1993;32:183–190. doi: 10.1021/bi00052a024. [DOI] [PubMed] [Google Scholar]
- 29.Pace CN. Determination and analysis of urea and guanidine hydrochloride denaturation curves. Methods Enzymol. 1986;131:266–280. doi: 10.1016/0076-6879(86)31045-0. [DOI] [PubMed] [Google Scholar]
- 30.Santoro MM, Bolen DW. Unfolding free energy changes determined by the linear extrapolation method. 1. Unfolding of phenylmethanesulfonyl alpha-chymotrypsin using different denaturants. Biochemistry. 1988;27:8063–8068. doi: 10.1021/bi00421a014. [DOI] [PubMed] [Google Scholar]
- 31.Santoro MM, Bolen DW. A test of the linear extrapolation of unfolding free energy changes over an extended denaturant concentration range. Biochemistry. 1992;31:4901–4907. doi: 10.1021/bi00135a022. [DOI] [PubMed] [Google Scholar]
- 32.Delaglio F, Grzesiek S, Vuister GW, Zhu G, Pfeifer J, Bax A. NMRPipe: a multidimensional spectral processing system based on UNIX pipes. J Biomol NMR. 1995;6:277–293. doi: 10.1007/BF00197809. [DOI] [PubMed] [Google Scholar]
- 33.Lakowicz JR. Principles of Fluorescence Spectroscopy. 3rd ed. New York: Springer Science; 2006. [Google Scholar]
- 34.Milne JS, Xu Y, Mayne LC, Englander SW. Experimental study of the protein folding landscape: Unfolding reactions in cytochrome c . J Mol Biol. 1999;290:811–822. doi: 10.1006/jmbi.1999.2924. [DOI] [PubMed] [Google Scholar]
- 35.Englander SW, Sosnick TR, Mayne LC, Shtilerman M, Qi PX, Bai Y. Fast and slow folding in cytochrome c. Acc Chem Res. 1998;31:737–744. [Google Scholar]
- 36.Dong A, Huang P, Caughey WS. Protein secondary structures in water from second-derivative amide I infrared spectra. Biochemistry. 1990;29:3303–3308. doi: 10.1021/bi00465a022. [DOI] [PubMed] [Google Scholar]
- 37.Barth A. The infrared absorption of amino acid side chains. Prog Biophys Mol Biol. 2000;74:141–173. doi: 10.1016/s0079-6107(00)00021-3. [DOI] [PubMed] [Google Scholar]
- 38.Myers JK, Pace CN, Scholtz JM. Denaturant m values and heat capacity changes: relation to changes in accessible surface areas of protein unfolding. Protein Science. 1995;4(10):2138–2148. doi: 10.1002/pro.5560041020. [DOI] [PMC free article] [PubMed] [Google Scholar]
- 39.Xu Y, Mayne L, Englander SW. Evidence for an unfolding and refolding pathway in cytochrome c. Nature Struct Biol. 1998;5:774–778. doi: 10.1038/1810. [DOI] [PubMed] [Google Scholar]
- 40.Krishna MMG, Maity H, Rumbley JN, Lin Y, Englander SW. Order of steps in the cytochrome c folding pathway: Evidence for a sequential stabilization mechanism. J Mol Biol. 2006;359:1411–1420. doi: 10.1016/j.jmb.2006.04.035. [DOI] [PubMed] [Google Scholar]
- 41.Dong A, Matsuura J, Manning MC, Carpenter JF. Intermolecular β-sheet results from trifluoroethanol-induced nonnative α-helical structure in β-sheet predominant proteins: Infrared and circular dichroism spectroscopic study. Arch Biochem Biophys. 1998;355:275–281. doi: 10.1006/abbi.1998.0718. [DOI] [PubMed] [Google Scholar]
- 42.Dong A, Meyer JD, Brown JL, Manning MC, Carpenter JF. Comparative Fourier transform infrared and circular dichroism spectroscopic analysis of α1-proteinase inhibitor and ovalbumin in aqueous solution. Arch Biochem Biophys. 2000;383:148–155. doi: 10.1006/abbi.2000.2054. [DOI] [PubMed] [Google Scholar]
- 43.Dong A, Randolph TW, Carpenter JF. Entrapping intermediates of thermal aggregation in α-helical proteins with low concentration of guanidine hydrochloride. J Biol Chem. 2000;275:27689–27693. doi: 10.1074/jbc.M005374200. [DOI] [PubMed] [Google Scholar]
- 44.Margoliash E. Primary structure and evolution of cytochrome c. Proc Natl Acad Sci USA. 1963;50:672–679. doi: 10.1073/pnas.50.4.672. [DOI] [PMC free article] [PubMed] [Google Scholar]
- 45.Bai Y, Sosnick TR, Mayne L, Englander SW. Protein folding intermediates: Native-state hydrogen exchange. Science. 1995;269:192–197. doi: 10.1126/science.7618079. [DOI] [PMC free article] [PubMed] [Google Scholar]
- 46.Maity H, Maity M, Krishna MMG, Mayne L, Englander SW. Protein folding: The stepwise assembly of foldon units. Proc Natl Acad Sci USA. 2005;102:4741–4746. doi: 10.1073/pnas.0501043102. [DOI] [PMC free article] [PubMed] [Google Scholar]
- 47.Englander SW, Mayne L, Krishna MMG. Protein folding and misfolding: Mechanism and Principles. Quarterly Rev Biophysics. 2007;40:287–326. doi: 10.1017/S0033583508004654. [DOI] [PMC free article] [PubMed] [Google Scholar]
- 48.Hoang L, Bédard S, Krishna MMG, Lin Y, Englander SW. Cytochrome c folding pathway: Kinetic native-state hydrogen exchange. Proc Natl Acad Sci USA. 2002;99:12173–12178. doi: 10.1073/pnas.152439199. [DOI] [PMC free article] [PubMed] [Google Scholar]
- 49.Krishna MMG, Lin Y, Rumbley JN, Englander SW. Cooperative omega loops in cytochrome c: Role in folding and function. J Mol Biol. 2003;331:29–36. doi: 10.1016/s0022-2836(03)00697-1. [DOI] [PubMed] [Google Scholar]
- 50.Hagihara Y, Tan Y, Goto Y. Comparison of the conformational stability of the molten globule and native states of horse cytochrome c: Effects of acetylation, urea and guanidine-hydrochloride. J Mol Biol. 1994;237:336–348. doi: 10.1006/jmbi.1994.1234. [DOI] [PubMed] [Google Scholar]
- 51.Goto Y, Hagihara Y, Hamada D, Hoshino M, Nishii I. Acid-induced unfolding and refolding transitions of cytochrome c: A three-state mechanism in H2O and D2O. Biochemistry. 1993;32:11878–11885. doi: 10.1021/bi00095a017. [DOI] [PubMed] [Google Scholar]
- 52.Sinibaldi F, Howes BD, Smulevich G, Ciaccio C, Coletta M, Santucci R. Anion concentration modulates the conformation and stability of the molten globule of cytochrome c. J Biol Inorg Chem. 2003;8:663–670. doi: 10.1007/s00775-003-0462-7. [DOI] [PubMed] [Google Scholar]
- 53.Pinheiro TJT, Elove GA, Watts A, Roder H. Structural and kinetic description of cytochrome c unfolding induced by the interaction with lipid vesicles. Biochemistry. 1997;36:13122–13132. doi: 10.1021/bi971235z. [DOI] [PubMed] [Google Scholar]
- 54.Thirumangalathu R, Krishnan S, Brems DN, Randolph TW, Carpenter JF. Effects of pH, temperature, and sucrose on benzyl alcohol - induced aggregation of recombinant human granulocyte colony stimulating factor. J Pharm Sci. 2006;95:1480–1497. doi: 10.1002/jps.20619. [DOI] [PubMed] [Google Scholar]
- 55.Singh SM, Cabello-Villegas J, Hutchings RL, Mallela KMG. Role of partial protein unfolding in alcohol-induced protein aggregation. Proteins: Struct Func & Bioinform. 2010;78:2625–2637. doi: 10.1002/prot.22778. [DOI] [PMC free article] [PubMed] [Google Scholar]
- 56.O'Neil MJ. The Merck Index - An Encyclopedia of Chemicals, Drugs, and Biologicals. 14th ed. Whitehouse Station, New Jersey, USA: Merck Sharp & Dohme Corp.; [Google Scholar]
- 57.Huus K, Havelund S, Olsen HB, Sigurskjold BW, van de Weert M, Frokjaer S. Ligand binding and thermostability of different allosteric states of the insulin zinc-hexamer. Biochemistry. 2006;45:4014–4024. doi: 10.1021/bi0524520. [DOI] [PubMed] [Google Scholar]
- 58.Goyal MK, Roy I, Amin A, Banerjee UC, Bansal AK. Stabilization of lysozyme by benzyl alcohol: Surface tension and thermodynamic parameters. J Pharm Sci. 2010;99:4149–4161. doi: 10.1002/jps.22129. [DOI] [PubMed] [Google Scholar]
- 59.Kraulis PJ. MOLSCRIPT: a program to produce both detailed and schematic plots of protein structures. J Appl Crystallogr. 1991;24:945–949. [Google Scholar]


