

Abstract
Purpose
To evaluate the immunomodulatory effects of CTLA-4 blockade with tremelimumab in peripheral blood mononuclear cells (PBMC).
Experimental Design
We used next generation sequencing to study the complementarity determining region 3 (CDR3) from the rearranged T cell receptor (TCR) variable beta (V-beta) in PBMC of 21 patients, at baseline and 30–60 days after receiving tremelimumab.
Results
After receiving tremelimumab there was a median of 30% increase in unique productive sequences of TCR V-beta CDR3 in 19 out of 21 patients, and a median decrease of 30% in only 2 out of 21 patients. These changes were significant for richness (p=0.01) and for Shannon index diversity (p=0.04). In comparison, serially collected PBMC from four healthy donors did not show a significant change in TCR V-beta CDR3 diversity over one year. There was a significant difference in the total unique productive TCR V-beta CDR3 sequences between patients experiencing toxicity with tremelimumab compared to patients without toxicity (p=0.05). No relevant differences were noted between clinical responders and non-responders.
Conclusions
CTLA4 blockade with tremelimumab diversifies the peripheral T cell pool, representing a pharmacodynamic effect of how this class of antibodies modulates the human immune system.
INTRODUCTION
Blockade of the negative immune regulatory checkpoint cytotoxic T–lymphocyte-associated protein 4 (CTLA4) results in long-lasting responses in a minority of patients with advanced melanoma. CTLA4 is a co-inhibitory molecule in T cells and is thought to play a critical role in regulating natural immune responses by inhibiting the CD28-B7 costimulatory signaling. Two fully human CTLA4 blocking antibodies, the IgG1 ipilimumab (Yervoy®, formerly MDX010 Bristol-Myers Squibb) and the IgG2 tremelimumab (formerly CP-675,206, Pfizer Inc, now developed by MedImmune/Astra-Zeneca), have been tested in the clinic. Ipilimumab gained regulatory body approvals in many countries based on the demonstration of improved overall survival over a gp100 vaccine or dacarbazine in two randomized clinical trials (1, 2).
Phase I and II testing of the antitumor activity of tremelimumab demonstrated durable tumor regressions, most of them lasting beyond five years, in approximately 10–15% of patients with metastatic melanoma (3). The most common treatment-related serious toxicities with tremelimumab are skin rash and diarrhea/colitis, with a low percent of patients experiencing endocrine abnormalities such as thyroiditis and hypophysitis (4–10). The objective response rate and the rate of grade 3–4 toxicities in patients treated with tremelimumab are very similar to the phase II clinical trials results with ipilimumab in a comparable population of patients (11, 12). However, tremelimumab did not lead to an improvement in overall survival in the reported phase III clinical trial (13). Median overall survival was 12.6 months in the tremelimumab arm compared to 10.7 months in the chemotherapy arm, with the differences being non-statistically significant. There was a high use of ipilimumab in patients randomized to the chemotherapy control arm, which is likely to be the major contributing factor resulting in this negative randomized trial (14, 15).
Studies in blood cells of patients treated with CTLA4 blocking antibodies have reported a mild increase in the absolute lymphocyte count (ALC), with a cut-off value of >1000 lymphocytes correlating with patients with improved outcome after CTLA4 blockade (16, 17). The circulating lymphocytes have increased expression of activation markers mostly on CD4+ T cells (5, 18–21), but most studies have failed to detect a consistent expansion of tumor or viral antigen-specific T cells (5, 19, 21, 22). Pathological analysis of paired tumor biopsies demonstrated that tumor responses are mediated by the intratumoral infiltration of cytotoxic T lymphocytes (CTLs) (18, 19). However, not all patients who had a significant increase in activated intratumoral T cells had a clinical tumor regression (19). Therefore, there remains a need to further understand the immunological effects of CTLA4 blocking antibodies. In this context, we performed deep sequencing of the CDR3 of the TCR V-beta as readout of the change in T cell clonality and diversification in peripheral blood lymphocytes of patients with melanoma treated with tremelimumab.
PATIENTS and METHODS
Clinical trial conduct and sample procurement
Peripheral blood samples were obtained from leukapheresis procedures from 21 patients with metastatic melanoma treated at UCLA in an investigator-initiated phase II clinical trial of single agent tremelimumab (UCLA IRB# 06-06-093, IND# 100453, Trial Registration number NCT00471887) administered at 15 mg/kg every 3 months. Objective clinical responses were recorded following a modified Response Evaluation Criteria in Solid Tumors (RECIST). The modification in the RECIST criteria was to consider measurable disease lesions in the skin and subcutaneous lesions detectable by physical exam, but not by imaging exams, if they were adequately recorded at baseline using a camera with a measuring tape or ruler (23). Toxicities were graded according to the NCI common toxicity criteria version 2.0 during the first 3 months of therapy (one cycle of tremelimumab-based therapy), since the post-dosing leukapheresis was performed only during the first cycle of therapy, most frequently between 30 and 60 days from the first dose of tremelimumab.. Dose limiting toxicities (DLTs) were prospectively defined as any treatment-related toxicity equal or greater than grade 3, or the clinical evidence of grade 2 or higher autoimmune reaction in critical organs (heart, lung, kidney, bowel, bone marrow, musculoskeletal, central nervous system and the eye). PBMC were collected from patients receiving tremelimumab at 15 mg/kg every 90 days by a leukapheresis procedure. Leukapheresis were planned as part of the pre-dosing procedures, and one to two months after receiving the first dose. The post-dosing leukapheresis were performed a median of 41 days after the dose of tremelimumab (range 28 to 81). In all cases, concentrations of tremelimumab in peripheral blood should have been above 10 μg/ml at the time of cell harvesting by leukapheresis, which is the minimum concentration of tremelimumab that stimulated a biological effect consistent with CTLA4 blockade in preclinical studies (24). Processing of blood to obtain PBMC has been previously described (25).
Immunohistochemical and oncogenic analysis of tumor biopsies
Patients underwent baseline and post-dosing biopsies as previously described (19). Biopsy samples were formalin fixed and paraffin embedded (FFPE) and stained by immunohistochemistry (IHC) for CD4 and CD8 T cell markers as previously described (26) with the Simple-PCI imaging system (Version 5.2.1.1609. Compix Inc. Imaging System, Cranberry Township, PA) to quantitatively evaluate T cell infiltrations. The frequency of intratumoral and peritumoral lymphocytes was assessed by analyzing 10 tumor areas from each sample at x200 magnification. The density was compared between pre-treatment and post-treatment biopsies. All samples were analyzed without the knowledge of the patients clinical outcomes (19). For 19 out of 21 patients, next generation sequencing (NGS) was performed in baseline FFPE biopsies. After gDNA extraction they were sequenced with Oncomap v3, a mass spectrometry–based genotyping method to detect 1,047 point mutations in 112 common oncogenes and tumor suppressor genes (20)
Analysis of human TCR V-beta CDR3 repertoire in PBMC
gDNA extraction was performed following the DNeasy Blood & Tissue Kit (Qiagen, Valencia, CA). Proteinase K was used for digestion and DNA extraction was performed following animal blood or cell protocol with RNAse treatment and using spin-column method. Samples were analyzed with high-throughput deep sequencing of the TCR V-beta CDR3 region with the Illumina Genome Analyzer from Adaptive Biotechnologies (Seattle, WA) using the ImmunoSEQ immune profiling system (27) at the deep level. This analysis results in a 5x sequence coverage for T cells from 3.6 ug of genomic DNA, which means an input of 200.000 T cells genomes with an output of 1.000.000 sequences, depending on the proportion of T cells. The product was sequenced and organized providing in-frame and out-of-frame sequences. An algorithm was applied to the in-frame sequences for collapsing reads and resulting in unique in-frame rearrangement of the CDR3 genes. In-frame unique sequences without stop codons are referred as unique productive sequences and are object of this study. Results were compared with PBMC from four healthy donors collected every four months from four different timepoints. The same amount of gDNA was loaded for deep sequencing of the TCR V-beta CDR3 region with subsequent immune profiling at the deep level. This was used as a comparison for melanoma patients.
Statistical Analysis
Statistical measures such as richness (number of unique TCR V- beta CDR3 sequences), the Shannon diversity index (28) and the Pielou’s evenness index (29) were calculated in order to evaluate the diversity of TCR V- beta CDR3 sequences for both patients and healthy donors. The Shannon diversity index was defined as: , where pi is the proportion of sequence i relative to the total N sequences. It accounted for both richness and relative abundance (evenness) of the TCR V- beta CDR3 sequences present in each sample. The larger the Shannon diversity index, the more diverse the distribution of the TCR V- beta CDR3 sequences. The Pielou’s evenness index was defined as: J=H/log(S), where H is the Shannon index and S is the number of unique TCR V- beta CDR3 sequences. Non-parametric Wilcoxon signed-rank test was used to compare the diversity measures before and after treatment among patients. Repeated measure analysis (30) was performed to assess if diversity changed over time for healthy donors. To test the hypothesis that patients with toxicity had higher diversity than those without toxicity, one-tailed Wilcoxon rank-sum test was used. Correlation between change in richness in PBMC and density change observed in CD8 and CD4 in tumor biopsies was assessed by Spearman rank correlation coefficient (31), a robust, non-parametric correlation measure. Comparison of absolute lymphocyte count pre and post treatment was done by Wilcoxon signed-rank test. For all statistical investigations, tests for significance were 2-tailed unless otherwise specified. A p-value less than the 0.05 significance level was considered to be statistically significant. Data analyses were carried out using statistical software R version 3.0.0 (32). The reported p-values for toxicity are obtained from one-tailed Wilcoxon rank-sum test. Clonality values are calculated from entropy of the TCR V- beta CDR3 frequency distribution, and then normalized by log(# unique TCR V-beta CDR3). These values range from 0 (polyclonal distribution) to 1 (monoclonal distribution).
RESULTS
Patient characteristics and outcomes
Among the 21 study patients (Table 1), 14 (66%) had M1c metastatic melanoma (visceral metastasis and/or high LDH), and the remaining had either in-transit (stage IIIc) or soft tissue and nodal metastasis (M1a). Toxicities were graded during the first 3 months of therapy, corresponding to the timing of leukapheresis to collect PBMC for the current analyses. Among these patients there were three with toxicities that met the definition of dose limiting toxicities (DLTs) as defined in the clinical trial protocols. These included four cases of grade 3 diarrhea or colitis and one patient with symptomatic panhypopituitarism (grade 2 hypophysitis). None of these patients received corticosteroids before the collection of PBMCs for analysis from the post-dosing leukapheresis. Four patients had an objective tumor response, resulting in sustained and durable complete tumor regressions in three of them (GA18, GA29 and GA33), while the other patient (GA5) had a partial response lasting 7 months followed by progression. All of them presented with normal levels of LDH and the three patients with a durable CR (had stage IIIc or M1a. There was no apparent association between the oncogenic driver mutation analysis for the tumor specimens and clinical response. Three of the patients with an objective response (GA5, GA29 and GA33) had BRAFV600E mutations, while one (GA18) had a NRASQ61K mutation (Table 1).
Table 1.
Patients characteristics from patients included in the PBMC study for TCR V-beta CDR3 sequencing.
| Patient Study# | Sex (M/F) | Eth. | Age | Active Metastasis site |
LDH | Stage | Mutational status | Toxicities* | Response at EOS | PFS (mo) | OS (mo) |
|---|---|---|---|---|---|---|---|---|---|---|---|
| GA 5 | M | C | 65 | Skin, LN, Adrenal | N | M1c | BRAF V600E | - | PR (but PD after EOS) | 7 | 20 |
| GA 7 | M | C | 62 | Skin | N | IIIc | BRAF_V600E | G2 Pruritus | PD | 2 | 67 |
| GA 8 | F | C | 48 | S.C. | High | M1c | BRAF_V600E | G2 Diarrhea | PD | 1 | 3 |
| GA 9 | M | C | 52 | LN, Bone | High | M1c | BRAF_V600E | - | PD | 3 | 14 |
| GA 11 | M | C | 47 | LN | High | M1c | NRAS_Q61R | - | PD | 2 | 7 |
| GA 12 | M | C | 76 | Skin | High | M1c | BRAF_V600E | G3 Colitis | Off due to AE/PD | 2 | 20 |
| GA 13 | M | C | 37 | LN | N | M1a | BRAF_V600E | G2 Hypophysitis | PD | 3 | 13 |
| GA 14 | M | C | 38 | SC, Muslce | High | M1c | HRAS_G12D BRAF_V600E PTEN_N323fs |
G1 Diarrhea | PD | 3 | 15 |
| GA 15 | M | C | 58 | Brain, Bowel, Liver | N | M1c | NRAS_Q61R | G3 Rash | PD | 4 | 15 |
| GA 18 | F | C | 49 | Skin | N | M1a | NRAS_Q61R | G1 Diarrhea | CR | 62+ | 62+ |
| GA 19 | M | C | 55 | LN, Brain | N | M1c | NRAS_Q61R TP53_R175H CTNNB1_S37F |
G3 Diarrhea G2 Rash |
PD | 3 | 36 |
| GA 21 | M | C | 71 | Skin, SC, LN, Liver, Spleen | High | M1c | KIT_L576P | - | PD | 3 | 8 |
| GA 23 | M | C | 27 | Lung | N | M1b | - | PD | 2 | 4 | |
| GA 24 | M | C | 81 | SC, Lung | High | M1c | Not detected | G1 Nausea | PD | 2 | 3 |
| GA 25 | M | H | 71 | LN | High | M1c | KIT_N822K | - | PD | 3 | 8 |
| GA 26 | M | C | 68 | LN, Lung | N | M1b | BRAF_V600E | G3 Diarrhea G1 Grover’s |
PD | 1 | 51 |
| GA 27 | M | C | 52 | Axillary, Clavicular | High | M1c | BRAF_V600E CDKN2A_E61* PIK3CA_3545K |
G2 Pruritus G1 Diarrhea G1 Hypophysitis | PD | 6 | 11 |
| GA 28 | M | C | 48 | LN, Lung | High | M1c | BRAF_G466E EGFR_P753S ABL1_E255K |
- | PD | 2 | 4 |
| GA 29 | F | C | 79 | Skin, S.C. | N | IIIc | BRAF_V600E KIT_V559A |
G3 Diarrhea G1 Pruritus |
CR | 45 | 45 |
| GA 32 | M | C | 36 | Muscle | N | M1c | - | PD | 5 | 56 | |
| GA 33 | F | C | 49 | Skin | N | IIIc | BRAF_V600E | G2 Adrenal insuficiency | CR | 55+ | 55+ |
M: Male; F: Female; C: Caucasian; H: Hispanic; LN: Lymph nodes; SC: Subcutaneous; N: Normal; Neg: Negative. EOS: End of study; PD: Progressive disease; PR: Partial response; CR: Complete response; AE: Adverse effects: PFS: Progression free survival; OS: Overall survival
Changes in the Absolute Lymphocyte Count (ALC)
There was a median increase in ALC of 11.1% (ranging from decrease of 37.9% to increase of 80%) from baseline to day 30–60 without overall significant changes in this series of samples (p=0.18). Three out of 21 patients started with a baseline count lower than 1000 lymphocytes, and none of these patients had an objective response. The ALC after treatment with a cut-off value of >1000 lymphocytes has been previously reported to be correlated with patients with improved outcome after CTLA4 blockade (17, 33). In our series, all four responders had baseline and post-dosing counts above 1000 lymphocytes. However, two of them (GA29 and GA33) experienced a decrease in ALC comparing baseline to the post-tremelimumab values.
Increased TCR V-beta CDR3 richness and Shannon index diversity with CTLA4 blockade
To examine the dynamics of the CD8+ T cell repertoire upon anti-CTLA4 treatment, we first analyzed the general yields from the high-throughput TR sequencing data (Supplemental Table 1). In this series of 21 patients, the average number of productive unique TCR V-beta CDR3 sequences was 87,867 per sample at baseline and 108,150 per sample one month after starting the treatment. The mean increase in the total number of productive sequences was 24%. This increase was consistent in 19 of 21 patients, experiencing increases between 11% to 73.6%. Only two patients treated with tremelimumab experienced a decrease (GA28 and GA23) in their total repertoire up to 30% (Figure 1). Both these patients had rapid disease progression and died within 4 months of starting on study (Table 1). To visually understand the diversity and changes across patients, we generated rank-rank scatter plot figures for each patient (34). Rank-rank scatterplots show the degree of overlap and shift in the relative abundances from baseline to post-dosing of each sequence. Sequences are ranked in descending order by frequency in the x-axis for baseline and y-axis for post-dosing, with the most highly abundant sequences proximal to the origin. Sequences not present in either the baseline or post-dosing samples are assigned a frequency of 0 and are represented by the last rank on the axis. Increases in diversity after treatment are shown as an increase in the number of absent baseline sequences along the x-axis. Decreases in diversity after treatment are shown as an increase in the number of absent post-dosing samples along the y axis. Points are binned and colored on a log scale with red showing the greatest density of points. Figure 2 shows three representative examples on how the TCR repertoire can change after treatment towards an increase (n=14 cases of 21) (Figure 2A), decrease (n=2) (Figure 2B) or minimal change (n=5) (Figure 2C) in the total repertoire (the complete scatter plots for all patients are shown in Supplemental Figure 1). The sequencing method also displays the complete V and J segment usage for each TCR. However, there was no statistical differences in usage of V or J (data not shown).
Figure 1. Change in absolute number of unique productive sequences.
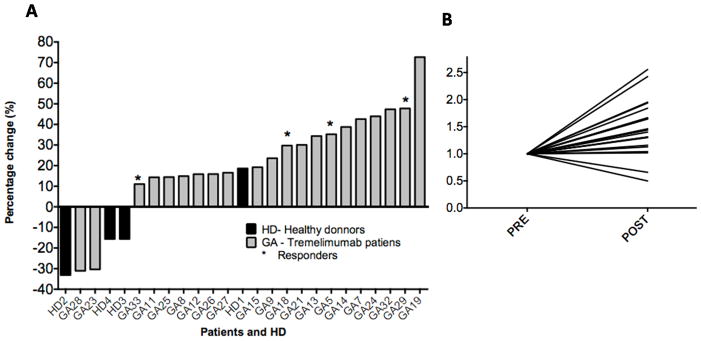
A.) Changes reported between baseline and post-tremelimumab samples from 21 patients with melanoma (GA, in black) and from four healthy donors (HD, in grey). B) Normalized TCR V-beta CDR3 repertoire diversity. Analysis comparing baseline and post-tremelimumab PBMC samples. The values were normalized to 1, to show increase and decrease after treatment in a comparable manner.
Figure 2. Rank-rank scatter plot analysis of all the TCR V-beta CDR3 sequences.

Rank-rank scatter plot matching up baseline and post-tremelimumab samples from three representative patients. Each sequence was ranked according to clone abundance from highest frequency (rank 1 = 0) to lowest frequency. This provides a visual representation of the changes between baseline (x axis) and post-treatment (y axis) distributions. Example of A) an increase (GA5), B) a decrease (GA23), and C) of minimal change (GA33) in the TCR V-beta CDR3 repertoire. Scatter plots for all patients are shown in Supplemental Figure 1.
We compared the results of TCR V-beta CDR3 sequencing in PBMC from patients treated with CTLA4 blockade with the serial collection of PBMC from four healthy donors (four time points separated by four months each). For these healthy donors, richness (number of unique productive sequences) and the Shannon diversity index (distribution of the sample) were calculated for each sample at each timepoint. There were no differences over time in either analysis (p=0.93 and p= 0.68, respectively), suggesting that these four healthy donors had little change in their peripheral TCR V-beta CDR3 repertoire during the one year sampling time. The same analysis performed in samples of patients with melanoma treated with tremelimumab comparing baseline and post-treatment samples showed a significant increase in richness (p=0.001 by Wilcoxon sign-rank test), which occurs with a corresponding increase in the total number of productive TCR V-beta CDR3 sequences. The Shannon diversity index was significantly larger post-treatment (p=0.04 by Wilcoxon sign-rank test, Figure 3). The Shannon diversity index incorporates a combination of richness and evenness. Increases in the diversity index were not attributed to changes in the distribution itself because of a non-significant change in the Pielou’s evenness index (p=0.5), but instead an increase of the total TCR V-beta CDR3 repertoire itself.
Figure 3. Richness and Shannon index for diversity.

Differences in richness for total number of unique productive sequences (p=0.001) (A), and Shannon index for diversity of the repertoire (p=0.04) (B).
Productive unique sequences were ranked according to their abundance and the top clones were selected up to the point that their sum was equal to 25%. These top 25% abundant clones have been reported to be the most frequent and feasible to track over time (35), avoiding the noise from the most infrequent clones present in blood. In our samples this ranged from 4 to 5185 sequences. In this subgroup of unique productive sequences the increase was particularly impressive (Supplemental Table 3). Nine out of 21 (43%) of the paired samples had an increase of two fold or more, including three of the clinical responders (GA5, GA18, GA29). The responding patient GA33 experienced a small decrease in TCR V-beta CDR3 diversity. Only two out of 21 (9%) had a decrease in the diversity of two fold or more. The changes in unique productive sequences reported in Table 2 correlate with a highly polyclonal population, with values of clonality ranging between 0.068 and 0.27. However, the increase in diversity (richness and Shannon diversity index) does not always correlate with a more polyclonal population. ln fact, despite only two patients (GA23 and GA28) having a decrease in richness, 12 patients showed increase in clonality. In comparison, none of the samples from the four healthy donors had changes over 2 fold when focusing on the top 25% abundant clones (except timepoint four in HD4, considered an outlier sample, Supplemental Table 2).
Considering that we observed an increase in the ALC, we questioned if the increase in richness was linked to the increase seen in peripheral lymphocytes counts. However we identified five patients (GA8, GA12, GA24, GA 29 and GA33) with decreases in the ALC who nevertheless demonstrated an increase in the number of unique productive sequences. Correlation analysis showed there was no trend (R=0.001) and no significant correlation (p=0.1) between changes in ALC and changes in unique productive sequences (Supplemental Figure 2). This analysis emphasizes the consistent trend of increased unique productive sequences upon treatment, and de-emphasizes the more random and diverse changes in ALC.
Weak correlation between TCR V-beta CDR3 diversity in blood and intratumoral CD8 T cell infiltration
Figure 4 summarizes the changes in TCR V-beta CDR3 diversity for each patient and the fold-changes in density of T cells analyzed in paired baseline and post-tremelimumab biopsies from the same patients, as previously reported by our group (19). We had quantitated changes in density for CD4 and CD8 in the intratumoral and peritumoral sections of tumor biopsies stained by IHC. In that work we noted between 1-fold and 100-fold increase in the intratumoral infiltration by CD8+ T cells in 14 out of 18 evaluable cases regardless of clinical tumor response or progression. There was no difference between the absolute number, location or cell density of infiltrating cells between clinical responding and non-responding lesions. In the current context, our interest was to study if the differences in TCR V-beta CDR3 diversity in peripheral blood would correlate with the differences in CD8+ T cell infiltration in tumor biopsies. In patients with increased TCR V-beta CDR3 diversity in PBMC, the Spearman correlation coefficient showed a positive trend in all cases comparing fold-changes in richness to increased T cell infiltration. CD8 peritumoral infiltration was the strongest correlations and statistical significance (Spearman correlation coefficient; (rho) = 0.66, p=0.01, Figure 4).
Figure 4.

Correlation between fold-changes in top 25% abundant clones (x axis) vs fold-changes in CD4/CD8 density (y axis) at baseline and day 30–60, for CD4 intratumoral infiltration (ITI, A), CD4 peritumoral infiltration (PTI, B), CD8 ITI (C) and CD8 PTI (D).
TCR V-beta CDR3 diversity analyzed in relation to clinical response and toxicity after CTLA4 blockade
There were no significant differences in the total unique productive TCR V-beta CDR3 sequences between the four patients with an objective response to tremelimumab compared to patients without a tumor response, either in baseline or in post-treatment samples (p=0.62 and 0.39 for baseline and post-treatment respectively, two-tailed Wilcoxon rank-sum test). We thus reasoned that the changes in TCR V-beta CDR3 usage detected in peripheral blood may reflect a broader effect of CTLA4 blockade on the immune system, as opposed to the stimulation of melanoma-specific T cells. Therefore, the TCR V-beta CDR3 diversity changes may reflect expansion of auto-reactive T cells leading to the clinically observed autoimmune toxicities of CTLA4 blocking monoclonal antibodies. This was studied by analyzing the potential correlation between TCR V-beta CDR3 diversity and the development of toxicities after administration of tremelimumab. Our results show that samples from patients with toxicity had richer and more diversely distributed TCR V-beta CDR3 sequences in the post-treatment samples compared to patients without toxicities (p=0.05, one tailed Wilcoxon rank-sum test, Figure 5). Baseline samples had the same trend, but were not statistically significant as a predictive factor for toxicity (richness p=0.30 and Shannon diversity index p=0.12, by Wilcoxon rank-sum test). Interestingly, patients those developing toxicity were the ones showing higher increases in the total number of unique productive sequences after treatment (p=0.04, one tailed Wilcoxon rank-sum test).
Figure 5.
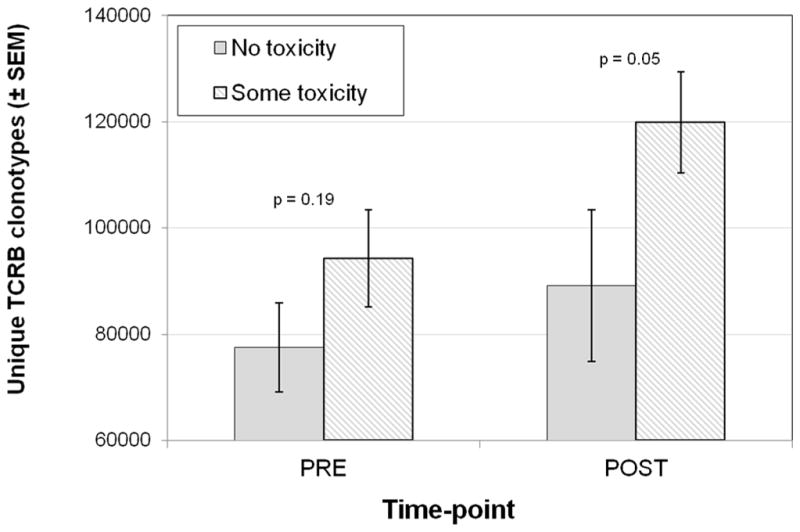
Changes in number of unique TCR V-beta CDR3 sequences related to toxicity during the first 3 months of therapy with tremelimumab.
DISCUSSION
CTLA-4 blockade provides long-lasting tumor remissions resultant from a T cell response to cancer, but it is not fully understood how these antibodies impact on the human immune system to induce durable tumor responses or autoimmune toxicities. Our studies show an expansion of the total number of unique productive TCR V-beta CDR3 sequences in blood after CTLA4 blockade, reflecting a larger T cell diversity in blood after treatment. There was an increase in the total amount of unique productive sequences, but no expansion of specific clones towards predominance on top of the others, suggesting that this mode of therapy does not result in the specific clonal expansion of T cells to cancer detectable in blood.
Our data is consistent with an immunological effect of CTLA4 blockade mediated by a non-specific T cell proliferation and increased release to circulation, which is congruent with prior data from the literature. Evidence from many groups shows that the anti-CTLA4 antibodies tremelimumab and ipilimumab do not generally expand the number or function of tumor antigen-specific CD8 or CD4 T cells in peripheral blood (4, 5, 25, 36), even though this has been reported anecdotally in occasional patients (22, 37–39). The release of the CTLA4 checkpoint, which limits T cell replication, with CTLA4 blocking antibodies was demonstrated in ten of the patients included in this same series who underwent positron emitting tomography (PET) imaging using the PET tracer [18F] fluoro-L-thymidine ([18F]FLT) (21). [18F]FLT PET provides a non-invasive imaging for cell replication at the whole body level. Post-dosing [18F]FLT scans demonstrated increased uptake in the spleen, which is the largest lymphoid organ, consistent with the release of the CTLA4 cell cycle checkpoint in patients treated with tremelimumab. This prior finding suggests the induction of proliferation of T lymphocytes in lymphoid organs, which may contribute to the observation of increased ALC in blood after treatment with CTLA4 blocking antibodies. CTLA4-mediated checkpoint release may also account for the longstanding detection of increase in T cell activation markers on T cells after the administration of these antibodies, including HLA-DR and inducible costimulator (ICOS) (4, 5, 36, 40–42), and our current finding of increased diversity of the TR repertoire after CTLA4 blockade.
The increase in diversity of TCR V-beta CDR3 in peripheral blood may reflect a pharmacodynamic effect of the anti-CTLA4 antibody therapy that is more related to a general ability of that patient’s immune system to be activated, rather than a correlation with tumor responses. As such, we report that the diversity change has an association with the development of toxicities after receiving tremelimumab. Prior studies to understand the mechanism of the autoimmune and inflammatory toxicities resultant from CTLA4 blockade have focused on the evidence that in some patients there is an increase in IL-17-producing T cells (Th17 cells), since IL-17 is a known mediator of colitis (43). Our findings suggest that the patients more likely to develop toxicity expanded the number of unique productive sequences, which may in part reflect mobilization of autoreactive T cells.
In conclusion, we report an increased diversity of T cells (richness and Shannon diversity index) in blood after CTLA4 blockade, with no specific expansion of clonal populations. This increased T cell diversity, together with their increased T cell activation state, may be mechanistically linked to the development of tumor responses and toxicities in patients treated with CTLA4 blocking antibodies.
Supplementary Material
TRANSLATIONAL RELEVANCE.
By applying next generation sequencing of T cell receptor (TCR) variable genes in blood of patients treated with an anti-CTLA4 antibody, this study demonstrated a remarkable effect of this therapy expanding the number of unique TCR V-beta in blood. Therefore, CTLA4 blockade impacts the human immune system expanding the pool of circulating T cells, which may be mechanistically related to the induction of autoimmune and inflammatory toxicities.
Acknowledgments
Harlan Robins is a founder and officer at Adaptive Biotechnologies, the company that performed the TCR V-beta CDR3 sequencing.
This work was funded by the Melanoma Research Foundation (MRF), NIH grants 2U54 CA151819, R01 CA170689 and P01 CA168585, The Seaver Institute, the Dr. Robert Vigen Memorial Fund, the Wesley Coyle Memorial Fund, the Garcia-Corsini Family Fund, the Louise Belley and Richard Schnarr Fund, the Bila Alon Hacker Memorial Fund, the Fred L. Hartley Family Foundation, the Ruby Family Foundation, the Jonsson Cancer Center Foundation, and the Caltech-UCLA Joint Center for Translational Medicine (to A.R.). AR is supported by a Stand Up To Cancer Dream Team Translational Cancer Research Grant, a Program of the Entertainment Industry Foundation (SU2C-AACR-DT0403). L.R. was supported by the V Foundation-Gil Nickel Family Endowed Fellowship in Melanoma Research and by a scholarship from the Spanish Society of Medical Oncology (SEOM) for Translational Research in Reference Centers. B.H. was supported by the Rio Ortega Scholarship from the Hospital 12 de Octubre, Madrid, Spain. J.T. is supported by NIH T32-CA009120-36. T.G.G. was supported by a Research Scholar Award from the American Cancer Society (RSG-12-257-01-TBE), NIH/National Center for Advancing Translational Science (NCATS) UCLA CTSI Grant Number UL1TR000124 and an Established Investigator Award from the Melanoma Research Alliance (20120279).
Footnotes
The rest of the co-authors have no conflict of interest.
References
- 1.Chapman PB, Hauschild A, Robert C, Haanen JB, Ascierto P, Larkin J, et al. Improved survival with vemurafenib in melanoma with BRAF V600E mutation. The New England journal of medicine. 2011;364(26):2507–16. doi: 10.1056/NEJMoa1103782. [DOI] [PMC free article] [PubMed] [Google Scholar]
- 2.Hodi FS, O’Day SJ, McDermott DF, Weber RW, Sosman JA, Haanen JB, et al. Improved survival with ipilimumab in patients with metastatic melanoma. The New England journal of medicine. 2010;363(8):711–23. doi: 10.1056/NEJMoa1003466. [DOI] [PMC free article] [PubMed] [Google Scholar]
- 3.Camacho LH, Antonia S, Sosman J, Kirkwood JM, Gajewski TF, Redman B, et al. Phase I/II trial of tremelimumab in patients with metastatic melanoma. Journal of clinical oncology : official journal of the American Society of Clinical Oncology. 2009;27(7):1075–81. doi: 10.1200/JCO.2008.19.2435. [DOI] [PubMed] [Google Scholar]
- 4.Phan GQ, Yang JC, Sherry RM, Hwu P, Topalian SL, Schwartzentruber DJ, et al. Cancer regression and autoimmunity induced by cytotoxic T lymphocyte-associated antigen 4 blockade in patients with metastatic melanoma. Proc Natl Acad Sci U S A. 2003;100(14):8372–7. doi: 10.1073/pnas.1533209100. [DOI] [PMC free article] [PubMed] [Google Scholar]
- 5.Sanderson K, Scotland R, Lee P, Liu D, Groshen S, Snively J, et al. Autoimmunity in a phase I trial of a fully human anti-cytotoxic T-lymphocyte antigen-4 monoclonal antibody with multiple melanoma peptides and Montanide ISA 51 for patients with resected stages III and IV melanoma. Journal of clinical oncology : official journal of the American Society of Clinical Oncology. 2005;23(4):741–50. doi: 10.1200/JCO.2005.01.128. [DOI] [PubMed] [Google Scholar]
- 6.Ribas A, Camacho LH, Lopez-Berestein G, Pavlov D, Bulanhagui CA, Millham R, et al. Antitumor activity in melanoma and anti-self responses in a phase I trial with the anti-cytotoxic T lymphocyte-associated antigen 4 monoclonal antibody CP-675,206. Journal of clinical oncology : official journal of the American Society of Clinical Oncology. 2005;23(35):8968–77. doi: 10.1200/JCO.2005.01.109. [DOI] [PubMed] [Google Scholar]
- 7.Hodi FS, Mihm MC, Soiffer RJ, Haluska FG, Butler M, Seiden MV, et al. Biologic activity of cytotoxic T lymphocyte-associated antigen 4 antibody blockade in previously vaccinated metastatic melanoma and ovarian carcinoma patients. Proc Natl Acad Sci U S A. 2003;100(8):4712–7. doi: 10.1073/pnas.0830997100. [DOI] [PMC free article] [PubMed] [Google Scholar]
- 8.Attia P, Phan GQ, Maker AV, Robinson MR, Quezado MM, Yang JC, et al. Autoimmunity correlates with tumor regression in patients with metastatic melanoma treated with anti-cytotoxic T-lymphocyte antigen-4. Journal of clinical oncology : official journal of the American Society of Clinical Oncology. 2005;23(25):6043–53. doi: 10.1200/JCO.2005.06.205. [DOI] [PMC free article] [PubMed] [Google Scholar]
- 9.Robinson MR, Chan CC, Yang JC, Rubin BI, Gracia GJ, Sen HN, et al. Cytotoxic T lymphocyte-associated antigen 4 blockade in patients with metastatic melanoma: a new cause of uveitis. J Immunother. 2004;27(6):478–9. doi: 10.1097/00002371-200411000-00008. [DOI] [PubMed] [Google Scholar]
- 10.Blansfield JA, Beck KE, Tran K, Yang JC, Hughes MS, Kammula US, et al. Cytotoxic T-lymphocyte-associated antigen-4 blockage can induce autoimmune hypophysitis in patients with metastatic melanoma and renal cancer. J Immunother. 2005;28(6):593–8. doi: 10.1097/01.cji.0000178913.41256.06. [DOI] [PMC free article] [PubMed] [Google Scholar]
- 11.O’Day SJ, Maio M, Chiarion-Sileni V, Gajewski TF, Pehamberger H, Bondarenko IN, et al. Efficacy and safety of ipilimumab monotherapy in patients with pretreated advanced melanoma: a multicenter single-arm phase II study. Annals of oncology : official journal of the European Society for Medical Oncology/ESMO. 2010;21(8):1712–7. doi: 10.1093/annonc/mdq013. [DOI] [PubMed] [Google Scholar]
- 12.Kirkwood JM, Lorigan P, Hersey P, Hauschild A, Robert C, McDermott D, et al. Phase II trial of tremelimumab (CP-675,206) in patients with advanced refractory or relapsed melanoma. Clinical cancer research : an official journal of the American Association for Cancer Research. 2010;16(3):1042–8. doi: 10.1158/1078-0432.CCR-09-2033. [DOI] [PubMed] [Google Scholar]
- 13.Ribas A, Kefford R, Marshall MA, Punt CJ, Haanen JB, Marmol M, et al. Phase III randomized clinical trial comparing tremelimumab with standard-of-care chemotherapy in patients with advanced melanoma. Journal of clinical oncology : official journal of the American Society of Clinical Oncology. 2013;31(5):616–22. doi: 10.1200/JCO.2012.44.6112. [DOI] [PMC free article] [PubMed] [Google Scholar]
- 14.Wilson KS, Kotb R. Is Tremelimumab Beneficial in Advanced Melanoma. Journal of Clinical Oncology. 2013 doi: 10.1200/JCO.2013.49.6158. [DOI] [PubMed] [Google Scholar]
- 15.Ribas A. Reply to KS Wilson et al. Journal of Clinical Oncology. 2013 doi: 10.1200/JCO.2013.50.2120. [DOI] [PubMed] [Google Scholar]
- 16.Wilgenhof S, Du Four S, Everaert H, Neyns B. Patterns of response in patients with pretreated metastatic melanoma who received ipilimumab 3 mg/kg in a European expanded access program: five illustrative case reports. Cancer investigation. 2012;30(10):712–20. doi: 10.3109/07357907.2012.727934. [DOI] [PMC free article] [PubMed] [Google Scholar]
- 17.Ku GY, Yuan J, Page DB, Schroeder SE, Panageas KS, Carvajal RD, et al. Single-institution experience with ipilimumab in advanced melanoma patients in the compassionate use setting: lymphocyte count after 2 doses correlates with survival. Cancer. 2010;116(7):1767–75. doi: 10.1002/cncr.24951. [DOI] [PMC free article] [PubMed] [Google Scholar]
- 18.Ribas A, Comin-Anduix B, Chmielowski B, Jalil J, de la Rocha P, McCannel TA, et al. Dendritic cell vaccination combined with CTLA4 blockade in patients with metastatic melanoma. Clinical cancer research : an official journal of the American Association for Cancer Research. 2009;15(19):6267–76. doi: 10.1158/1078-0432.CCR-09-1254. [DOI] [PMC free article] [PubMed] [Google Scholar]
- 19.Huang RR, Jalil J, Economou JS, Chmielowski B, Koya RC, Mok S, et al. CTLA4 blockade induces frequent tumor infiltration by activated lymphocytes regardless of clinical responses in humans. Clinical cancer research : an official journal of the American Association for Cancer Research. 2011;17(12):4101–9. doi: 10.1158/1078-0432.CCR-11-0407. [DOI] [PMC free article] [PubMed] [Google Scholar]
- 20.MacConaill LE, Campbell CD, Kehoe SM, Bass AJ, Hatton C, Niu L, et al. Profiling critical cancer gene mutations in clinical tumor samples. PloS one. 2009;4(11):e7887. doi: 10.1371/journal.pone.0007887. [DOI] [PMC free article] [PubMed] [Google Scholar]
- 21.Ribas A, Benz MR, Allen-Auerbach MS, Radu C, Chmielowski B, Seja E, et al. Imaging of CTLA4 blockade-induced cell replication with (18)F-FLT PET in patients with advanced melanoma treated with tremelimumab. Journal of nuclear medicine : official publication, Society of Nuclear Medicine. 2010;51(3):340–6. doi: 10.2967/jnumed.109.070946. [DOI] [PubMed] [Google Scholar]
- 22.Klein O, Ebert LM, Nicholaou T, Browning J, Russell SE, Zuber M, et al. Melan-A-specific cytotoxic T cells are associated with tumor regression and autoimmunity following treatment with anti-CTLA-4. Clinical cancer research : an official journal of the American Association for Cancer Research. 2009;15(7):2507–13. doi: 10.1158/1078-0432.CCR-08-2424. [DOI] [PubMed] [Google Scholar]
- 23.Comin-Anduix B, Sazegar H, Chodon T, Matsunaga D, Jalil J, von Euw E, et al. Modulation of cell signaling networks after CTLA4 blockade in patients with metastatic melanoma. PloS one. 2010;5(9):e12711. doi: 10.1371/journal.pone.0012711. [DOI] [PMC free article] [PubMed] [Google Scholar]
- 24.Ribas A, Hanson DC, Noe DA, Millham R, Guyot DJ, Bernstein SH, et al. Tremelimumab (CP-675,206), a cytotoxic T lymphocyte-associated antigen 4 blocking monoclonal antibody in clinical development for patients with cancer. Oncologist. 2007;12(7):873–83. doi: 10.1634/theoncologist.12-7-873. [DOI] [PubMed] [Google Scholar]
- 25.Butterfield LH, Comin-Anduix B, Vujanovic L, Lee Y, Dissette VB, Yang JQ, et al. Adenovirus MART-1-engineered autologous dendritic cell vaccine for metastatic melanoma. J Immunother. 2008;31(3):294–309. doi: 10.1097/CJI.0b013e31816a8910. [DOI] [PMC free article] [PubMed] [Google Scholar]
- 26.Ribas A, Comin-Anduix B, Economou JS, Donahue TR, de la Rocha P, Morris LF, et al. Intratumoral immune cell infiltrates, FoxP3, and indoleamine 2,3-dioxygenase in patients with melanoma undergoing CTLA4 blockade. Clinical cancer research : an official journal of the American Association for Cancer Research. 2009;15(1):390–9. doi: 10.1158/1078-0432.CCR-08-0783. [DOI] [PubMed] [Google Scholar]
- 27.Robins HS, Campregher PV, Srivastava SK, Wacher A, Turtle CJ, Kahsai O, et al. Comprehensive assessment of T-cell receptor beta-chain diversity in alphabeta T cells. Blood. 2009;114(19):4099–107. doi: 10.1182/blood-2009-04-217604. [DOI] [PMC free article] [PubMed] [Google Scholar]
- 28.Shannon CE. A mathematical theory of communication. The Bell System Technical Journal. 1948 [Google Scholar]
- 29.Pielou BC. Species-Diversity and Pattern-Diversity in the Study of ecological Succession. Journal of Theoretical Biology. 1966 doi: 10.1016/0022-5193(66)90133-0. [DOI] [PubMed] [Google Scholar]
- 30.Fitzmaurice GM, Ravichandran C. A primer in longitudinal data analysis. Circulation. 2008;118(19):2005–10. doi: 10.1161/CIRCULATIONAHA.107.714618. [DOI] [PubMed] [Google Scholar]
- 31.Lehmann EL, D’Abrera HJM. Nonparametrics: Statistical Methods Based on Ranks. Englewood Cliffs; 1998. [Google Scholar]
- 32.Team RC. A language and environment for statistical computing. 2013 [Google Scholar]
- 33.Wilgenhof S, Du Four S, Vandenbroucke F, Everaert H, Salmon I, Lienard D, et al. Single-center experience with ipilimumab in an expanded access program for patients with pretreated advanced melanoma. J Immunother. 2013;36(3):215–22. doi: 10.1097/CJI.0b013e31828eed39. [DOI] [PubMed] [Google Scholar]
- 34.Plaisier S, Taschereau R, Wong J, Graeber T. Rank-rank hypergeometric overlap: identification of statistically significant overlap between gene-expression signatures. Nucleic Acids Res. 2010;38(17):e169. doi: 10.1093/nar/gkq636. [DOI] [PMC free article] [PubMed] [Google Scholar]
- 35.Neller MA, Burrows JM, Rist MJ, Miles JJ, Burrows SR. High frequency of herpesvirus-specific clonotypes in the human T cell repertoire can remain stable over decades with minimal turnover. Journal of virology. 2013;87(1):697–700. doi: 10.1128/JVI.02180-12. [DOI] [PMC free article] [PubMed] [Google Scholar]
- 36.Maker AV, Attia P, Rosenberg SA. Analysis of the cellular mechanism of antitumor responses and autoimmunity in patients treated with CTLA-4 blockade. J Immunol. 2005;175(11):7746–54. doi: 10.4049/jimmunol.175.11.7746. [DOI] [PMC free article] [PubMed] [Google Scholar]
- 37.Ribas A, Glaspy JA, Lee Y, Dissette VB, Seja E, Vu HT, et al. Role of dendritic cell phenotype, determinant spreading, and negative costimulatory blockade in dendritic cell-based melanoma immunotherapy. J Immunother. 2004;27(5):354–67. doi: 10.1097/00002371-200409000-00004. [DOI] [PubMed] [Google Scholar]
- 38.Yuan J, Gnjatic S, Li H, Powel S, Gallardo HF, Ritter E, et al. CTLA-4 blockade enhances polyfunctional NY-ESO-1 specific T cell responses in metastatic melanoma patients with clinical benefit. Proc Natl Acad Sci U S A. 2008;105(51):20410–5. doi: 10.1073/pnas.0810114105. [DOI] [PMC free article] [PubMed] [Google Scholar]
- 39.Liakou CI, Kamat A, Tang DN, Chen H, Sun J, Troncoso P, et al. CTLA-4 blockade increases IFNgamma-producing CD4+ICOShi cells to shift the ratio of effector to regulatory T cells in cancer patients. Proc Natl Acad Sci U S A. 2008;105(39):14987–92. doi: 10.1073/pnas.0806075105. [DOI] [PMC free article] [PubMed] [Google Scholar]
- 40.Comin-Anduix B, Lee Y, Jalil J, Algazi A, de la Rocha P, Camacho LH, et al. Detailed analysis of immunologic effects of the cytotoxic T lymphocyte-associated antigen 4-blocking monoclonal antibody tremelimumab in peripheral blood of patients with melanoma. Journal of translational medicine. 2008;6:22. doi: 10.1186/1479-5876-6-22. [DOI] [PMC free article] [PubMed] [Google Scholar]
- 41.Kavanagh B, O’Brien S, Lee D, Hou Y, Weinberg V, Rini B, et al. CTLA4 blockade expands FoxP3+ regulatory and activated effector CD4+ T cells in a dose-dependent fashion. Blood. 2008;112(4):1175–83. doi: 10.1182/blood-2007-11-125435. [DOI] [PMC free article] [PubMed] [Google Scholar]
- 42.Hodi FS, Oble DA, Drappatz J, Velazquez EF, Ramaiya N, Ramakrishna N, et al. CTLA-4 blockade with ipilimumab induces significant clinical benefit in a female with melanoma metastases to the CNS. Nature clinical practice Oncology. 2008;5(9):557–61. doi: 10.1038/ncponc1183. [DOI] [PubMed] [Google Scholar]
- 43.von Euw E, Chodon T, Attar N, Jalil J, Koya RC, Comin-Anduix B, et al. CTLA4 blockade increases Th17 cells in patients with metastatic melanoma. Journal of translational medicine. 2009;7:35. doi: 10.1186/1479-5876-7-35. [DOI] [PMC free article] [PubMed] [Google Scholar]
Associated Data
This section collects any data citations, data availability statements, or supplementary materials included in this article.