Abstract
Objective
To determine the influence of sex and race on relationships between anthropometry (body mass index [BMI], waist circumference [WC], waist-to-height ratio [W/Ht]), and adiposity (fat mass [FM], abdominal subcutaneous [SAT] and visceral adipose tissue [VAT]) in African American and white youth.
Design and Methods
The sample included 382 youth 5–18 years of age. FM and abdominal adiposity were assessed using dual energy x-ray absorptiometry and magnetic resonance imaging. Regression was used to examine sex and race effects in the relationship between independent (BMI, WC, and W/Ht) and dependent (FM, SAT and VAT) variables.
Results
BMI and WC were highly related to adiposity while W/Ht was moderately related. The association of BMI with FM and SAT was independent of sex and race, while the relationships of WC and W/Ht with FM and SAT were influenced by both sex and race. In contrast, the association between BMI and VAT was influenced by sex and race, while the relationships of WC and W/Ht with VAT were not.
Conclusions
WC and W/Ht have similar relationships with adiposity; however, WC presented stronger relationships. BMI is a predictor of overall adiposity but sex and race play a role in its relationship with VAT.
Keywords: abdominal adiposity, body composition, racial differences
INTRODUCTION
The body mass index (BMI) is currently recommended for clinical obesity screening in children and adolescents (1). However, BMI is not without limitations, as it is not able to differentiate between lean and fat tissue, and the relative contributions of lean and fat tissue change with advancing age. Further, BMI is not completely independent of height in children, and differential growth rates of the limbs and trunk, particularly around the timing of the adolescent growth spurt, make the interpretation of BMI difficult (2). Thus, other anthropometric measurements have been suggested for pediatric obesity screening. A recent American Heart Association report recommends further research examining the utility of waist circumference (WC) for this purpose (1). Several studies have demonstrated that WC is associated with cardiovascular risk factors in children (3), and WC appears to add to the ability of BMI alone to predict risk factors in children and adolescents (4). Another suggested measure is the WC to height ratio (W/Ht) which has been shown to be a good predictor of risk factors (5, 6)
With recent technological advances the study of depot-specific fat has emerged and abdominal fat, particularly intra-abdominal visceral adipose tissue (VAT), has been considered to be the most dyslipidemic and atherogenic fat depot in the human body (8). But due to the expense and expertise required to measure VAT by imaging techniques, there is interest in identifying associated robust anthropometric markers that can be used clinically. Among adults, the relationship between anthropometric measures and specific fat depots has been studied (9–11) and this relationship has been shown to be influenced by both sex and race (12). In children, there also appears to be racial differences in both the prevalence of obesity and the relationship between anthropometry and body fatness. Recent data from the indicate that the prevalence of obesity (BMI ≥ 95th percentile) among those 2–19 y of age was 24.3% among African Americans (AA) and 14.0% among whites in the U.S. (13).
Results from an earlier study indicate that correlations between VAT and skinfold measures, BMI, and WC were very similar and greater than 0.8 in a sample of white and AA adolescents (16). However, among Latino youth, WC was more strongly related to VAT than other variables, and the correlation was lower at 0.65 (17). A recent study has indicated that levels of subcutaneous body fat and WC are higher for a given BMI in AA versus white children across the pediatric age range (14). However, the relationship between anthropometric measures and VAT has limited information with one study providing support for sex and race differences in VAT for a given BMI and WC in a sample of 160 adolescents (15). Thus, the purpose of this study was to examine the relationship between anthropometric measurements and adiposity in AA and white children and adolescents and the influence of sex and race in these relationships.
METHODS
Study Sample
The sample included 84 AA and 96 white boys, and 118 AA and 84 white girls aged 5–18 years for a total of 382 children and adolescents. Participants were recruited through local advertisements and pediatricians offices for a cross-sectional study of factors related to abdominal obesity. Recruitment efforts were made to balance the sample across race, sex, and BMI categories (normal weight, overweight, and obese). Additional details about recruitment can be found elsewhere (18). All of the procedures were approved by the Pennington Biomedical Research Center Institutional Review Board. Parents/guardians provided signed informed consent and the children and adolescents provided written assent.
Anthropometry, Abdominal and Total Body Fat
Height and weight were measured using standard procedures and recorded to the nearest 0.1 cm and 0.1 kg, respectively. They were measured twice and if the measures differed by more than 0.5 cm and 0.5 kg, respectively, a third measurement was taken. The average of the two closest measurements was used in the analysis. BMI was calculated using the average weight and height values (weight in kg/height in m2). Details about the measurement of WC can be found elsewhere (18). In brief, WC was measured by one of three trained technicians, who followed very specific clinic procedures. Intra- and inter-rater reliability of WC were computed and ranged from .983 to .999. WC was measured midway between the iliac crest and the lowest rib and recorded to the nearest 0.1 cm. WC was measured twice and if the values were more than 0.5 cm apart a third measurement was taken. The average of the two closest measurements was used in the analysis. W/Ht was calculated using the average WC and height values (WC in cm/height in cm). BMI percentiles were calculated as defined by the Centers for Disease Control and Prevention (CDC) age- and sex-specific values (19).
Whole-body FM was assessed using a Hologic QDR 4500A dual energy x-ray absorptiometry (DXA) scanner. The scans were analyzed with the latest QDR software for Windows V11.2. Abdominal VAT and abdominal subcutaneous adipose tissue (SAT) were assessed using magnetic resonance imaging (MRI). MRI scans were obtained using a General Electric Signa Excite (3.0 Tesla; GE Medical Systems, Waukesha, WI) scanner. Images were evaluated using the Analyze (CNSoftware, Rochester, MN) software package. To estimate total abdominal SAT or VAT volume, the area from each slice was multiplied by the number of slices separating each slice (28 slices), then multiplied by 0.000001 by the voxel depth. The 5 to 8 slice volumes were summed to calculate total volume of SAT liters (L) or VAT in milliliters (ml) for each participant. Additional details about body composition methods can be found elsewhere (20).
Statistical Analysis
SAS version 9.3 was used to perform all statistical procedures. Multiple linear regression was used to examine sex and race effects in the relationship between independent (WC, W/Ht, and BMI) and dependent (FM, SAT, VAT) variables. Age was also entered as a factor and interaction terms were also tested but no interactions with age were significant. VAT was Log transformed due to its skewed distribution (skewness = 2.16 and kurtosis = 5.53) and the robust standard error (ACOV option) was used for the hypothesis testing with VAT. The inclusion of non-linear terms (quadratic, cubic) did not improve the prediction of the dependent variables; thus the results were not presented.
RESULTS
Participants’ characteristics, anthropometric and adiposity variables are presented in Table 1. In the total sample, BMI, WC, and W/Ht were strong predictors of FM, SAT, and VAT, with R2 values from univariate linear regression for BMI of 0.91, 0.89, and 0.67 respectively, 0.88, 0.85, and 0.73 for WC, respectively, and 0.69, 0.74, and 0.56 for W/Ht, respectively.
Table 1.
Participants’ descriptive information (mean ± sd.).
| Boys | Girls | |||
|---|---|---|---|---|
|
| ||||
| White | African American | White | African American | |
| n | 96 | 84 | 84 | 118 |
| Age (years) | 12.3 ± 3.5 | 12.0 ± 3.4 | 12.4 ± 3.4 | 12.3 ± 3.6 |
| Weight (kg) | 53.8 ± 24.4 | 55.1 ± 25.5 | 51.0 ± 18.0 | 59.2 ± 25.9 |
| Height (cm) | 153.6 ± 21.4 | 150.9 ± 20.0 | 150.2 ± 15.8 | 150.2 ± 15.6 |
| BMI (kg/m2) | 21.6 ± 5.6 | 22.9 ± 6.6 | 21.9 ± 5.2 | 25.1 ± 7.8 |
| BMI percentile | 67.8 ± 29.5 | 73.0 ± 27.9 | 70.0 ± 26.0 | 78.1 ± 27.7 |
| Waist circumference (cm) | 73.5 ± 16.1 | 73.9 ± 18.8 | 72.0 ± 13.9 | 77.1 ± 18.0 |
| Waist/height ratio | 0.48 ± 0.08 | 0.49 ± 0.1 | 0.48 ± 0.08 | 0.51 ± 0.1 |
| Fat mass (kg) | 13.7 ± 10.2 | 14.5 ± 11.0 | 16.9 ± 9.4 | 20.8 ± 14.1 |
| %BF (%) | 24.0 ± 9.1 | 24.0 ± 10.0 | 31.1 ± 8.4 | 31.8 ± 9.6 |
| VAT (ml) | 168 ± 191 | 117 ± 125 | 162 ± 137 | 139 ± 128 |
| SAT (L) | 3.2 ± 3.1 | 3.6 ± 3.4 | 4.2 ± 3.2 | 5.6 ± 4.8 |
BMI = body mass index; %BF = percent body fat; VAT = visceral adipose tissue; SAT = subcutaneous adipose tissue.
Body Mass Index
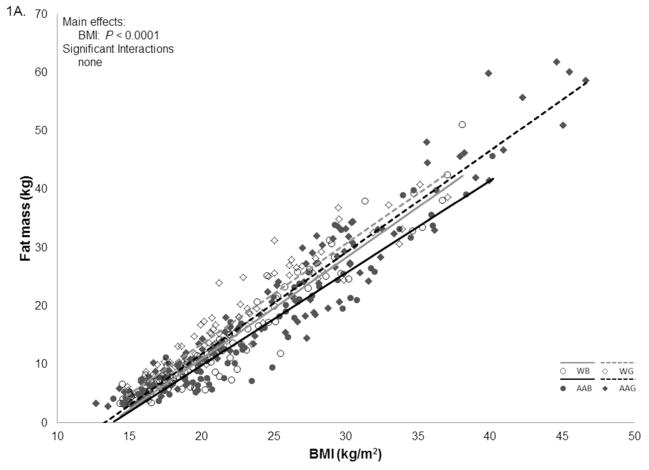
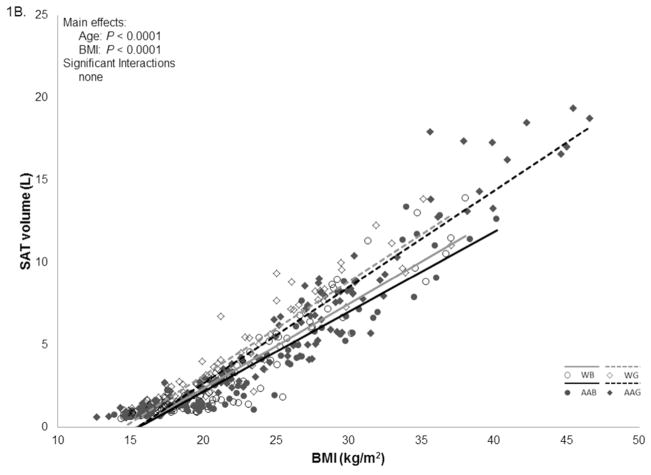
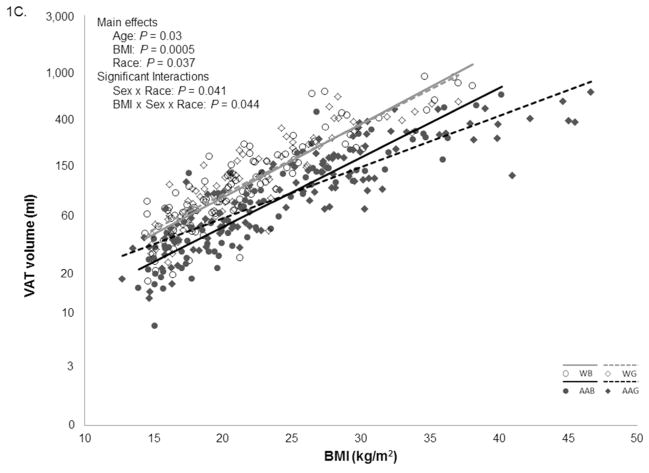
There was a significant linear relationship between BMI and FM (p < 0.0001), and neither age, sex, nor race were related to FM after adjusting for BMI (Figure 1A). In addition to BMI, age was significantly associated with levels of SAT (p < 0.001); however, no other main effects or interactions were significant (Figure 1B). For VAT, age, sex, and race had significant main effects in the BMI model (all p < 0.04). The interactions between BMI x sex and BMI x race were also significant. For a given BMI, whites had more VAT than AA. At low BMI levels AA girls had more VAT than AA boys, but this relationship was reversed at high BMI levels (Figure 1C).
Figure 1.
Relationships between body mass index (BMI), and adiposity in African American (AA) and white children and adolescents.
Figure 1A. Relationships between BMI and fat mass.
Figure 1B. Relationships between BMI and subcutaneous adipose tissue (SAT).
Figure 1C. Relationships between BMI and visceral adipose tissue (VAT).
Waist Circumference
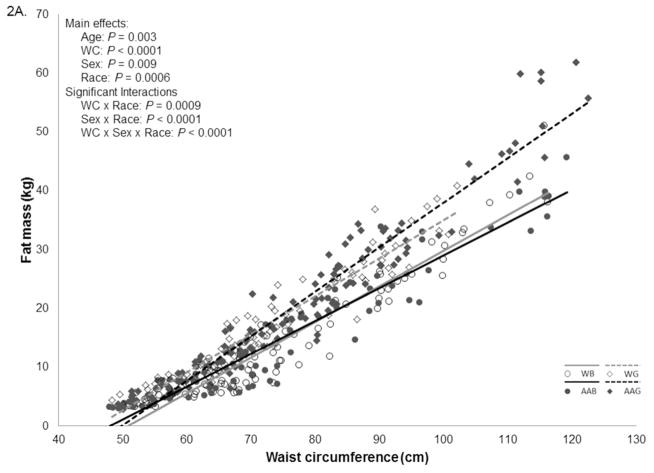
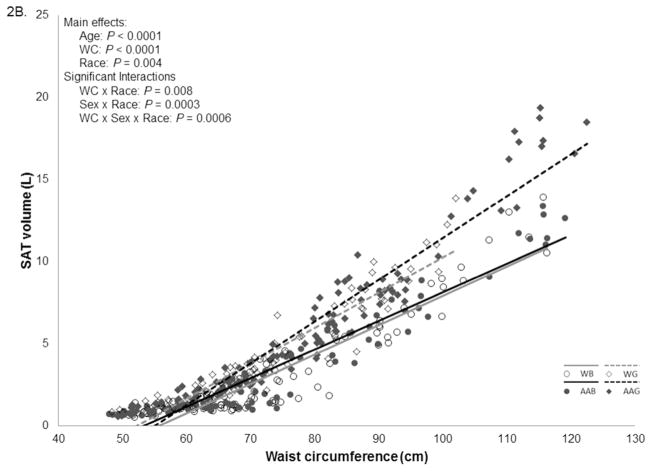
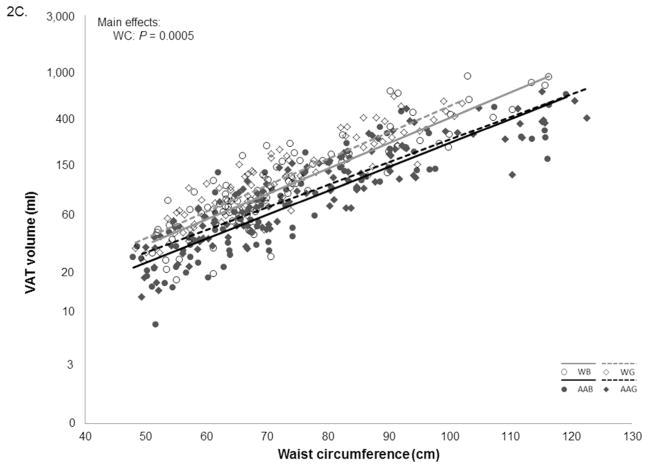
In the FM model, in addition to WC, age, sex, and race had significant main effects and the interactions between WC x race, sex x race, and WC x sex x race were also significant (all p < 0.01). Although participants with low WC had similar levels of FM, at a higher WC, girls had more FM than boys (Figure 2A). In the SAT model, in addition to WC, age, and race had significant main effects, and the interactions between WC x race, sex x race, and WC x sex x race were also significant (p < 0.01). Although sex was not related to SAT after adjusting for WC, due to the interaction effects, for a given WC, girls had more SAT than boys, and the difference increased at higher levels of WC (Figure 2B). There was a significant linear relationship between WC and VAT (p = 0.0005), and neither age, sex nor race were related to VAT after adjusting for WC (Figure 2C).
Figure 2.
Relationships between waist circumference (WC) and adiposity in African American (AA) and white children and adolescents.
Figure 2A. Relationships between WC and fat mass.
Figure 2B. Relationships between WC and subcutaneous adipose tissue (SAT).
Figure 2C. Relationships between WC and visceral adipose tissue (VAT).
Waist to Height Ratio
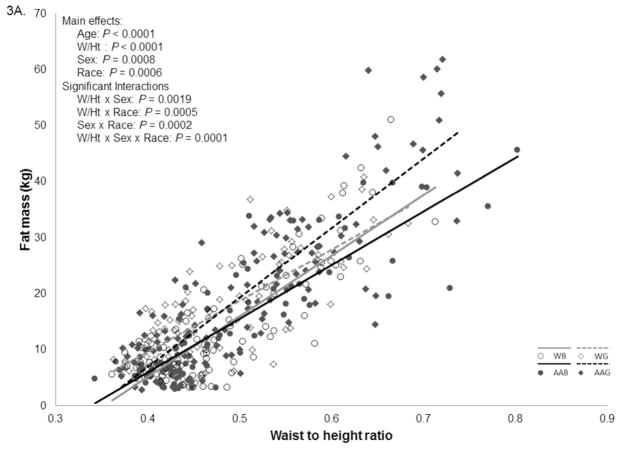
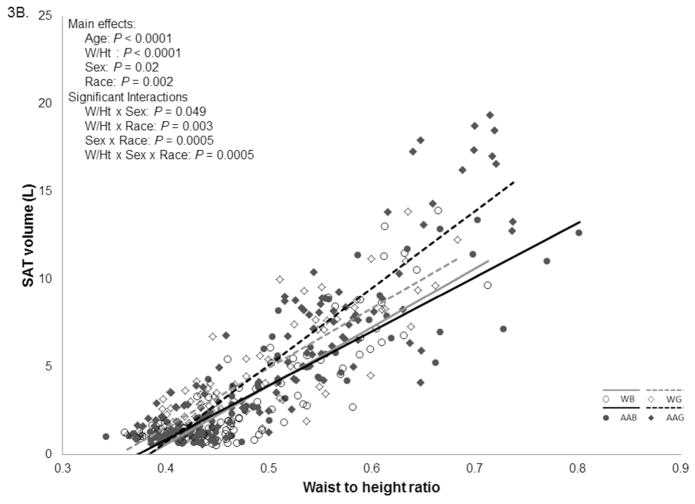
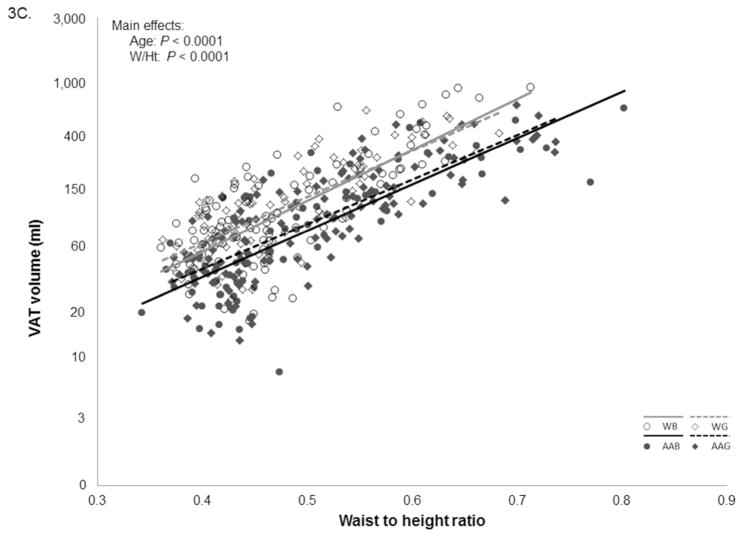
In the FM model, all of the main effects for W/Ht, age, sex and race as well as all interactions were significant (p < 0.01). For the most part boys had less FM for a given W/Ht compared to girls. For AA this difference was larger at higher levels of W/Ht values while for whites the difference disappeared (Figure 3A). All of the main effects and interactions were also significant (p < 0.02) for the SAT model. Boys had less SAT than girls for any given W/Ht, independent of race. White girls also had less SAT than AA girls at higher levels of W/Ht. Larger sex differences occurred in AA throughout the range of W/Ht (Figure 3B). In the VAT model there were significant effects of age and W/Ht on VAT; however there were no significant race or sex main effects (Figure 3C).
Figure 3.
Relationships between waist to height ratio (W/Ht) and adiposity in African American (AA) and white children and adolescents.
Figure 3A. Relationships between W/Ht and fat mass.
Figure 3B. Relationships between W/Ht and subcutaneous adipose tissue (SAT).
Figure 3C. Relationships between W/Ht and visceral adipose tissue (VAT).
DISCUSSION
Similar to what has been found in adults (12); BMI and WC were more strongly related to FM and SAT than VAT in this study. The same was true for the relationship between W/Ht and the adiposity measures. The relationship between BMI and VAT as well as WC and VAT were very similar to the ones observed by Goran et al. (16) in a study of 113 White and AA children, which saw correlations of 0.81 for BMI and VAT, and 0.84 for WC and VAT. Although WC and W/Ht were correlated with VAT, these anthropometric variables were more highly related to FM and SAT. For this reason it is inaccurate to use WC or W/Ht as a measure of VAT. The relationship between BMI and adiposity was mostly independent of sex and race, while the relationships of WC and W/Ht with adiposity were influenced by both sex and race. Caution should be used when using threshold values for anthropometric measures because they can represent different relationships to adiposity for different populations, this even appears to be true for W/Ht ratio.
The high correlation between BMI and FM found in this study has been previously observed in another multi-racial sample of youth (21). Interestingly, the relationship between BMI and FM was not influenced by other variables. The non-significant racial difference in FM for a given BMI was similar to the results previously observed in adults; however the lack of sex relationship was different to what has been normally observed in adults (12, 22, 23). The high correlation between SAT and BMI observed in this study has also been previously observed in other pediatric samples (24–26). The lack of influence of sex in the relationship between BMI and SAT was also different to what has been normally observed in adults (12). These findings suggest that in children and adolescents the relationship between BMI and overall body adiposity are independent of sex and race which makes BMI a good surrogate measure of overall adiposity for children and adolescents. However, the relationship between BMI and VAT was different between races and similar to the one found in adults where AAs have lower VAT than whites, at a given BMI (12). While the cause of this difference is not understood it is also well documented that in general AA have lower VAT than Whites (27).
The significant sex differences in FM for a given WC were similar to results observed in adults, however the racial difference was not seen in adults (12). The significant racial differences and the non-significant sex differences in the WC and SAT relationship were in contrast to what was previously found in adults and adolescents (12, 15). However, due to the interaction effects, for a given WC, girls had more SAT than boys, and the difference increased at higher levels of WC, this finding was in complete contrast to the finding by Lee et al. (15) who found interactions between race and WC and not between sex and WC. Relatively similar correlations between WC and VAT have also been reported in other studies (17, 24). In the present study WC was the only significant variable in the model, which was different from previous studies that found significant main effects and interaction of gender in the relationship between WC and VAT in children (15) and adults (12). The difference found in the relationship between WC and VAT in the current study and the study by Lee et al. (15) could be due to the differences in the sample. We have a wider age range (5 to 18 years of age), a larger sample size, and we applied a log transformation to VAT. Taking the overall WC results it was clear that the relationship between WC and overall body adiposity was influenced by sex and race in this sample.
Sex and race were significant factors in the relationship between W/Ht and FM. However the interactions had different effects. Again, similar to the relationship between WC and FM, the difference between AA boys and girls was larger at high levels of W/Ht, however contrary to what happened in the relationship between WC and FM for white boys and girls the FM difference between them disappeared at high levels of W/Ht. Similar to the WC and SAT relationship, race was a significant factor in the W/Ht relationship, but sex was also a significant factor and dominated the relationship between W/Ht and SAT. This was also in contrast to the relationship found by Lee et al. (15) where differences were mainly found between races. The relationship between W/Ht and VAT was influenced sex and race. W/Ht was not shown to be a superior to WC as a measure of overall and abdominal adiposity.
This study was carefully planned and conducted and has many strengths, such as the large sample size of AA and white boys and girls, the precise measurement of adiposity from MRI and DXA, as well as the standardized anthropometric measurements. However, this study was not free of limitations. The sample was not representative of the US population and this was a cross-sectional analysis. Thus, we cannot determine if actual changes in BMI, WC, and W/Ht will follow the pattern found in this analysis.
In conclusion, using a large bi-racial pediatric sample we demonstrated that BMI, WC, and W/Ht were strongly related to overall adiposity but less related to VAT. In addition W/Ht ratio was not as strongly related to VAT. We also demonstrated that the relationship of BMI with FM and SAT was independent of sex and race, while the relationships of WC and W/Ht with FM and SAT were influenced by both sex and race. In addition, the association between BMI and VAT was influenced by sex and race, while the relationships of WC and W/Ht with VAT were independent of sex and race. Researchers should use caution when using one standard cutoff values for anthropometric variables in different population subgroups because they can represent different levels of adiposity in different race and sex groups. Future studies should take sex and race differences into consideration when developing BMI, WC, and W/Ht cutoffs for obesity-related cardiovascular risk.
What is already known about this subject?
Body mass index (BMI) is not able to differentiate between lean and fat tissue and other anthropometric measurements such as waist circumference (WC) and waist-to-height ratio (W/Ht) have been suggested for pediatric obesity screening.
Visceral adipose tissue (VAT) has been considered to be the most dyslipidemic and atherogenic fat depot in the human body and there is considerable interest in identifying associated robust anthropometric markers that can be used clinically.
Limited information suggests that sex and race influence the relationship between anthropometric measures and VAT.
What this study adds
Using a large bi-racial pediatric sample we demonstrated that BMI, WC, and W/Ht were strongly related to overall adiposity but less related to VAT. In addition W/Ht ratio was not as strongly related to VAT as BMI and WC were.
The association of BMI with FM and SAT was independent of sex and race, while the relationships of WC and W/Ht with FM and SAT were influenced by both sex and race.
The association between BMI and VAT was influenced by sex and race, while the relationships of WC and W/Ht with VAT were independent of sex and race.
Acknowledgments
Source of Support: The source of support for this study was provided by an NIH NIDDK grant # RC1DK086881-01 (P.T.K.). This project was also supported by a Nutrition Obesity Research Center (NIH 2P30DK072476) grant from the National Institutes of Health. P.T.K. is supported, in part, by the Marie Edana Corcoran Endowed Chair in Pediatric Obesity and Diabetes.
TVB was involved in the study design, data analysis, literature search and generation of figures. PTK was involved in the study design. All authors were involved in data interpretation, writing the paper, and had final approval of the submitted and published versions. We acknowledge the efforts of Ms. Emily Mire for data management; Ms. Amber Dragg and the clinical staff for data collection; and Pennington Biomedical Imaging Core for analysis of MRI and DXA data.
Footnotes
Clinical Trial Registration: Anthropometric Assessment of Abdominal Obesity and Health Risk in Children and Adolescents; Registered May 7, 2012; ClinicalTrials.gov; identifier NCT01595100.
Conflict of Interest: The authors have declared that no competing interests exist
References
- 1.Daniels SR, Jacobson MS, McCrindle BW, Eckel RH, Sanner BM. American heart association childhood obesity research summit report. Circulation. 2009;119:e489–517. doi: 10.1161/CIRCULATIONAHA.109.192216. [DOI] [PubMed] [Google Scholar]
- 2.Siervogel RM, Demerath EW, Schubert C, et al. Puberty and body composition. Horm Res. 2003;60:36–45. doi: 10.1159/000071224. [DOI] [PubMed] [Google Scholar]
- 3.Freedman DS, Serdula MK, Srinivasan SR, Berenson GS. Relation of circumferences and skinfold thicknesses to lipid and insulin concentrations in children and adolescents: the Bogalusa Heart Study. Am J Clin Nutr. 1999;69:308–17. doi: 10.1093/ajcn/69.2.308. [DOI] [PubMed] [Google Scholar]
- 4.Janssen I, Katzmarzyk PT, Srinivasan SR, et al. Combined influence of body mass index and waist circumference on coronary artery disease risk factors among children and adolescents. Pediatrics. 2005;115:1623–30. doi: 10.1542/peds.2004-2588. [DOI] [PubMed] [Google Scholar]
- 5.Savva SC, Tornaritis M, Savva ME, et al. Waist circumference and waist-to-height ratio are better predictors of cardiovascular disease risk factors in children than body mass index. Int J Obes Relat Metab Disord. 2000;24:1453–8. doi: 10.1038/sj.ijo.0801401. [DOI] [PubMed] [Google Scholar]
- 6.Kahn HS, Imperatore G, Cheng YJ. A population-based comparison of BMI percentiles and waist-to-height ratio for identifying cardiovascular risk in youth. J Pediatr. 2005;146:482–8. doi: 10.1016/j.jpeds.2004.12.028. [DOI] [PubMed] [Google Scholar]
- 7.Freedman DS, Kahn HS, Mei Z, et al. Relation of body mass index and waist-to-height ratio to cardiovascular disease risk factors in children and adolescents: the Bogalusa Heart Study. Am J Clin Nutr. 2007;86:33–40. doi: 10.1093/ajcn/86.1.33. [DOI] [PubMed] [Google Scholar]
- 8.Despres JP, Lemieux I. Abdominal obesity and metabolic syndrome. Nature. 2006 doi: 10.1038/nature05488. [DOI] [PubMed] [Google Scholar]
- 9.Pouliot MC, Despres JP, Lemieux S, et al. Waist circumference and abdominal sagittal diameter: best simple anthropometric indexes of abdominal visceral adipose tissue accumulation and related cardiovascular risk in men and women. Am J Cardiol. 1994;73:460–8. doi: 10.1016/0002-9149(94)90676-9. [DOI] [PubMed] [Google Scholar]
- 10.Rankinen T, Kim SY, Perusse L, Despres JP, Bouchard C. The prediction of abdominal visceral fat level from body composition and anthropometry: ROC analysis. Int J Obes Relat Metab Disord. 1999;23:801–9. doi: 10.1038/sj.ijo.0800929. [DOI] [PubMed] [Google Scholar]
- 11.Barreira TV, Staiano AE, Harrington DM, et al. Anthropometric correlates of total body fat, abdominal adiposity, and cardiovascular disease risk factors in a biracial sample of men and women. Mayo Clin Proc. 2012;87:452–60. doi: 10.1016/j.mayocp.2011.12.017. [DOI] [PMC free article] [PubMed] [Google Scholar]
- 12.Camhi SM, Bray GA, Bouchard C, et al. The relationship of waist circumference and BMI to visceral, subcutaneous, and total body fat: sex and race differences. Obesity (Silver Spring) 2011;19:402–408. doi: 10.1038/oby.2010.248. [DOI] [PMC free article] [PubMed] [Google Scholar]
- 13.Ogden CL, Carroll MD, Kit BK, Flegal KM. Prevalence of obesity and trends in body mass index among US children and adolescents, 1999–2010. JAMA. 2012;307:483–490. doi: 10.1001/jama.2012.40. [DOI] [PMC free article] [PubMed] [Google Scholar]
- 14.Sisson SB, Katzmarzyk PT, Srinivasan SR, et al. Ethnic differences in subcutaneous adiposity and waist girth in children and adolescents. Obesity (Silver Spring) 2009;17:2075–81. doi: 10.1038/oby.2009.132. [DOI] [PMC free article] [PubMed] [Google Scholar]
- 15.Lee S, Kuk JL, Hannon TS, Arslanian SA. Race and gender differences in the relationships between anthropometrics and abdominal fat in youth. Obesity (Silver Spring) 2008;16:1066–71. doi: 10.1038/oby.2008.13. [DOI] [PubMed] [Google Scholar]
- 16.Goran MI, Gower BA, Treuth M, Nagy TR. Prediction of intra-abdominal and subcutaneous abdominal adipose tissue in healthy pre-pubertal children. Int J Obes. 1998;22:549–558. doi: 10.1038/sj.ijo.0800624. [DOI] [PubMed] [Google Scholar]
- 17.Ball GD, Huang TT, Cruz ML, Shaibi GQ, Weigensberg MJ, Goran MI. Predicting abdominal adipose tissue in overweight Latino youth. Int J Pediatr Obes. 2006;1:210–6. doi: 10.1080/17477160600913578. [DOI] [PubMed] [Google Scholar]
- 18.Harrington DM, Staiano AE, Broyles ST, Gupta AK, Katzmarzyk PT. Waist circumference measurement site does not affect relationships with visceral adiposity and cardiometabolic risk factors in children. Pediatric obesity. 2013;8:199–206. doi: 10.1111/j.2047-6310.2012.00106.x. [DOI] [PMC free article] [PubMed] [Google Scholar]
- 19.Kuczmarski RJ, Ogden CL, Grummer-Strawn LM, et al. CDC growth charts: United States. Adv Data. 2000 Jun 8;:1–27. [PubMed] [Google Scholar]
- 20.Staiano AE, Broyles ST, Gupta AK, Katzmarzyk PT. Ethnic and sex differences in visceral, subcutaneous, and total body fat in children and adolescents. Obesity (Silver Spring) 2013;21:1251–5. doi: 10.1002/oby.20210. [DOI] [PMC free article] [PubMed] [Google Scholar]
- 21.Phan T-LT, Maresca MM, Hossain J, Datto GA. Does Body Mass Index accurately reflect body fat? A comparison of anthropometric measures in the longitudinal assessment of fat mass. Clin Pediatr. 2012;51:671–677. doi: 10.1177/0009922812440838. [DOI] [PubMed] [Google Scholar]
- 22.Barreira TV, Harrington DM, Staiano AE, Heymsfield SB, Katzmarzyk PT. Body adiposity index, body mass index, and body fat in white and black adults. JAMA. 2011;306:828–830. doi: 10.1001/jama.2011.1189. [DOI] [PMC free article] [PubMed] [Google Scholar]
- 23.Jackson AS, Stanforth PR, Gagnon J, et al. The effect of sex, age and race on estimating percentage body fat from body mass index: The Heritage Family Study. Int J Obes Relat Metab Disord. 2002;26:789–96. doi: 10.1038/sj.ijo.0802006. [DOI] [PubMed] [Google Scholar]
- 24.Brambilla P, Bedogni G, Moreno LA, et al. Crossvalidation of anthropometry against magnetic resonance imaging for the assessment of visceral and subcutaneous adipose tissue in children. Int J Obes. 2006;30:23–30. doi: 10.1038/sj.ijo.0803163. [DOI] [PubMed] [Google Scholar]
- 25.Benfield LL, Fox KR, Peters DM, et al. Magnetic resonance imaging of abdominal adiposity in a large cohort of British children. Int J Obes (Lond) 2008;32:91–9. doi: 10.1038/sj.ijo.0803780. [DOI] [PubMed] [Google Scholar]
- 26.Liem ET, De Lucia Rolfe E, L’Abee C, Sauer PJ, Ong KK, Stolk RP. Measuring abdominal adiposity in 6 to 7-year-old children. Eur J Clin Nutr. 2009;63:835–41. doi: 10.1038/ejcn.2008.57. [DOI] [PubMed] [Google Scholar]
- 27.Katzmarzyk PT, Bray GA, Greenway FL, et al. Racial differences in abdominal depot-specific adiposity in white and African American adults. Am J Clin Nutr. 2010;91:7–15. doi: 10.3945/ajcn.2009.28136. [DOI] [PMC free article] [PubMed] [Google Scholar]


