

Abstract
Food intake is a fundamental parameter in animal studies. Despite the prevalent use of Drosophila in laboratory research, precise measurements of food intake remain challenging in this model organism. Here, we compare several common Drosophila feeding assays: the Capillary Feeder (CAFE), food-labeling with a radioactive tracer or a colorimetric dye, and observations of proboscis extension (PE). We show that the CAFE and radioisotope-labeling provide the most consistent results, have the highest sensitivity, and can resolve differences in feeding that dye-labeling and PE fail to distinguish. We conclude that performing the radiolabeling and CAFE assays in parallel is currently the best approach for quantifying Drosophila food intake. Understanding the strengths and limitations of food intake methodology will greatly advance Drosophila studies of nutrition, behavior, and disease.
Introduction
Nutrition plays prominent roles in aging, health, metabolism, and disease1–6. Despite the key advantages of Drosophila as a model organism, its food consumption remains challenging to measure. As a result, this crucial parameter is often ignored or poorly characterized using rough feeding estimates and qualitative observations as surrogates for quantitative food intake assays, leaving doubt as to the significance of some studies (e.g., refs. 7–9). Several published feeding assays are commonly used, although their application and significance vary widely. Moreover, all current methodologies have some shortcomings.
Labeling strategies, where dyes10,11 or radioactive tracers1,4,12–18 are added to the medium, are frequently used for measuring fly feeding, but have several disadvantages: a) they involve disturbing the animals upon transfer onto the labeled medium b) the amount of label in the fly is only informative during the linear phase of accumulation19 and c) animals must be sacrificed for each measurement, making it impossible to continuously monitor individual animals. Alternatively, feeding has been inferred from either the number of flies standing on the food20 or the fraction of flies observed eating (via proboscis extension)9,21. This PE assay is conducted without the initial disturbance of transferring flies to labeled food, but it does not measure actual intake. The CAFE, where flies feed on liquid food contained in a glass micro-capillary, allows direct measurement of consumption for periods ranging from minutes to the entire lifespan22. Development of the CAFE has facilitated studies of feeding with age5,23, dietary modulation of sleep24, appetite regulation by the circadian clock25,26, food choice5,23,27 and alcohol addiction28. However, the CAFE involves liquid food and forces the animals to climb and feed upside-down—two differences from normal rearing conditions.
Here, we determine the capacity of four commonly used adult Drosophila feeding assays—the CAFE22, food-labeling with radioactive tracers1,4,12–17 or dyes10,11, and PE9,21—to resolve differences in consumption. Our results suggest that the CAFE and radioisotope-labeling provide the most consistent and accurate results and the highest resolving power over the widest range of conditions. Among the currently available methodology, performing these two techniques in parallel constitutes the gold standard in Drosophila food intake measurement, while the remaining methods are substantially inferior. These advances should guide Drosophila studies of aging, metabolism, and nutrition, which ultimately inform research on more complex organisms.
Results and Discussion
Compensatory feeding due to food dilution
Food dilution, a common practice for implementing dietary restriction in fly aging studies, can result in consumption of larger volumes of the diluted medium1. We took advantage of this phenomenon to ask whether differences in intake of four different food concentrations could be resolved by each of the feeding assays.
Soluble, non-absorbable dyes have been extensively used to measure fly food intake10,11. After feeding on labeled medium, animals are homogenized and the absorbance of the solution determined to quantify the volume of food consumed. Several crucial controls must be performed. First, the ideal wavelength must be determined for each particular dye and it should be confirmed that the signal-to-noise ratio is adequate—absorbance for the dye should be considerably higher than from flies fed unlabeled food (Supplementary Fig. 1a). Second, the dye itself should not influence feeding. No differences in feeding were observed when FD&C Blue #1 (1%, w/v) is added to the food (Supplementary Fig. 1b). Third, the linear phase of dye accumulation, determined by gut dynamics, capacity, and onset of excretion, should be determined empirically for the particular conditions being used. It is essential that the duration of the assay be strictly based on this parameter. Most dyes used in fly studies are not absorbed by the gut and are excreted quickly (<30 min). Thus, dye quantification only reflects intake during the initial phase of accumulation, i.e. before excretion begins19. In general agreement with published observations10,21, we observed that colored fecal spots start appearing 15 min after exposure to labeled food and are abundant after 45–60 min. The amount of dye contained in the gut after 1 h on colored medium is only 45% higher than after 15 min—in contrast to the expected 4-fold difference if dye excretion did not occur—and plateaus at even later time points (Supplementary Fig. 1c). This clearly contrasts with accumulation of radiolabel, which is absorbed by the gut and continues to increase (Supplementary Fig. 1d). In fact, 32P accumulation is consistent between 1-, 4-, and 24-h time points (cf. Fig. 1b and Supplementary 1d). We therefore conclude that, in these conditions, dye accumulation reflects intake up to 15 min of feeding, whereas later time points are not indicative of consumption. We measured dye accumulation over 15 min in flies fed media of varying concentrations. Canton-S males consistently consumed less than Dahomey (Fig. 1a and Supplementary Fig. 1e). In both strains, substantial variability was observed. This is to be expected, since a) flies feed sporadically, often exhibiting inter-prandial intervals of one or more hours, b) flies do not feed simultaneously, but rather display individual, and somewhat irregular, feeding patterns, and c) meal volume is subject to substantial variability both between animals and between meals of the same animal22. To reduce this variability and stimulate feeding over short periods, some investigators starve the animals prior to the assay. However, this practice is misleading since it measures a completely different parameter from the chronic feeding behavior of an ad libitum-fed animal. Feeding assays employing starvation simply do not address—and cannot be used to infer—steady-state ingestion.
Figure 1.

Assessment of feeding assays using a compensatory feeding paradigm. Feeding of Canton-S or Dahomey males was measured using (a) dye-labeling, (b) radioisotope-labeling with 32P, (c) the Capillary Feeder (CAFE) assay, and (d) observations of proboscis extension to estimate proportion feeding (PE). Flies (7–9 d old) were fed a concentration series of diets (1× diet = 2.5% yeast extract + 2.5% sucrose). P values are shown (one-way ANOVA) and all significant pairwise comparisons are labeled (Tukey-Kramer post-hoc test for multiple comparisons): *, P < 0.05; ***, P < 0.001. Data shown are means ± s.e.m. (n = number of vials, shown in white over black bars).
Dye-labeling was unable to detect reproducible differences in feeding (Fig. 1a and Supplementary Fig. 1e). In Dahomey males, two out of six trials revealed a significant difference between 1× and 2×, while the remaining comparisons were significant in only one trial. In Canton-S, no significant difference was ever observed for any dilution. Later measurements (1 h and 4 h), commonly used in the literature despite being uninformative, also revealed no significant differences (Supplementary Fig. 1f). We conclude that dye labeling cannot reproducibly detect the differences in feeding elicited by food dilutions up to 2-fold.
Radioisotope-labeling has long been used to monitor fly feeding15–17. Unlike with dyes, homogenization of flies is unnecessary with radioisotopes that can be detected through the cuticle (Supplementary Fig. 2a). Radioisotope concentration does not affect ingestion volume, suggesting that the label itself does not influence feeding at the typically low concentrations (<1 nM) used (Supplementary Fig. 2b). Agar concentration also does not affect intake (Supplementary Fig. 2c). The high sensitivity for 32P detection allows the consumption of individual flies to be measured (Supplementary Fig. 2d). We observe remarkably low variability with this method: when comparing across 10 separate vials (containing ~10 flies each), only one pair-wise comparison (out of a total of 45 possible) between vials is significantly different (Supplementary Fig. 2d, one-way ANOVA followed by Tukey-Kramer post-hoc test). Averaging consumption within individual vials was not as accurate as averaging across vials—only 6 out of 10 individual vials fell within the global 95% confidence interval (0.53–0.60 μl/d).
Radioisotopes may be absorbed by the digestive system, facilitating long-term measurements. This parameter must be confirmed for each radioisotope-carrier compound. We measured label retention using three commonly used radioisotope-carrier compounds. When 14C-choline or 14C-leucine were used, over 93% of the ingested label was excreted, whereas 32P-dCTP showed 75–90% retention in males and >95% in females (Supplementary Fig. 2e, f). Accordingly, 32P accumulates over several days without plateauing, although a change in slope is evident (Supplementary Fig. 2f). A model has been proposed to account for accumulation, excretion, and internal label capacity19. Fitting our long-term 32P-dCTP measurements to this model predicts that ~7% of consumed 32P-dCTP is excreted over 24 h, which compares well to the 11% excretion determined by direct measurements (Supplementary Fig. 2f). Differences in excretion over 24 h might be due to the time of day at which assays were started, since feeding has been shown to be linked to circadian rhythm25,26. We found that measurements starting in the middle of the light period significantly increased estimated consumption (Supplementary Fig. 2g). Future feeding studies should bear this factor in mind.
We conclude that, of the radiolabels tested here, 32P-dCTP provides the best estimate of ingestion, while 14C-choline and 14C-leucine are of limited use. The striking difference seen in percentage excreted is likely to result, at least partly, from differences in absorption rate between different molecules or the digestive products thereof. The practice of reporting counts per minute (cpm)—without converting to volume of food—has propagated the use of unreliable radiolabels15–17,29. The low retention rate of these reagents only becomes apparent when the conversion to ingestion volume is made and the reagent is compared to others (Supplementary Fig. 2e).
We next tested the resolving power of radioisotope-labeling by measuring feeding on different media. Radioisotope accumulation over 24 h revealed significant differences for most pair-wise comparisons on both genotypes (Fig. 1b). Compensatory feeding was nearly perfect, with Canton-S and Dahomey flies consuming 2.06- and 1.84-fold more of the 1× than the 2× food, respectively. Between 1.1× and 1.2× foods, Canton-S and Dahomey flies consumed 12.5% and 5.6% more of the lower concentration, respectively—once again reasonably in agreement with the predicted 9% if compensation were perfect, even though the differences were not significant. In contrast to dyes, results obtained with radiolabeling were remarkably reproducible (Supplementary Fig. 2h).
The CAFE is an enclosure where food is presented in liquid form and its consumption can be directly measured22. Flies feed upside-down from a capillary hanging from the top of the vial, as opposed to the customary lab setup of solid food on the bottom. One concern regarding the CAFE is that the placement of the capillaries may itself affect feeding behavior. We tested this possibility by providing radiolabeled food on either the bottom or the top of the enclosure. Intake was indistinguishable in both conditions (Supplementary Fig. 3a). Thus feeding upside-down, as in the CAFE, does not affect intake. We next used the CAFE to measure feeding on media of different dilutions. Significant differences in consumption were observed between 2× food and all other diets, while the more subtle dilutions were not distinguished (Fig. 1c). Canton-S and Dahomey flies consumed 1.80- and 1.85-fold more of the 1× than the 2× food, respectively. Overall, results obtained with the CAFE were highly reproducible (Supplementary Fig. 3b).
The PE assay, based on scoring the number of flies feeding during a certain time interval, did not reveal any reproducible differences (in Dahomey males, 1.1× vs. 2× and 1.2× vs. 2× were each significant in one out of three trials, whereas 1× vs. 2× was never significant out of six independent trials; in Canton-S males, no pairwise comparison was ever significant), even when large numbers of replicates were analyzed—indeed much larger than for any of the other assays studied (Fig. 1d and Supplementary 4a). The PE assay failed to detect differences even when an extremely concentrated food source (4×) was included in the analysis (Supplementary Fig. 4a). Periods of observation ranging from 60 to 90 min produced equivalent results (Supplementary Fig. 4b). Previous studies have claimed that PE is a reliable indicator of intake if a) the proportion of animals feeding correlates positively with dye accumulation within each experimental group and b) this plotted correlation has indistinguishable slopes across experimental groups21. These conditions are met in our experimental setup (Pearson’s correlation coefficient, 1×: r = 0.51, P = 0.021; 2×: r = 0.69, P = 0.0008; comparison of slopes, ANCOVA: F1,36 = 0.22, P = 0.64; Supplementary Fig. 4c), yet the technique fails to reproducibly detect even dramatic differences. Thus calibrating against dye accumulation is insufficient to ensure the reliability of PE as a quantitative feeding assay. By themselves, dye-labeling and PE already show considerable inherent variability (especially given the brief periods that the assays are limited to). Combining the techniques is likely to compound the variability and conceal all but the most dramatic differences. Thus one would expect this calibration method to maximize the rate of false negatives, making it very stringent for claiming differences in feeding but very poor for ruling them out.
Compensatory feeding in females has been reported using PE21. To demonstrate that the failure of the assay to reproducibly resolve differences in males (Fig. 1d) is not due to technical discrepancies, we assayed Dahomey females fed 1×, 2×, and 4× foods. Statistical differences were observed between 4× and the two lower concentrations, but not between 1× and 2× foods (Supplementary Fig. 4d). Hence, we are able to resolve some changes in consumption using PE, albeit only in certain conditions and only for very dramatic differences. Our results suggest that the inability of PE to discern feeding differences clearly seen with the CAFE and radioisotope-labeling (Fig. 1) is due to the low sensitivity of PE, rather than experimental artifacts. This is consistent with an independent interpretation of published results30.
It has been suggested that yeast extract—a water-soluble fraction of yeast—is toxic and that compensatory feeding is a result of the animals’ aversion to this reagent, rather than an attempt to normalize nutrient intake21. Although we use the compensatory feeding paradigm here only as a model to induce feeding differences and test the various assays—and therefore in this case the physiological role of each nutrient has no bearing—we note that compensatory feeding also occurs with whole yeast (Supplementary Fig. 5 and refs. 4,5), ruling out that changes in intake are specific to yeast extract.
Gender and mating status
We sought to extend our comparative analysis using a different paradigm. Drosophila males ingest smaller volumes than females, and females eat more after mating14,31. We asked whether each technique can resolve these established feeding differences. With Canton-S, dye-labeling revealed a significant difference between males and mated females, but failed to differentiate between virgins and any of the other experimental groups (Fig. 2a). With Dahomey, no significant differences were seen. Both radioisotope-labeling and the CAFE showed significant differences between all groups for both strains (Fig. 2b, c). The PE assay revealed no differences in Canton-S, whereas Dahomey mated females showed significantly higher proportion feeding than males or virgin females, which did not differ between them (Fig. 2d). Collectively, these results confirm the conclusions of the compensatory feeding paradigm (Fig. 1)—that radiolabeling and the CAFE consistently have the highest resolving power. Dyes and PE can in some cases detect differences, whereas in others these assays miss dramatic behavioral changes, even when large numbers of replicates are used.
Figure 2.
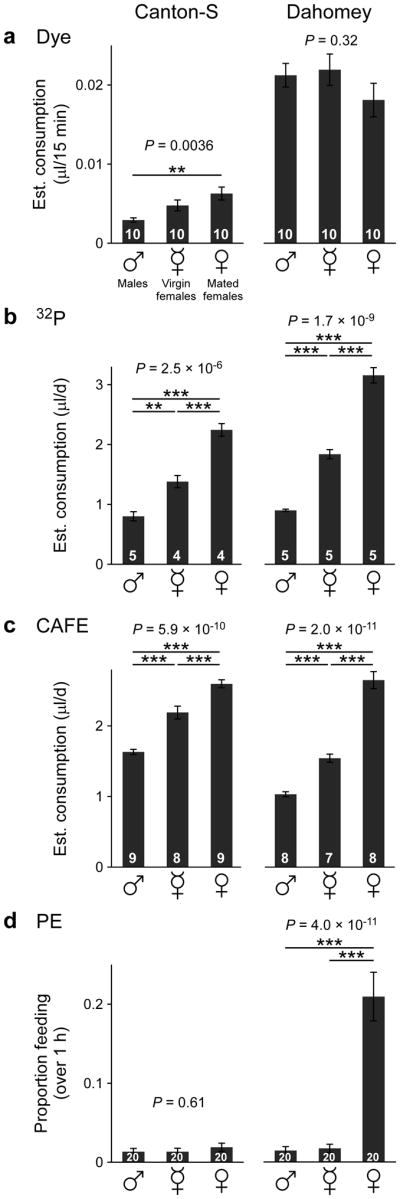
Comparison of feeding assays on flies of different gender and mating status. Feeding of males, virgin females, and mated females was measured using (a) dye-labeling, (b) 32P-labeling, (c) CAFE, and (d) PE. Flies (7–9 d old) were fed 2× medium (5% yeast extract + 5% sucrose). P values are shown (one-way ANOVA) and all significant pairwise comparisons are labeled (Tukey-Kramer post-hoc test for multiple comparisons): **, P < 0.01; ***, P < 0.001. Data shown are means ± s.e.m. (n = number of vials, shown in white over black bars).
Comparative analysis of feeding methods
The CAFE and radioisotope-labeling show differences in conditions where dye-labeling and PE do not, indicating that the former techniques have superior sensitivity. A potential alternative explanation is that the particular experimental conditions of each method influence feeding, introducing differences where there normally are none. To address this possibility, we measured feeding using pairs of assays conducted simultaneously, under identical conditions and, whenever possible, assaying the exact same animals.
Radioisotope- and dye-labeling
We fed flies food labeled with both dye and a radiolabel. Intake values were similar in both assays, but only radiolabeling was able to distinguish between 1× and 2× foods (Fig. 3a). As discussed above, substantial biological variability is expected in brief assay periods. Even with extremely sensitive labels such as radioisotopes, intake should ideally not be inferred from very short-term assays. Long-term assays should systematically be given preference.
Figure 3.

Feeding measurements using pairs of assays simultaneously. (a) Radio- and dye-labeling. Flies were fed solid food labeled with both 32P and dye and both labels were quantified after 15 min of feeding. (b) Radiolabeling and CAFE. Flies were fed 32P-labeled liquid diets presented in capillaries in the CAFE enclosure. Both direct liquid consumption and radioisotope accumulation were measured after 24 h. “Internal,” radioisotope measured in the animal bodies; “Excreted,” radioisotope measured on vial walls. Statistical comparisons were made using total consumption (Excreted + Internal). (c) Radiolabeling and PE. Flies were fed 32P-labeled solid food. Observations of active feeding were made for 1 h, after which flies were sacrificed and 32P accumulation was measured. For all data (means ± s.e.m.; n = number of vials, shown in white over black bars), Dahomey males were fed the indicated diets (1× = 2.5% yeast extract + 2.5% sucrose). For P > 0.05 (unpaired, two-tailed t-test), exact p values are shown; otherwise, **, P < 0.01; ***, P < 0.001.
Radioisotope-labeling and CAFE
We fed flies 32P-labeled liquid food in capillaries in the CAFE enclosure. After directly recording liquid consumption over 24 h, 32P levels were measured both in the animals and on the walls of the enclosure. Total feeding (internal + excreted) measured by radiolabel was indistinguishable from actual consumption measured with the CAFE (Fig. 3b) and both methods revealed a difference between 1× and 2× food. However, in these conditions as much as 50% of the consumed isotope was excreted, in sharp contrast to the observations made on solid food (Supplementary Fig. 2e, f), indicating that the absorption of at least some nutrients is reduced on liquid diets. This may explain why flies housed in the CAFE for extended periods show earlier mortality5. However, this fact does not constitute a limitation of the CAFE as a short-term feeding assay (over hours or days). The CAFE allows direct measurement of ingestion, but does not address the downstream fate of consumed food—absorption, excretion, or catabolism.
Radioisotope-labeling and PE
We labeled solid food with 32P, recorded proboscis extension for 1 h, and subsequently measured radioisotope accumulation in the same animals. While 32P accumulation showed significant differences between 1× and 2× diets, no differences were observed with PE (Fig. 3c). This demonstrates that the failure of PE to detect changes in feeding is a consequence of its low sensitivity, and thus a real limitation of the assay.
Resolving power of feeding assays
We quantified the variability of the methods by estimating the sample size required to resolve various differences in feeding (Supplementary Fig. 6). Radioisotope-labeling requires the fewest samples to distinguish a feeding difference, followed by CAFE, dye-labeling, and finally PE at a distant fourth. This calculation is based solely on data variance (scatter), and therefore does not account for specific assay limitations. For example, if two experimental groups had identical feeding frequencies but ingested different volumes per feeding episode, methods such as radiolabeling or the CAFE would reveal the change in volume consumed, whereas PE would not, regardless of the number of replicates.
Overall, in the conditions used here, dyes and PE can only detect differences of ~100% or larger, whereas the CAFE and radiolabeling have thresholds of 10–20% (Fig. 4a). The reliability of these assays for detecting true feeding differences (i.e. for avoiding false negative results) show similar thresholds (Fig. 4b). Our collective results show that, out of the four assays tested, PE is the most variable and least sensitive. It failed to detect almost every feeding difference it was presented with (Figs. 1–3 and Supplementary Fig. 4), even when more replicates (n) were used than for the other methods. Unlike the other three methods analyzed here, PE does not constitute a measure of intake and thus can never, by itself, prove or disprove a difference in intake (Fig. 4c). Dyes also show low sensitivity and high variability. They can never reliably disprove a difference in intake, nor do they address long-term (>30 min) feeding. One concern is that many published studies strive to prove a negative result—that feeding is unaffected by genetic, pharmacologic, or other manipulations—and thus there is little inherent incentive to use sensitive methods. However, effort should be made to change this practice, given that the potential false negatives can be extremely misleading.
Figure 4.

Performance of Drosophila feeding assays. (a) Assay sensitivity, defined as the smallest change in feeding reproducibly detected (in any experiment in this study). A sharp divide is seen between dye-labeling and PE, which reproducibly identify differences in feeding of >100%), versus CAFE and radioisotope-labeling, which reliably identify differences larger than 15–20%. (b) Assay reliability, defined as the largest false negative observed for each technique. Similar to (a), dyes and PE miss differences in feeding of up to 100%, whereas CAFE and radioisotopes perform much better—missing maximum differences of 13% and 10%, respectively. (c) Goals of a feeding experiment and adequacy of the available techniques.
Radiolabeling is both the most sensitive and consistent feeding method currently available. Its main limitation is its underestimate of consumption (by 5–25%, depending on gender and genotype). In our experience, this shortcoming has no effect on relative comparisons across experimental groups but, to ensure maximum rigor, radioisotope results should be corroborated with an additional quantitative technique not relying on food labels (such as the CAFE)4,32. Given their individual limitations (the CAFE involves liquid diets in an atypical setting, whereas radioisotope-labeling does not; radiolabeling relies on a food marker, whereas the CAFE is a direct measure of intake), the CAFE and radiolabeling complement each other well. Reporting identical relative results with both assays (Figs. 1b, c and 2b, c) currently constitutes the gold standard in the quantification of food intake in Drosophila4,32.
Current methods for measuring feeding in Drosophila focus primarily on estimating ingestion while neglecting the critical downstream parameters of nutrient absorption and assimilation. As these issues are central to fully interpret studies of metabolism and nutrition, future technical efforts should be targeted at filling this gap. Isotopes (radioactive or otherwise) may be instrumental, since their fate can be followed beyond ingestion for downstream metabolomics, proteomics, or other analyses33–36. Our results indicate that absorption rate may vary dramatically between different types of radiolabeled molecules (Supplementary Fig. 2e). Extending this type of analysis using a wider range of nutrients and isotopes will facilitate the characterization of nutrient processing and allocation. Ultimately, these advances will greatly improve the use of the fly model for informing mammalian research.
Conclusion
The CAFE and radioisotope-labeling provide the most consistent, accurate results over the widest range of conditions. Dye-labeling and PE are substantially inferior, and previous claims based on these assays should be re-evaluated using other techniques. Due to the advent and optimization of reliable methodologies for assessing fly feeding, it is no longer necessary, or acceptable, to omit feeding measurements or infer consumption using assays with little or no resolving power.
Online Methods
Fly rearing and husbandry
Developmental food ingredients and enclosures were from Genesee Scientific. Flies were raised in bottles (6 oz. square bottom) containing a standard cornmeal-sucrose-yeast medium consisting of 5.8% cornmeal (w/v), 1.2% sucrose (w/v), 3.1% active dry yeast (w/v), 0.7% agar (w/v), 1% propionic acid (v/v), and 0.22% Tegosept (w/v, pre-dissolved in ethanol). For most experiments, groups of eclosed adults (3–5 d old) were sexed under CO2 anesthesia and maintained on the appropriate medium (25 × 95 mm narrow vials, ~30 flies per vial) in an incubator with controlled temperature (25 °C), humidity (>65%), and light (12/12-h light/dark cycle) until used for the feeding assays. For each assay, experimental groups of flies were housed in alternating or random order to minimize the effects of microenvironment. Unless otherwise stated, all assays started 1 h into the light cycle (zeitgeber time 1 h or ZT1).
Food preparation for feeding assays
Throughout this study, 1× medium refers to a solution of 2.5% BactoTM yeast extract (BD Diagnostic Systems) and 2.5% sucrose (both w/v). For solid media, BactoTM agar (BD Diagnostic Systems) was included at 1% w/v regardless of food concentration. For the solid media used in the compensatory feeding studies, all solutions were made from heated (~60 °C) stocks of 2% agar, 4× or 8× solutions of yeast extract/sucrose, and water to achieve desired concentrations. For dye and radioisotope-labeling studies, FD&C Blue #1 (Spectrum Chemical) or [α-32P]-dCTP (PerkinElmer) were added to 1% (w/v) or 1–2 μCi/ml (final), respectively, prior to dispensing 1–2 ml of medium per vial. Non-solidified aliquots of the labeled media were saved to calibrate feeding measurements, as described below. For liquid food assays, all dilutions were prepared from a sterile-filtered solution of 10% yeast extract + 10% sucrose.
CAFE assay
The CAFE assay was performed essentially as described, with minor modifications to the chamber (Fig. 1c)22. Briefly, CAFE chambers were made from standard fly vials (25 × 95 mm) cut to a height of 6 cm and filled with 5 ml of 1% agar that serves as a water source and maintains internal chamber humidity. Four air holes made with a 20 G needle were equally spaced ~1 cm above the agar surface. Vials were sealed with rubber septa (#89097-558, VWR) containing two trimmed 200-μl pipette tips to hold the glass capillaries. Two capillaries (#53432-706, VWR) each with 5 μl of liquid food were provided per CAFE chamber and were replaced every ~12 hours. Identical chambers without flies were maintained as controls for evaporation (typically <10% of ingested volumes) and these measurements were subtracted from consumption data. Typically, 24-h feeding is shown after 1–2 days of habituation in the CAFE. Alternatively, linear fits of cumulative food intake over several days can provide a slope representing daily food intake. Since feeding is not continuous throughout the day, the intraday measurements may skew a linear fit. This can be minimized by summing data into 24-h bins before fitting data. To save on the cost and waste of glass capillaries, a protocol for rinsing and re-using them was developed (Supplementary Fig. 7). For each condition tested, 5–9 CAFE chambers housing 4 flies each were typically used. For experiments with 32P-labeled liquid food, scintillation vials were modified to be used directly as the CAFE chamber so that excretion in the empty vials could be measured.
Food labeling with dye or radioactive tracer
Radioisotope-labeling was performed essentially as described4. Briefly, adult flies were habituated on the experimental food for four days prior to testing, with a transfer to fresh food on the second day. On the fourth day, flies were transferred to the experimental medium supplemented with 1–2 μCi/ml [α-32P]-dCTP. After 24 h, flies were transferred to empty vials and allowed to groom for ~15 min. Flies were killed by freezing, counted, and then assayed in 5 ml of scintillation fluid (ScintiVerseTM BD Cocktail, Fisher Scientific) in a Multi-Purpose Scintillation Counter (LS 6500, Beckman Coulter). Flies fed non-labeled food were used as controls and their scintillation counts were subtracted from experimental readings. These counts were equivalent to background. Aliquots (10–20 μl) of the non-solidified food with the radioactive tracer were used to calculate food volumes from scintillation counts. For diets that are difficult to accurately pipette, taking the mass of scintillation vials before and after dispensing the aliquot provides highly accurate and reproducible calibrations. For each condition tested, 4–5 vials containing 10–20 flies each were typically used. For 14C studies, experimental medium was supplemented with [14C]-leucine or [1,2-14C]-choline to 0.5 μCi/ml food (final). Flies from 14C studies were processed for scintillation counting by adding 250 ml of a 1:1 mixture of 30% (v/v) H2O2: 60% perchloric acid and heating for 2 h at 70 °C in a glass scintillation vial. After cooling to RT, scintillation fluid was added and radioisotope was measured as described above. To measure excreted radiolabel, flies were housed in 20-ml scintillation vials and food was provided in the cap. Discarding the cap then allowed measurement of excreted radiolabel in the empty vials.
Food intake measurements on dye-labeled food were performed similarly to the radioactive tracer assay described above. After habituation on the experimental food for four days, flies were transferred at 1 hour past lights-on to identical media containing 1% (w/v) FD&C Blue #1. After 15 min, 1 h, or 4 h of feeding, feeding was interrupted by freezing the vials at −80 °C. Frozen flies were transferred to 1.7 ml Eppendorf tubes and homogenized with a motorized pestle (VWR) in 50 μl of 1× PBS + 1% Triton X-100. The use of detergent (0.01% Triton X-100 is sufficient) is critical for accurate dye measurements from homogenized fly samples. After centrifugation to clear the debris, the absorbance of the supernatant was measured at 630 nm (A630) on a NanoDrop 2000 Spectrophotometer (Thermo Fisher Scientific). Flies fed non-labeled food were used as controls and their A630 values (typically negligible) were subtracted from experimental readings. Serial dilutions of an initial 10 μl aliquot of the non-solidified dye-labeled food added to 0.99 ml of 1× PBS + 1% Triton X-100 were used to generate a standard curve. After determining the equivalent dye concentration of each fly homogenate using the linear fit of the standard curve (R2 was typically >0.99), consumption was calculated by multiplying with the homogenate volume (50 μl) and dividing by the number of flies per sample. Absorbance of the dye with unlabeled fly homogenates did not overlap, demonstrating that eye pigments do not interfere with the assay (Supplementary Fig. 1a). The use of detergents (Triton X-100) and buffer (1× PBS) is important for fully additive absorbance values, likely by minimizing pH effects on dye extinction coefficient and dye loss through adsorption to tube surfaces. For each condition tested, 10 vials containing 5 flies each were typically used.
PE assay
This assay was performed essentially as described21. Briefly, flies were habituated on experimental food for several days and transferred to fresh vials on the evening before the assay. Vials were randomly placed on a viewing rack overnight. Observations of proboscis extension were performed the next day starting at 1 hour past lights-on. For each vial, the number of flies actively feeding with an extended proboscis touching food was counted and successive rounds of measurements were made for 60 min (with the exception of Supplementary Fig. 4b, where 60- or 90-min periods were used), typically producing 20–40 observations per vial. Feeding data were expressed as a proportion of flies feeding (sum of all feeding events for an individual vial divided by the total number of possible feeding opportunities; feeding opportunities = number of flies in the vial × number of observations). Dye calibration was performed by transferring flies to dye-labeled food (1% FD&C Blue #1), measuring the proportion feeding by proboscis extension, and subsequently determining dye accumulation as described above. Although previous studies suggested a 30-min assay is optimal, we found that in our conditions dye excretion began at around 15 min; we thus limited dye calibrations to 15-min periods. For each condition tested, 20 vials containing 5 flies each were typically used.
Statistical analysis
All statistical analyses were performed using GraphPad Prism version 5.04 for Windows (GraphPad Software). Data were analyzed by unpaired, two-tailed t-test or one-way ANOVA followed by Tukey-Kramer post-hoc test for multiple comparisons. The relationship between dye accumulation and proportion feeding was tested using Pearson’s correlation coefficient. ANCOVA was used to determine differences between the slopes of dye accumulation and proportion feeding on different diets. For radioisotope accumulation over several days, the data were fit to the equation, R(t) = a(1 – e−bt), where R is the accumulated radiolabel at time, t, and the parameters a and b account for label accumulation, excretion, and internal capacity19. All data shown are means ± s.e.m.
Supplementary Material
Acknowledgments
This work was supported by grants from the US National Institutes of Health (R00AG030493 and R21DK092735), an Ellison Medical Foundation New Scholar in Aging award, and a Glenn Foundation for Medical Research Award for Research in Biological Mechanisms of Aging. We thank M. Piper and L. Partridge (University College London) for the Dahomey fly line and K.D. Bruce, R. Yamada, and K.R. Murphy (The Scripps Research Institute) for comments on the manuscript.
Footnotes
Competing Financial Interests
The authors declare no competing financial interests.
Author Contributions
All authors designed and carried out experiments. S.A.D., G.B.C., A.A., A.M.P., S.H., and W.W.J. also analyzed data and wrote the paper.
References
- 1.Carvalho GB, Kapahi P, Benzer S. Compensatory ingestion upon dietary restriction in Drosophila melanogaster. Nat Methods. 2005;2:813–815. doi: 10.1038/nmeth798. [DOI] [PMC free article] [PubMed] [Google Scholar]
- 2.Grandison RC, Piper MD, Partridge L. Amino-acid imbalance explains extension of lifespan by dietary restriction in Drosophila. Nature. 2009;462:1061–1064. doi: 10.1038/nature08619. [DOI] [PMC free article] [PubMed] [Google Scholar]
- 3.Heilbronn LK, Ravussin E. Calorie restriction and aging: review of the literature and implications for studies in humans. Am J Clin Nutr. 2003;78:361–369. doi: 10.1093/ajcn/78.3.361. [DOI] [PubMed] [Google Scholar]
- 4.Ja WW, et al. Water- and nutrient-dependent effects of dietary restriction on Drosophila lifespan. Proc Natl Acad Sci USA. 2009;106:18633–18637. doi: 10.1073/pnas.0908016106. [DOI] [PMC free article] [PubMed] [Google Scholar]
- 5.Lee KP, et al. Lifespan and reproduction in Drosophila: New insights from nutritional geometry. Proc Natl Acad Sci USA. 2008;105:2498–2503. doi: 10.1073/pnas.0710787105. [DOI] [PMC free article] [PubMed] [Google Scholar]
- 6.Min KJ, Tatar M. Restriction of amino acids extends lifespan in Drosophila melanogaster. Mech Ageing Dev. 2006;127:643–646. doi: 10.1016/j.mad.2006.02.005. [DOI] [PubMed] [Google Scholar]
- 7.Broughton SJ, et al. DILP-producing median neurosecretory cells in the Drosophila brain mediate the response of lifespan to nutrition. Aging Cell. 2010;9:336–346. doi: 10.1111/j.1474-9726.2010.00558.x. [DOI] [PMC free article] [PubMed] [Google Scholar]
- 8.Driver CJI, Wallis R, Cosopodiotis G, Ettershank G. Is a fat metabolite the major diet dependent accelerator of aging? Exp Gerontol. 1986;21:497–507. doi: 10.1016/0531-5565(86)90002-1. [DOI] [PubMed] [Google Scholar]
- 9.Mair W, Piper MD, Partridge L. Calories do not explain extension of life span by dietary restriction in Drosophila. PLoS Biol. 2005;3:e223. doi: 10.1371/journal.pbio.0030223. [DOI] [PMC free article] [PubMed] [Google Scholar]
- 10.Edgecomb RS, Harth CE, Schneiderman AM. Regulation of feeding behavior in adult Drosophila melanogaster varies with feeding regime and nutritional state. J Exp Biol. 1994;197:215–235. doi: 10.1242/jeb.197.1.215. [DOI] [PubMed] [Google Scholar]
- 11.Wood JG, et al. Sirtuin activators mimic caloric restriction and delay ageing in metazoans. Nature. 2004;430:686–689. doi: 10.1038/nature02789. [DOI] [PubMed] [Google Scholar]
- 12.Ayaki T, Oshima K, Yoshikawa I. Linear relationship between lethal mutation yield and intake of ethyl methanesulfonate in Drosophila melanogaster. Environ Mutagen. 1985;7:147–153. doi: 10.1002/em.2860070203. [DOI] [PubMed] [Google Scholar]
- 13.Brummel T, Ching A, Seroude L, Simon AF, Benzer S. Drosophila lifespan enhancement by exogenous bacteria. Proc Natl Acad Sci USA. 2004;101:12974–12979. doi: 10.1073/pnas.0405207101. [DOI] [PMC free article] [PubMed] [Google Scholar]
- 14.Carvalho GB, Kapahi P, Anderson DJ, Benzer S. Allocrine modulation of feeding behavior by the Sex Peptide of Drosophila. Curr Biol. 2006;16:692–696. doi: 10.1016/j.cub.2006.02.064. [DOI] [PMC free article] [PubMed] [Google Scholar]
- 15.Geer BW, Olander RM, Sharp PL. Quantification of dietary choline utilization in adult Drosophila melanogaster by radioisotope methods. J Insect Physiol. 1970;16:33–43. doi: 10.1016/0022-1910(70)90110-1. [DOI] [PubMed] [Google Scholar]
- 16.Thompson ED, Reeder BA. Method for selecting exposure levels for the Drosophila sex-linked recessive lethal assay. Environ Mol Mutagen. 1987;10:357–365. doi: 10.1002/em.2850100405. [DOI] [PubMed] [Google Scholar]
- 17.Thompson ED, Reeder BA, Bruce RD. Characterization of a method for quantitating food consumption for mutation assays in Drosophila. Environ Mol Mutagen. 1991;18:14–21. doi: 10.1002/em.2850180104. [DOI] [PubMed] [Google Scholar]
- 18.Zeng C, et al. Gender-specific prandial response to dietary restriction and oxidative stress in Drosophila melanogaster. Fly (Austin) 2011;5:174–180. doi: 10.4161/fly.5.3.15572. [DOI] [PMC free article] [PubMed] [Google Scholar]
- 19.Wong R, Piper MD, Blanc E, Partridge L. Pitfalls of measuring feeding rate in the fruit fly Drosophila melanogaster. Nat Methods. 2008;5:214–215. doi: 10.1038/nmeth0308-214. author reply 215. [DOI] [PMC free article] [PubMed] [Google Scholar]
- 20.Ewing LS, Ewing AW. Courtship of Drosophila melanogaster in large observation chambers: the influence of female reproductive state. Behaviour. 1987;101:243–252. [Google Scholar]
- 21.Wong R, Piper MD, Wertheim B, Partridge L. Quantification of food intake in Drosophila. PLoS One. 2009;4:e6063. doi: 10.1371/journal.pone.0006063. [DOI] [PMC free article] [PubMed] [Google Scholar]
- 22.Ja WW, et al. Prandiology of Drosophila and the CAFE assay. Proc Natl Acad Sci USA. 2007;104:8253–8256. doi: 10.1073/pnas.0702726104. [DOI] [PMC free article] [PubMed] [Google Scholar]
- 23.Vigne P, Frelin C. Food presentation modifies longevity and the beneficial action of dietary restriction in Drosophila. Exp Gerontol. 2010;45:113–118. doi: 10.1016/j.exger.2009.10.016. [DOI] [PubMed] [Google Scholar]
- 24.Catterson JH, et al. Dietary modulation of Drosophila sleep-wake behaviour. PLoS One. 2010;5:e12062. doi: 10.1371/journal.pone.0012062. [DOI] [PMC free article] [PubMed] [Google Scholar]
- 25.Chatterjee A, Tanoue S, Houl JH, Hardin PE. Regulation of gustatory physiology and appetitive behavior by the Drosophila circadian clock. Curr Biol. 2010;20:300–309. doi: 10.1016/j.cub.2009.12.055. [DOI] [PMC free article] [PubMed] [Google Scholar]
- 26.Xu K, Zheng X, Sehgal A. Regulation of feeding and metabolism by neuronal and peripheral clocks in Drosophila. Cell Metab. 2008;8:289–300. doi: 10.1016/j.cmet.2008.09.006. [DOI] [PMC free article] [PubMed] [Google Scholar]
- 27.Sellier MJ, Reeb P, Marion-Poll F. Consumption of bitter alkaloids in Drosophila melanogaster in multiple-choice test conditions. Chem Senses. 2011;36:323–334. doi: 10.1093/chemse/bjq133. [DOI] [PubMed] [Google Scholar]
- 28.Devineni AV, Heberlein U. Preferential ethanol consumption in Drosophila models features of addiction. Curr Biol. 2009;19:2126–2132. doi: 10.1016/j.cub.2009.10.070. [DOI] [PMC free article] [PubMed] [Google Scholar]
- 29.Al-Anzi B, et al. Obesity-blocking neurons in Drosophila. Neuron. 2009;63:329–341. doi: 10.1016/j.neuron.2009.07.021. [DOI] [PMC free article] [PubMed] [Google Scholar]
- 30.Fanson BG, Yap S, Taylor PW. Geometry of compensatory feeding and water consumption in Drosophila melanogaster. J Exp Biol. 2012;215:766–773. doi: 10.1242/jeb.066860. [DOI] [PubMed] [Google Scholar]
- 31.Barnes AI, Wigby S, Boone JM, Partridge L, Chapman T. Feeding, fecundity and lifespan in female Drosophila melanogaster. Proc Biol Sci. 2008;275:1675–1683. doi: 10.1098/rspb.2008.0139. [DOI] [PMC free article] [PubMed] [Google Scholar]
- 32.Bruce KD, et al. High carbohydrate-low protein consumption maximizes Drosophila lifespan. Exp Gerontol. 2013;48:1129–1135. doi: 10.1016/j.exger.2013.02.003. [DOI] [PMC free article] [PubMed] [Google Scholar]
- 33.O’Brien DM, Min KJ, Larsen T, Tatar M. Use of stable isotopes to examine how dietary restriction extends Drosophila lifespan. Curr Biol. 2008;18:R155–156. doi: 10.1016/j.cub.2008.01.021. [DOI] [PubMed] [Google Scholar]
- 34.Min KJ, Hogan MF, Tatar M, O’Brien DM. Resource allocation to reproduction and soma in Drosophila: a stable isotope analysis of carbon from dietary sugar. J Insect Physiol. 2006;52:763–770. doi: 10.1016/j.jinsphys.2006.04.004. [DOI] [PubMed] [Google Scholar]
- 35.Sury MD, Chen JX, Selbach M. The SILAC fly allows for accurate protein quantification in vivo. Mol Cell Proteomics. 2010;9:2173–2183. doi: 10.1074/mcp.M110.000323. [DOI] [PMC free article] [PubMed] [Google Scholar]
- 36.Xu P, et al. Stable isotope labeling with amino acids in Drosophila for quantifying proteins and modifications. J Proteome Res. 2012;11:4403–4412. doi: 10.1021/pr300613c. [DOI] [PMC free article] [PubMed] [Google Scholar]
Associated Data
This section collects any data citations, data availability statements, or supplementary materials included in this article.