

Abstract
All somatic mammalian cells carry two copies of chromosomes (diploidy), whereas organisms with a single copy of their genome such as yeast provide a basis for recessive genetics. Here we report the generation of haploid mouse ES cell lines from parthenogenetic embryos. These cells carry 20 chromosomes, express stem cell markers, and develop into all germ-layers in vitro and in vivo. We also developed a reversible mutagenesis protocol that allows saturated genetic recessive screens and results in homozygous alleles. This system allowed us to generate the first knock-out cell line for the microRNA processing enzyme Drosha. In a forward genetic screen, we identified Gpr107 as a molecule essential for killing by ricin, a toxin being used as bioweapon. Our results open the possibility to combine the power of a haploid genome with pluripotency of embryonic stem cells to uncover fundamental biological processes in defined cell types at a genomic scale.
Introduction
Some organisms such as yeast or social insects are haploid, i.e. they carry a single set of chromosomes (Otto and Jarne, 2001). Haploidy in yeast has been utilized to identify fundamental mechanisms of biology (Hartwell et al., 1974). However, all somatic mammalian cells carry two copies of chromosomes (diploidy) which obscure mutational screens, whereas organism with a single copy of their genome such as yeast provide a basis for genetic analyses where any recessive mutation of essential genes will show a clear phenotype due to the absence of a second gene copy (Hartwell et al., 1974). Haploidy has been achieved in fish embryonic stem cells (Yi et al., 2009), human KBM-7 leukemia cells (Carette et al., 2009; Carette et al.; Kotecki et al., 1999), or by electrofusion to generate hybrid cells (Yan et al., 2000). However, since haploidy is incompatible with mammalian development (Latham et al., 2002), with the exception of KBM-7 derived cells (Carette et al.), no somatic haploid cell has ever been reported in mammals.
Here we show that it is possible to generate mammalian haploid ES cell lines from parthenogenic mouse blastocysts derived from activated oocytes. Such cells show stable growth over multiple passages, can be efficiently subcloned, differentiate at similar kinetics as diploid ES cells and can maintain haploidy even upon initiation of differentiation. Moreover, we provide evidence that haploid ES cells can be readily utilized for reverse genetics and forward genetic screens. Our study provides the experimental framework for a system that carries the promise to combine functional genomics with mammalian stem cell biology.
Results
Derivation of haploid cell lines from parthenogenic murine blastocysts
Parthenogenetic embryos develop from haploid oocytes and thus contain only the maternal genome. However, all reported cell lines derived from parthenogenetic embryos carry a diploid set of chromosomes (Kaufman et al., 1983). We hypothesized that haploid cells might still be present in parthenogenetic early embryos and that haploid ES cells could be derived from such blastocysts. To accomplish this, we activated oocytes from superovulated C57BL/6×129 F1 females by exposure to 5% ethanol. Activated oocytes were then transferred into pseudo-pregnant recipients (Figure 1A). At embryonic day (ED) 3.5, compacted morulae and blastocysts were harvested and cultivated under conditions used to derive ES cells. FACS analysis showed that a small number of the parthenogenetically derived cells indeed displayed a reduced DNA content (Supplementary Figure S1A). Several rounds of FACS purification of this population and subsequent expansion resulted in two independent cell lines derived from two distinct blastocysts, hereafter termed HMSc1 and HMSc2, with a 1n chromosome set in the G1 phase and a 2n chromosome set in the G2 phase of the cell cycle (Figure 1B, Supplementary Figure S1A). Chromosome spreads showed that both cell lines carry a haploid set of 20 chromosomes (Figure 1C, Supplementary Figure S1B). Of note, both cell lines have now been passaged for > 50 times without any signs of proliferative crisis. Thus, exploiting activation of meiotic oocytes and parthenogenetic derivation of blastocysts has allowed us to establish mouse cells with a haploid chromosome set.
Figure 1. Generation of haploid murine ES cell lines.
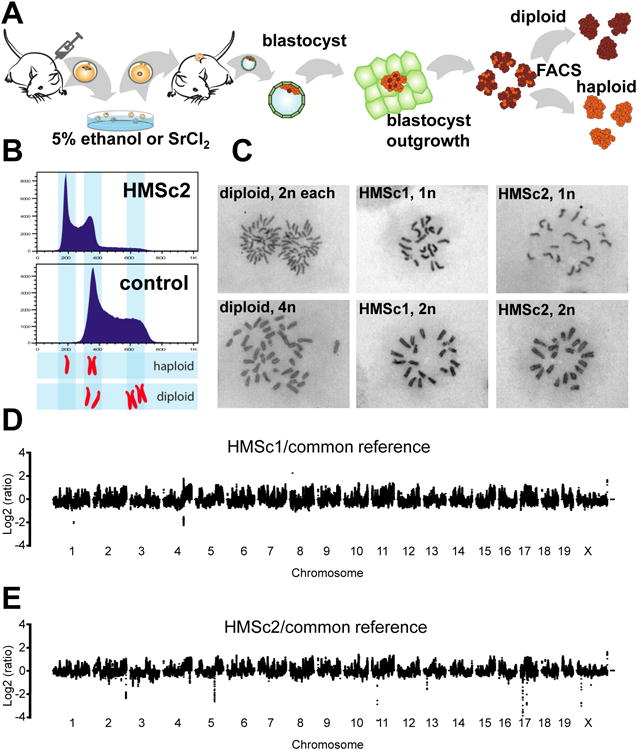
A) Schematic overview of induction of parthenogenesis and the derivation of haploid ES cell lines. Mouse oocytes were activated with either 5% ethanol (or 25mM Strontium Chloride (SrCl2)) and implanted into pseudopregnant females. ES cells were then generated from blastocysts and haploid cells subsequently sorted by FACS. Cultures were routinely resorted until we derived stable haploid cells. B) Flow cytometric analysis of DNA content in the control diploid ES cell line IB10/C and the haploid HMSc2 cell line. DNA content was determined using Hoechst33342. 1n and 2n chromosome sets for haploid and 2n and 4n chromosome sets for diploid ES cells are indicated. The histograms show data from cells at the 10th sort. C) Representative chromosome spreads of control diploid ES cells and haploid HMSc1 and HMSc2 cells. Spreads from anaphase (1n) and prophase (2n) of mitosis are shown for haploid cells. As a control, anaphase (2n) and prophase (4n) spreads are shown for diploid ES cells. D,E) Sequence coverage relative to the common reference of parental in-house C57BL/6 and 129 strains is shown on a log2 scale. Haploid cells were derived from C57BL/6×129 crosses. Chromosomes are arranged in numerical order and separated by small gaps. See also Supplemental Figure S1.
Genome integrity
To genetically characterize our haploid cells, we compared their genomes to the genomes of the parental in-house mouse strains C57BL/6 and 129 using deep sequencing and performed a discriminative coverage analysis. Briefly, we assessed the counts of sequencing reads not counting duplicates that map to unique genomic positions in a sliding window of 50kb (10kb offset), normalized to the total number of reads that mapped to the genome in each library. As expected, we found that the strains differed at many positions. We therefore compared deep sequencing reads from genomic DNA of both our haploid cell lines to both parental strains individually and in a combined fashion in which we focused on deviations with respect to both parental strain (Figure 1D, E). In total, we found that HMSc1 differed from the parental strains by more than 2 fold (multiple-testing corrected p-value≤10-3) in 1553 overlapping windows corresponding to 219 non-overlapping regions, HMSc2 had 568 windows (113 regions) with increased and 61 windows (10 regions) with decreased read-counts (≥2-fold; multiple-testing corrected p-value≤10-3; Supplementary Table 1). Of note, 1155 windows with increased and 99 windows with decreased read-counts overlapped between HMSc1 and HMSc2, while only 397 and 4 were distinct, respectively. We do not know the origin of this observation but these shared copy number variations (CNVs) might stem from biases of the sequencing procedure, either during DNA preparation from different cell-types (ES cells vs. adult kidney) or constitute a batch effect during sequencing. Thus, taken together, our haploid cell lines display a limited number of defined CNVs compared to the parent strains, suggesting that they likely harbor small duplications and deletions similar to previous reports using established ES cell (Baker et al., 2007) or iPS cell lines (Hussein et al., 2011).
To confirm that both haploid cell lines are indeed distinct given the similarity in copy number analysis, we made use of the fact that they were derived from oocytes of C57BL/6 × 129 intercrosses, such that meiotic recombination should result in distinct haplotype structures. We compared the deep sequencing reads to SNPs obtained from the Sanger Institute small nucleotide polymorphisms (SNP) release that differed between both mouse strains. Our sequences covered 1.5 million (HMSc2) and 1.7 million (HMSc1) distinct SNPs and allowed a unique assignment of the corresponding genomic regions to one of both parents. Comparing the SNPs present in HMSc1 versus HMSc2 cells indeed confirmed that we had derived two independent haploid clones (Supplementary Figure S1C). In summary, the CNV analysis together with FACS and chromosome spreads show that both cell lines are derived independently and exclude that HMSc1 and HMSc2 have substantial parts of the genome or individual chromosomes deleted or duplicated.
Expression of prototypic ES cell markers
We next tested whether our haploid cell lines express prototypic embryonic stem cell markers, i.e. whether our haploid cells are indeed ES cells. Both parthenogenetically derived haploid HMSc1 and HMSc2 lines exhibited typical morphologies of ES cells and stained positive for the ES cell marker alkaline phosphatase (Figure 2A). Immunolabelling to detect Oct4, Nanog, and Sox2 (Figure 2B) confirmed that HMSc1 and HMSc2 cells express prototypic ES cell markers. Transcriptome analysis showed that the expression profile for both haploid cell lines closely resembled that of the diploid ES cell line IB10/C (Supplementary Figure S2A). To focus on genes with the highest discriminatory value, we analyzed a set of 100 genes for maximum difference in gene expression in either direction between mouse embryonic fibroblasts (MEFs) and diploid ES cells, amongst them Nanog, Oct4 and Klf4 (Chambers et al., 2003). Analysis of this gene set showed that both HMSc1 and HMSc2 cell lines exhibit an expression signature that closely resembles that of the bona fide diploid ES cell line IB10/C (Supplementary Figure S2B, Supplementary Table 2). Quantitative PCR analyses confirmed that both HMSc1 and HMSc2 cells express prototypic ES cell markers (Figure 2C) (Elling et al., 2006; Takahashi and Yamanaka, 2006). Taken together, global transcriptome profiling and expression analysis of prototypic stem cell markers confirmed the ES cell nature of both haploid cell lines.
Figure 2. Marker analysis and in vitro differentiation potential of haploid ES cell lines.
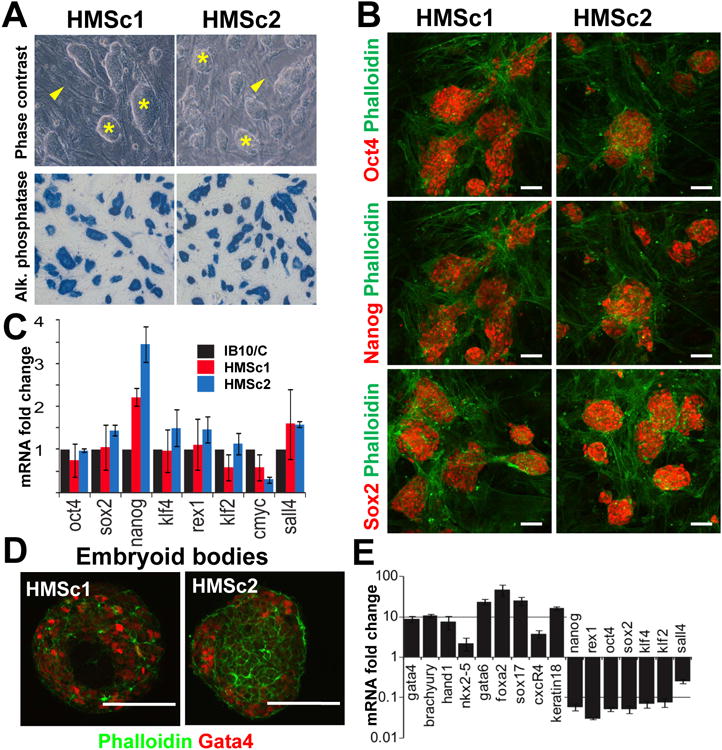
A) Both haploid HMSc1 and HMSc2 cell lines exhibit a morphology characteristic of ES cell colonies (asterisk). Representative phase contrast images are shown. Note the feeder layer of mouse embryonic fibroblasts (MEF) (arrowheads). Haploid cells stain also positive for the ES cell marker alkaline phosphatase (blue, bottom panels). B) Expression of Oct4, Nanog, and Sox2, prototypical markers for murine embryonic stem cells. Phalloidin staining indicates the feeder cell layer. Haploid HMSc1 and HMSc2 cell were co-stained for Oct4 (FITC) and Nanog (TRITC). In both cases, stainings are shown separately in the red channel. Scale bars are 50μm. Data are from cells after the 4th sort. C) Expression of prototypic ES cell marker genes in the haploid HMSc1 (blue) and HMSc2 (red) cells. mRNA expression was determined using qPCR and normalized to diploid IB10/C ES cells (black bars). D) Gata4 protein expression in embryoid bodies (EB, day 7) as a marker for endoderm. Representative EBs are shown for both haploid HMSc1 and HMSc2 ES cell lines counterstained with phalloidin (green). Scale bars are 50μm. E) qPCR revealed down-regulation of the ES cell markers Nanog, Rex1, Oct4, Sox2, Klf2, Klf4, and Sall4 in EBs (day 7) derived from the haploid ES cell line HMSc2 accompanied by expression of the indicated lineage commitment markers (see text). mRNA expression was normalized to the parental, undifferentiated haploid ES cells (set at 1). See also Supplemental Figure S2.
Differentiation potential of haploid ES cells in vitro
To test the differentiation potential of our haploid ES cells, we first assayed for embryoid body (EB) formation. Both haploid cell lines readily underwent EB formation and EB cells expressed the endodermal marker (Soudais et al., 1995) Gata4 (Figure 2D). Differentiation was further confirmed using real time PCR. The prototypic ES cell markers Nanog, Rex1, Oct4, Sox2, Klf4, Sall4, and Kfl2 (Chambers et al., 2003; Robertson et al., 1986; Takahashi and Yamanaka, 2006) were downregulated in EBs while mRNA expression of the lineage commitment markers (Zhang et al.) Hand1 (mesoderm, trophectoderm), Nkx2-5 and Brachyury (both mesoderm), Nestin (neural), Gata4, Gata6, Foxa2 (all early endoderm), Sox17 (endoderm and mesoderm), Cxcr4R (endoderm), and Keratin18 (ectoderm) was upregulated relative to the parental haploid ES cells (Figure 2E, Supplementary Figure S2C). These results indicate that the haploid ES cells are capable of differentiation into several lineages of all three germ-layers.
In vivo differentiation potential
To evaluate the ability of the established haploid ES cell lines to contribute to adult mice, we injected cells from the Agouti+ ES line HMSc2 into ED 3.5 blastocysts. To assure competitive growth and thus efficient contribution, diploid cells derived from haploid HMSc2 were used. Coat colour chimerism was observed in 6 animals out of 25 mice born (Figure 3A). To analyze contribution of the entirely maternal derived cells to various organs as previously reported for parthenogenotes (Thomson and Solter, 1988), we performed a distinguishing PCR and detected HMSc2 derived cells in multiple tissues (Supplementary Figure S3A). To test the intrinsic differentiation potential of our haploid ES cells, we performed in vivo teratoma assays. Similar to diploid ES cell controls, injection of both HMSc1 and HMSc2 cells always resulted in the formation of teratomas within 4-8 weeks.
Figure 3. In vivo differentiation potential of haploid ES cell lines.
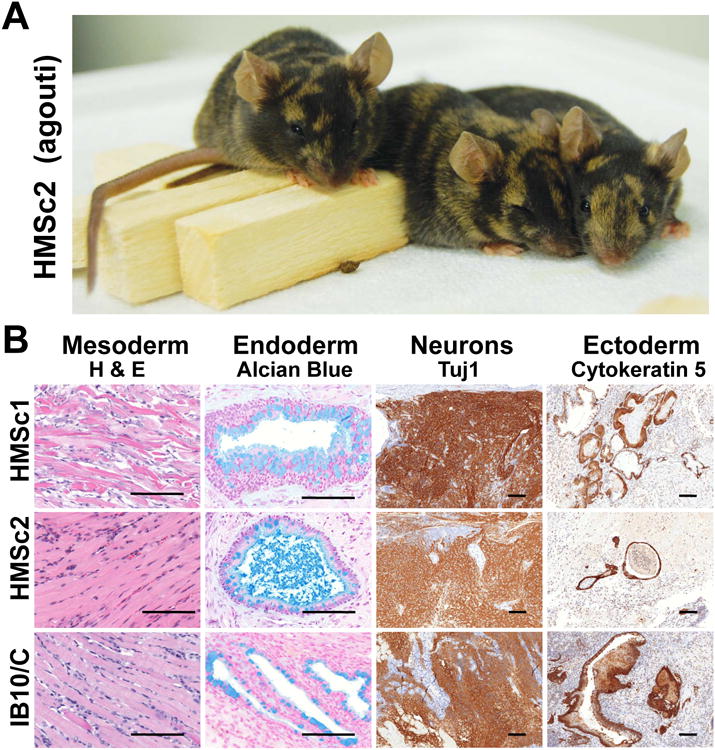
A) Haploid ES cells can contribute to tissues in adult mice. Diploid cells from the Agouti+ clone HMSc2 were injected in into C57BL/6 blastocysts and coat color chimerism was observed (brown fur patches). B) Histological and immunohistological analysis of teratomas derived from control diploid IB10/C ES cells and the haploid ES cell lines HMSc1 and HMSc2. Haploid ES cells can contribute to all three germlayers, namely muscle cells (H&E), intestinal endoderm (mucin producing goblet cells stained by Alcian blue, counterstained with nuclear fast red), Tuj1+ neurons, and Cytokeratin 5 (K5) expressing ectoderm. Tuj1+ and K5+ cells were detected by immunohistochemistry (DAB, brown), counterstained with hematoxylin (blue). Scale bars: 100μm. See also Supplemental Figure S3.
In teratomas derived from both haploid ES cell lines we observed mesoderm derived muscle cells, endoderm derived alcian blue positive epithelial tissues that produce mucin, neuroectoderm derived Tuj1+ neurons, as well as ectoderm-derived Cytokeratin 5+ epithelial tissues (Figure 3B). In addition, we observed bona fide cartilage tissue, fat, keratinized multilayered epithelium, pigmented epithelium, sebaceous sweat glands, glandular and neuronal tubules, or ciliated respiratory epithelium (Supplementary Figure S3B-I). These data show that haploid ES cell derived cells have the potential to contribute to chimeric mice and that they can differentiate in vivo into cells of all three germ layers.
The ability of stable growth and differentiation is intrinsic to haploid ES cells
To assess whether our haploid ES cells have the intrinsic ability for stable growth, we established several individual cell clones by plating single haploid cells directly after FACS purification. These subclones were established in feeder free conditions and derived from both HMSc1 and HMSc2 parental lines that were previously cultured for more than 30 passages. All derived subclones expressed the stem cell markers Oct4 and Sox2 (Figure 4A, Supplementary Figure S4) and formed EBs that contained Gata4+ endodermal cells and Tuj1+ neurons (Figure 4A, Supplementary Figure S5). The haploid subclone HMSc2-27 was chosen for further studies based on its growth rates and numbers of stable haploid cells (Supplementary Figure S6A,B).
Figure 4. Haploid ES cells have the intrinsic ability for stable growth and differentiation.
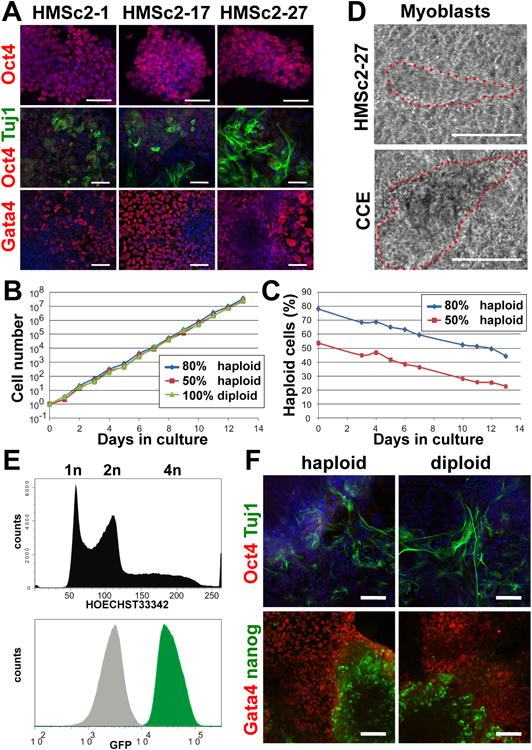
A) Immunostaining for Oct4 protein expression (red) on three different subclones that were established by plating single haploid cells directly after FACS purification (top panels). The middle and bottom panels show immunostaining for Oct4 (red) and Tuj1 (green) expression and expression of the endodermal marker Gata4 (red, counterstained with DAPI) in attached embryoid bodies (EBs, day 10) derived from the indicated subclones. Data are from cells that were subcloned after > 30 passages of the parental line. Scale bars are 50μm. B) Proliferation rates and C) percentages of haploid cells in control cultures containing 100% diploid MHSc2-27 cells and cultures of HMSc2-27 cells seeded at 80:20 and 50:50 ratios of haploid:diploid cells. Multiplication rates and percent haploidy were determined every 24 hours using FACS analysis of Hoechst33342 stained cells. Note that for this experiment cells were continuously kept in culture for 7 passages (14 days). Based on this experiment, we estimate that ∼2-3% of haploid cells became diploid each day over the course of the experiment. D) Development of myoblasts from the haploid ES cell subclone HMSc2-27. The feeder cell free diploid ES cell line CCE was used as a control for this experiment. Representative phase contrast images are shown (see Suppl. movies to watch typical “beating” of these myoblasts). Scale bars are 100μm. E) GFP expression (green) in a GFP-tagged haploid ES cell subclone. Non-GFP labeled cells are shown as control (grey shaded histogram). Flow cytometry of DNA content (Hoechst33342) is shown for the same subclone demonstrating that both haploid and diploid cells express GFP. F) Differentiation of haploid and diploid HMSc2-27 cells into EBs (day 13) that contain Tuj1 neurons (green) and Gata4 expressing endodermal cells (red). Note downregulation of Oct4 expression (red, upper panel) and the presence of residual clusters of Nanog+ cells (green, bottom panels). In the top panels, cells were counterstained with DAPI to visualize nuclei. See also Supplemental Figure S4-S6.
Typical stem cell morphologies, protein expression of Oct4, Nanog, and Sox2, and a haploid set of chromosomes were confirmed for the HMSc2-27 subclone (Supplementary Figure S6C -F). The growth rates of HMSc2-27 cells at different haploid:diploid seeding ratios were comparable to that of purely diploid HMSc2-27 cells (Figure 4B). Of note, these growth rates are comparable to that of previously established ES cell lines. Kinetic studies on diploid versus haploid cell ratios in cultures of HMSc2-27 cells showed that a large fraction of these cells maintains haploidy for a period of 7 passages (Figure 4C). Differentiation of HMSc2-27 ES cells into EBs followed by lineage specific differentiation protocols showed that these cells have the capability to form Gata4+ endoderm, Tuj1+ neuronal lineage (Figure 4A), and mesodermal “beating” myoblasts (Figure 4D, for synchronous contractions see Suppl. Movie 1 and 2). Moreover, in in vivo teratoma assays HMSc2-27 cells can differentiate into cells of all germ layers (not shown). To confirm the subcloning experiment, i.e. to make sure that cloning from a single haploid ES cell indeed works, we generated GFP positive subclones. All cells from the established subclones expressed GFP, irrespective if they were at a stage of haploidy or diploidy (Figure 4E). Since diploid cells cannot become haploid, these experiments confirm that all cells of such clones must have been derived from a single haploid cell.
The HMSc2-27 subclone allowed us to examine the differentiation potential of these cells at a haploid versus diploid state. Haploid HMSc2-27 ES cells were indeed able to downregulate Oct4 and form Tuj1+ neurons and Gata4+ endodermal cells in EB cultures (Figure 4F). We next attempted to differentiate haploid HMSc27 cells directly (without formation of EBs) into neural and astrocyte lineages (Pollard et al., 2006). HMSc2-27 cells were able to differentiate into neural stem cells (NSCs) as defined by Nestin expression. Moreover, upon further differentiation we observed GFAP+ astrocytes and Tuj1+ neurons (Figure 5A and data not shown). We next tested whether differentiation and a state of haploidy are mutual exclusive, i.e. whether haploid cells need to become diploid before they differentiate. We therefore gated for the lineage markers Oct4 and Nestin in embryonic stem cells, neural stem cells, and differentiated neural stem cell cultures and assayed cells for DNA content. Whereas nearly all Oct4+ cells remained haploid under all culture conditions, we observed haploid as well as diploid Nestin+ neural progenitor cells. However, when such neural progenitors were further differentiated towards astrocytes and neurons, all Nestin positive cells became diploid within 4 days (Figure 5B).
Figure 5. Differentiation potential of haploid ES cells.
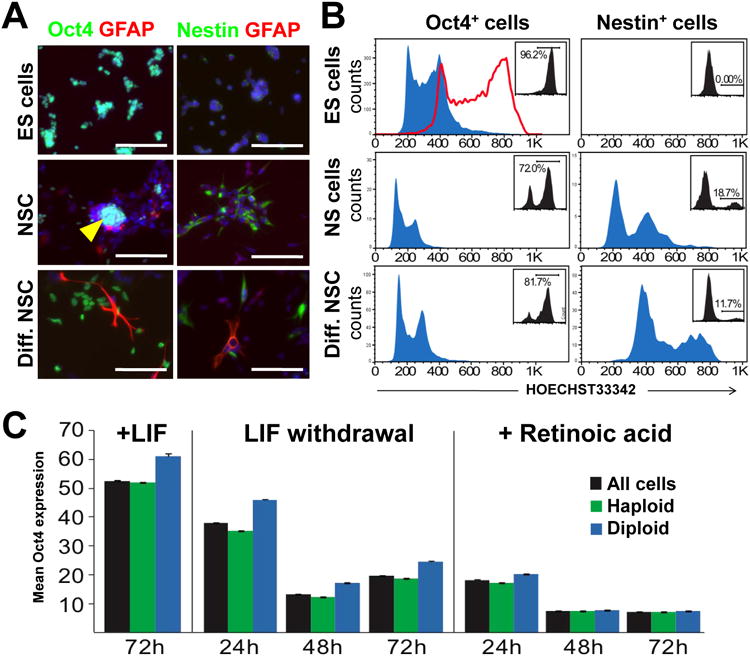
A) Analysis of the haploid ES cell clone HMSc2-27 cultured under conditions to maintain an ES cell fate (ES cells), in vitro differentiated into Nestin+ neural stem cells (NS cells), and further differentiation into GFAP+ astrocytes by withdrawal of EGF and FGF2 in the presence of 1% serum (differentiated NS cell culture conditions). Immunofluorescence labeling of Oct4, Nestin, and GFAP are shown, counterstained for DAPI. Representative imagines are shown. Scale bar is 100μm. B) Flow cytometry analysis of DNA content in cells gated for Oct4 and Nestin expression and grown under ES cell (top), NS cell (middle), and differentiated NS cell (bottom panels) conditions. The gates used and percentages of cells are inserted in each plot. Haploid cells are prominent in Oct4+ fractions under all conditions while Nestin+ cells differentiated for 4 days are devoid of haploid cells. The red line in the top left panel shows the representative DNA content of the diploid control IB10/C ES cell line gated for Oct4 expression. C) Haploid cells exit the pluripotent state following the same dynamics as diploid cells. The left panel shows control Oct4 levels (mean intensity depicted) in haploid HMSc2-27, mixed (haploid and diploid) HMSc2-27, and control diploid CCE ES cells after 72h under control (plus LIF) conditions. Differentiation by LIF withdrawal leads to diminished Oct4 expression of diploid and haploid cells (middle panel). Differentiation induction using 0.5μM retinoic acid results in a rapid loss of Oct4 expression in both haploid and diploid cells, indicative of differentiation (right panel). The same results were obtained when we used 0.1μM retinoic acid (not shown). Data are shown as mean Oct4 fluorescence intensity +/- SEM analysing more than 50.000 cells per condition. 1way ANOVA (p>0.05) showed increased expression of Oct4 in diploid cells (consistent with increased nuclear area) in all conditions except the 48- and 72-hour retinoic acid treatments wherein Oct4 expression was at background levels. See also Supplemental Figure S7.
The differentiation capacity of haploid cells was further assessed using high content screening analysis of Oct4 expression (Walker et al.; Walker et al., 2007), DAPI intensity and nuclear area, enabling automated determination of the differentiation state of haploid and diploid HMSc2-27 cells (Supplementary Figure S7). ES cells cultured in presence of LIF for 72h maintained high levels of Oct4 as depicted by mean Oct4 expression intensity (Figure 5C, left panel). Distribution analysis showed that HMSc2-27 cells that became diploid expressed a slightly higher level of Oct4 than haploid cells, consistent with the larger nucleus. Upon LIF withdrawal, Oct4 expression substantially decreased in haploid and diploid HMSc2-27 cells (Figure 5C, middle panel). Moreover, differentiation in response to 0.5μM retinoic acid dramatically reduced Oct4 expression in haploid and diploid HMSc2-27 cells to background levels (Figure 5C, right panel), similar to results obtained using 0.1μM retinoic acid (data not shown), indicating efficient differentiation. These data show that haploid ES cells can differentiate at similar kinetics as diploid ES cells and, importantly, that haploid stem cells can maintain haploidy even upon initiation of differentiation.
Retroviral mutagenesis
The idea to establish haploid ES cells was to create a tool for forward and reverse genetics at the genomic scale. To demonstrate the power of mutagenesis in haploid mouse ES cells, we infected 5×10⁸ cells of a freshly FACS purified haploid culture of HMSc2-27 with a previously reported retrovirus containing a reversible gene trap (Schnutgen et al., 2008). This vector also contains removable Oct4 binding sites (Schnutgen et al., 2008) which allow for insertions into genes that show minimal or none detectable expression in stem cells. After infection, 7.5×10⁶ independent genomic insertions were generated as estimated from colony formation assays.
ES cell colonies were then pooled and 10μg of genomic DNA corresponding to 3 million cells were analyzed to map the viral insertion sites by inverse PCR and deep sequencing. We could unambiguously identify 176,178 insertions. About half of the insertions were mapped to intergenic regions and ∼ 51% of insertions occurred in promoter regions and intragenic regions encompassing 8203 different genes (5′ and 3′ UTR, 1st intronic, other intronic, and coding regions) (Figure 6A). Among the intragenic insertions, approximately half (53%) were in sense, half in anti-sense direction. Of note, we observed frequent insertions into the 1st intron that most likely will result in complete disruption of gene expression/function. To analyze gene trap efficacy we divided genes into 10 bins based on their expression levels in HMSc2 cells (0-10% equals lowest expression, 90-100% equals highest expressed genes). As expected, more highly expressed genes were more often hit (up to 67%). Importantly, due to the engineered Oct4 binding sites (Schnutgen et al., 2008) we were able to obtain frequent (31%) insertions into genes that show minimal or none detectable expression in ES cells (Figure 6B). We next analyzed the numbers of genes that are trapped by all 176,178 insertions or fractions of the total insertions (Figure 6B; all insertions are set to 100% at the X-axis). This analysis shows that mutagenesis has not reached saturation, indicating that higher numbers of insertions will increase the numbers of targeted genes. Considering that our library consists of 40 × more (7.5×10⁶) independent integrations, our mutagenesis protocol has, in principle, the power to disrupt most genes.
Figure 6. Reverse genetics in haploid ES cells.
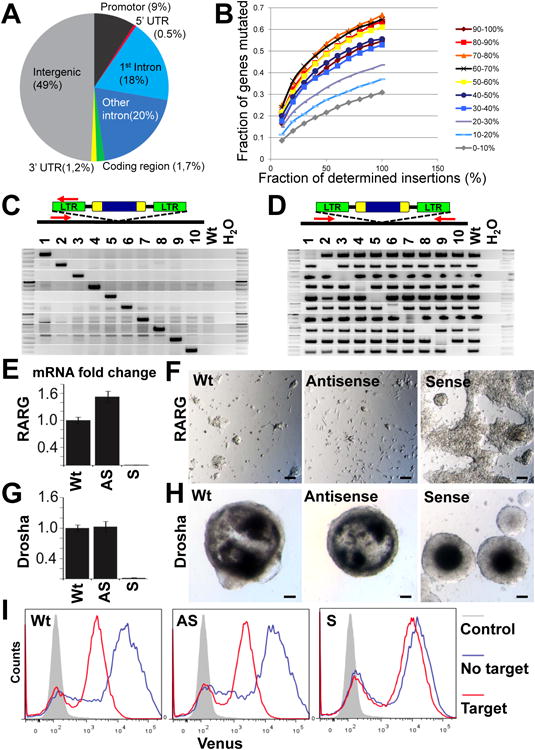
A) Analysis of virus integration sites after neomycin selection. 176,178 insertions were determined by deep sequencing. The retrovirus landed in 49% in intergenic and in 51% in intragenic regions, with a high frequency of integration into introns, especially the first intron. B) Graph shows percentage of genes with virus integrations following a single round of retroviral mutagenesis for different fractions of the total viral integration sites (X-axis). Genes with the 10% lowest expression (0-10%) showed the least integration efficiency while higher expressed genes (50-100%) show more efficient gene trapping. For increasing fractions of the total viral integration sites (X-axis) higher saturation is reached, up to 67% yet not reaching saturation, indicating that additional genes are trapped in the total library of 7.5 million independent insertions. C,D) PCR analysis using site specific primers for the indicated genes and a primer specific for the LTR of the inserted retrovirus. The location of the used PCR primers is schematically indicated on top of each panel. Of note, all primers were used for all 10 different genes showing (C) that the virus has indeed integrated into the site identified by initial sequencing and (D) that the integrations result in homozygous mutations of the respective loci. Lane 1 = Madcam1; lane 2 = Drosha; lane 3 = Retinoic acid receptor gamma (Rarg); lane 4 = Ap4s1; lane 5 = Arap1; lane 6 = Evx1; lane 7 = Bcl2l1; lane 8 = 2210012G02RIK; lane 9 = Titin; lane 10 = Chr2:50928851. Positive wild type (Wt) and negative H2O controls are shown. E) qPCR analysis of RARG mRNA expression in haploid HMSc2-27 cells that are wild type for rarg (Wt), HMSc2-27 cells that contain the splice acceptor in antisense orientation (AS), and HMSc2-27 cells that contain the splice acceptor in the sense orientation (S). mRNA expression was normalized to the parental HMSc2-27 cells. F) Representative images of cultures containing the indicated wild type, antisense, and sense RARG HMSc2-27 cells treated with 0.1μM retinoic acid for 10 days. Note the near complete absence of cells in the Wt and antisense cultures. Scale bars are 100μm. G) qPCR analysis of Drosha mRNA expression in haploid HMSc2-27 cells that are wild type for Drosha (Wt), HMSc2-27 cells that contain the splice acceptor in antisense orientation (AS), and HMSc2-27 cells that contain the splice acceptor in the sense orientation (S). mRNA expression was normalized to parental HMSc2-27 cells. H) Complete absence of cystic embryoid bodies in Drosha deficient HMSc2-27 cells as compared to Drosha expressing wild type HMSc2-27 cells and cells containing the splice acceptor in the antisense orientation. Representative images for embryoid bodies are shown on day 10 after EB induction. Of note, we did not observe a single cystic EB in Drosha mutant cells even in prolonged culture. Scale bars are 100μm. I) Histograms showing Venus reporter gene expression in wild type HMSc2-27 cells (Wt), HMSc2-27 cells that contain the splice acceptor in antisense orientation (AS), and HMSc2-27 cells that contain the splice acceptor in the sense orientation (S) transduced with pSENSOR-based miRNA constructs harboring a potent shRNA targeting Firefly Luciferase with (target) or without its target (no target) site in the 3′UTR of Venus. Cells were gated on shRNA expressing (dsRed+) cells and Venus expression levels were compared to nontransduced control cells (grey).
Haploid murine ES cells as a tool for high throughput reverse genetics
Using our retroviral mutagenesis set-up we next picked individual clones, identified the insertion sites of about 1000 cell lines (not shown), and selected 10 clones with sense or antisense insertions for further analysis. PCR analysis with site specific primers confirmed that our sequencing approach identified the correct target sites in all 10 cases (Figure 6C). Most importantly these data also show that all 10 clones carry homozygous insertions (Figure 6D), indicating that mutagenesis has occurred in haploid cells and that this approach is indeed feasible for recessive genetics.
Two clones carrying insertions in the genes encoding the retinoic acid receptor gamma (Rarg) and Drosha were functionally validated using parental wild type (Wt) HMSc2-27 cells, or ES cells clones that carry the retroviral vector in antisense orientation. By transient Cre expression we then converted the alleles to sense integrations in which the splice acceptor disrupts gene expression; this approach allows for immediate confirmation of the candidate gene and excludes potential background mutations. Indeed, sense, but not antisense integrations of the splice acceptor results in a near complete absence of Rarg mRNA expression (Figure 6E). Functionally, whereas ES cells carrying the wild type (Wt) allele or the splice acceptors in antisense orientation undergo rapid differentiation and cell death upon retinoic acid treatment, disruption of Rarg expression renders ES cells insensitive to such retinoic acid effect (Figure 6F).
The RNase III Drosha catalyzes the conversion of pri-miRNA transcripts into pre-miRNA stem-loop precursors in the nucleus (Lee et al., 2003). Due to this pivotal role in the initial step of miRNA processing, homozygous Drosha inactivation is predicted to severely impair miRNA biogenesis. While a conditional Drosha knock-out mouse has been published previously (Chong et al., 2008), no viable Drosha knock-out cell line has been reported yet. We were indeed able to generate a Drosha mutant ES cell clone following Cre mediated inversion of the splice acceptor (Figure 6G). As reported for ES cells with mutations in the pasha orthologue Dgcr8 (Wang et al., 2007), which together with Drosha is part of a protein complex called the Microprocessor complex (Denli et al., 2004), drosha mutant ES cell cannot form cystic embryoid bodies (Figure 6H). To evaluate primary miRNA processing in ES cells harboring the disrupted Drosha allele, we monitored the effects of a potent miR30-based shRNA (shmiR.Luc1309) on expression of a transcript harboring a Luc1309 specific shRNA target site (target) in the 3′UTR of a sequence encoding the Venus reporter protein (Fellmann et al. 2011). While expression of shmiR.Luc1309 strongly suppressed Venus expression in normal ES cells, our Drosha deficient ES cell clone did not show shRNA-mediated reporter suppression (Figure 6I), indicating a dysfunctional miRNA pathway. These data show that haploid ES cells can be indeed efficiently used for reverse genetics creating reversible and homozygous mutations.
A genome wide screen for genes involved in Ricin toxicity
Finally, we set out to perform a recessive forward genetic screen at the genome level using our haploid ES cell system. The naturally occurring ricin toxin from the castor oil plant Ricinus communis is highly poisonous. At the molecular level, ricin binds to N- acetyl galactosamine or beta-1,4-linked galactose residues and mannose receptors on the cell surface and ricin molecules are thought to follow retrograde transport via the Golgi apparatus to enter the lumen of the endoplasmic reticulum (ER) where they escape into the cytosol to inactivate ribosomes (Spooner and Lord, 2011). Since we found that ricin is highly toxic to mouse ES cells, we used our mutagenized haploid HMSc2-27 cell library and challenged the cells with a lethal dose of ricin. Whereas ricin killed all control ES cells, we observed growth of multiple ES cell colonies from the mutagenized haploid HMSc2-27 cells (Figure 7A). These clones where then pooled and deep sequenced to determine the integration sites. As expected from previous studies, we found multiple enzymes involved in sugar metabolism, i.e. beta-1,4-galactosyltransferase 1 (B4galt1), N-acetyllactosaminide beta-1,6-N-acetylglucosaminyl-transferase (Gcnt2), polypeptide N-acetylgalactosaminyltransferase2 (Galnt2), glycoprotein galactosyltransferase alpha 1,3 (Ggta1), and polypeptide N-acetylgalactosaminyltransferase3 (B4galnt3) (Figure 7B, C). We also obtained multiple disruptive mutations in the alpha-(1,3)-fucosyltransferase Fut9 and we hit the GDP-fucose transporter1 Slc35c1 (Figure 7B, C). The fucosylation pathway has until now never been associated with ricin toxicity.
Figure 7. Forward genetic screen for ricin toxicity in haploid ES cells.
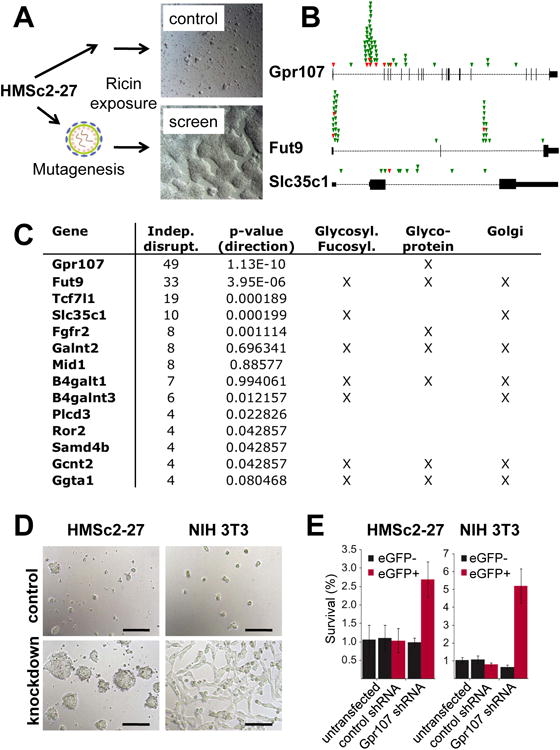
A) Haploid HMSc2-27 with/without gene-trap mutagenesis was exposed to ricin from Ricinus communis for 3 weeks. Colonies only appeared in the mutagenized batch and were processed for deep sequencing. B) Top hits identified in the ricin toxicity screen. Sense (green) and antisense (red) insertions in Gpr107, Fut9, and Slc35c1 genomic loci. The vertical lines indicate the respective exons for each gene with the first exon always moved to the left side of each diagram. Insertions in antisense might disrupt gene function, sense integrations will do so in almost all cases. Note that nearly all insertions are in sense for the splice acceptor and that some antisense integrations map to exons, all of which should result in disruptive mutations. Considering that ∼ 50% of intragenic insertions are sense and ∼ 50% in antisense, these data also show that the screen has indeed strongly enriched for disruptive mutations (p>1.13E-10 for Gpr107; p>3.95E-6 for Fut9; p>0.000019 for Slc35c1). C) Genes identified in the ricin toxicity screen. The numbers of distinct retroviral insertions predicted to disrupt gene expression (either because intragenic regions containing the sense orientation of the splice acceptor, or sense and antisense integrations into exons) are indicated. Enrichment for sense mutations vs anti-sense integrations was assessed using a binomial test and the respective p values are indicated. Of note, anti-sense integrations can also lead to gene disruption. Assigned biochemical pathways and allocation to the Golgi apparatus are also indicated. D, E) Validation of Gpr107 in Ricin toxicity. HMSc2-27 ES cells and NIH3T3 cells were transduced with LMN-constructs expressing Gpr107 or control shRNAs together with GFP and then challenged with a lethal dose of ricin for 2 days. Images show representative cultures after 48 hours of ricin treatment (D). Scale bars are 100μm. (E) The ricin survival rate as ratio between recovered cells of ricin treated vs. ricin untreated cells is shown in % (as determined by quantitative FACS analysis of cells gated for viability by forward scatter, side scatter, and PI staining after 48 hours of ricin treatment). Cells were cultured in 10cm dishes in triplicates and average survival +/- SD was determined for eGFP negative (not transduced) and eGFP positive haploid HMSc2-27 ES cells and NIH 3T3 cells for each plate.
Intriguingly, we observed 49 different integrations in the GPCR Gpr107 (LUSTR1) (Figure 7B), suggesting that Gpr107 is a key molecule involved in ricin toxicity. Knockdown of Gpr107 expression in MHSc2-27 cells using shRNA technology in HMSc2 confirmed the central role of this GPCR in ricin toxicity. The key role of Gpr107 in ricin-induced cell death was further confirmed in a different cell type, i.e. NIH 3T3 cells (Fig 7D, E). Of note, our shRNA data are shown as ratios of viable cells recovered from the plates with ricin vs without ricin treatment (% survival): around 1% of nontransduced or control shRNA transduced cells remained still viable after 48 hours of ricin treatment, as compared to their respective non-treated cells; shRNA mediated knockdown of Gpr107 significantly enhanced survival of ricin exposed HMSc2-27 as well as NIH 3T3 cells, but did not fully protect these cells from ricin toxicity. By contrast, genetic ablation of Gpr107 in haploid HMSc2-27 ES cells as performed for the screen resulted in cells that survived ricin application for 3 weeks and were able to expand and form colonies starting from single, mutated cells. Thus, forward genetic screens are feasible and efficient in our haploid ES cells.
Discussion
Our data show that it is possible to generate mammalian haploid ES cell lines from parthenogenetic mouse blastocysts derived from ethanol activated oocytes. In addition, we have now also successfully used Strontium chloride to activate oocytes and derived a third independent haploid ES cell line (not shown). Detailed molecular characterization of our haploid ES cells shows that these cells express all classical markers of diploid ES cells, carry 20 chromosomes, and largely maintain genome integrity. Functionally, these haploid ES cells can differentiate into cells from all three germlayers in vitro and in vivo. Although our lines and subclones are stable and in some cases have been maintained for over 70 passages, some haploid cells become diploid. Our mutagenesis data suggest that these cells do not become diploid via cell fusion, but rather via failed cytokinesis and/or endoreplication of the genome. The exact mechanism needs to be determined. Moreover, it will be interesting to determine at what stage of development haploid cells have to become diploid to form a certain cell type, experiments that will be feasible using our high-throughput imaging platform that also allows to us to track haploidy in a single cell.
Most importantly, our haploid ES cells can be mutated and, in all cases we have analysed to date, these mutations are homozygous indicating that such haploid cells can be used to analyze recessive and disease phenotypes in various cell lineages in vitro. Although we detected contribution of our cell lines to multiple tissues in vivo, it needs to be determined whether these haploid cells might be able to contribute to the germline. However, germline transmission could be attempted using semi-cloning techniques as previously reported for Medaka (Yi et al., 2009).
Our results open the possibility to combine the power of a haploid genome with pluripotency of embryonic stem cells. Recessive genetic screens have elucidated a wide variety of biological processes over the last century and thus markedly contributed to our understanding of normal development, basic physiology, and disease (Nusslein-Volhard and Wieschaus, 1980). However, due to the asexual proliferation cycle, saturated genetic screens in mammals are not possible in cell culture systems nor feasible in vivo (Carette et al., 2009). RNA interference-based approaches have therefore revolutionized functional genomics. However, in many cases RNAi-mediated gene silencing still suffers from variable knockdown, off target effects, and transient silencing effects(Brummelkamp et al., 2002; Carpenter and Sabatini, 2004; Fellmann et al. 2011). Our experiments based on millions of different integrations generated in a single round of retroviral infection of haploid ES cells show that it should be possible to perform saturated genetic recessive screens in mammalian ES cells. We also report that reverse genetics is feasible using a vector system that provides immediate confirmation of gene function in the same clones using Cre mediated conversion of the splice acceptor sites. Using this system we have indeed been able to functionally validate our approach using clones with conditional Rarg and Drosha mutations. Moreover, we performed a forward genetic screen for ricin toxicity, one of the most dangerous poisons also being used/investigated as a biological weapon by governments. Ricin also gained notoriety for its potential use as toxin in bioterrorism (Papaloucas et al., 2008). This screen in haploid ES cells identified the GPCR Gpr107 as an essential molecule required for ricin induced killing. Since no antitoxins are available for treatment of ricin poisoning, molecular inhibition of Gpr107 (and possibly other molecules identified by our screen) might be useful to alleviate ricin toxicity in vivo, a hypothesis that now needs to be tested. We anticipate that our novel haploid ES cells can bridge the power of haploid organisms such as yeast with rapid and whole genome genetic forward screens in stem cells or any differentiated cell type that one can derive from our haploid mouse ES cell lines.
Methods summary
Parthenogenetic activation of oozytes
Oocytes were collected and incubated in 5% Ethanol for 5 minutes. Subsequently, viable oocytes were transferred into pseudopregnant mice and blastocysts were collected at embryonic day 3.5.
Derivation of ES cells
Blastocysts were placed on a feeder coated cell culture dish with ES cell derivation medium as previously described (Bryja et al., 2006). Blastocyst outgrowths were trypsinized and replated on a feeder layer to allow for ES cell colony outgrowth.
Genomic sequencing
Purified DNA from mouse kidney or ES cells was sheared by sonication and subjected to the Illumina adaptor ligation protocol and sequenced in Illumina HiSeq. Reads were mapped to the genome using bowtie.
Stem cell characterization
Cells were analyzed for the presence of stem cell markers using qPCR or immunofluorescent labeling as well as an enzymatic assay for alkaline phosphatase.
Differentiation
Cells were differentiated by withdrawal of LIF and EB formation or by direct neuronal differentiation (Pollard et al., 2006). For teratoma formation, cells were injected testicular or subcutaneously into nude mice and teratoma growth was monitored. To generate chimeric mice, HMSc2 ES cells were injected into C57BL/6 ED3.5 blastocysts, and transferred into pseudopregnant females. Percentage chimerism was determined by coat colour.
Retroviral Infection of ES cells and inverse PCR
Virus was packaged in Platinum E cells. Selection for gene trap insertions was done using G418. The protocol for inverse PCR was adapted based on Carette et al. (Carette et al., 2011).
Ricin toxicity screen
A mutated library of cells was exposed to a lethal dose of ricin for 3 weeks. DNA of surviving cells was purified, subjected to inverse PCR and analyzed by deep sequencing. For confirmation using shRNA knockdowns, cells were exposed to ricin for 48 hours and survival was quantified using FACS.
Supplementary Material
Acknowledgments
We would like to thank all members of our laboratories, in particular Dr. Wing Chang, for helpful discussions. Funding was provided by the Canadian Institutes for Health Research (MOP-89910) to W.L.S. W.L.S. is funded by a Canada Research Chair in Integrative Stem Cell Biology. U.E. was supported by a grant from the FWF (Project I434-B13). G.W. and D. S. were funded from the European Community's Seventh Framework Programme (FP7/2007-2013) under grant agreement n° 223151 - INFLA-CARE.” A.S. is supported by an European Research Council (ERC) Starting Grant from the European Community's Seventh Framework Programme (FP7/2007-2013)/ERC grant agreement no. 242922. J.M.P. is supported by grants from IMBA, the Austrian Ministry of Sciences, the Austrian Academy of Sciences, GEN-AU (AustroMouse), and an EU ERC Advanced Grant. This work was supported, in part, by the Howard Hughes Medical Institute and a grant from the Gordon and Betty Moore foundation to JRE. JRE is a HHMI-GBMP Investigator. We thank B. Zuber for helpful discussions and pathologic examination of teratomas. We are grateful to Thijn Brummelkamp for valuable discussions to establish retrovirus based genome wide mutagenesis. We thank all IMBA service units, especially Biooptics, the VBC Genomics unit, and the Transgenic Service, for technical support with this project.
Footnotes
Accession numbers: The microarray data have been deposited in ArrayExpress, accession number XXXX. All the primary sequencing data are available from GEO with the accession number XXXX and at http://www.starklab.org/data/elling_CSC_2011/ formatted for uploading to the UCSC genome browser (http://genome.ucsc.edu/).
Publisher's Disclaimer: This is a PDF file of an unedited manuscript that has been accepted for publication. As a service to our customers we are providing this early version of the manuscript. The manuscript will undergo copyediting, typesetting, and review of the resulting proof before it is published in its final citable form. Please note that during the production process errors may be discovered which could affect the content, and all legal disclaimers that apply to the journal pertain.
References
- Baker DE, Harrison NJ, Maltby E, Smith K, Moore HD, Shaw PJ, Heath PR, Holden H, Andrews PW. Adaptation to culture of human embryonic stem cells and oncogenesis in vivo. Nat Biotechnol. 2007;25:207–215. doi: 10.1038/nbt1285. [DOI] [PubMed] [Google Scholar]
- Brummelkamp TR, Bernards R, Agami R. A system for stable expression of short interfering RNAs in mammalian cells. Science. 2002;296:550–553. doi: 10.1126/science.1068999. [DOI] [PubMed] [Google Scholar]
- Bryja V, Bonilla S, Arenas E. Derivation of mouse embryonic stem cells. Nat Protoc. 2006;1:2082–2087. doi: 10.1038/nprot.2006.355. [DOI] [PubMed] [Google Scholar]
- Carette JE, Guimaraes CP, Varadarajan M, Park AS, Wuethrich I, Godarova A, Kotecki M, Cochran BH, Spooner E, Ploegh HL, et al. Haploid genetic screens in human cells identify host factors used by pathogens. Science. 2009;326:1231–1235. doi: 10.1126/science.1178955. [DOI] [PubMed] [Google Scholar]
- Carette JE, Guimaraes CP, Wuethrich I, Blomen VA, Varadarajan M, Sun C, Bell G, Yuan B, Muellner MK, Nijman SM, et al. Global gene disruption in human cells to assign genes to phenotypes by deep sequencing. Nat Biotechnol. 2011;29:542–546. doi: 10.1038/nbt.1857. [DOI] [PMC free article] [PubMed] [Google Scholar]
- Carette JE, Raaben M, Wong AC, Herbert AS, Obernosterer G, Mulherkar N, Kuehne AI, Kranzusch PJ, Griffin AM, Ruthel G, et al. Ebola virus entry requires the cholesterol transporter Niemann-Pick C1. Nature. 477:340–343. doi: 10.1038/nature10348. [DOI] [PMC free article] [PubMed] [Google Scholar]
- Carpenter AE, Sabatini DM. Systematic genome-wide screens of gene function. Nat Rev Genet. 2004;5:11–22. doi: 10.1038/nrg1248. [DOI] [PubMed] [Google Scholar]
- Chambers I, Colby D, Robertson M, Nichols J, Lee S, Tweedie S, Smith A. Functional expression cloning of Nanog, a pluripotency sustaining factor in embryonic stem cells. Cell. 2003;113:643–655. doi: 10.1016/s0092-8674(03)00392-1. [DOI] [PubMed] [Google Scholar]
- Chong MM, Rasmussen JP, Rudensky AY, Littman DR. The RNAseIII enzyme Drosha is critical in T cells for preventing lethal inflammatory disease. J Exp Med. 2008;205:2005–2017. doi: 10.1084/jem.20081219. [DOI] [PMC free article] [PubMed] [Google Scholar]
- Denli AM, Tops BB, Plasterk RH, Ketting RF, Hannon GJ. Processing of primary microRNAs by the Microprocessor complex. Nature. 2004;432:231–235. doi: 10.1038/nature03049. [DOI] [PubMed] [Google Scholar]
- Elling U, Klasen C, Eisenberger T, Anlag K, Treier M. Murine inner cell massderived lineages depend on Sall4 function. Proc Natl Acad Sci U S A. 2006;103:16319–16324. doi: 10.1073/pnas.0607884103. [DOI] [PMC free article] [PubMed] [Google Scholar]
- Fellmann C, Zuber J, McJunkin K, Chang K, Malone CD, Dickins RA, Xu Q, Hengartner MO, Elledge SJ, Hannon GJ, et al. Functional identification of optimized RNAi triggers using a massively parallel sensor assay. Mol Cell. 2011;41:733–746. doi: 10.1016/j.molcel.2011.02.008. [DOI] [PMC free article] [PubMed] [Google Scholar]
- Hartwell LH, Culotti J, Pringle JR, Reid BJ. Genetic control of the cell division cycle in yeast. Science. 1974;183:46–51. doi: 10.1126/science.183.4120.46. [DOI] [PubMed] [Google Scholar]
- Hussein SM, Batada NN, Vuoristo S, Ching RW, Autio R, Narva E, Ng S, Sourour M, Hamalainen R, Olsson C, et al. Copy number variation and selection during reprogramming to pluripotency. Nature. 2011;471:58–62. doi: 10.1038/nature09871. [DOI] [PubMed] [Google Scholar]
- Kaufman MH, Robertson EJ, Handyside AH, Evans MJ. Establishment of pluripotential cell lines from haploid mouse embryos. J Embryol Exp Morphol. 1983;73:249–261. [PubMed] [Google Scholar]
- Kotecki M, Reddy PS, Cochran BH. Isolation and characterization of a nearhaploid human cell line. Exp Cell Res. 1999;252:273–280. doi: 10.1006/excr.1999.4656. [DOI] [PubMed] [Google Scholar]
- Latham KE, Akutsu H, Patel B, Yanagimachi R. Comparison of gene expression during preimplantation development between diploid and haploid mouse embryos. Biol Reprod. 2002;67:386–392. doi: 10.1095/biolreprod67.2.386. [DOI] [PubMed] [Google Scholar]
- Lee Y, Ahn C, Han J, Choi H, Kim J, Yim J, Lee J, Provost P, Radmark O, Kim S, et al. The nuclear RNase III Drosha initiates microRNA processing. Nature. 2003;425:415–419. doi: 10.1038/nature01957. [DOI] [PubMed] [Google Scholar]
- Nusslein-Volhard C, Wieschaus E. Mutations affecting segment number and polarity in Drosophila. Nature. 1980;287:795–801. doi: 10.1038/287795a0. [DOI] [PubMed] [Google Scholar]
- Otto SP, Jarne P. Evolution. Haploids--hapless or happening? Science. 2001;292:2441–2443. doi: 10.1126/science.1062890. [DOI] [PubMed] [Google Scholar]
- Papaloucas M, Papaloucas C, Stergioulas A. Ricin and the assassination of Georgi Markov. Pak J Biol Sci. 2008;11:2370–2371. doi: 10.3923/pjbs.2008.2370.2371. [DOI] [PubMed] [Google Scholar]
- Pollard SM, Benchoua A, Lowell S. Neural stem cells, neurons, and glia. Methods Enzymol. 2006;418:151–169. doi: 10.1016/S0076-6879(06)18010-6. [DOI] [PubMed] [Google Scholar]
- Robertson E, Bradley A, Kuehn M, Evans M. Germ-line transmission of genes introduced into cultured pluripotential cells by retroviral vector. Nature. 1986;323:445–448. doi: 10.1038/323445a0. [DOI] [PubMed] [Google Scholar]
- Schnutgen F, Hansen J, De-Zolt S, Horn C, Lutz M, Floss T, Wurst W, Noppinger PR, von Melchner H. Enhanced gene trapping in mouse embryonic stem cells. Nucleic Acids Res. 2008;36:e133. doi: 10.1093/nar/gkn603. [DOI] [PMC free article] [PubMed] [Google Scholar]
- Soudais C, Bielinska M, Heikinheimo M, MacArthur CA, Narita N, Saffitz JE, Simon MC, Leiden JM, Wilson DB. Targeted mutagenesis of the transcription factor GATA-4 gene in mouse embryonic stem cells disrupts visceral endoderm differentiation in vitro. Development. 1995;121:3877–3888. doi: 10.1242/dev.121.11.3877. [DOI] [PubMed] [Google Scholar]
- Spooner RA, Lord JM. How Ricin and Shiga Toxin Reach the Cytosol of Target Cells: Retrotranslocation from the Endoplasmic Reticulum. Curr Top Microbiol Immunol. 2011 doi: 10.1007/82_2011_154. [DOI] [PubMed] [Google Scholar]
- Takahashi K, Yamanaka S. Induction of pluripotent stem cells from mouse embryonic and adult fibroblast cultures by defined factors. Cell. 2006;126:663–676. doi: 10.1016/j.cell.2006.07.024. [DOI] [PubMed] [Google Scholar]
- Thomson JA, Solter D. The developmental fate of androgenetic, parthenogenetic, and gynogenetic cells in chimeric gastrulating mouse embryos. Genes Dev. 1988;2:1344–1351. doi: 10.1101/gad.2.10.1344. [DOI] [PubMed] [Google Scholar]
- Walker E, Chang WY, Hunkapiller J, Cagney G, Garcha K, Torchia J, Krogan NJ, Reiter JF, Stanford WL. Polycomb-like 2 associates with PRC2 and regulates transcriptional networks during mouse embryonic stem cell self-renewal and differentiation. Cell Stem Cell. 2010;6:153–166. doi: 10.1016/j.stem.2009.12.014. [DOI] [PMC free article] [PubMed] [Google Scholar]
- Walker E, Ohishi M, Davey RE, Zhang W, Cassar PA, Tanaka TS, Der SD, Morris Q, Hughes TR, Zandstra PW, et al. Prediction and testing of novel transcriptional networks regulating embryonic stem cell self-renewal and commitment. Cell Stem Cell. 2007;1:71–86. doi: 10.1016/j.stem.2007.04.002. [DOI] [PubMed] [Google Scholar]
- Wang Y, Medvid R, Melton C, Jaenisch R, Blelloch R. DGCR8 is essential for microRNA biogenesis and silencing of embryonic stem cell self-renewal. Nat Genet. 2007;39:380–385. doi: 10.1038/ng1969. [DOI] [PMC free article] [PubMed] [Google Scholar]
- Yan H, Papadopoulos N, Marra G, Perrera C, Jiricny J, Boland CR, Lynch HT, Chadwick RB, de la Chapelle A, Berg K, et al. Conversion of diploidy to haploidy. Nature. 2000;403:723–724. doi: 10.1038/35001659. [DOI] [PubMed] [Google Scholar]
- Yi M, Hong N, Hong Y. Generation of medaka fish haploid embryonic stem cells. Science. 2009;326:430–433. doi: 10.1126/science.1175151. [DOI] [PubMed] [Google Scholar]
- Zhang K, Li L, Huang C, Shen C, Tan F, Xia C, Liu P, Rossant J, Jing N. Distinct functions of BMP4 during different stages of mouse ES cell neural commitment. Development. 2010;137:2095–2105. doi: 10.1242/dev.049494. [DOI] [PubMed] [Google Scholar]
Associated Data
This section collects any data citations, data availability statements, or supplementary materials included in this article.