Abstract
Purpose: A C-arm CT system has been shown to be capable of scanning a single cadaver leg under loaded conditions by virtue of its highly flexible acquisition trajectories. In Part I of this study, using the 4D XCAT-based numerical simulation, the authors predicted that the involuntary motion in the lower body of subjects in weight-bearing positions would seriously degrade image quality and the authors suggested three motion compensation methods by which the reconstructions could be corrected to provide diagnostic image quality. Here, the authors demonstrate that a flat-panel angiography system is appropriate for scanning both legs of subjects in vivo under weight-bearing conditions and further evaluate the three motion-correction algorithms using in vivo data.
Methods: The geometry of a C-arm CT system for a horizontal scan trajectory was calibrated using the PDS-2 phantom. The authors acquired images of two healthy volunteers while lying supine on a table, standing, and squatting at several knee flexion angles. In order to identify the involuntary motion of the lower body, nine 1-mm-diameter tantalum fiducial markers were attached around the knee. The static mean marker position in 3D, a reference for motion compensation, was estimated by back-projecting detected markers in multiple projections using calibrated projection matrices and identifying the intersection points in 3D of the back-projected rays. Motion was corrected using three different methods (described in detail previously): (1) 2D projection shifting, (2) 2D deformable projection warping, and (3) 3D rigid body warping. For quantitative image quality analysis, SSIM indices for the three methods were compared using the supine data as a ground truth.
Results: A 2D Euclidean distance-based metric of subjects’ motion ranged from 0.85 mm (±0.49 mm) to 3.82 mm (±2.91 mm) (corresponding to 2.76 to 12.41 pixels) resulting in severe motion artifacts in 3D reconstructions. Shifting in 2D, 2D warping, and 3D warping improved the SSIM in the central slice by 20.22%, 16.83%, and 25.77% in the data with the largest motion among the five datasets (SCAN5); improvement in off-center slices was 18.94%, 29.14%, and 36.08%, respectively.
Conclusions: The authors showed that C-arm CT control can be implemented for nonstandard horizontal trajectories which enabled us to scan and successfully reconstruct both legs of volunteers in weight-bearing positions. As predicted using theoretical models, the proposed motion correction methods improved image quality by reducing motion artifacts in reconstructions; 3D warping performed better than the 2D methods, especially in off-center slices.
Keywords: weight-bearing knee, C-arm cone-beam CT, motion artifacts, motion compensation, fiducial marker
INTRODUCTION
Imaging the knee under loaded conditions is essential for improving our understanding of knee function during activities of daily living in healthy and diseased joints. It has long been the convention to acquire standard two-dimensional (2D) radiographs of patients in an upright, standing position in order to better diagnose diseases such as osteoarthritis.1 More recently this idea has been reinforced in studies that have shown significant differences in joint kinematics between nonweight-bearing and weight-bearing conditions.2, 3, 4 However, current three-dimensional (3D) imaging methods including magnetic resonance (MR) and computed tomography(CT), are routinely performed only in an unloaded supine or prone position. Upright, weight-bearing knee kinematics have been studied using 2D radiography in standing,5 open-configuration MR imaging,3, 6, 7 and single- and dual-plane fluoroscopy.8, 9, 10, 11, 12 The 2D radiographic projection is common as it provides useful 2D diagnostic findings at relatively low cost. However, it yields only limited information about the complex 3D knee structure. Studies using an open-bore real-time MR system showed that patellofemoral kinematics under weight-bearing conditions are different than those under unloaded conditions using 2D kinematic parameters.3, 6 However, the open-bore MR system still had a limited range of weight-bearing postures and a subject was unable to stand vertically supporting 100% of his/her body weight. In addition, compared to CT systems, clinical MRI scanners have a limited ability to image bone tissue, and typically have lower spatial resolution. Single and biplane fluoroscopy techniques showed 3D dynamic changes in knee kinematics;8, 9, 10, 11, 12 however, there was no soft tissue visibility. Moreover, the systems require a static 3D CT or MR scanning model combined with 2D-3D registration procedures in order to track individual bones’ movement, which adds computational complexity. Liu et al.12 measured surrogate cartilage deformation using an unloaded cartilage MR scanning model which may cause inaccurate morphological estimation of cartilage deformation.13
A C-arm-based cone-beam CT (CBCT) scanner with a digital flat panel detector represents a promising imaging system for evaluation of static 3D joint position and orientation and cartilage-bone stress in vivo under weight-bearing conditions. The C-arm system provides high-resolution 3D volume images (i.e., a stack of slices) with superior bone contrast, and highly flexible trajectories for the image acquisition. Moreover, compared with MR imaging systems, the C-arm system requires short image acquisition times as the angular speed of current C-arms is up to 100° per second through the required π + fan rotation angle. Thus, relatively small motion artifacts associated with patients’ involuntary movement during scanning are expected. The system has the ability to rotate in a plane parallel to the floor, providing access to a full range of weight-bearing postures. Recently, dedicated CBCT systems for musculoskeletal extremities have been developed and are capable of imaging the lower extremities under weight-bearing conditions.14, 15
In the numerical model-based optimization16 (hereafter referred to as “Part I”) of this study, the complicated involuntary lower body movement of patients in standing positions was simulated using the XCAT knee model. From the numerical simulation results in Part I, it was seen that a subjects’ involuntary lower body motion generates considerable motion artifacts in volume images in vivo. Thus, an important remaining task is to deal with motion artifacts under in vivo experimental conditions. Three motion compensation methods (2D projection shifting, 2D projection warping, and 3D image warping) were proposed that effectively compensated for the motion of the lower body in standing positions on simulated data. Earlier published work on CT motion compensation have been reviewed and summarized in Part I. In this report (Part II), we demonstrate that a C-arm CT scanner with a digital flat panel detector is capable of scanning both legs of a human subject in vivo in standing positions with different knee flexion angles. Moreover, we confirmed that the algorithm is also suitable for the reconstruction of real test subjects’ data. The proposed motion compensation methods will be applicable to any high-resolution weight-bearing CBCT imaging system.14, 15
METHODS AND MATERIALS
Data acquisition using a C-arm CT scanner
Calibration of projection matrices
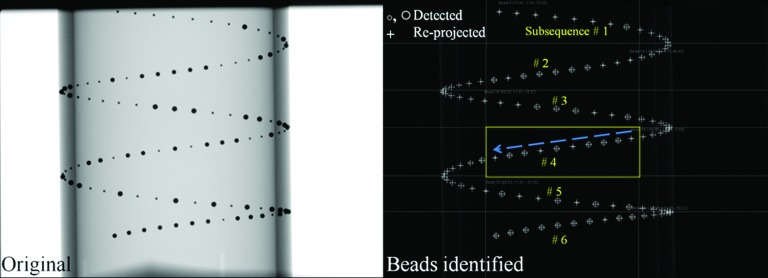
Prior to scanning a patient, calibration of all projection matrices for the horizontal scan trajectories (i.e., the C-arm rotates about the axis perpendicular to the floor) on a C-arm CT system is performed using the PDS-2 calibration phantom with a hollow cylindrical shape.17 The geometry of the jth projection of a C-arm CT system can be expressed using a single projection matrix (Pj) with 3 × 4 elements describing how a certain voxel (x,y,z) in 3D is mapped onto a projection image (u,v) in 2D in homogeneous coordinates. In the outer wall of the PDS-2 phantom, 108 metallic spherical beads with small and large radii are embedded along a helical trajectory. The alternating order of the large (1) and small (0) beads functions as binary representation of 8-bit-wide numbers. Thus, any sub-sequence of 8 consecutive beads identified in a projection image allows us to identify the corresponding 8 beads out of 108 beads in 3D. By connecting the known 3D coordinates of beads to the identified corresponding 2D coordinates, Pj can be computed.18, 19, 20
Figure 1 shows identified beads of the PDS-2 phantom in a projection. The PDS-2 phantom was positioned so that the helix of beads in a projection image does not self-overlap. Each Pj was estimated using the following steps: (i) After taking the numerical derivative of the original projection image in the u and v directions to detect drastic changes in intensity values such as at a bead edge, we took the absolute values of the intensities. (ii) The outer wall of the PDS-2 phantom and the beads were detected using a Hough circle and line detection algorithm.21 (iii) The beads were grouped into six different subsequences. The fourth subsequence in the box (Fig. 1, right) is shown as an example. By decoding the 8-bit alternating order of the small and large beads along the arrow, the beads were matched to their 3D counterparts with known coordinates in 3D, which allowed us to estimate Pj for the jth projection image. (iv) The beads in 3D were reprojected (drawn as “+” in Fig. 1) in order to evaluate the accuracy of the acquired Pj.
Figure 1.
The original projection of the PDS-2 phantom is shown on the left. In order to identify subsequences of beads, small and large beads (○,◯) were detected. After computing Pj, the beads’ 3D positions were re-projected (+) using the Pj to evaluate the calibration accuracy in the jth projection.
Imaging of two healthy volunteers in weight-bearing positions
Under an IRB-approved protocol, two healthy volunteers were scanned while lying supine, upright and bearing their weight at several different knee flexion angles using a C-arm CT scanner with a digital flat panel detector (Axiom Artis dTA, Siemens AG, Forchheim, Germany). The acquisition protocol used a tube voltage of 70 kVp, detector dose request setting of 1.2 μGy/projection, resulting in 248 views acquired during rotation of the C-arm through π + fan angle in 10 s. The kV and mAs were automatically chosen by an automatic exposure control (AEC) mechanism,22 based on the object in the field of view and the acquisition protocol. Each projection used a matrix of 960 × 1240 with a pixel size of 0.308 mm × 0.308 mm after 2 × 2 binning. Five different datasets (SCANs 1 to 5) from two subjects (see Table 1) were used to validate the results of the XCAT phantom simulation described previously. SCANs 1 and 2 were acquired by scanning the first subject at knee flexion angles of 0°(full extension) and 60° (squatting), respectively. SCANs 3, 4, and 5 were from the second subject at knee flexion angles of 0°, 35°, and 65°, respectively.
Table 1.
Image quality comparison of five dataset with different motion correction methods in terms of SSIM index. We took an average of SSIMs of three consecutive adjacent slices around the bottom of femur for the “Central” slice SSIM index and the femoral midshaft for the “Off-center” slice SSIM index. The best values are reported in bold face.
| SSIM |
|||||
|---|---|---|---|---|---|
| Axial slice | No correction | 2D shifting | 2D warping | 3D warping | |
| SCAN 1: Subject 1 standing straight-motion: 4.26 pixel (1.31 mm) | Central | 0.1879 | 0.4290 | 0.4292 | 0.4028 |
| Off-center | 0.2672 | 0.5533 | 0.5477 | 0.5260 | |
| SCAN 2: Subject 1 squatting at 60° flexion-motion: 6.13 pixel (1.89 mm) | Central | 0.1256 | 0.3328 | 0.3226 | 0.3025 |
| Off-center | 0.2198 | 0.4166 | 0.4078 | 0.4184 | |
| SCAN 3: Subject 2 standing straight-motion: 2.77 pixel (0.85 mm) | Central | 0.1905 | 0.3859 | 0.4318 | 0.3915 |
| Off-center | 0.3182 | 0.4357 | 0.4157 | 0.4129 | |
| SCAN 4: Subject 2 squatting at 35° flexion-motion: 10.50 pixel (3.23 mm) | Central | 0.1217 | 0.2801 | 0.2787 | 0.2921 |
| Off-center | 0.1038 | 0.2897 | 0.1692 | 0.4523 | |
| SCAN 5: Subject 2 squatting at 65° flexion-motion: 12.41 pixel (3.82 mm) | Central | 0.0797 | 0.2819 | 0.2480 | 0.3374 |
| Off-center | 0.1061 | 0.2955 | 0.3975 | 0.4669 | |
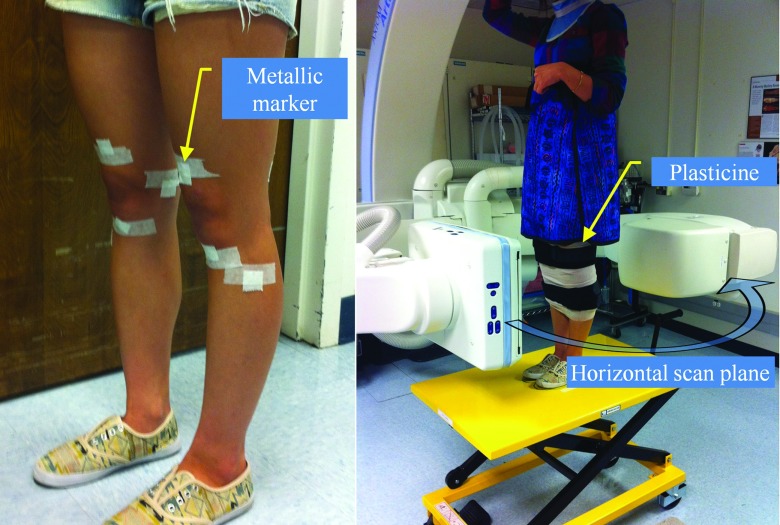
As shown in Fig. 2, each volunteer was scanned with a total of nine tantalum spherical markers (1 mm diameter) evenly placed around both knees (four markers around one knee, five around the other) in order to track the involuntary motion of the lower body. This marker placement is close to the “EVEN” configuration we utilized in Part I; that configuration was shown to be robust regardless of the motion correction method used. When the C-arm system acquires images in lateral projections, very thick objects with high density (two femora) pass through the center of the FOV, and the AEC system responds by increasing the exposure. Given the limited dynamic range of the detector, this produces saturation at the peripheral boundary of the subject. Although saturation-correction software is available on the system, we found that application of modeling clay (Plastalina, Van Aken International, Rancho Cucamonga, CA) wrapped around both legs was necessary to prevent saturation at the posterior and anterior surfaces of the knees. This solution is not ideal, and other correction methods are under investigation to either reduce the dynamic range of the signal at the detector, or suitably constrain the reconstruction in order to reduce artifact and eliminate the need for modeling clay.
Figure 2.
Each volunteer was scanned while standing in a C-Arm CT. The C-Arm rotates in a horizontal plane. Nine tantalum metallic markers were suitably attached around the knee. Both legs were wrapped with modeling clay to prevent saturation artifacts.
Dose estimation
We carried out dose simulations using a commercial Monte Carlo simulation package, PCXMC2.0.23 We scanned two cylindrical phantoms simulating two legs of a subject. The values of tube voltage and current for each projection resulting from AEC were acquired and used as inputs to PCXMC. Prior to conducting the dose estimation, the half-value layer (HVL) of the x-ray spectrum in PCXMC was set to match the measured HVL (2.9 mm Al)24 at a tube voltage of 70 kVp. The effective dose based on ICRP 103 weighting coefficients is 0.06 mSv for a single C-arm CT scan with the exam sets of the weight-bearing scanning including geometric system set-ups described in Sec. 2A2. This dose is comparable to that from three chest x-ray acquisitions. The effective dose associated with this acquisition protocol is minimal compared to 2.95 mSv, the average annual total effective dose from background radiation of a resident of the United States.25
Motion compensated reconstruction
Estimation of the static mean marker coordinates in 3D
Since we do not know the true 3D position of each marker which will serve as a reference to correct temporal motion, the reference 3D position needs to be estimated prior to the motion correction process. If a cone beam CT system rotates about one axis with a perfect circular trajectory, the static mean marker location in 3D can be described as a function of the gantry angle, source to detector distance, source to patient distance, and the marker position in a projection. Thus, the 3D mean position of a marker can be estimated by back-projecting the marker from multiple 2D projection images onto a 3D space.26 Since a C-arm CT system has nonideal trajectories due to mechanical instabilities, the geometry of the system is not a simple function of gantry angle only. The 3D mean position () estimation of a marker in a C-arm CT system with imperfect trajectories can be performed more accurately using the acquired projection matrices Pj and identified markers in several projection images as described below. (We will describe how the coordinates of a marker (uj, vj) in the jth projection image were identified in Sec. 2B2.). Equation 1 shows a 3 × 4 projection matrix (Pj) for the jth projection mapping a certain voxel () in 3D onto the jth projection image (uj, vj) in 2D in homogeneous coordinates,
| (1) |
where ξj is a homogeneous term and in the jth projection image and the subscript m is a matrix row number. Eliminating ξj produces
| (2) |
A second rearrangement provides Eq. 3 below:
| (3) |
The remaining unknowns are (), and with j = 248 projections we therefore have sufficient information to estimate the unknowns using
| (4) |
In this way, the 3D mean position of nine different markers was individually estimated.
Semiautomatic marker detection in a 2D projection image
Due to the high number of projection images and markers, manual detection of the markers is impractical in our application. The coordinates of the nine markers in projection j, (uj, vj) were identified using the following steps: (i) The marker position in 3 to 5 different, well-distributed projections was manually detected as shown in Fig. 3. Using the 3 to 5 different projection coordinates (uj, vj) and Eq. 3, a rough initial estimate of the 3D mean position of the marker, (), was acquired. (ii) After taking the numerical derivative of the original projection image in the u and v directions, the absolute values of the intensities were taken. (iii) The mean estimate () was forward-projected onto a projection j, (), shown as an open circle in Fig. 3 [Step (iii)]. Point clouds located within the distance of 10 pixels were selected as candidates for (uj, vj). In the case where a patient's involuntary motion is severe, (uj, vj) could show large deviation from () so a larger value of the radial search distance was needed. A Hough circle detection algorithm was applied over the candidates and the (uj, vj), shown as a solid circle in Fig. 3 [Step (iii)] was identified. (iv) Using the (uj, vj) from every projection and Eq. 3, the previously acquired () was refined. With the re-estimated (), Step (iii) was conducted again to determine amore accurate and final (uj, vj).
Figure 3.

Markers were semiautomatically detected in 2D projection images. Based on a manually identified marker position in 3 to 5 projection images and Eq. 3, an initial estimate of () was acquired in Step (i). The initial () was forward-projected onto a projection image using a projection matrix. A radial search around the forward-projected point () shown as an open circle was conducted to locate (uj, vj) shown as a solid circle. Step (iv) updated () using the identified (uj, vj) from every projection and Eq. 3. The updated () provides a reference for the following motion correction methods.
Motion correction methods
The same three methods used in the XCAT model simulation were used to correct the involuntary motion-induced artifacts. A detailed description of the three motion compensation algorithms is provided in Part I. The estimated 3D mean position of a marker i, , was used as a reference and the forward-projected point of the reference in a projection image j functioned as a 2D reference, .
For patients’ motion estimation, each marker's average of its 2D Euclidean distance from its 2D reference in 248 projections followed by an average of the deviation over all N markers was calculated as follows:
| (5) |
where the ith marker's 2D coordinates in the jth projection is denoted as and ‖·‖ is the Euclidean distance.
Each compensation method searches for the optimal transformation that will minimize the distance between 2D references and identified markers. However, even after the transformation for the three methods, deviations of transformed 2D references from identified markers are still present, mostly because of marker detection errors and deformable motion that violates the rigid-body assumption for 2D shifting and 3D warping. In order to estimate the impact of the two contributing factors on the performance of our methods, the residual error in the jth projection was defined as the 2D Euclidean distance between a transformed 2D reference and an identified marker , as below:
| (6) |
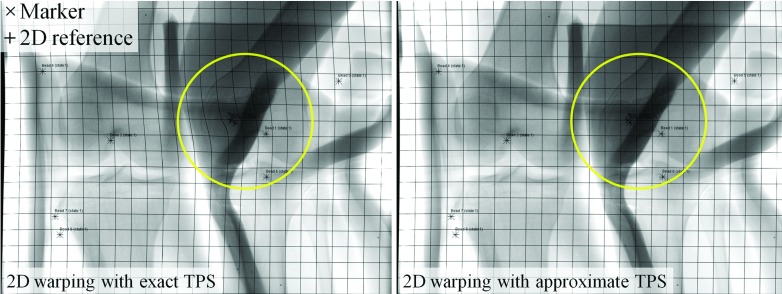
As shown in Fig. 4 (left), the deformable projection warping in the 2D method produced unrealistic bending. This arises from the very principle of the method, which is to correct a 3D motion by a 2D-only warping. The unrealistic warping can be reduced using the approximate TPS mapping with a regularization parameter λ.27 The exact spline interpolation requirements over the control points were relaxed using a heuristically chosen λ with a result as shown in Fig. 4 (right). The scaling strategy decreased the 2-norm condition number of the matrix, in Eq. (10) in Part I by approximately 13 orders of magnitude.
Figure 4.
A projection was warped in 2D using TPS mappings. The markers (×) were mapped smoothly onto the 2D references (+). The left and right show the warped projection with exact TPS fitting (λ = 0) and with approximate TPS fitting (λ > 0). The grid lines were inserted to improve visualization of the overall warping of the projection.
Reconstruction
Reconstructions of the projection images were performed using the same reconstruction pipeline and in-house framework (CONRAD) (Ref. 28) used for the XCAT knee model with the addition of three steps: Automatic Exposure Control (AEC) compensation,22 low contrast water correction,29 and water-equivalent-thickness scatter correction with Gaussian kernel.30 For the reconstruction of the XCAT knee model, the three additional steps were not necessary since we directly simulated line integral data. The images were processed using the three corrections prior to application of the previous reconstruction pipeline. The reconstruction process resulted in 5123 voxels with an isotropic spacing of 0.5 mm and 32-bit depth using floating point values.
Image quality comparison and investigations
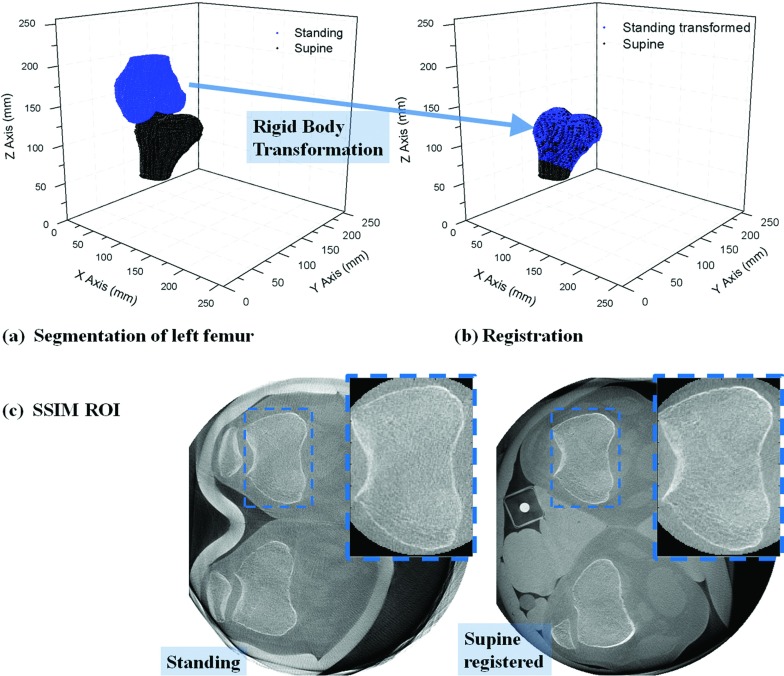
As the ground truth is typically unavailable for in vivo motion-corrected experimental data, image quality comparison between the experimental data is not a straightforward process. Here we used the Structural SIMilarity (SSIM) index31 for quantitative image quality comparison. Assuming no motion of patients while scanning in the supine position, we used the supine data as a ground truth reference for the standing data after motion correction with different methods. Since we were unable to compute the SSIM index on the full volumes because of the nonrigid deformation at different knee flexion angles between the supine and standing data, computation took place only on a rigid portion of the volume (the femur area). In order to minimize patient motion for the ground truth supine data, both legs were strapped to the table. Point clouds of the left femur in standing and supine reconstructions were automatically segmented using localized region-based active contours by Lankton et al.32 which take local information into account as opposed to global image statistics. Since the background of the femur in a slice is very heterogeneous, a spline-interpolated mask or initial guess was roughly set around the boundaries of the femur for faster and more accurate segmentation. The left femur in the motion-compensated standing reconstruction was registered to the left femur in the supine reconstruction using a rigid body transformation as shown in Figs. 5a, 5b. The two volumes were reconstructed in a referential system fixed to the C-arm coordinate frame (i.e., the patient). The upper body was positioned above and below the scanning plane during standing and supine scans, respectively, so a rotation of approximately 180° was required during registration of the two volumes. The rotational and translational transformation matrices (R, T) were computed by using an iterative closest point algorithm (ICP) on 3D point clouds of a model (supine) and data to fit (standing).33 A k-dimensional tree search was used to match corresponding point sand then point-to-point minimization was conducted. The ICP registration error is defined as the mean of the RMS errors of transformed points to the closest point in the model. The registration errors were on the sub-voxel scale of 0.19 mm (±0.02 mm) for the five different datasets from the two subjects. After registering the other standing reconstructions with different motion correction methods with the supine reconstruction using the acquired R and T, the SSIM index was calculated. Assuming the femur is rigid, the region of interest (ROI) of the SSIM calculation was set around the boundary of the femur including its surrounding soft tissue as shown in Fig. 5c. Due to different knee flexion angles, the patella is visible near the ROI in the left (Standing), but not in the right (Supine registered) images.
Figure 5.
(a) The point clouds of the left femur in standing (Subject 2 squatting at 35° flexion) and supine reconstructions were automatically segmented. The left femur in standing reconstruction was registered to that in supine reconstruction by the rigid body transformation as shown in (b). (c) shows the ROI for SSIM calculation.
We do not know how high an SSIM index could be achieved when registering 20-s supine data (248 views) to 10-s standing data. In other words, the registration process as well as the reduced imaging time might affect the SSIM index even if there is no motion at all. Thus, we scanned a human cadaver tibia immersed in a cylindrical plastic container filled with tissue fixation liquid. The tibia underwent the same registration process as the femur in vivo and its SSIM indices were calculated. The acquired SSIM indices can be considered as the best SSIM achievable with perfect motion correction, which in turn assists with interpretation of the significance of, e.g., a 1% increase in the SSIM index by the motion correction methods. Moreover, in order to estimate only the effect of the number of projections and the detector dose request isolated from the effect of the above-mentioned registration process, the SSIM indices were calculated for reconstructions of the cadaver tibia in the supine position from (i) 248 views, 1.2 μGy/projection, (ii) 248 views, 0.54 μGy/projection, and (iii) 248 views, 0.36 μGy/projection, relative to the same tibia in supine with 494 views and 1.2 μGy/projection.
The impact of an inaccurate estimate of marker location on image quality was also investigated. Before conducting the systematic detection error analysis, the following conditions were taken into account: (i) The marker detection algorithm fails in consecutive projections due to unfavorable conditions of a marker's neighboring pixels such as adjacent high density materials (e.g., bone edges), photon starvation, and detection saturation. (ii) Since the relative position of the neighboring pixels having the unfavorable conditions exists in consecutive projections, it is more reasonable to apply detection error in the same direction with the same amount rather than to impose random error. (iii) If the amount of misplacement is larger than a certain threshold, it is better to exclude the marker from a particular projection rather than to use the badly estimated marker. (iv) The threshold would depend on the amount of each patient's involuntary motion. Based on the considerations above, misplacement errors were imposed on one of the nine markers in SCAN 5 (Subject 2 squatting at 65° flexion) with the largest motion of the five datasets. The magnitudes of the error applied to the marker were 6, 12, and 24 pixels toward its 2D reference () from its true location (uj, vj) in a projection image. For reference, 12 pixels amount to the estimated patient motion in SCAN 5 using Eg. (5). The marker was present in the 354th slice of the reconstructed volume which had 512 axial slices in total. The ROI for the SSIM index calculation was set around the boundary of the femur in a different adjacent axial slice to avoid the direct impact of the metallic marker's streak artifact on image quality.
Finally, an entropy histogram (see Appendix A) is also calculated and will be used to evaluate its validity as an image quality metric in the presence of motion artifacts.
RESULTS
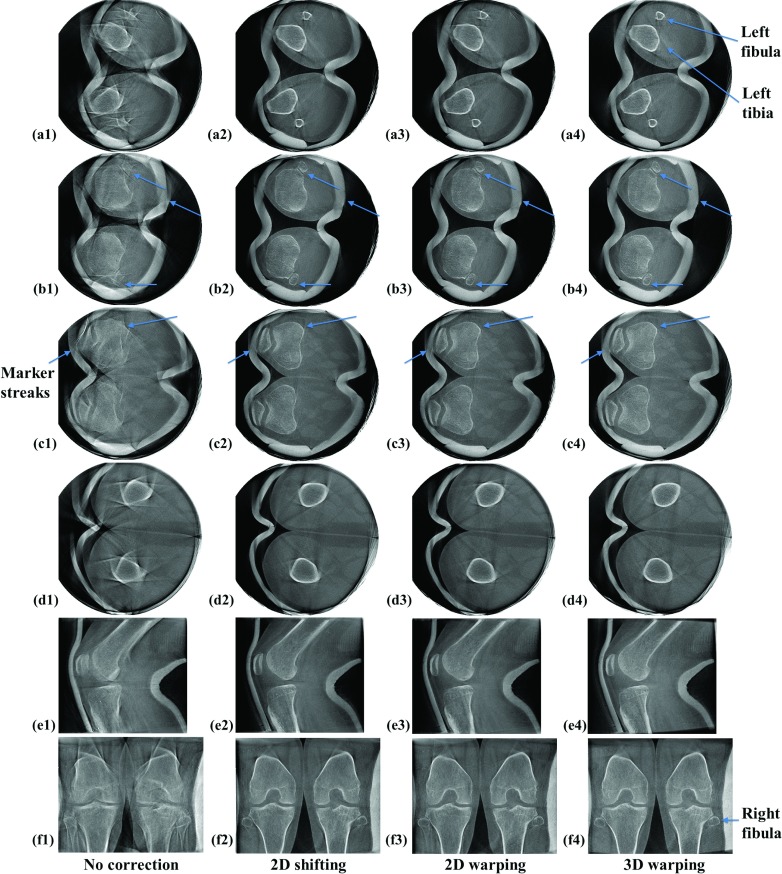
Five dataset from two subjects were reconstructed and each dataset showed a different amount of motion. Patients’ involuntary motion was estimated using the 2D Euclidean distance-based metric of Eq. 5. As shown in Table 1, the degree of motion ranges from 2.77 pixels (0.85 mm) to 12.41 pixels (3.82 mm). Figure 6 shows representative slices of SCAN 5 (Subject 2 squatting at 65° flexion) with the largest motion of the five datasets. For the left fibula in row (a), showing the lower off-center slice, the reconstruction with 3D warping works best and 2D shifting works second best in terms of qualitative sharpness of the recovered bone edge. For the right fibula in row (a), 3D warping works best and 2D warping works second best, which is more obvious in the Postero-Anterior (PA) view in row (f). In Fig. 6(f2), the right fibula and its adjacent edge of the tibia were still blurred, as compared to (f3) and (f4). In the upper off-center slice shown in row (d), 3D warping clearly performs the best and 2D shifting works second best, based on the recovery of the femur edge. In the central slices shown in rows (b) and (c), it is not easy to make a qualitative comparison between the correction methods, as compared to off-center slices in rows (a) and (d) where differences in image quality are more obvious. In row (b), 3D warping works best and 2D warping works second best when focused on the areas indicated by arrows. In row (c), (c2) and (c3) show remnants of motion-induced, metallic marker streaks as indicated by the left arrow that disappear in (c4). Focusing on the areas where the arrows point in row (c), (c4) demonstrates the clearest edge.
Figure 6.
Reconstructed slices of subject 2 from the scan with the largest motion of the five datasets (SCAN 5). The first four rows (a) to (d) show representative off-center or approximately central axial slices. The axial slice numbers of (a) to (d) are 145, 200, 305, and 407 out of 512 slices, respectively. The fifth row (e1 to e4) shows sagittal slices and the sixth row (f1 to f4) shows coronal slices. The slices were reconstructed with and without the motion correction methods, and are aligned by column as indicated.
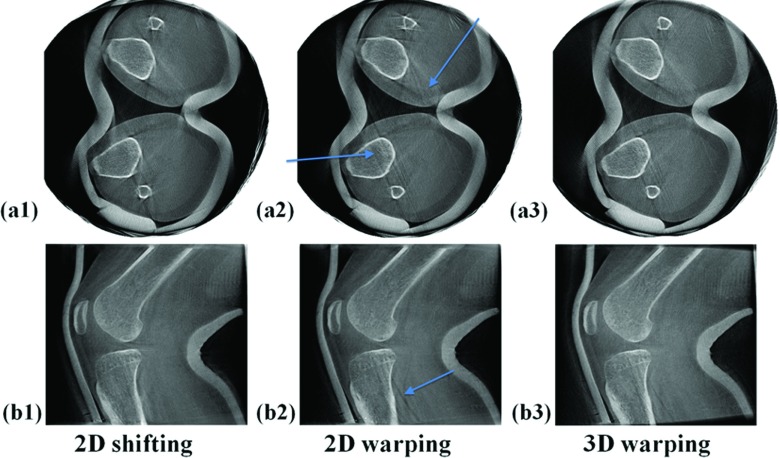
Figure 7 shows degradation of image quality due to marker detection errors. Reconstructed slices in Fig. 7 are identical to those in Fig. 6 except for marker detection errors of one marker in two consecutive projections with 12 and 22 pixel deviations, respectively. These errors occurred during the semiautomatic marker detection. Although Fig. 7(a2) shows clearer edges of the right tibia and fibula, 2D warping introduced an unwanted double slanted line artifact which is not shown in (a1). In (a3), the same streak artifacts are present, although they are less severe than those in (a2). As few as two marker detection errors caused image quality degradation on the marker's neighboring 3D areas as shown in (b2).
Figure 7.
Degradation of image quality due to bead detection errors. Reconstructed slices of subject 2 with the largest motion (SCAN 5) of the five datasets. These slices are identical to those in Fig. 6 except that a bead detection error of one marker in two projections was applied.
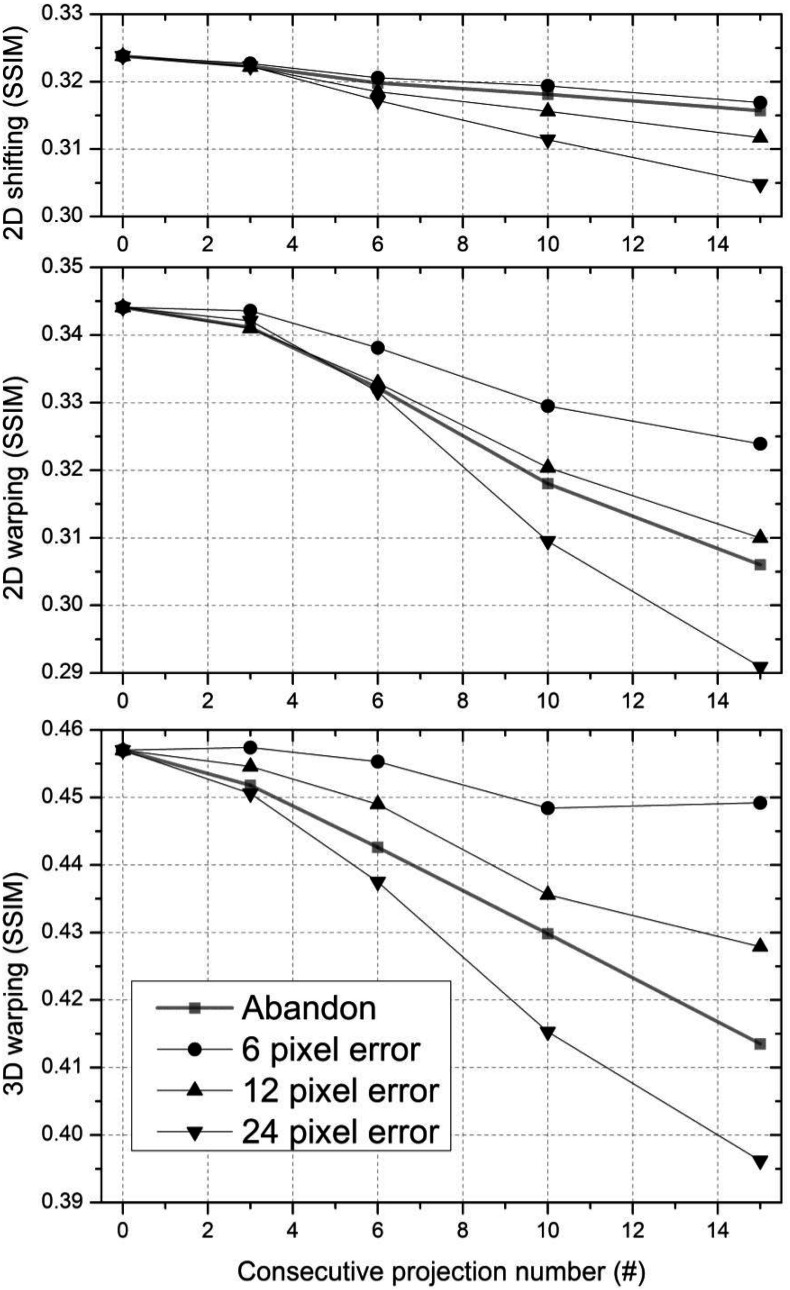
Figure 8 shows the impact of misplaced marker detection in up to 15 consecutive projections on the SSIM index. As the number of consecutive projections with erroneous detection increases, the SSIM index decreases and the SSIM index with 2D shifting drops relatively less compared to that with the other two methods. “Abandon” in the figure key means that the marker estimate was discarded in consecutive projections and the correction methods were performed using only the remaining markers, which allowed us to compare the impact of including and excluding bad estimates on image quality. In the 2D shifting plot, data points with excluded marker labeled “Abandon” align close to and below the 6 pixel error data points. “Abandon” data points lie below and close to the 12 pixel error data points in the 2D warping plot and they lie between the 12 pixel error data points and 24 pixel error data points in the 3D warping plot. Two dimensional warping shows a greater decrease in the SSIM index with 6 pixels and 12 pixels of marker deviation on consecutive projections compared to the other methods.
Figure 8.
Image quality (the SSIM index) with three correction methods varies as a function of the number of consecutive projections having a displaced marker with 6 pixel, 12 pixel, and 24 pixel error. After excluding the marker from projections, the SSIM index was also calculated as indicated by square data points (“Abandon” in figure key).
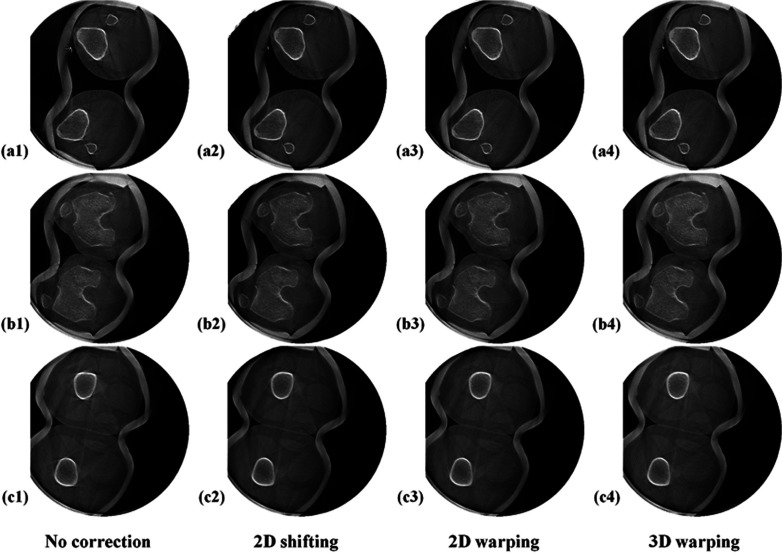
Figure 9 shows the reconstructions of subject 2 standing with knees at full extension with the least motion of the five datasets. Even before motion correction in the first column, some slices show comparable image quality to the motion-corrected slices in Fig. 6 and suffer from much less severe motion artifacts, compared to those in the first column in Fig. 6. All of the three methods effectively reduced motion-caused streaks and recovered sharp edges of the bone structure. For this case, all three methods produced the same level of image quality improvement which made it difficult to qualitatively determine which method was best.
Figure 9.
Reconstructed slices of subject 2 with the least motion (SCAN 3) of 5 datasets. Rows (a) to (c) show representative lower off-center, central, and upper off-center axial slices, respectively. The axial slice number of (a) to (c) are 107, 239, and 361 of 512. The slices were reconstructed with and without the motion correction methods aligned in a different column.
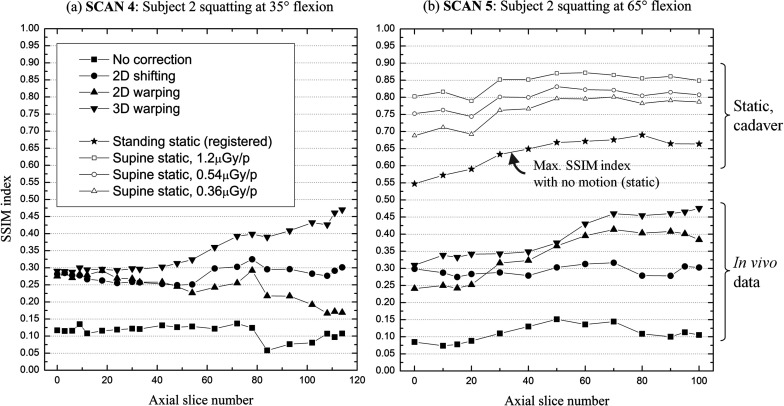
As described in Sec. 2C, the SSIM index was calculated for quantitative image quality comparison. The SSIM indices of the five in vivo datasets are tabulated in Table 1. We used an average of SSIM indices of three consecutive slices around the bottom of the femur as the “Central” SSIM index. For the “Off-center” SSIM index, we took an average of SSIM indices of the three adjacent slices around the femoral midshaft. SCANs 4 and 5 show 2 times larger motion than SCANs 1 to 3. Therefore, SCANs 4 and 5 have more severe motion artifacts, resulting in lower SSIM indices of the reconstructed slices before motion correction, compared to SCANs 1 to 3. For the central and off-center slices of SCANs 4 and 5, 3D warping performed better than the 2D methods overall. 3D warping performance stood out particularly in the off-center slices in comparison to the central slice, as evidenced by larger differences in SSIM indices between 3D warping and the 2D methods in the off-center slices. In general, 2D shifting and 2D warping showed comparable performance, although 2D warping sometimes works very poorly as shown in the off-center slice of SCAN 4. In the axial slices of SCANs 1 to 3 with relatively small motion, the three different methods showed similar image quality improvement that led to relatively small increase in SSIM, compared to SCANs 4 and 5.
Figure 10 shows measured SSIM indices of SCANs 4 and 5 as a function of slice number. The lowest slice number (0) on the X-axis corresponds to the bottom of the femur close to the mid-plane out of 512 slices. Three-dimensional warping tends to work better compared with 2D methods as the slice number increases.
Figure 10.
A comparison of image quality improvement between axial slice images before and after applying the three different motion correction methods. (a) and (b) show SSIM indices as a function of the axial slice number for the two data sets that demonstrate the largest motion. The axial slice with the lowest slice number (0) on the X-axis is around the bottom of the femur and close to the central slice out of 512 slices. The highest slice number corresponds to the slice around the upper boundary of the reconstructed volume. The plot with a solid star-shaped symbol in (b) shows image quality of the static cadaver tibia after applying the same segmentation and registration as was done for in vivo data. (b) also shows the sensitivity of the SSIM to detector dose requests (1.2 μGy, 0.54 μGy, and 0.36 μGy per projection).
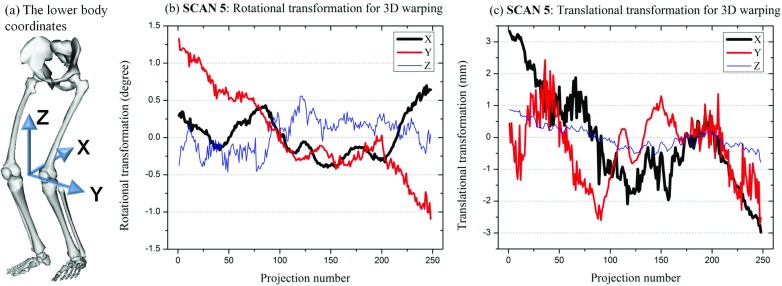
3D warping identified the optimal rotational matrix R and translational matrix T for SCANs 1–5. Figure 11 shows representative R and T matrices acquired for SCAN 5 as a function of the projection number. Matrix R defined rotation about three-axes following the Y-X-Z convention of Euler angles. The rotation about X-and Z-axes fluctuated roughly between −0.5 and 0.7. Compared with the rest axes, the Y-axis rotation showed a larger variation, ranging between −1.1° and 1.3°. Translation along the X-axis had the largest fluctuation, between −3.0 and 3.3 mm, and the Z-axis translation was considered minor compared with that of the X- and Y-axes.
Figure 11.
The 3D transformation matrices acquired from 3D warping for SCAN 5. (a) shows the 3D coordinates of the lower body centered between the two knee joint. Figure (a) was generated using OpenSim available on Simtk.org. (b) shows the Euler angles about X-, Y-, and Z-axes for rotational transformation and (c) shows the translational transformation along X-, Y-, and Z-axes during 3D warping.
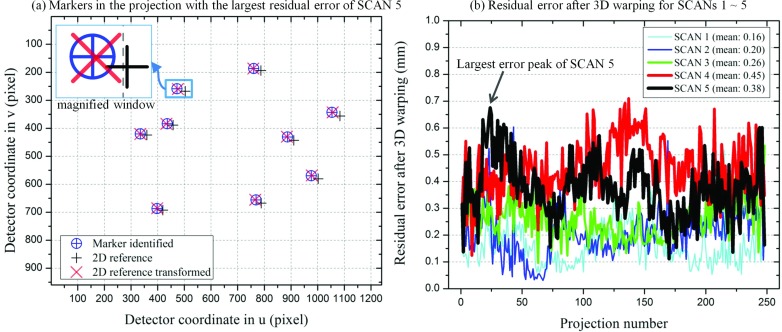
Figure 12 shows residual errors after transforming the 2D references to identified markers for 3D warping. The residual errors were computed using the 2D Euclidean distance-based metric of Eq. 6. As seen in the magnified window in Fig. 12a, the positions of the identified marker and the transformed 2D reference were not identical. Moreover, the relative position of an identified maker to its corresponding transformed 2D reference in Fig. 12a varied between the nine markers. The residual errors ranged from 0.16 mm (0.52 pixel) to 0.45 mm (1.46 pixel). The residual errors for SCANS of the same subject (e.g., SCANs 3–5 of Subject 2) tended to increase as the patient motion became vigorous.
Figure 12.
Residual errors after transformation for 3D warping for SCANs 1–5. (a) shows the locations of identified markers, 2D references, and transformed 2D references in the projection with the largest residual error of SCAN 5. (b) shows residual errors as a function of a projection number of SCANs 1–5. The arrow indicates the projection with the largest residual error of SCAN 5, which was used as a representative projection in (a).
DISCUSSION
The new horizontal C-arm trajectory for weight-bearing scanning showed a significant “wobble” similar to that seen for a standard vertical trajectory.34 However, both trajectories showed comparable reproducibility over multiple scans acquired within one day and across one week.34 As long as the trajectory is reproducible, we can geometrically calibrate the system using the projection matrix approach. The amount of wobble of the C-arm gantry should not impact the performance of the proposed subject-motion correction methods since the projection matrices are properly incorporated into the governing equations, Eqs. 1 to 4.
In order to confirm the validity of the theoretically evaluated three motion correction methods, the methods were tested on five different in vivo human subject datasets. The experimental data show the methods efficiently corrected the patient-motion artifacts in a similar way as in the XCAT knee model simulation in Part I. In general, 3D warping was shown to be superior to the 2D methods for the data with comparatively large involuntary motion such as Subject 2 in the XCAT knee model, and experimental SCANs 4 and 5. Figure 10 also confirms that 3D warping outperforms the 2D methods particularly in the off-center slices. This difference in performance may be due to the fact that the 2D methods do not take into account rotational movements of the lower and upper leg. Figure 11 shows that the Euler angles for rotational transformation about the X-, Y-, and Z-axes are not negligible, and the rotational movement about the Y-axis (the lateral direction) has the largest variation among three axes. Compared with 3D warping, the 2D methods are relatively limited in their ability to map a 2D reference to an identified marker since they have to find an optimal transformation using only translation in the detector coordinates (u, v) without incorporating the rotational transformation. The rotational movement about three axes results in increased levels of motion as the slice number increases in the off-center direction (i.e., away from the knee joint). The 2D methods can be further improved by implementing rotational movements after registering 2D references to identified markers in each projection image. The SSIM index for 3D warping increases as the slice number increases in the direction away from the central slices. However, we cannot claim that 3D warping works better in the off-center slices than in the central slices since the SSIM index is computed over different ROIs for different axial slices.
We observed a bit brighter background corresponding to air surrounding the legs in the slices with 3D warping in Figs. 567, compared to that in the slices with the 2D methods. The filtered back-projection algorithm assumes that a series of projections corresponds to a static subject. However, 3D warping rotates and translates an object in 3D space for every projection which distorts distance-related weightings and thus results in low-frequency background noise. This might explain why the 2D methods sometimes work better than 3D warping for the data with relatively small motion. A further extension of current 3D warping is to derive a theoretical algorithm incorporating the weighting distortion. Alternatively, we could take one or more iterative forward- and backward-projection steps in order to subtract low-frequency background noise.35
Given the amount of errors in marker location, the three methods exhibited different levels of image quality degradation as illustrated in Figs. 78. Figure 7 shows that as few as one misplaced marker on two consecutive projections can cause obvious image quality degradation. Two-dimensional warping is disadvantageous in that it is very sensitive to marker detection errors, compared to 2D shifting and 3D warping as shown qualitatively in Fig. 7 and quantitatively in displaced markers with 6 pixel and 12 pixel error in Fig. 8. 2D warping in (a2) and (b2) introduced more severe two-layered slant line artifacts than others. As expected, 2D shifting was most insensitive to marker detection errors. It is likely that one of the markers was detected in a certain projection; however, not detected in the next projection. Then, the two consecutive projections with 2D warping applied could have a projected object with a very different shape around the marker. Another global constraint could relieve this issue by enforcing a marker's location to lie within a certain region of interest based on its locations in several preceding and following projections. Thus, sudden changes of the body shape between neighboring projections might be suppressed. Two-dimensional shifting and 3D warping methods globally compensate motion-induced artifacts while 2D warping does so locally. Two-dimensional warping responds to a single marker tracking error by locally warping with an erroneous point load while the other two approaches react to the error by repositioning the global rigid model and therefore the influence that a single marker tracking error exerts over the global model is relatively low. We confirmed that the performance of 2D warping increases proportionally to the marker number used up to 15. As the number of markers increases, it is more likely that two markers with different point loads placed close to each other in a projection image will be seen. Thus, a higher value of the regularization parameter λ might work better as the number of markers is increased. Alternatively, we may use different values of regularization parameter λ for each projection based on the proximity of markers with different point loads as long as they do not cause sudden discontinuities over consecutive projections. In comparison with data points with pixel errors in Fig. 8, the “Abandon” data indicate that it is better to discard bad estimates rather than to keep them for a dataset with 12.41 pixels of patient motion (SCAN 5) if detection error is larger than approximately 6 pixels, 12 pixels, and 12 pixels for 2D shifting, 2D warping, and 3D warping, respectively. We could identify if the marker detection algorithm fails at a certain marker on a single projection by comparing model shifting or warping solutions for each method with and without the marker. A RANdom SAmple Consensus algorithm (RANSAC)36 could be useful to identify suspicious outlying markers by fitting detected markers to 2D references along all projections.
Because by their nature our 2D shifting and 3D warping assume a rigid body model, there are limitations in their abilities when correcting deformable motion. Thus, the two methods might not work when the lower body has significant deformable motion because of knee flexion. To test for this effect we estimated the amount of deformable motion in the lower body. The computed residual errors shown in Fig. 12 can be used to estimate the impact of deformable motion in the lower body. Marker detection errors also contribute to the residual errors and thus it is not straightforward to separate out only deformable motion-contributed errors from the residual errors. However, assuming that SCANs of the patients standing straight (e.g., SCAN 1 of Subject 1, SCAN 3 of Subject 2) had negligible knee flexion, compared to SCANs of squatting at deep flexion (e.g., SCAN 2 of Subject 1, SCAN 5 of Subject 2) and that marker detection performance was the same for the same patient data (e.g., SCANs 3–5 of Subject 2), we can approximate the contribution of knee flexion to the residual errors. The difference in the same subject's residual error between a scan of standing straight and a scan of squatting at flexion was up to 0.19 mm (0.62 pixel) from SCAN 4 and SCAN 3 of Subject 2. Thus, the approximated deformable motion could be considered minor and patients showed almost rigid motion of their lower body during scanning. Moreover, optical tracking of involuntary motion of the lower body showed that knee flexion deviation was minor.16 In the optical tracking study, knee flexion deviation at the right and left knee of nine subjects squatting at approximately 60° of knee flexion for 20 s was 0.50 (±0.18) and 0.48 (±0.17) degrees, respectively. Given minor deviations in knee flexion, it is not unreasonable to assume that considering only a rigid body motion could work for correcting the involuntary motion in the lower body; this was confirmed by the results, which showed that 2D shifting and 3D warping performed well for the numerical data16 and experimental data in vivo even when used to analyze the datasets with the largest motion. We could further reduce the residual errors by addressing deformable motion using motion vector fields estimated by significant features in the projection images. However, deformable motion correction in 3D would involve increased computation complexity and unrealistic body warping, and thus for practical considerations, it might be preferable not to use deformable motion correction for the lower body motion with minor deviations in knee flexion. The two methods might not perform well for the lower body with significant deviations in the magnitude of knee flexion. As a practical way for 3D warping to address knee flexion, we could transform the lower leg and upper leg individually in 3D and apply both affine transformations to the region close to the knee joint center after weighting the two transformations based on proximity to the joint center, as we did for the XCAT model [see Ref. 16 in Part I].
The SSIM index differences for the different methods in the case of datasets with relatively small motion were minor. One to two percent differences in SSIM indices did not translate to observable differences in the image quality. The SSIM indices for experimental data were overall about 30%∼40% lower than those for the XCAT knee model. The registered static cadaver tibia (248 views, 1.2 μGy/projection) indicated by a star-shaped symbol in Fig. 10b showed a 35%–45% decrease in SSIM after segmentation and registration to the same object imaged in a supine position (494 views, 1.2 μGy/projection). This explains some of the decrease in SSIM for in vivo data compared to that of the XCAT knee model. Factors such as femur registration and femur segmentation contribute to lowering SSIM, as does the different starting position of the X-ray source between the supine and standing scanning. Moreover, we included some soft tissue that surrounds the femur in the SSIM ROI, which may deform and therefore contribute to the SSIM discrepancies, although we expect this effect to be small. The point clouds for the femur registration were segmented and acquired every three axial slices and thus were three times less dense than the voxel size in the axial direction. Thus, some of the reported registration error could be due to lack of corresponding points, especially at edges. As such, the registration error could be actually lower than the reported value, 0.19 mm (±0.02 mm) which implies the registration error was a relatively minor factor in decreasing the SSIM index. Thus, we can expect that if we could apply a perfect motion correction method to in vivo data, the SSIM indices could approach the star points “Standing static (registered)” in Fig. 10b. Given the differences in the SSIM index between the star points and motion-corrected in vivo data in Fig. 10, there is still room for improvement of the motion correction methods. The differences between the best SSIM (1.00) and “Supine static, 1.2 μGy/p” represents SSIM decrease due to the decreased number of views while the differences between “Supine static, 1.2 μGy/p”, “Supine static, 0.54 μGy/p” and “Supine static, 0.36 μGy/p” indicates the impact of the detector dose request on SSIM index. Note that the reduced number of views brings much larger image quality degradation than the reduced detector dose request. Thus, when optimizing dose acquisition protocols while maintaining the same dose exposure to patients, it is better to acquire more views in return for lowering the detector dose request. The SSIM index reported in this paper is a limited image quality metric since the SSIM is computed only on an ROI located around the left femur. The reported SSIM cannot represent the image quality of any other portions of the knee, including deformable soft tissue and artifact-corrupted regions.
As shown in Table 2 in Appendix A, entropy is not consistent with SSIM. We also observed that the entropy value differences do not reflect the visual impression. In contrast to this, Kyriakou et al.37 and Wicklein et al.38 showed that entropy-based metrics are well-suited to characterizing misalignment. In our study, several contributing factors caused seemingly contradictory results. The studies mentioned above adjusted alignment to minimize the entropy of the reconstructed volume, which is determined only by the sharpness of bone structures. Based on a relative displacement from the ideal alignment, the resulting images become either blurred or focused. However, in our study, intense involuntary motion in the patients’ lower body induced strong streaks in the images as shown in Fig. 6, and the CT number of the streaks approached that of bone structures. Entropy is not capable of enforcing the iteration procedure to selectively penalize motion streaks while sharpening the edges of bones. In addition, our images contain other artifacts from metal attenuation and marker detection errors, and truncated objects although these artifacts can be considered relatively minor compared to the motion artifacts. Thus, it is possible that in the presence of severe streaks coming from multiple artifact sources, the entropy minimization procedure becomes stuck in a local minimum. Moreover, entropy-based metrics showed relatively weak performance in scans with a lower number of projection images,38 and thus lower image quality might affect the entropy performance. To date, the entropy-based metrics have not been evaluated in the presence of multiple strong artifacts, and we have not yet investigated at which level of image noise (i.e., image quality) these metrics still function robustly. However, our preliminary results indicate that using entropy to evaluate the image quality of noisy images with multiple artifacts may not be reliable.
Table 2.
Entropy of SCAN 4 and 5 calculated using the same ROI as in SSIM calculation.
| Entropy |
|||||
|---|---|---|---|---|---|
| Axial slice | No correction | 2D shifting | 2D warping | 3D warping | |
| SCAN 4 | Central | 6.0829 | 6.0376 | 6.0372 | 6.1304 |
| Off-center | 6.6457 | 6.6788 | 6.7213 | 6.6338 | |
| SCAN 5 | Central | 6.0124 | 6.0002 | 6.0080 | 6.0785 |
| Off-center | 6.4637 | 6.4710 | 6.4710 | 6.4787 | |
As shown in Fig. 13 in Appendix B, we observed detector saturation artifacts near the leg periphery. While scanning the legs from the lateral side, the Automatic Exposure Control system (AEC) increases tube current and voltage high enough to penetrate through the two thick femur bones. Thus, a decrease in CT number in reconstructed slices was observed only along the lateral direction. Our detector with image depth of 212 (4096) starts to show nonlinear response to the signal from ∼3800 due to limited dynamic range. As a quick fix, modeling clay was wrapped around both legs to prevent the saturation at the periphery of the subject. Modeling clay worked well to avoid detector saturation close to the skin-air interface, particularly in the region of the patella. However, additional weight applied to the knee joint could make patients uncomfortable and alter knee joint kinematics. Schreiber et al.39 extrapolates missing information using geometric information in an orthogonal projection and Mail et al.40 implemented a bowtie filter to recover the skin line of an object.
Figure 13.
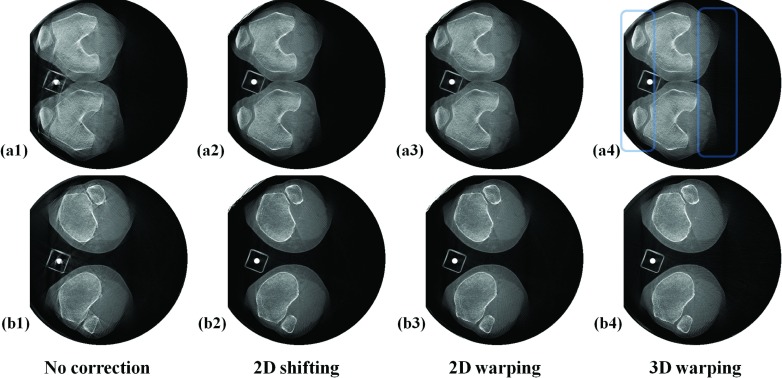
Detector saturation artifacts were observed on the posterior and anterior surfaces of the legs of Subject 1 standing straight (SCAN 1). Because of detector saturation, the skin lines near the object periphery were distorted, as indicated by the rectangular windows. There appears to be no skin above the patella because of the decrease in CT number at the periphery of the reconstruction.
The measured HU values from the CT images can be converted to hydroxyapatite (HA) mineral density using an HA bone mineral calibration phantom.41, 42 A C-Arm CT scanner with a flat panel detector can provide relative location of bones including superior bone density information, cartilage morphology, and meniscus location in vivo in 3D volumetric high-resolution images during realistic weight-bearing activity with minimal radiation dose to patients. The system is also capable of acquiring real-time fluoroscopy of knee kinematics. The combination of 3D static images and fluoroscopy could give unique diagnostic information and help us to better understand potential causes and progression of knee disorders such as OA.
CONCLUSIONS
C-arm CT control for horizontal trajectories was successfully implemented and the 3D knee geometry under weight-bearing conditions was acquired using a C-arm CT scanner. In order to evaluate three different fiducial marker-based motion compensation methods (2D projection shifting, 2D projection warping, and 3D image warping) previously tested on the numerical XCAT knee model, we scanned both legs of healthy volunteers under weight-bearing conditions with knee flexion angles of approximately 0°, 30°, and 60° using a C-arm CT scanner. We applied the methods to the five different datasets from two subjects in vivo. The experimental outcomes confirm theoretical results, showing that 3D image warping is superior to 2D-based methods in the presence of large motions, especially for off-center slices. Two-dimensional shifting, 2D warping, and 3D warping achieved enhanced values of the SSIM index by 20.22%, 16.83%, and 25.77% in the central slice of SCAN 5, which had the largest involuntary movement among the five datasets.
ACKNOWLEDGMENTS
This work was supported in part by NIH 1 R01HL087917, NIH Shared Instrument Grant S10 RR026714, Siemens Medical Solutions, and a Center for Biomedical Imaging at Stanford (CBIS) Seed Grant.
APPENDIX A: HISTOGRAM ENTROPY
Unlike the SSIM index, the histogram entropy does not require a reference image for comparison. Entropy has its maximum with a perfectly uniform image and decreases as image sharpness increases. Previous studies used entropy as a measure of misalignment-induced artifacts.37, 38 However, motion blurs out image intensities in certain pixels and thus entropy increases whereas motion-caused streaks decrease entropy. Therefore, it is not guaranteed that entropy will change monotonically as motion correction improves image quality. Shannon entropy43 is defined as
| (A1) |
where pi is the histogram counts with integer-valued HU numbers of i and n is 214 bins. In order to avoid aliasing artifacts, we used as many bins as there are HU values for the histogram.
Entropy of SCANs 4 and 5 is calculated and shown in Table 2 using the same ROI as in the SSIM calculation in Table 1 above. Entropy is not consistent with the SSIM indices nor with the visual impression of the images, does not change significantly, and may increase or decrease with applied correction.
APPENDIX B: DETECTOR SATURATION ARTIFACT
Figure 13 shows representative reconstructed axial slices of SCAN 1 without wrapping around both legs using modeling clay. Saturation-correction software on the system did not perform well so that detector saturation artifacts near the leg periphery were still present.
References
- Leach R. E., Gregg T., and Siber F. J., “Weight-bearing radiography in osteoarthritis of the knee,” Radiology 97(2), 265–268 (1970). [DOI] [PubMed] [Google Scholar]
- Brossmann J., Muhle C., Schroder C., Melchert U. H., Bull C. C., Spielmann R. P., and Heller M., “Patellar tracking patterns during active and passive knee extension: Evaluation with motion-triggered cine MR imaging,” Radiology 187(1), 205–212 (1993). [DOI] [PubMed] [Google Scholar]
- Powers C. M., Ward S. R., Fredericson M., Guillet M., and Shellock F. G., “Patellofemoral kinematics during weight-bearing and non-weight-bearing knee extension in persons with lateral subluxation of the patella: A preliminary study,” J. Orthop. Sports Phys. Ther. 33(11), 677–685 (2003). 10.2519/jospt.2003.33.11.677 [DOI] [PubMed] [Google Scholar]
- Draper C. E., Besier T. F., Fredericson M., Santos J. M., Beaupre G. S., Delp S. L., and Gold G. E., “Differences in patellofemoral kinematics between weight-bearing and non-weight-bearing conditions in patients with patellofemoral pain,” J. Orthop. Res. 29(3), 312–317 (2011). 10.1002/jor.21253 [DOI] [PMC free article] [PubMed] [Google Scholar]
- Kellgren J. H. and Lawrence J. S., “Radiological assessment of osteo-arthrosis,” Ann. Rheum. Dis. 16(4), 494–502 (1957). 10.1136/ard.16.4.494 [DOI] [PMC free article] [PubMed] [Google Scholar]
- Besier T. F., Draper C. E., Gold G. E., Beaupre G. S., and Delp S. L., “Patellofemoral joint contact area increases with knee flexion and weight-bearing,” J. Orthop. Res. 23(2), 345–350 (2005). 10.1016/j.orthres.2004.08.003 [DOI] [PubMed] [Google Scholar]
- Draper C. E., Besier T. F., Santos J. M., Jennings F., Fredericson M., Gold G. E., Beaupre G. S., and Delp S. L., “Using real-time MRI to quantify altered joint kinematics in subjects with patellofemoral pain and to evaluate the effects of a patellar brace or sleeve on joint motion,” J. Orthop. Res. 27(5), 571–577 (2009). 10.1002/jor.20790 [DOI] [PMC free article] [PubMed] [Google Scholar]
- Banks S. A. and Hodge W. A., “Accurate measurement of three-dimensional knee replacement kinematics using single-plane fluoroscopy,” IEEE Trans. Biomed. Eng. 43(6), 638–649 (1996). 10.1109/10.495283 [DOI] [PubMed] [Google Scholar]
- Anderst W. J. and Tashman S., “A method to estimate in vivo dynamic articular surface interaction,” J. Biomech. 36(9), 1291–1299 (2003). 10.1016/S0021-9290(03)00157-X [DOI] [PubMed] [Google Scholar]
- Tashman S. and Anderst W., “In-vivo measurement of dynamic joint motion using high speed biplane radiography and CT: Application to canine ACL deficiency,” J. Biomech. Eng.:Trans. ASME 125(2), 238–245 (2003). 10.1115/1.1559896 [DOI] [PubMed] [Google Scholar]
- Li G., Van de Velde S. K., and Bingham J. T., “Validation of a non-invasive fluoroscopic imaging technique for the measurement of dynamic knee joint motion,” J. Biomech. 41(7), 1616–1622 (2008). 10.1016/j.jbiomech.2008.01.034 [DOI] [PubMed] [Google Scholar]
- Liu F., Kozanek M., Hosseini A., Van de Velde S. K., Gill T. J., Rubash H. E., and Li G. A., “In vivo tibiofemoral cartilage deformation during the stance phase of gait,” J. Biomech. 43(4), 658–665 (2010). 10.1016/j.jbiomech.2009.10.028 [DOI] [PMC free article] [PubMed] [Google Scholar]
- Bingham J. T., Papannagari R., Van de Velde S. K., Gross C., Gill T. J., Felson D. T., Rubash H. E., and Li G., “In vivo cartilage contact deformation in the healthy human tibiofemoral joint,” Br. Soc. Rheumatol. 47(11), 1622–1627 (2008). 10.1093/rheumatology/ken345 [DOI] [PMC free article] [PubMed] [Google Scholar]
- Zbijewski W., De Jean P., Prakash P., Ding Y., Stayman J. W., Packard N., Senn R., Yang D., Yorkston J., Machado A., Carrino J. A., and Siewerdsen J. H., “A dedicated cone-beam CT system for musculoskeletal extremities imaging: Design, optimization, and initial performance characterization,” Med. Phys. 38(8), 4700–4713 (2011). 10.1118/1.3611039 [DOI] [PMC free article] [PubMed] [Google Scholar]
- Tuominen E. K. J., Kankare J., Koskinen S. K., and Mattila K. T., “Weight-bearing CT imaging of the lower extremity,” Am. J. Roentgenol. 200(1), 146–148 (2013). 10.2214/AJR.12.8481 [DOI] [PubMed] [Google Scholar]
- Choi J.-H., Fahrig R., Keil A., Besier T. F., Pal S., McWalter E. J., Beaupré G. S., and Maier A., “Fiducial marker-based correction for involuntary motion in weight-bearing C-arm CT scanning of knees. I. Numerical model-based optimization,” Med. Phys. 40(9), 091905 (12pp.) (2013). 10.1118/1.4817476 [DOI] [PMC free article] [PubMed] [Google Scholar]
- Hoppe S., “Accurate cone-beam image reconstruction in C-Arm computed tomography,” Ph.D. dissertation, University Erlangen Nuremberg, 2008. [Google Scholar]
- Rougee A., Picard C., Trousset Y., and Ponchut C., “Geometrical calibration for 3D x-ray-imaging,” Proc. SPIE 1897, 161–169 (1993). 10.1117/12.146963 [DOI] [PubMed] [Google Scholar]
- Rougee A., Picard C., Ponchut C., and Trousset Y., “Geometrical calibration of x-ray imaging chains for three-dimensional reconstruction,” Comput. Med. Imaging Graph. 17(4–5), 295–300 (1993). 10.1016/0895-6111(93)90020-N [DOI] [PubMed] [Google Scholar]
- Strobel N. K., Heigl B., Brunner T. M., Schuetz O., Mitschke M. M., Wiesent K., and Mertelmeier T., “Improving 3D image quality of x-ray C-arm imaging systems by using properly designed pose determination systems for calibrating the projection geometry,” Proc. SPIE 5030, 943–954 (2003). 10.1117/12.479945 [DOI] [Google Scholar]
- Duda R. O. and Hart P. E., “Use of the Hough transformation to detect lines and curves in pictures,” Commun. ACM 15(1), 11–15 (1972). 10.1145/361237.361242 [DOI] [Google Scholar]
- Schwemmer C., “High-density object removal from x-ray projection images,” Master's thesis, Universität Erlangen-N3rnberg, 2010. [Google Scholar]
- Tapiovaarra M., Lakkisto M., and Servomaa A., “PCXMC-A PC based Monte Carlo program for calculating patient doses in medical x-ray examinations,” Report No. STUK-A139, Finnish Centre for Radiation and Nuclear Safety, 1997.
- Fahrig R., Dixon R., Payne T., Morin R. L., Ganguly A., and Strobel N., “Dose and image quality for a cone-beam C-arm CT system,” Med. Phys. 33(12), 4541–4550 (2006). 10.1118/1.2370508 [DOI] [PubMed] [Google Scholar]
- E. H. S. Princeton University, Module 2: Background Radiation and Other Sources of Exposure, see http://web.princeton.edu/sites/ehs/osradtraining/backgroundradiation/background.htm.
- Marchant T. E., Amer A. M., and Moore C. J., “Measurement of inter and intra fraction organ motion in radiotherapy using cone beam CT projection images,” Phys. Med. Biol. 53(4), 1087–1098 (2008). 10.1088/0031-9155/53/4/018 [DOI] [PubMed] [Google Scholar]
- Donato G. and Belongie S., “Approximate thin plate spline mappings,” Lect. Notes Comput. Sci. 2352, 21–31 (2002). 10.1007/3-540-47977-5_2 [DOI] [Google Scholar]
- Maier A. K., Hofmann H. G., Berger M., Fischer P., Schwemmer C., Wu H., Mueller K., Hornegger J., Choi J.-H., Riess C., Keil A., and Fahrig R., “CONRAD: A software framework for cone-beam imaging in radiology,” Med. Phys. 40, 111914 (8pp.) (2013). 10.1118/1.4824926 [DOI] [PMC free article] [PubMed] [Google Scholar]
- Zellerhoff M., Scholz B., Ruhrnschopf E. P., and Brunner T., “Low contrast 3D-reconstruction from C-arm data,” Proc. SPIE 5745, 646–655 (2005). 10.1117/12.593433 [DOI] [Google Scholar]
- Ruhrnschopf E. P. and Klingenbeck K., “A general framework and review of scatter correction methods in x-ray cone-beam computerized tomography. Part 1: Scatter compensation approaches,” Med. Phys. 38(7), 4296–4311 (2011). 10.1118/1.3599033 [DOI] [PubMed] [Google Scholar]
- Wang Z., Bovik A. C., Sheikh H. R., and Simoncelli E. P., “Image quality assessment: From error visibility to structural similarity,” IEEE Trans. Image Process. 13(4), 600–612 (2004). 10.1109/TIP.2003.819861 [DOI] [PubMed] [Google Scholar]
- Lankton S. and Tannenbaum A., “Localizing region-based active contours,” IEEE Trans. Image Process. 17(11), 2029–2039 (2008). 10.1109/TIP.2008.2004611 [DOI] [PMC free article] [PubMed] [Google Scholar]
- Kjer H. M. and Wilm J., “Evaluation of surface registration algorithms for PET motion correction,” Bachelor thesis, Technical University of Denmark, 2010.
- Maier A., Choi J.-H., Keil A., Niebler C., Sarmiento M., Fieselmann A., Gold G., Delp S., and Fahrig R., “Analysis of vertical and horizontal circular C-arm trajectories,” Proc. SPIE 7961, 796123 (8pp.) (2011). 10.1117/12.878502 [DOI] [Google Scholar]
- Choi J.-H., Maier A., Berger M., and Fahrig R., “Effective one step-iterative fiducial marker-based compensation for involuntary motion in weight-bearing C-arm conebeam CT scanning of knees,” Proc. SPIE 9033, 903312 (6pp.) (2014). 10.1117/12.2043771 [DOI] [Google Scholar]
- Fischler M. A. and Bolles R. C., “Random sample consensus: A paradigm for model-fitting with applications to image-analysis and automated cartography,” Commun. ACM 24(6), 381–395 (1981). 10.1145/358669.358692 [DOI] [Google Scholar]
- Kyriakou Y., Lapp R. M., Hillebrand L., Ertel D., and Kalender W. A., “Simultaneous misalignment correction for approximate circular cone-beam computed tomography,” Phys. Med. Biol. 53(22), 6267–6289 (2008). 10.1088/0031-9155/53/22/001 [DOI] [PubMed] [Google Scholar]
- Wicklein J., Kunze H., Kalender W. A., and Kyriakou Y., “Image features for misalignment correction in medical flat-detector CT,” Med. Phys. 39(8), 4918–4931 (2012). 10.1118/1.4736532 [DOI] [PubMed] [Google Scholar]
- Schreiber B. and Brunner T., DE patent 7583830 (2009).
- Mail N., Moseley D. J., Siewerdsen J. H., and Jaffray D. A., “The influence of bowtie filtration on cone-beam CT image quality,” Med. Phys. 36(1), 22–32 (2009). 10.1118/1.3017470 [DOI] [PubMed] [Google Scholar]
- Keller T. S., “Predicting the compressive mechanical behavior of bone,” J. Biomech. 27(9), 1159–1168 (1994). 10.1016/0021-9290(94)90056-6 [DOI] [PubMed] [Google Scholar]
- Taddei F., Schileo E., Helgason B., Cristofolini L., and Viceconti M., “The material mapping strategy influences the accuracy of CT-based finite element models of bones: An evaluation against experimental measurements,” Med. Eng. Phys. 29(9), 973–979 (2007). 10.1016/j.medengphy.2006.10.014 [DOI] [PubMed] [Google Scholar]
- Shannon C. E., “The mathematical theory of communication, 1963,” MD Comput. 14(4), 306–317 (1997). 10.1145/584091.584093 [DOI] [PubMed] [Google Scholar]


