Abstract
Natalizumab, an anti-alpha4 integrin monoclonal antibody inhibiting the adhesion of lymphocytes to the endothelium, is a widely accepted drug treatment for relapsing–remitting multiple sclerosis (RRMS). A peripheral increase of T and B lymphocytes has already been observed as an early treatment effect. This retrospective observational study was aimed to evaluate the peripheral lymphocyte subsets during a long-term treatment follow-up. We included 23 RRMS patients treated with natalizumab for at least 24–48 months who had pretreatment lymphocyte evaluation. Baseline values of lymphocyte subsets and CD4/CD8 ratio did not differ significantly from the 23 matched healthy subjects. The periodic (every 3–6 months) assessment of immune cell subsets was performed by flow cytometry on peripheral blood collected before drug injection. Therapy with natalizumab was confirmed to be effective during the observational period. For all patients, the increase in lymphocytes during natalizumab therapy compared to baseline at every assessment was significantly higher compared to that of overall white blood cells (2·1-and 1·3-fold, respectively, P < 0·0001). Both T cell subsets were proportionally modified and the CD4/CD8 ratio did not change significantly, while B cells increased significantly compared to T and NK cells (3·2-, 1·88-and 1·92-fold, respectively, P < 0·0001). These changes remained constant throughout the 25–48-month period of therapy. In conclusion, effective natalizumab treatment of RRMS patients was associated with the persistence of its biological effects through a stable increase of peripheral lymphocytes, mainly B cells, and an unchanged proportion of T cell subsets in long-term follow-up.
Keywords: lymphocyte subsets, multiple sclerosis, natalizumab
Introduction
Natalizumab is a monoclonal antibody that significantly reduces the occurrence of relapses in relapsing–remitting multiple sclerosis (RRMS) patients [1]. The antibody is directed against the α4 subunit of the α4β1 (very late antigen-4, VLA-4) integrin on the lymphocytes [2]. It prevents the binding between VLA-4 and the vascular endothelium cell adhesion molecule 1 (VCAM-1) which, over time, decreases α4 expression [2]. The result consists of a reduced extravasation of inflammatory immune cells across the blood–brain barrier into the central nervous system (CNS), consequently increasing the number of immune cells in the peripheral blood [3–7]. However, natalizumab treatment can affect lymphocyte subsets in different ways, as the α4β1 integrins are expressed differently on lymphocyte subtypes, with higher levels on B than on T cells, on CD8+ than on CD4+ T cells and on memory than on naive cells [3–10]. Moreover, it has been shown that natalizumab mobilizes haematopoietic precursor cells from the bone marrow (BM), as α4β1 integrins are also expressed in haematopoietic precursor cells as well as in retention signals [11–13]. It is for these reasons that the increase of lymphocytes in the peripheral blood can be interpreted as either a sequestration of cells due to leucocyte transmigration inhibition [14,15] or as a lymphocyte release from BM [11–13]. Several studies have evaluated the peripheral lymphocyte pattern during short periods of natalizumab treatment. In our retrospective observational study, we aimed to analyse the lymphocyte subsets for 24–48 months of natalizumab therapy in a cohort of RRMS patients. These results might improve our knowledge in understanding long-term natalizumab management through evaluating its biological effects on blood peripheral lymphocytes.
Material and methods
Patients
We retrospectively included patients aged from 18 to 50 years, diagnosed with RRMS according to the revised McDonald criteria [16], including scores up to 5·5 with the Expanded Disability Status Scale (EDSS) (inclusive) [17], treated with Natalizumab for at least 24 months, and performed periodic lymphocyte subset assessments. The exclusion criteria included having used corticosteroids and immunomodulants in the previous month, other significant pathologies and not having performed a baseline lymphocyte subset evaluation. The enrolment and management of patients treated monthly with natalizumab must have met the newly established guidelines [18]. Neurological examinations were performed monthly; magnetic resonance imaging scans (MRI) were carried out every 6 months, while lymphocyte subset assessments were performed before drug administration every 3–6 months.
A group of healthy controls was selected among health workers registered in the laboratory database and matched to patients for demographic features, and was considered the reference range for white blood cell and lymphocyte subset counts. The immunological, clinical and MRI data, collected retrospectively, were stored into an electronic database.
Patient management was conducted in accordance with the International Conference Harmonization Guidelines of Good Clinical Practice and the Declaration of Helsinki. Given its retrospective design, this study did not interfere in the care received by patients; oral informed consent was obtained from all patients. However, the healthy subjects gave their written informed consent to collect their data in a laboratory database before blood sampling.
Analysis of peripheral blood mononuclear cells
The assessment of immune cell subsets in peripheral blood was performed by flow cytometry using a four-colour (CD45/CD3/CD4/CD8; CD45/CD3/CD19/CD16-56) single platform immune fluorescence staining kit (IMK staining kit, Trucount tubes, FACSCalibur; BD Biosciences, San Jose, CA, USA). The number of total white blood cells (WBC) and the different immunological subtypes, including CD4+ T lymphocytes, CD8+ T lymphocytes, natural killer (NK) and CD19+ B lymphocytes, were obtained. The ratio between T and B lymphocytes was also calculated.
Statistical analysis
Statistical analysis was performed by t-test or one-way analysis of variance (anova) with Dunnett's post-test using GraphPad Prism version 5·00 for Windows (GraphPad Software, San Diego, CA, USA). Differences were considered significant for P < 0·05.
Results
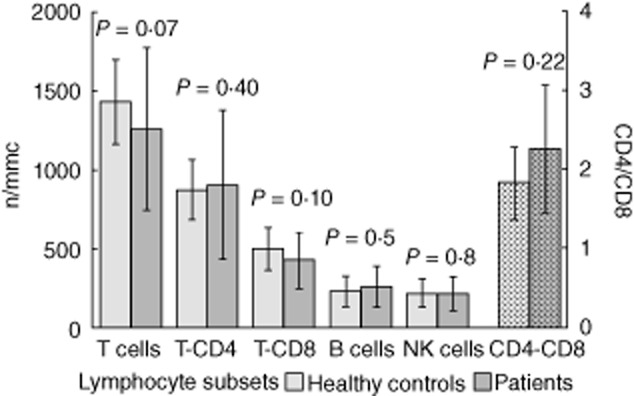
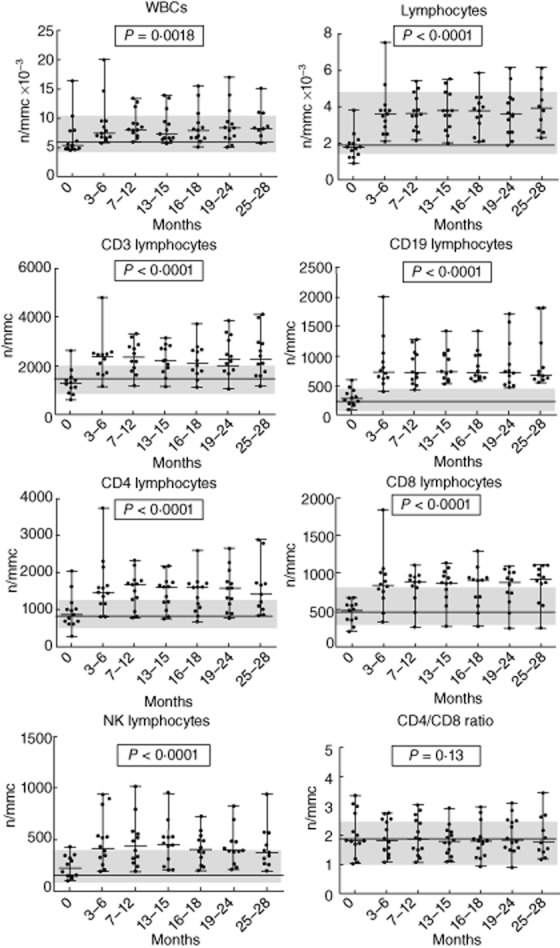
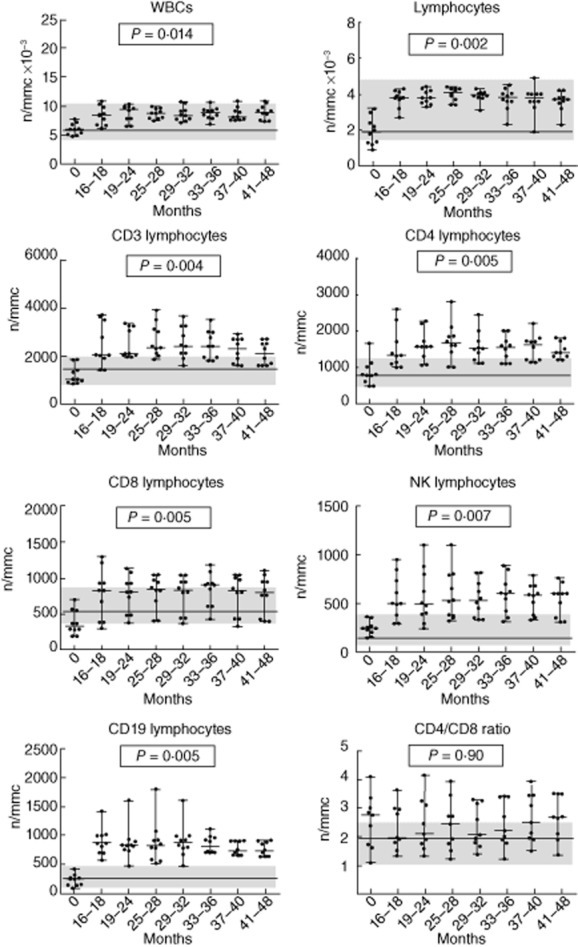
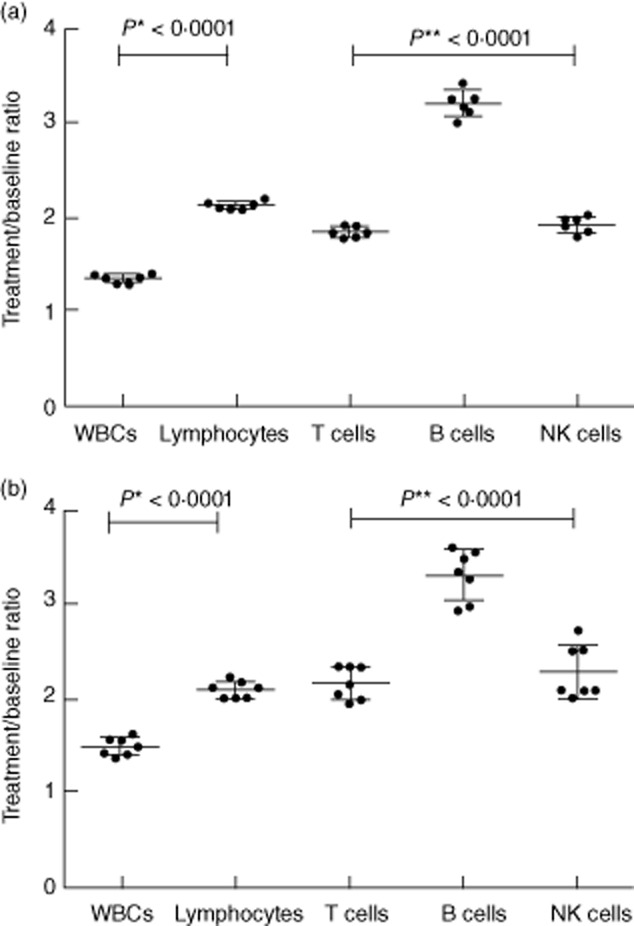
Twenty-five patients were recruited. Two patients were excluded because they did not have a baseline evaluation of lymphocyte subsets. Twenty-three patients (five male, 18 female), baseline mean ± standard deviation (s.d.) aged 42·6 years (± 11·8), disease duration of 11·8 years (± 8·6) and median (range) EDSS of 2·7 (1–4·5) were studied. All patients underwent previous treatment with interferon (IFN)-β or glatiramer acetate. Thirteen patients had lymphocyte subset evaluations every 3–6 months from baseline up to 25–28 months (medium-term treated group), while 10 patients had the baseline and 3–6-month periodical lymphocyte assessments from 16–18 months to 41–48 months of therapy (long-term treated group). No patient experienced a relapse or showed new lesions on MRI, and no serious adverse effects were manifested over the study period. We also recruited 23 healthy subjects as controls, matched to patient group for sex (five male, 18 female) and age (44·5 ± 7·2). Baseline values of lymphocyte subsets and CD4/CD8 ratio were within the normal ranges established in our laboratory, and did not differ significantly from healthy subjects (Fig. 1). There were no significant differences in baseline lymphocyte values between patients treated previously with IFN-β or glatiramer acetate (data not shown). The analysis of WBC, lymphocytes and lymphocyte subsets (CD3+, CD3+CD4+, CD3+CD8+, CD19+, CD16+CD56+) performed at 3–6-month intervals during natalizumab treatment showed a significant increase compared to baseline values, with the exception of the CD4/CD8 ratio, which remained unchanged. The increase in WBC and in lymphocyte subsets occurred at 3–6 months from starting therapy and persisted over time during treatment in the medium-term treated group (Table 1, Fig. 2). Similar results were found in the long-term treated group for all lymphocyte subsets but not for WBC (no significant differences) after 16–18 months of natalizumab therapy compared to baseline values (Table 2, Fig. 3). However, the different cell subsets did not show proportional increase values. In fact, when comparing the ratios between treatment (each time) and baseline values for all cell types, we observed that the increase in lymphocytes was significantly higher compared to the corresponding increase of the overall WBC: mean value ± s.d.: 2·1-and 1·3-fold, respectively, P < 0·0001 for all patients, and in particular 2·1 ± 0·04 and 1·3 ± 0·04, respectively, P < 0·0001 in the medium-term treated group; and 2·1 ± 0·09 and 1·4 ± 0·09, respectively, P < 0·0001 in the long-term treated group (Fig. 4a,b). Similarly, the increase in B cells was significantly higher than that of NK or T cells: mean value ± s.d.: 3·2-, 1·88-and 1·92-fold, respectively, P < 0·0001 in all patients, and 3·2 ± 0·14, 1·91 ± 0·87 and 1·84 ± 0·05, respectively, P < 0·0001 in the medium-term treated group; and 3·29 ± 0·27, 2·28 ± 0·28, 2·15 ± 0·17, respectively, P < 0·0001 in the long-term treated group (Fig. 4a,b). Finally, both CD4+ and CD8+ T cell subsets were proportionally modified and the CD4/CD8 ratio remained unchanged over time in both the medium-and the long-term treated groups (Table 1, Fig. 2 and Table 2, Fig. 3, respectively).
Figure 1.

Baseline values (mean ± standard deviation) of lymphocyte subsets in 23 natalizumab-treated patients and 23 healthy controls. P-values refer to t-test.
Table 1.
White blood cell counts and lymphocyte subsets in natalizumab-treated multiple sclerosis patients during the 25/28–month follow-up.
| Cells median n/mmc (range) | Baseline | 3–6 months | 7–12 months | 13–15 months | 16–18 months | 19–24 months | 25–28 months |
|---|---|---|---|---|---|---|---|
| WBCs | 5 500 | 7 500 | 8 100 | 7 300 | 8 000 | 8 400 | 8 400 |
| 4 500–16 400 | 5 800–20 000 | 6 000–13 400 | 5 700–13 900 | 5 100–15 500 | 5 100–17 000 | 5 800–15 000 | |
| Lymphocytes | 1 800 | 3 600 | 3 600 | 3 800 | 3 800 | 3 600 | 3 900 |
| 900–3 800 | 2 100–7 500 | 2 100–5 400 | 2 000–5 500 | 2 100–5 900 | 1 900–6 100 | 2 300–6 100 | |
| CD3+ (T cells) | 1 300 | 2 400 | 2 300 | 2 200 | 2 100 | 2 300 | 2 250 |
| 630–2 600 | 1 100–4 800 | 1 200–3 300 | 1 100–3 100 | 1 100–3 700 | 1 050–3 800 | 1 200–4 100 | |
| CD3+CD4+ | 860 | 1 470 | 1 670 | 1 610 | 1 600 | 1 580 | 1 410 |
| 270–2 050 | 810–3 750 | 775–2 330 | 750–2 180 | 670–2 590 | 760–2 660 | 840–2 890 | |
| CD3+CD8+ | 490 | 820 | 870 | 860 | 890 | 870 | 913 |
| 200–660 | 330–1 850 | 250–1 100 | 270–1 120 | 270–1 300 | 245–1 080 | 250–1 100 | |
| CD19+ (B cells) | 270 | 730 | 714 | 740 | 710 | 717 | 680 |
| 84–590 | 400–2 000 | 420–1 280 | 520–1 420 | 570–1 420 | 470–1 720 | 550–1 800 | |
| CD16+CD56+ (NK cells) | 230 | 410 | 445 | 460 | 410 | 400 | 380 |
| 100–430 | 200–950 | 196–1 030 | 210–970 | 200–730 | 220–830 | 200–950 | |
| CD4/CD8 ratio | 1·82 | 1·84 | 1·9 | 1·8 | 1·8 | 1·85 | 1·77 |
| 1·0–3·4 | 1·0–2·8 | 1·1–3·0 | 1·1–2·9 | 1·0–2·9 | 0·9–3·1 | 1·2–3·4 |
Median values indicated in bold.
NK = natural killer; WBCs = white blood cells.
Figure 2.

Trend of white blood cells, lymphocytes and lymphocyte subsets in medium-term natalizumab-treated group during 25/28-month follow-up. P-values refer to the analysis of variance test for repeated measures; the line and the grey areas represent median value and range of healthy controls.
Table 2.
White blood cell counts and lymphocyte subsets in natalizumab-treated multiple sclerosis patients during the 41/48–month follow-up.
| Cells median n/mmc (range) | Baseline | 16–18 months | 19–24 months | 25–28 months | 29–32 months | 33–36 months | 37–40 months | 41–48 months |
|---|---|---|---|---|---|---|---|---|
| WBCs | 5 900 | 8 300 | 9 600 | 8 800 | 8 400 | 9 200 | 8 100 | 9 200 |
| 4 800–7 700 | 6 100–1 010 | 6 500–10 300 | 7 400–9 900 | 7 100–10 700 | 6 800–10 600 | 7 500–10 800 | 7 400–10 800 | |
| Lymphocytes | 1 800 | 3 800 | 3 800 | 4 000 | 3 900 | 3 600 | 3 600 | 3 600 |
| 900–3 200 | 2 700–4 300 | 3 300–4 400 | 3 400–4 400 | 3 100–4 300 | 2 300–4 500 | 1 900–4 900 | 2 300–4 200 | |
| CD3+ (T cells) | 1 030 | 2 040 | 2 100 | 2 400 | 2 450 | 2 400 | 2 200 | 2 000 |
| 845–1 850 | 1 400–3 700 | 1 960–3 400 | 1 800–3 900 | 1 600–3 600 | 1 800–3 000 | 1 600–2 700 | 1 600–2 700 | |
| CD3+CD4+ | 800 | 1 300 | 1 600 | 1 700 | 1 500 | 1 500 | 1 550 | 1 400 |
| 480–1 650 | 1 000–2 600 | 1 100–2 300 | 1 000–2 800 | 1 100–2 400 | 1 100–2 000 | 1 100–1 800 | 1 200–1 800 | |
| CD3+CD8+ | 370 | 820 | 810 | 860 | 860 | 850 | 800 | 760 |
| 190–700 | 300–1 300 | 380–1 100 | 410–1 000 | 370–1 000 | 430–1 200 | 330–1 000 | 400–1 100 | |
| CD19+ (B cells) | 240 | 860 | 830 | 800 | 850 | 780 | 710 | 700 |
| 84–420 | 570–1 400 | 470–1 600 | 510–1 800 | 470–1 600 | 700–1 100 | 650–900 | 630–910 | |
| CD16+CD56+ (NK cells) | 240 | 500 | 480 | 496 | 507 | 650 | 600 | 600 |
| 145–360 | 290–950 | 240–1 100 | 320–1 100 | 330–820 | 310–850 | 330–790 | 310–760 | |
| CD4/CD8 ratio | 2·75 | 1·97 | 2·1 | 2·43 | 2·07 | 2·2 | 2·61 | 2·7 |
| 1·1–4·00 | 1·3–3·6 | 1·32–4·10 | 1·2–3·9 | 1·4–3·3 | 1·2–3·4 | 1·5–3·9 | 1·4–3·5 |
Median values indicated in bold.
NK = natural killer; WBCs = white blood cells.
Figure 3.

Trend of white blood cells, lymphocytes and lymphocyte subsets in long-term natalizumab-treated group during 41/48-month follow-up. P-values refer to the analysis of variance test for repeated measures; the line and the grey areas represent median value and range of healthy controls.
Figure 4.

Mean increase ± standard deviation of white blood cells, lymphocytes and lymphocyte subsets (every-time treatment value/baseline value) in medium-(a) and long-term (b) natalizumab-treated groups. P-values refer to t-test (*) or analysis of variance (**).
Discussion
Natalizumab is a monoclonal antibody used in MS to reduce disease activity, even though its effects on different immune cell populations are still unclear [12–15]. The results of the present study, aimed to monitor the changes in immune cell subsets in the long-term follow-up of patients treated with natalizumab, confirmed an early increase of all lymphocyte subsets in the peripheral blood already reported in previous studies [3–7]. Moreover, this increase, involving T lymphocytes, NK cells and B cells, persisted in the long-term follow-up, indicating that the efficacy of natalizumab therapy may be correlated with the persistence of its biological effects through a stable increase in all peripheral lymphocytes, mainly B cells. We also observed an increase in both CD4 and CD8 lymphocyte subsets in line with that reported in previous papers [5,7,14]. Our data confirmed an unaltered relative proportion of both subsets reported in one of these studies [5]; however, our data differed from other studies which showed a significant decrease in the CD4/CD8 ratio [10,14]. In our study the unchanged CD4/CD8 T cell ratio remained constant throughout the entire course of therapy.
We also observed a significantly higher increase in CD19+ B cells compared to other lymphocytes, in agreement with reports from previous studies [3–7,14]; however, in contrast, another study reported the highest increase in the number of NK cells occurring after 1 year of natalizumab treatment compared to baseline, followed by B and T cells [10]. This discrepancy could be explained by the fact that repeated comparisons, instead of a single comparison, compared to the baseline value were made during some years of therapy. The origin of B cells is still a matter of debate as to whether they originate from BM cells [7] or peripheral cells [14]. However, considering the scarcity of leucocytes compared to periphery cells in the CNS and the minor contribution of memory and marginal zone-like B cells in composing the lymphocyte pool, it is unlikely that the reduced migration of leucocytes into the CNS and the decreased retention of specific B cell subsets in the spleen can quantitatively affect peripheral lymphocyte count or fully explain the increase of lymphocytes observed during natalizumab therapy. The more pronounced increase in B cells compared to T cells suggests that some B cells might be precursors coming from the BM. In fact, recently published data, based on T cell receptor and kappa-deleting recombinant excision circle assays, showed that newly produced T and B lymphocytes increased significantly in the peripheral blood of patients treated for 6 and 12 months with natalizumab, thus indicating that the drug may influence the lymphocyte release from production sites [7]. It may have potential implications for the development of progressive multi-focal leucoencephalopathy, a severe opportunistic CNS infection determined by John Cunningham (JC) virus that can occur during natalizumab therapy [19]. Finally, an expansion of NK cells found in our study confirmed the data from previous studies [4,5,10], probably correlated with a treatment response [4], supporting the role played by these cells in immunoregulation.
Conclusions
The present data show that long-term effective natalizumab treatment determines a prolonged increase in peripheral lymphocytes, particularly of CD19+ B cells, with a proportional increase in peripheral T cell subsets and unchanged CD4/CD8 ratio, throughout the entire period of therapy, even at long-term 48-month follow-up.
Author contributions
T. K. and P. C.-F. designed the study, T. K., P. C.-F. and E. S. wrote the paper and E. T., V. B. and G. D'A. performed the laboratory assays and data analysis. Ms Tania Merlino edited the English language of this paper.
Disclosure
The authors report no conflicts of interest or financial interests. T. K. received consulting fees from Bayer Schering and institutional grant support from Merck Serono, Biogen Idec and Novartis. The other authors have none to declare.
References
- 1.Miller DH, Khan OA, Sheremata WA, et al. A controlled trial of natalizumab for relapsing multiple sclerosis. N Engl J Med. 2003;348:15–23. doi: 10.1056/NEJMoa020696. [DOI] [PubMed] [Google Scholar]
- 2.Wipfler P, Oppermann K, Pilz G, et al. Adhesion molecules are promising candidates to establish surrogate markers for natalizumab treatment. Mult Scler. 2011;17:16–23. doi: 10.1177/1352458510383075. [DOI] [PubMed] [Google Scholar]
- 3.Krumbholz M, Meinl I, Kümpfel T, Hohlfeld R, Meinl E. Natalizumab disproportionately increases circulating pre-B and B cells in multiple sclerosis. Neurology. 2008;71:1350–1354. doi: 10.1212/01.wnl.0000327671.91357.96. [DOI] [PubMed] [Google Scholar]
- 4.Putzki N, Baranwal MK, Tettenborn B, Limmroth V, Kreuzfelder E. Effects of natalizumab on circulating B cells, T regulatory cells and natural killer cells. Eur Neurol. 2010;63:311–317. doi: 10.1159/000302687. [DOI] [PubMed] [Google Scholar]
- 5.Skarica M, Eckstein C, Whartenby KA, Calabresi PA. Novel mechanisms of immune modulation of natalizumab in multiple sclerosis patients. J Neuroimmunol. 2011;235:70–76. doi: 10.1016/j.jneuroim.2011.02.010. [DOI] [PubMed] [Google Scholar]
- 6.Planas R, Jelčić I, Schippling S, Martin R, Sospedra M. Natalizumab treatment perturbs memory-and marginal zone-like B-cell homing in secondary lymphoid organs in multiple sclerosis. Eur J Immunol. 2012;42:790–798. doi: 10.1002/eji.201142108. [DOI] [PubMed] [Google Scholar]
- 7.Zanotti C, Chiarini M, Serana F, et al. Peripheral accumulation of newly produced T and B lymphocytes in natalizumab-treated multiple sclerosis patients. Clin Immunol. 2012;145:19–26. doi: 10.1016/j.clim.2012.07.007. [DOI] [PubMed] [Google Scholar]
- 8.Ryan DH, Nuccie BL, Abboud CN, Winslow JM. Vascular cell adhesion molecule-1 and the integrin VLA-4 mediate adhesion of human B cell precursors to cultured bone marrow adherent cells. J Clin Invest. 1991;88:995–1004. doi: 10.1172/JCI115403. [DOI] [PMC free article] [PubMed] [Google Scholar]
- 9.Niino M, Bodner C, Simard ML, et al. Natalizumab effects on immune cell responses in multiple sclerosis. Ann Neurol. 2006;59:748–754. doi: 10.1002/ana.20859. [DOI] [PubMed] [Google Scholar]
- 10.Mellergård J, Edström M, Jenmalm MC, Dahle C, Vrethem M, Ernerudh J. Increased B cell and cytotoxic NK cell proportions and increased T cell responsiveness in blood of natalizumab-treated multiple sclerosis patients. PLOS One. 2013;8:e81685. doi: 10.1371/journal.pone.0081685. doi: 10.1371/journal.pone.0081685. [DOI] [PMC free article] [PubMed] [Google Scholar]
- 11.Bonig H, Wundes A, Chang KH, Lucas S, Papayannopoulou T. Increased numbers of circulating hematopoietic stem/progenitor cells are chronically maintained in patients treated with the CD49d blocking antibody natalizumab. Blood. 2008;111:3439–3441. doi: 10.1182/blood-2007-09-112052. [DOI] [PMC free article] [PubMed] [Google Scholar]
- 12.Zohren F, Toutzaris D, Klarner V, Hartung HP, Kieseier B, Haas R. The monoclonal anti-VLA-4 antibody natalizumab mobilizes CD341 hematopoietic progenitor cells in humans. Blood. 2008;111:3893–3895. doi: 10.1182/blood-2007-10-120329. [DOI] [PubMed] [Google Scholar]
- 13.Jing D, Oelschlaegel U, Ordemann R, et al. CD49d blockade by natalizumab in patients with multiple sclerosis affects steady-state hematopoiesis and mobilizes progenitors with a distinct phenotype and function. Bone Marrow Transplant. 2010;45:1489–1496. doi: 10.1038/bmt.2009.381. [DOI] [PubMed] [Google Scholar]
- 14.Frisullo G, Iorio R, Plantone D, et al. CD4+T-bet+, CD4+pSTAT3+ and CD8+T-bet+ T cells accumulate in peripheral blood during NZB treatment. Mult Scler. 2011;17:556–566. doi: 10.1177/1352458510392263. [DOI] [PubMed] [Google Scholar]
- 15.Kivisäkk P, Healy BC, Viglietta V, et al. Natalizumab treatment is associated with peripheral sequestration of proinflammatory T cells. Neurology. 2009;72:1922–1930. doi: 10.1212/WNL.0b013e3181a8266f. [DOI] [PMC free article] [PubMed] [Google Scholar]
- 16.Polman CH, Reingold SC, Edan G, et al. Diagnostic criteria for multiple sclerosis: 2005 revisions to the ‘McDonald Criteria’. Ann Neurol. 2005;58:840–846. doi: 10.1002/ana.20703. [DOI] [PubMed] [Google Scholar]
- 17.Kurtzke JF. Rating neurologic impairment in multiple sclerosis: an expanded disability status scale (EDSS) Neurology. 1983;33:1444–1452. doi: 10.1212/wnl.33.11.1444. [DOI] [PubMed] [Google Scholar]
- 18.Foley J. Recommendations for the selection, treatment, and management of patients utilizing natalizumab therapy for multiple sclerosis. Am J Manag Care. 2010;16(6 Suppl):S178–183. [PubMed] [Google Scholar]
- 19.Sottini A, Capra R, Zanotti C, et al. Pre-existing T-and B-cell defects in one progressive multifocal leukoencephalopathy patient. PLOS One. 2012;7:34493. doi: 10.1371/journal.pone.0034493. [DOI] [PMC free article] [PubMed] [Google Scholar]


