Abstract
In view of the exaggerated complement activation in rheumatoid arthritis (RA) and significance of complement receptor 1 (CR1/CD35) as a complement regulatory protein (CRP), we aimed to determine the leucocyte-complement receptor 1 (L-CR1) transcript levels and the relationship of this protein with the clinical disease activity of RA patients. Sixty-six controls and 45 RA patients were enrolled. L-CR1 transcript levels were correlated with the levels of circulating immune complexes (CIC), C3, C4 and C3d in controls and patients and with disease activity score 28 (DAS28) in patients only. CIC levels were determined by polyethylene glycol (PEG) precipitation, C3 and C4 levels by nephlometry and C3d levels by enzyme-linked immunosorbent assay (ELISA). Eleven patients were recruited for follow-up of L-CR1 and DAS28 levels at weeks 0, 12 and 24. Appropriate statistical methods were used for the data analysis. L-CR1 (P < 0·01) transcript levels were decreased in patients compared to controls. L-CR1 levels correlated negatively with DAS28, CIC and C3d. DAS28 correlated positively with levels of CIC, C3 and C3d. Levels of CIC correlated positively with C3 and C3d. Levels of C3 correlated positively with C3d in patients and with C4 in both controls and patients. Levels of L-CR1 increased with decline in DAS28 scores in follow-up patients. Observations were statistically significant. Lower levels of L-CR1 transcript in patients compared to controls, their correlations with the levels of CIC, C3d and DAS28 at different time-points in RA patients suggest CR1 as a potential disease marker for RA.
Keywords: circulating immune complexes, complement regulatory proteins, DAS28, leucocyte-CR1, rheumatoid arthritis
Introduction
Exaggerated activation of the complement cascades is a key feature in autoimmune disorders. The zymogens in the complement system are activated by immune complexes and other molecular patterns. Upon activation, inflammatory peptides C3a, C5a, opsonins C3b, C4b and membrane attack complexes C5b–C9(n) are generated [1]. In physiological concentrations, these molecules protect the host against invading pathogens. Pathological concentrations of activated complement peptides and bystander effects of membrane attack complex, however, may be highly injurious to the host. A large number of complement regulatory proteins maintain complement homeostasis and keep concentrations of inflammatory complement components within the desired limits [2]. Complement-mediated cell and tissue injury contribute significantly to the pathogenesis of autoimmune disorders [3]; functional impairment of complement regulatory proteins is envisaged. While factor H is the key fluid phase complement regulatory protein for the alternative pathway, most of the complement regulatory proteins are membrane-bound and are expressed on different cell surfaces [2].
Complement receptor 1 (CD35), also known as CR1, is a key complement regulatory protein that acts as a co-factor of factor I. CR1 accelerates the decay of C3 and C5 convertases of classical and alternative pathways of the complement cascade. CR1 is a single-chain trans-membrane glycoprotein expressed on glomerular podocytes and different blood cells, except platelets. Erythrocyte CR1 (E-CR1) also serves as the chief vehicle for the clearance of immune complexes and complement-coated particles from circulation [4]. CR1 on phagocytes facilitates the uptake and clearance of immune complexes by these cells, and contributes to immune regulation on B and T cells [5]. Although a large body of information is available on the modulation and significance of erythrocyte CR1 in autoimmune disorders, such as systemic lupus erythematosus (SLE) and rheumatoid arthritis (RA), leucocyte-CR1 (L-CR1) has received much less attention [6,7]. Earlier, case–control and longitudinal studies carried out by us documented the disease-related modulation of L-CR1 transcript and protein in SLE [8]. Subsequently, the L-CR1 transcript and protein were suggested as potential disease activity markers of SLE [9]. No study of this kind has been carried out for RA and other systemic autoimmune disorders. This case–control and longitudinal study aimed to determine the relation of L-CR1 with the clinical disease activity of RA.
Methods
Study population
In this study, 45 patients (35 females and 10 males) with active RA [median age (range) 31 (18–52) years] were recruited from the out-patient department of All India Institute of Medical Sciences (AIIMS), New Delhi. Diagnosis was made in accordance with the 1987 revised classification criteria of the American College of Rheumatology (ACR). The 28-joint disease activity score (DAS28) was used to calculate the disease activity of all patients. Of these 45 patients, 11 patients volunteered for the follow-up study; 66 healthy volunteers were recruited as controls and consisted of 51 females and 15 males with a median age of 28 years, ranging from 20 to 49 years. Written consent was given by each individual before taking blood. The ethics committee of the All India Institute of Medical Sciences approved the study design.
Sample collection
Ten ml of venous blood in ethylenediamine tetraacetic acid (EDTA) and non-EDTA vials was drawn from patients and controls. Blood samples from the 11 follow-up patients were collected at weeks 0 (first day of diagnosis), 12 and 24. Plasma and serum were separated and stored immediately at −70°C for future use. After separation of plasma, the packed cellular fraction was used for the isolation of leucocytes, as described previously [8]. Leucocytes were counted in a haemocytometer and cell viability was confirmed by trypan blue staining.
Real-time polymerase chain reaction (PCR)
RNA was extracted from freshly isolated leucocytes using Trizol reagent (Sigma-Aldrich, St Louis, MO, USA), according to the manufacturer's instructions, and quantified by nanodrop (nanodrop-1000; Thermo Scientific, Wilmington, DE, USA). cDNA was synthesized from 1 μg of RNA using M-MuLVRevertAid reverse transcriptase (MBI Fermentas, Hanover, MD, USA) and random hexamer (MBI Fermentas) in a 20 μl reaction volume. The transcript levels of L-CR1 were determined by real-time PCR using syto9 dye (Invitrogen, Grand Island, NY, USA) and Taq polymerase (MBI Fermentas) in the ABI Prism 7500 sequence detection system (Applied Biosystems, Foster City, CA, USA). The CR1 transcript was normalized using the β-actin housekeeping gene. Gene expression was determined using the ΔCt method. Real-time PCR was performed with an initial denaturation step of 3 min at 95°C, followed by 40 cycles of 30 s at 95°C, 30 s at an annealing temperature of 53·8°C and an extension of 30 s at 72°C. The primers used were: CR1 sense, CCCTTTGGAAAAGCAGTAAA, anti-sense, TCAACTTGGCAAACAGAAAA; and β-actin sense, AGAAAATCTGGCACCACACC, anti-sense, TAGCACAGCCTGGATAGCAA.
Levels of circulating immune complexes (CIC)
CIC were estimated in plasma samples of RA patients and controls by the method described previously by Sai Baba et al. [10]. CIC were precipitated from the plasma with 2·5% polyethylene glycol (PEG) 6000 at 4°C overnight, and the concentration of CIC was measured in a spectrophotometer (UV-160A UV-VIS Spectrophotometer; Shimadzu, Kyoto, Japan) using aggregated human gamma globulin as standard.
Levels of C3 and C4
C3 and C4 levels were estimated using the MININEPH™ kit (The Binding Site, Birmingham, UK). According to the manufacturer's instructions, the C3 and C4 anti-serum in the kits was adsorbed to monospecificity for C3 and C4, respectively.
Levels of C3d
C3d levels were estimated using the Bmassay enzyme-linked immunosorbent assay (ELISA) kit (Biomedical Assay Co. Ltd, Beijing, China) that used antibody specific for C3d, according to the manufacturer's instructions.
Statistical analysis
Data were analysed using spss software version 14. The results are presented as median (range) or mean ± standard deviation (s.d.). The Mann–Whitney U-test and unpaired t-test were utilized for comparisons between controls and patients, as applicable. Correlation between the variables was assessed by applying Spearman's rho analysis, and the significance level was measured by two-tailed paired Student's t- test.
Differences between DAS28 before and after treatment were compared using the paired t-test. Differences between levels of L-CR1 transcript before and after treatment were compared using the Wilcoxon signed-rank test. In all cases, P < 0·05 was considered significant.
Results
Characteristics of the patients
RA patients included in this study were enrolled from the medical out-patient department of AIIMS. Patients were evaluated and diagnosed by the clinicians. All the patients were disease-modifying anti-rheumatic drug (DMARD) treatment-naive at the time of their inclusion into this study. Seventy-seven per cent of the patients had anaemia. One patient complained of dry mouth and had oral ulcers, while two patients had Raynaud's phenomenon. The treatment regimen initiated included non-steroid anti-inflammatory drugs, steroids (prednisolone) and DMARDs (methotrexate, leflunomide, hydroxychloroquine and sulphasalazine) in different combinations, as appropriate for each patient. The levels of erythrocyte sedimentation rate (ESR), essential for 28-joint disease activity score (DAS28) calculation, were obtained from the clinical records of the patients. Table 1 gives the demographic and clinical characteristics of these RA patients.
Table 1.
Clinical characteristic of rheumatoid arthritis (RA) patients.
| Variable | Value |
|---|---|
| n (number of subjects) | 45 |
| Sex, female/male, n | 35/10 |
| Age at diagnosis, years | 32·04 ± 10·38 |
| Disease duration, months | 66·04 ± 75·57 |
| DAS28 score | 6·33 ± 1·05 |
| Number of swollen joints score | 10·04 ± 5·04 |
| Number of tender joints score | 12·02 ± 6·62 |
| VAS wellbeing (mm) | 72·93 ± 14·00 |
| Erosions, n | 26 |
| Rheumatoid factor, n | 45 |
| ESR, mm/hr | 48·89 ± 26·63 |
Values are represented as mean ± standard deviation. DAS28 = disease activity score 28; ESR = erythrocyte sedimentation rate; VAS = visual analogue scale.
L-CR1 expression at transcript level in controls and RA patients
The levels of L-CR1 transcript in controls (n = 66) and treatment-naive RA (n = 45) patients were analysed by real-time PCR. A representative agarose gel (2%) photograph of real-time PCR products of β-actin and CR1 is shown in Fig. S1. β-actin was used to normalize the expression of CR1 in real-time PCR. Comparison of the L-CR1 transcript of controls (median 0·0044) with that of the RA patients (median 0·0010) revealed that RA patients had a significantly lower expression of CR1 mRNA (Mann–Whitney U-test, P < 0·01; Fig. 1). Expression of CR1 in controls and RA patients ranged from 0·00011–0·040 and 0·000075–0·025, respectively.
Figure 1.
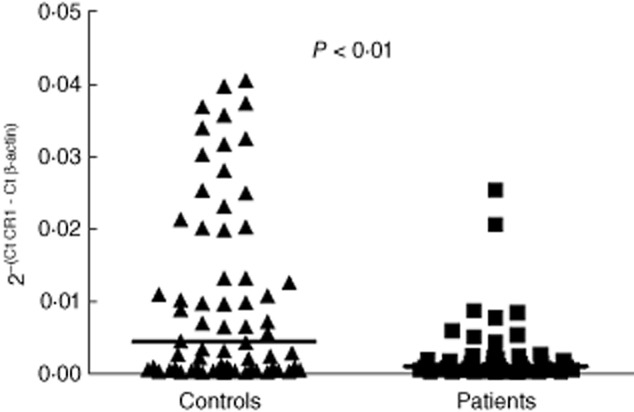
Levels of L-CR1 transcript determined by real-time polymerase chain reaction (PCR). Figure 1 shows the values of CR1 transcript in leucocytes normalized by β-actin in controls (n = 66) and rheumatoid arthritis (RA) patients (n = 45). The horizontal bar represents the median value. The P-value was assessed by Mann–Whitney U-test.
Correlation of levels of L-CR1 transcript with DAS28 in RA patients
DAS28 was evaluated in all RA patients as a measure of disease activity using tender joint count (TJC), swollen joint count (SJC), ESR and the patient's assessment of general health on a visual analogue scale (VAS) of 100 mm. RA patients showed a significant negative correlation of L-CR1 transcript with DAS28 (r = −0·3251, P < 0·05; Fig. 2)
Figure 2.
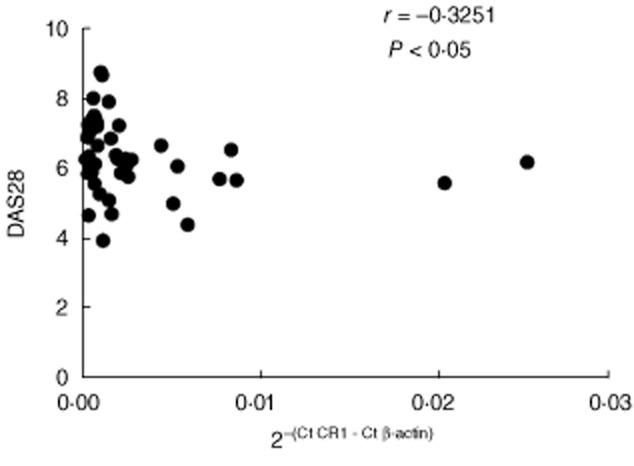
Correlation of L-CR1 transcript with disease activity score 28 (DAS28) in rheumatoid arthritis (RA) patients (n = 45). The coefficient of correlation (r) and P-value was calculated by Spearman's rho analysis and two-tailed test, respectively.
Correlation of levels of L-CR1 transcript with levels of CIC, C3, C3d and C4 in controls and RA patients
The CIC levels were significantly higher in RA patients (unpaired t-test, P < 0·0001; Fig. 3a) (median 511·6 μg/ml) compared to controls (median 238·5 μg/ml). The CIC levels in controls and RA patients ranged from 31·22–658·5 and 88·17–1215, respectively.
Figure 3.
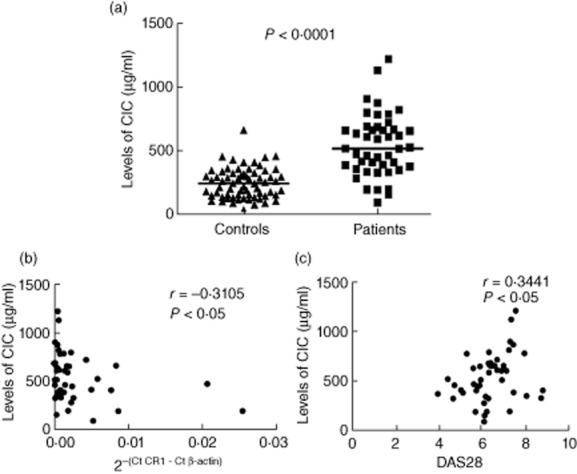
Levels of circulating immune complexes (CIC) and its correlation with L-CR1 transcript and disease activity score 28 (DAS28). Levels of CIC (a) were evaluated in controls (n = 66) and rheumatoid arthritis (RA) patients (n = 45). The horizontal bar represents the median value. The P-value was assessed by unpaired t-test. Correlation of CIC with L-CR1 transcript (b) and DAS28 (c) in RA patients (n = 45). The coefficient of correlation (r) and P-value was calculated by Spearman's rho analysis and two-tailed test, respectively.
The L-CR1 transcript correlated significantly with levels of CIC (r = −0·3105, P < 0·05; Fig. 3b) in RA patients. We also found that DAS28 correlated significantly with levels of CIC (r = 0·3441, P < 0·05; Fig. 3c) in RA patients.
Comparison of levels of C3 (unpaired t-test, P < 0·0001; Fig. 4a) between RA patients and controls showed significantly raised levels of C3 in RA patients. The median and range of C3 levels were 1·428 g/l (0·7650–2·804 g/l) in controls and 1·885 g/l (0·6830–3·296 g/l) in RA patients.
Figure 4.
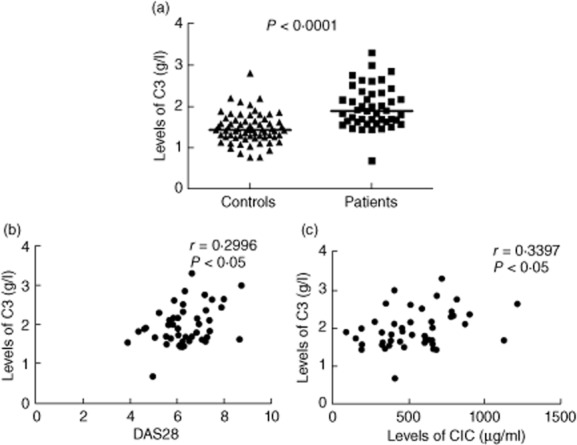
Levels of C3 and its correlation with disease activity score 28 (DAS28) and levels of circulating immune complexes (CIC). Levels of C3 (a) were evaluated in controls (n = 66) and rheumatoid arthritis (RA) patients (n = 45). The horizontal bar represents the median value. The P-value was assessed by unpaired t-test. Correlation of C3 with DAS28 (b) and CIC (c) in RA patients (n = 45). The coefficient of correlation (r) and P-value was calculated by Spearman's rho analysis and two-tailed test, respectively.
No significant correlations of the L-CR1 transcript with levels of C3 were observed in either RA patients or controls. A significant positive correlation of levels of C3 with DAS28 (r = 0.2996, P < 0·05; Fig. 4b) and with levels of CIC (r = 0.3397, P < 0·05; Fig. 4c) was found in RA patients.
The levels of C3d were significantly higher (unpaired t-test, P < 0·001; Fig. 5a) in RA patients (n = 36) compared to controls (n = 28). The median and range of levels of C3d in controls and RA patients were 54·78 ng/ml (1·373–101·4 ng/ml) and 74·40 ng/ml (42·75−212 ng/ml), respectively.
Figure 5.
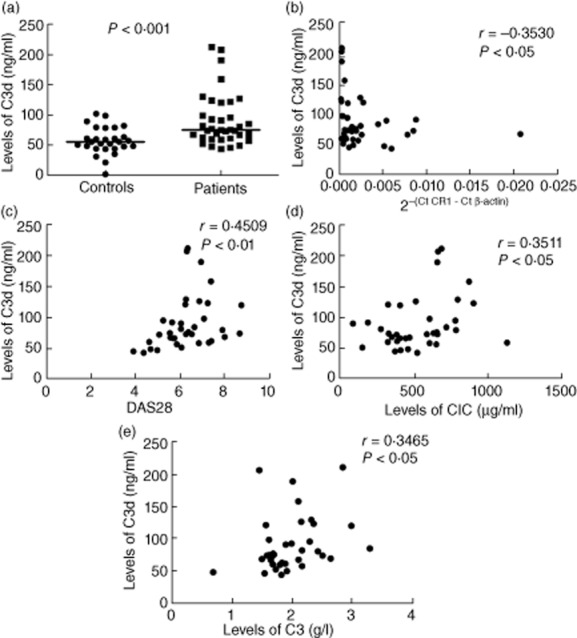
Levels of C3d and its correlation with L-CR1 transcript, disease activity score 28 (DAS28), levels of circulating immune complexes (CIC) and C3. Levels of C3d (a) were evaluated in controls (n = 28) and rheumatoid arthritis (RA) patients (n = 36). The P-value was assessed by unpaired t-test. Correlation of C3d with L-CR1 transcript (b), DAS28 (c), CIC (d) and C3 (e) in RA patients (n = 36). The coefficient of correlation (r) and P-value was calculated by Spearman's rho analysis and two-tailed test, respectively.
The L-CR1 transcript correlated significantly with levels of C3d (r = −0·3530, P < 0·05; Fig. 5b) in RA patients. DAS28 also correlated significantly with C3d (r = 0·4509, P < 0·01; Fig. 5c). In addition, levels of C3d correlated significantly with levels of CIC (r = 0·3511, P < 0·05; Fig. 5d) and C3 (r = 0·3465, P < 0·05; Fig. 5e) in RA patients.
The levels of C4 were found to be significantly higher in RA patients (0·4040) compared to controls (0·2960) (unpaired t-test, P < 0·0001; Fig. 6a). Levels of C4 ranged from 0·1190–0·6520 g/l in controls and 0·0770–0·9810 g/l in RA patients.
Figure 6.

Levels of C4 and its correlation with C3. Levels of C4 (a) were evaluated in controls (n = 66) and rheumatoid arthritis (RA) patients (n = 45). The horizontal bar represents the median value. The P-value was assessed by unpaired t-test. Correlation of C4 with C3 (b,c) in controls (n = 66) and RA patients (n = 45). The coefficient of correlation (r) and P-value was calculated by Spearman's rho analysis and two-tailed test, respectively.
No significant correlation of levels of C4 with L-CR1 transcript, DAS28 and CIC was observed. However, a significant positive correlation between C3 and C4 levels was observed in controls (r = 0·2804, P < 0·05; Fig. 6b) and RA patients (r = 0·3044, P < 0·05; Fig. 6c).
Levels of L-CR1 transcript in follow-up patients
Levels of DAS28 and L-CR1 transcript were determined at weeks (W) 0, 12 and 24 in 11 RA patients who volunteered for a follow-up.
In RA patients, levels of DAS28 were comparable between weeks 0 and 12 (P = 0·0524; Fig. 7a). Simultaneously, no significant difference was observed in the levels of CR1 transcript in patients at weeks 0 and 12 time-points (P = 0·1748; Fig. 7b).
Figure 7.
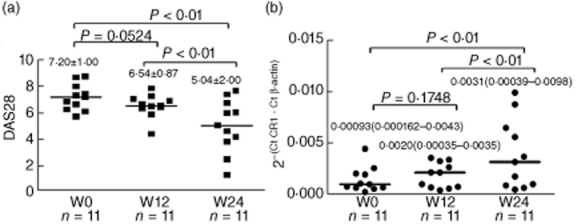
Levels of disease activity score 28 (DAS28) and L-CR1 transcript in follow-up patients (n = 11). The bar within each group represents the mean (a)/median (b) value. The P-values were derived by paired t-test (a)/ Wilcoxon's signed-rank test (b). The values are indicated as mean ± standard deviation (s.d.) (a)/ median (range) (b).
The levels of DAS28 decreased significantly at week 24 compared to that in week 0 (5·04 ± 2·00 versus 7·20 ± 1·00, P < 0·01) and week 12 (5·04 ± 2·00 versus 6·54 ± 0·87, P < 0·01), as shown in Fig. 7a. Simultaneously, the levels of CR1 transcript increased significantly at week 24 compared to week 0 (median 0·0031 versus 0·00093, P < 0·01) and week 12 (median 0·0031 versus 0·0020, P < 0·01), as shown in Fig. 7b.
In summary, the DAS28 scores in patients declined gradually from weeks 0, 12 and 24 time-points and the levels of CR1 transcript increased simultaneously at the same time-points (Fig. 7a,b).
Discussion
The complement system contributes significantly to the pathogenesis of RA and other autoimmune diseases [11,12]. Under normal physiological conditions, tissues in the body are protected from complement-mediated damage by expression of multiple complement regulatory proteins that co-operate to inhibit complement activation on self-tissues [13]. However, in pathological conditions such as RA, exaggerated activation of the complement system is observed. Increased levels of complement activation products have been found in the plasma of RA patients, correlating with disease activity [14]. In the patients' synovial fluid, decreased levels of native complement components and increased levels of activation products have been detected [11]. Furthermore, deposition of activated complement components has been demonstrated in synovial tissue [12]. Various studies on animal models of autoimmune diseases have demonstrated that membrane-bound complement regulatory proteins may critically determine the sensitivity of the host tissues to complement injury in autoimmune and inflammatory disorders [3]. Henceforth, the role of complement regulatory proteins in RA was envisaged.
CR1 is an extensively studied complement regulatory protein in relation to autoimmune disorders. It exerts decay-accelerating activity for C3/C5 convertase and is a co-factor for the serine protease factor I that mediates degradation of C3b and C4b [4]. Apart from the regulation of complement cascade, recent studies also suggest the role of CR1 in the aetiopathogenesis of autoimmune disorders as a regulator of B cell responses [5]. However, in RA, most of the previous studies pertaining to CR1 expression have been restricted to erythrocytes [6,7]. This is attributed to the fact that E-CR1 had been known to serve as the key vehicle for the clearance of immune complexes [4]. One study has shown decreased E-CR1 expression which correlated inversely with the disease activity of RA patients [9]. A few reports have also documented the decline of CR1 expression on B cells and neutrophils but an increase in expression on monocytes in RA patients [15–17]. None of those studies attempted to elucidate the relationship of CR1 transcript with the disease activity of RA patients.
In addition to membrane-bound CR1, soluble recombinant CR1 (sCR1), comprising the extracellular portion of the protein, is a potent inhibitor of the classical and alternative complement pathways. Human sCR1 were reported earlier to reduce acute inflammation and autoimmunity. Soluble CR1 was found to prevent the progression of disease in rat arthritis models, such as mono-articular arthritis, collagen-induced arthritis (CIA) and tumour necrosis factor (TNF)-α and anti-CD59-induced arthritis [18]. In addition, CR1/2-deficient female, but not male, mice were found to be more susceptible to low-dose CIA [19]. With information obtained from these studies on CR1, its close relation with disease activity of RA was envisioned.
Hence, the present case–control study aimed to evaluate the transcript levels of CR1 in peripheral blood leucocytes and to elucidate its relationship with the clinical disease activity of RA patients. We analysed our results by taking all the patients in one group, rather than categorizing them into subgroups, because patients enrolled into our study group showed extremely heterogeneous clinical manifestations.
We found significantly lower transcript levels of L-CR1 in RA patients compared to controls. For the purpose of correlating L-CR1 expression with disease activity, DAS28 was used as the disease activity index. The original DAS is based on the Ritchie articular index (RAI) and 44-swollen joint count and employs a complex formula, using square-root and logarithmic transformation of variables and different weights for each variable [20,21]. This was later modified to include the widely used reduced 28-joint count, DAS28, which shows similar validity and reliability compared to DAS [22]. RA patients' DAS28 scores correlated significantly negatively with their L-CR1 transcript levels. This observation suggested a relationship of L-CR1 transcript levels with the pathophysiology of RA.
Surface expression of CR1 declined in all the leucocyte populations, i.e. lymphocytes, monocytes and neutrophils in patients compared to controls (flow cytometry data not shown). The most acceptable mechanism for decline in cell surface CR1 in diseases such as glomerulonephritis and SLE has been enhanced proteolytic cleavage from the cell surface [23,24]. Arora et al. [8] suggested that reduced transcript levels of L-CR1 in SLE might contribute to the decline in the levels of cell surface CR1 in the disease.
To the best of our knowledge, this is the first study reporting decreased levels of the L-CR1 transcript as one of the mechanisms responsible for the altered expression of L-CR1 and its relationship with the disease activity in RA patients.
Immune complex overload and accumulation of high levels of complement-degraded products are the hallmarks of RA [25]. Therefore, a question was raised as to whether there was any correlation of L-CR1 transcript levels with levels of CIC, C3, C3d and C4. We obtained significantly higher levels of CIC, C3, C3d and C4 in RA patients.
L-CR1 transcript levels correlated significantly negatively with the levels of CIC in RA patients, which suggests an important role of L-CR1 in immune complex clearance in addition to that cleared by E-CR1. Levels of CIC correlated positively with DAS28. This could be explained due to the ability of CIC to fix the complement classical pathway, thus leading to tissue injury.
We also found that levels of C3 were higher in patients compared to controls. This observation is consistent with several previous publications [14,26,27]. Levels of C3 can be determined by a number of factors, which include rate of synthesis, rate of consumption and compensatory increase in its synthesis due to inflammation [28]. Hence, the measure of levels of C3 may not always indicate levels of consumption. Increased mannose-binding lectin (MBL) levels have also been described in the serum of RA patients [29]. To gain a clearer picture, we determined the levels of C3d and found significantly higher levels in RA patients. Higher levels of C3d have been reported previously in RA patients [14,26,27]. Furthermore, levels of C3 and C3d correlated significantly positively with each other.
No significant correlation between L-CR1 transcript levels and levels of C3 was observed. This may be due to the differences between the rate of synthesis of C3 and its consumption in the inflammatory milieu of RA. However, confirmation of this notion is beyond the scope of the present investigation.
L-CR1 transcript levels correlated significantly negatively with the levels of C3d in RA patients. Increased levels of complement activation product C3d and decreased levels of cell surface CR1 had also been reported in SLE [30,31]. These observations are difficult to explain, as a decline in the levels of CR1 should accompany a decline in its co-factor activity. A significant positive correlation of levels of C3 and C3d with DAS28 was also obtained. Similar findings have been documented previously [14]. Levels of C3 and C3d correlated positively with the levels of CIC in RA patients.
Based on our results, we hypothesize that a decline in L-CR1 transcript levels may lead to excessive complement cascade activation resulting in higher production of C3d, which is a product of activation of C3. In addition to this, impaired phagocyte-CR1-mediated immune complex clearance may cause immune complex overload, which may propagate a vicious cycle. Verma et al. also reported a significant negative correlation of L-CR1 transcript levels with levels of CIC in SLE patients [24].
In addition to C3, C4 is also utilized during the formation of C3 convertase by the classical or lectin pathway of complement activation and, hence, levels of C4 were quantified in patients and controls. Levels of C4 were significantly higher in RA patients. Similar findings have been reported previously [14]. The L-CR1 transcript did not correlate with levels of C4. Although, previously, a correlation of C4 with disease activity has been reported, we did not find any correlation between the two [14]. Because C4 is also an acute-phase protein, this increase may be a non-specific acute-phase response triggered by inflammation [32]. We also observed that levels of C4 and C3 correlated positively with each other in both controls and patients.
To confirm the relationship of L-CR1 with disease activity in RA, we followed-up the levels of L-CR1 transcript and DAS28 in 11 patients at different time-points.
The study revealed a statistically significant increase in the levels of L-CR1 transcript, with a simultaneous decline in the levels of DAS28 at weeks 12 and 24. One of the previous studies showed that the levels of erythrocyte CR1 declined in the active stages of rheumatoid arthritis and increased significantly in patients who entered remission [33].
To the best of our knowledge, this is the first study to elucidate the relationship of the L-CR1 transcript with the disease activity of RA patients. In SLE patients, Arora et al. [9] suggested that an increase in the levels of L-CR1 was related to a good prognosis.
In conclusion, ours is the first comprehensive study to elucidate the status of the L-CR1 transcript and its relationship with the clinical disease activity and prognosis of RA patients.
The findings of this study also emphasize the role of circulating components of vascular compartments in the pathophysiology of RA, thus challenging the idea of inflammation arising solely via extravasation of leucocytes and the local production of complement component in extravascular compartments. However, an elaborate study elucidating the relations between these vascular and extravascular mechanisms would be more conclusive.
We also found that levels of CIC, C3 and C3d correlated positively with DAS28. A detailed investigation to comment conclusively on the role of CIC, C3 and C3d as potential markers in the diagnosis, prognosis and risk assessment of RA patients is warranted.
Acknowledgments
We are thankful to all the volunteers of the patient and control groups for their participation in the study. We also acknowledge Dr. Parthaprasad Chattopadhyay for his valuable suggestions in this study. Funding from the University Grant Commission and Council of Scientific and Industrial Research is gratefully acknowledged.
Disclosures
The authors declare that there are no conflicts of interest.
Supporting information
Additional Supporting information may be found in the online version of this article at the publisher's web-site:
Agarose gel electrophoresis of real-time polymerase chain reaction (PCR) products of β-actin and CR1. B = blank; M = DNA marker.
References
- 1.Cole DS, Morgan BP. Beyond lysis: how complement influences cell fate. Clin Sci. 2003;104:455–466. doi: 10.1042/CS20020362. [DOI] [PubMed] [Google Scholar]
- 2.Zipfel PF, Skerka C. Complement regulators and inhibitory proteins. Nat Rev Immunol. 2009;9:729–740. doi: 10.1038/nri2620. [DOI] [PubMed] [Google Scholar]
- 3.Song WC. Complement regulatory proteins and autoimmunity. Autoimmunity. 2006;39:403–410. doi: 10.1080/08916930600739647. [DOI] [PubMed] [Google Scholar]
- 4.Khera R, Das N. Complement receptor 1: disease associations and therapeutic implications. Mol Immunol. 2009;46:761–772. doi: 10.1016/j.molimm.2008.09.026. [DOI] [PMC free article] [PubMed] [Google Scholar]
- 5.Erdei A, Isaák A, Török K, et al. Expression and role of CR1 and CR2 on B and T lymphocytes under physiological and autoimmune conditions. Mol Immunol. 2009;46:2767–2773. doi: 10.1016/j.molimm.2009.05.181. [DOI] [PubMed] [Google Scholar]
- 6.Corvetta A, Pomponio G, Bencivenga R, et al. Low number of complement C3b/C4b receptors (CR1) on erythrocytes from patients with essential mixed cryoglobulinemia, systemic lupus erythematosus and rheumatoid arthritis: relationship with disease activity, anticardiolipin antibodies, complement activation and therapy. J Rheumatol. 1991;18:1021–1025. [PubMed] [Google Scholar]
- 7.Kumar A, Malaviya AN, Srivastava LM. Lowered expression of C3b receptor (CR1) on erythrocytes of rheumatoid arthritis patients. Immunobiology. 1994;191:9–20. doi: 10.1016/S0171-2985(11)80264-0. [DOI] [PubMed] [Google Scholar]
- 8.Arora V, Verma J, Dutta R, et al. Reduced complement receptor 1 (CR1, CR1) transcription in systemic lupus erythematosus. Mol Immunol. 2004;41:449–456. doi: 10.1016/j.molimm.2004.03.004. [DOI] [PubMed] [Google Scholar]
- 9.Arora V, Grover R, Kumar A, Anand D, Das N. Relationship of leucocyte complement receptor 1 transcript and protein with the pathophysiology and prognosis of systemic lupus erythematosus: a follow up study. Lupus. 2011;20:1010–1018. doi: 10.1177/0961203311400112. [DOI] [PubMed] [Google Scholar]
- 10.Sai Baba KSS, Moudgil KD, Jain RC, Srivastava LM. Complement activation in pulmonary tuberculosis. Tubercle. 1990;71:103–107. doi: 10.1016/0041-3879(90)90004-r. [DOI] [PubMed] [Google Scholar]
- 11.Solomon S, Kassahn D, Illges H. The role of the complement and the Fc gamma R system in the pathogenesis of arthritis. Arthritis Res Ther. 2005;7:129–135. doi: 10.1186/ar1761. [DOI] [PMC free article] [PubMed] [Google Scholar]
- 12.Williams AS, Mizuno M, Richards PJ, Holt DS, Morgan BP. Deletion of the gene encoding CD59a in mice increases disease severity in a murine model of rheumatoid arthritis. Arthritis Rheum. 2004;50:3035–3044. doi: 10.1002/art.20478. [DOI] [PubMed] [Google Scholar]
- 13.Piccoli AK, Alegretti AP, Schneider L, Lora PS, Xavier RM. Expression of complement regulatory proteins CD55, CD59, CD35, and CD46 in rheumatoid arthritis. Rev Bras Reumatol. 2011;51:497–510. [PubMed] [Google Scholar]
- 14.Makinde VA, Senaldi G, Jawad AS, Berry H, Vergani D. Reflection of disease activity in rheumatoid arthritis by indices of activation of the classical complement pathway. Ann Rheum Dis. 1989;48:302–306. doi: 10.1136/ard.48.4.302. [DOI] [PMC free article] [PubMed] [Google Scholar]
- 15.Prokopec KE, Rhodiner M, Matt P, Lindqvist U, Kleinau S. Downregulation of Fc and complement receptors on B cells in rheumatoid arthritis. Clin Immunol. 2010;137:322–329. doi: 10.1016/j.clim.2010.08.006. [DOI] [PubMed] [Google Scholar]
- 16.Jones J, Laffafian I, Cooper AM, Williams BD, Morgan BP. Expression of complement regulatory molecules and other surface markers on neutrophils from synovial fluid and blood of patients with rheumatoid arthritis. Br J Rheumatol. 1994;33:707–712. doi: 10.1093/rheumatology/33.8.707. [DOI] [PubMed] [Google Scholar]
- 17.Hepburn AL, Mason JC, Davies KA. Expression of Fc gamma and complement receptors on peripheral blood monocytes in systemic lupus erythematosus and rheumatoid arthritis. Rheumatology. 2004;43:547–554. doi: 10.1093/rheumatology/keh112. [DOI] [PubMed] [Google Scholar]
- 18.Dreja H, Annenkov A, Chernajovsky Y. Soluble complement receptor 1 (CD35) delivered by retrovirally infected syngeneic cells or by naked DNA injection prevents the progression of collagen-induced arthritis. Arthritis Rheum. 2000;43:1698–1709. doi: 10.1002/1529-0131(200008)43:8<1698::AID-ANR5>3.0.CO;2-8. [DOI] [PubMed] [Google Scholar]
- 19.Nilsson KE, Andrén M, Diaz de Ståhl T, Kleinau S. Enhanced susceptibility to low-dose collagen-induced arthritis in CR1/2-deficient female mice – possible role of estrogen on CR1 expression. FASEB J. 2009;23:2450–2458. doi: 10.1096/fj.08-125849. [DOI] [PubMed] [Google Scholar]
- 20.van der Heijde DM, van't Hof MA, van Riel PL, et al. Judging disease activity in clinical practice in rheumatoid arthritis: first step in the development of a disease activity score. Ann Rheum Dis. 1990;49:916–920. doi: 10.1136/ard.49.11.916. [DOI] [PMC free article] [PubMed] [Google Scholar]
- 21.van der Heijde DM, van't Hof M, van Riel PL, van de Putte LB. Development of a disease activity score based on judgment in clinical practice by rheumatologists. J Rheumatol. 1993;20:579–581. [PubMed] [Google Scholar]
- 22.Smolen JS, Breedveld FC, Eberl G, et al. Validity and reliability of the twenty-eight-joint count for the assessment of rheumatoid arthritis activity. Arthritis Rheum. 1995;38:38–43. doi: 10.1002/art.1780380106. [DOI] [PubMed] [Google Scholar]
- 23.Teixeira JE, Costa RS, Lachmann PJ, Würzner R, Barbosa JE. CR1 stump peptide and terminal complement complexes are found in the glomeruli of lupus nephritis patients. Clin Exp Immunol. 1996;105:497–503. doi: 10.1046/j.1365-2249.1996.d01-776.x. [DOI] [PMC free article] [PubMed] [Google Scholar]
- 24.Verma J, Arora V, Marwaha V, Kumar A, Das N. Association of leukocyte CR1 gene transcription with the disease severity and renal involvement in systemic lupus erythematosus. Lupus. 2005;14:273–279. doi: 10.1191/0961203305lu2074oa. [DOI] [PubMed] [Google Scholar]
- 25.Katyal M,, Sivasankar B,, Das N . Complement receptor 1 in autoimmune disorders. Curr Sci. 2001;81:907–914. [Google Scholar]
- 26.Nydegger UE, Zubler RH, Gabay R, et al. Circulating complement breakdown products in patients with rheumatoid arthritis. Correlation between plasma C3d, circulating immune complexes, and clinical activity. J Clin Invest. 1977;59:862–868. doi: 10.1172/JCI108708. [DOI] [PMC free article] [PubMed] [Google Scholar]
- 27.Swaak AJ, Han H, van Rooyen A, Pillay M, Hack CE. Complement (C3) metabolism in rheumatoid arthritis in relation to the disease course. Rheumatol Int. 1988;8:61–65. doi: 10.1007/BF00271836. [DOI] [PubMed] [Google Scholar]
- 28.Biswas B, Kumar U, Das N. Expression and significance of leukocyte membrane cofactor protein transcript in systemic lupus erythematosus. Lupus. 2012;21:517–525. doi: 10.1177/0961203311434104. [DOI] [PubMed] [Google Scholar]
- 29.Saevarsdottir S, Steinsson K, Grondal G, Valdimarsson H. Patients with rheumatoid arthritis have higher levels of mannan-binding lectin than their first-degree relatives and unrelated controls. J Rheumatol. 2007;34:1692–1695. [PubMed] [Google Scholar]
- 30.Morrow WJ, Williams DJ, Ferec C, et al. The use of C3d as a means of monitoring clinical activity in systemic lupus erythematosus and rheumatoid arthritis. Ann Rheum Dis. 1983;42:668–671. doi: 10.1136/ard.42.6.668. [DOI] [PMC free article] [PubMed] [Google Scholar]
- 31.Arora V, Mondal AM, Grover R, Kumar A, Chattopadhyay P, Das N. Modulation of CR1 transcript in systemic lupus erythematosus (SLE) by IFN-gamma and immune complex. Mol Immunol. 2007;44:1722–1728. doi: 10.1016/j.molimm.2006.07.300. [DOI] [PubMed] [Google Scholar]
- 32.Gabay C, Kushner I. Acute-phase proteins and other systemic responses to inflammation. N Engl J Med. 1999;340:448–454. doi: 10.1056/NEJM199902113400607. [DOI] [PubMed] [Google Scholar]
- 33.Kumar A, Malaviya AN, Sinha S, Khandekar PS, Banerjee K, Srivastava LM. C3b receptor (CR1) genomic polymorphism in rheumatoid arthritis. Low receptor levels on erythrocytes are an acquired phenomenon. Immunol Res. 1994;13:61–71. doi: 10.1007/BF02918226. [DOI] [PubMed] [Google Scholar]
Associated Data
This section collects any data citations, data availability statements, or supplementary materials included in this article.
Supplementary Materials
Agarose gel electrophoresis of real-time polymerase chain reaction (PCR) products of β-actin and CR1. B = blank; M = DNA marker.


