

Abstract
The mechanisms sustaining the absence of complete immune recovery in HIV-infected patients upon long-term effective highly active anti-retroviral therapy (HAART) remain elusive. Immune activation, regulatory T cells (Tregs) or very low-level viraemia (VLLV) have been alternatively suspected, but rarely investigated simultaneously. We performed a cross-sectional study in HIV-infected aviraemic subjects (mean duration of HAART: 12 years) to concomitantly assess parameters associated independently with inadequate immunological response. Patients were classified as complete immunological responders (cIR, n = 48) and inadequate immunological responders (iIR, n = 39), depending on the CD4+ T cell count (> or < 500/mm3). Clinical and virological data (including very low-level viraemia) were collected. In parallel, immunophenotyping of CD4+ lymphocytes, including Treg subsets, and CD8+ T cells was performed. Percentages of activated CD4+ T cells, Tregs, effector Tregs and terminal effector Tregs were found to be significantly elevated in iIR. Neither the percentage of activated CD8+ T cells nor VLLV were found to be associated with iIR. In the multivariate analysis, nadir of CD4+ T cell count and percentage of Tregs were the only two parameters associated independently with iIR [odds ratio (OR) = 2·339, P = 0·001, and OR = 0·803, P = 0·041]. We present here the largest study investigating simultaneously the immune response to long-term HAART, activation of CD4+ and CD8+ T cells, Treg percentages and very low-level viraemia. Causative interactions between Tregs and CD4+ T cells should now be explored prospectively in a large patients cohort.
Keywords: HAART, immune activation, immunological response, regulatory T cells, very low-level viraemia
Introduction
It has been repeatedly described that approximately 5–30% of highly active anti-retroviral therapy (HAART)-treated patients fail to significantly improve their CD4+ T cell numbers upon effective therapy after obtaining virological success [1–3]. Importantly, this incomplete immune recovery, also called inadequate immunological response [4] (iIR), is associated with increased morbidity and mortality [2,3,5–7]. In contrast, patients with a complete immunological response (i.e. a CD4+ T cell count above 500 cells/mm3) might present with the same mortality rate as the general population [6,7]. The mechanisms sustaining this inadequate immune recovery in patients with virological success remain elusive.
Many factors have been suspected (reviewed in [4]). Of these, immune cell activation is a hallmark of untreated HIV infection, and a strong prognostic factor of disease severity and progression [8]. In some patients, this phenomenon may persist despite, sustained anti-retroviral therapy and virological suppression [9]. Previous studies have shown higher immune activation (in particular increased percentages of CD8+CD38+ T cells) in iIR patients compared with patients with an appropriate immune recovery [10–13]. However, these results have been challenged recently [10,14,15].
In addition, among patients with virological success, some present with persistent very low-level viraemia (VLLV) that can still be detected although not quantified (i.e. when routine viral load (VL) is found between quantitation limit and detection limit) [16]. This also represents one of the suspected causes of virological failure [17,18], immunological suboptimal gain [18] or persistent immune activation [19], but this is also currently debated [20–22].
Finally, regulatory T cells (Tregs) are considered as key regulators of the immune system, in particular during chronic viral infections [23–25]. However, their role in HIV aviraemic patients is still poorly understood. They may control CD4+ T cell homeostasis and immune activation or specifically regulate the cellular immune response [26]. Recently, some authors postulated that they might play a role in iIR [14,27]. However, this subject is also currently the matter of intense debates [14,28–35]. Moreover, during HIV infection, the circulating proportion of effector Tregs and terminal effector Tregs, as described recently by Sakaguchi et al. [36], and interaction between Tregs and VLLV are not clearly established.
Overall, relationships between these above different parameters and immune response to long-term HAART have not been investigated simultaneously within a single study. Therefore, to obtain further insights into immunological disturbances observed in iIR upon effective long-term HAART, we conducted a cross-sectional study, concomitantly assessing circulating CD4+ T cell count, CD4+ and CD8+ T cell immune activation, percentages and subsets of Tregs and VLLV.
Materials and methods
Study population
We performed a cross-sectional study in a French cohort of HIV-infected subjects, located at the Croix Rousse Hospital (Hospices Civils de Lyon, Lyon, France). During 12 days, every HIV-1 infected asymptomatic patient on suppressive HAART for at least 1 year (virological success, VL < 50 copies/ml) was considered for inclusion. Patients were not included if routine biological analysis (i.e. VL measurement, CD3+, CD4+ and CD8+ T cells counts) were not performed on the same day as complementary flow cytometry staining included in this study, or if HIV RNA value was above 50 copies/ml. Patients with onco-haematological diseases, cancer, with history of chemotherapy or with clinical evidence of acute infectious disease were not included. Written informed consent was obtained from every subject and local Ethical Committee approval was received for the study.
Evaluation criteria
Patients with at least 500 CD4+ T cells/mm3 were classified as complete immunological responders (cIR group), whereas remaining patients constituted the inadequate immunological responder group (iIR group). A current VL (i) detected the day of inclusion between one and 39 copies/ml (i.e. below the quantitation limit) or (ii) quantified between 40 and 49 copies/ml was considered as VLLV. Indeed, using routine virological techniques, the detection of HIV RNA is still possible under the threshold of quantitation (i.e. one to 39 copies/ml) [37]. Patients with a confirmed VL above 50 copies/ml were excluded, as described previously.
Routine laboratory assessments
The absolute count of CD4+ and CD8+ T cells in fresh peripheral ethylenediamine teraacetic acid (EDTA)-anti-coagulated blood were measured on a NAVIOS flow cytometer using NAVIOS software (Beckman Coulter, Brea, CA, USA). VL were determined after extraction of 0·6 ml plasma using the Abbott Real Time HIV-1 assay under the dedicated m2000rt version 4·0 m2000rt software package (quantitation limit 40 HIV RNA copies/ml, detection limit one copy/ml).
Cellular immunophenotyping
Fresh EDTA-anti-coagulated whole blood samples were used to perform complementary cellular immunophenotyping of CD4+ and CD8+ T cells subtypes, including Tregs. We developed an eight-colour flow cytometry protocol, including intracellular forkhead box protein 3 (FoxP3) staining (CD4/CD8/CD45RA/human leucocyte antigen D-related (HLA-DR)/CD38/CD25/CD127/FoxP3). Treg cells were characterized based on the CD4+CD25highFoxP3+ phenotype. Effector Tregs and terminal effectors Tregs were defined, respectively, as CD4+CD25highFoxP3+CD45RA– and CD4+CD25highFoxP3+CD45RA–HLA-DR+ phenotypes [36]. Activated T cells were identified using (i) increased HLA-DR expression for CD4+ T cells and (ii) increased expressions of HLA-DR, CD38 or both (HLA-DR+CD38+ cells) for CD8+ T cells. The PerFix-no centrifuge assay kit from Beckman Coulter (Marseille, France) was used, as described previously [38]. Stainings were performed using anti-CD4-Pacific blue (PB), anti-CD8-AlexaFluor 750 (AF750), anti-CD45RA– fluorescein isothiocyanate (FITC), anti-HLA-DR-krome orange (KO), anti-CD38–phycoerythrin-cyanin 5·5 (PE-Cy5·5), anti-CD25-PE and anti-CD127 (PC7), all from Beckman Coulter, and anti-FoxP3-Alexa Fluor647 (AF647) antibodies (clone 259D) were purchased from BioLegend (San Diego, CA, USA). Gating strategy is presented in Supporting information, Fig. S1.
Statistical analysis
Continuous variables were described using mean and standard deviation or median and interquartile values; categorical variables were described with number and percentage. Normality of continuous variables was assessed using the Kolmogorov–Smirnov test; then t-tests, or Mann–Whitney U-tests when appropriate, were performed for continuous variables. Exact Fisher tests for categorical variables were performed. Correlations were studied using the Pearson's or Spearman's correlation coefficient tests, when appropriate. To assess predictors of immunological responses to HAART, univariate logistic regressions were first performed, and variables presenting with P-values < 0·15 were introduced in multivariate logistic regression models. Results were expressed as odds ratios (OR) and their 95% confidence intervals (CI). P-values were considered significant when lower than 0·05. Statistical analyses were performed using spss software (version 17·0; SPSS, Inc., Chicago, IL, USA).
Results
Study population and factors associated with immunological response
Eighty-seven patients (men = 62, women = 25) were included into the study. Among them, 48 were classified as cIR and 39 as iIR. Epidemiological, virological and immunological characteristics of this cohort are reported in Table 1. There were 14 men who have sex with men in the iIR group, and 18 in the cIR group (P = 0·836). Only two patients were intravenous drug users, and were in the cIR group. Five patients in each group were infected with hepatitis C and/or B viruses (P = 0·748). Boosted-protease inhibitor-based regimens were the most prescribed regimens (n = 44), whereas 30 patients were on non-nucleoside reverse transcriptase inhibitor-based regimens (14 in the cIR group versus 16 in the iIR group, P > 0·05). Twenty-four patients had an integrase inhibitor (raltegravir) in their therapeutic combination, and two patients had an entry inhibitor (maraviroc).
Table 1.
Epidemiological, virological and immunological data of the 87 study participants, stratified according to the immunological response to highly active anti-retroviral therapy (HAART).
| Parameter | cIR group (n = 48) | Lower limit | Upper limit | iIR group (n = 39) | Lower limit | Upper limit | P | Test |
|---|---|---|---|---|---|---|---|---|
| Age (years) (mean, s.d.) | 50·6 (10·8) | 25·7 | 77·8 | 55·9 (10·6) | 35·6 | 77·8 | 0·027 | † |
| Male sex (n, %) | 34 (70) | 28 (64) | n.s. | ‡ | ||||
| CDC stage C (n, %) | 7 (15) | 21 (54) | 0·012 | ‡ | ||||
| Time on HAART (years) (mean, s.d.) | 12·3 (5·3) | 1·48 | 23·47 | 12·1 (5·4) | 2·9 | 21·1 | n.s. | † |
| Time since virological success (years) (mean, s.d.) | 7·4 (3·3) | 1·02 | 15·7 | 7·1 (4·2) | 1·5 | 15·6 | n.s. | † |
| Nadir CD4+ T cells/mm3 (mean, s.d.) | 256 (169) | 1 | 686 | 102 (82) | 0 | 272 | <0·001 | † |
| Zenith viral load, log10 copies/ml (mean, s.d.) | 4·7 (0·9) | 1·7 | 6·3 | 4·9 (0·9) | 2·08 | 6·2 | n.s. | † |
| Patients with very low-level viraemia in the current sample (n, %) | 8 (17) | 7 (18) | n.s. | ‡ | ||||
| CD4+ T cell count, cells/mm3 (median, IQR) | 644 (586–796) | 500 | 1838 | 398 (326–459) | 139 | 495 | <0·001 | § |
| CD4+ T cell percentage (mean, s.d.) | 37 (9) | 20 | 61 | 28 (8) | 12 | 44 | <0·001 | † |
| Treg cell percentage (mean, s.d.) | 7 (2) | 3 | 13·2 | 9 (3) | 3·4 | 22 | 0·022 | † |
| CD8+ T cell count, cells/mm3 (mean, s.d.) | 730 (325) | 174 | 1735 | 636 (313) | 129 | 1527 | n.s. | † |
| CD8+ T cell percentage (mean, s.d.) | 44 (14) | 26 | 80 | 45 (12) | 18 | 69 | n.s. | † |
| CD8+HLA-DR+ T cell percentage (mean, s.d.) | 11·6 (6) | 3·1 | 30·5 | 10·4 (5) | 2·5 | 24·8 | n.s. | † |
| CD8+CD38+ T cell percentage (mean, s.d.) | 13·5 (8) | 3·5 | 43·6 | 16·3 (9) | 3 | 35·1 | 0·146 | † |
| CD8+CD38+HLA-DR+ T cell percentage (mean, s.d.) | 4 (3) | 0·8 | 15 | 4 (3) | 0·6 | 11·9 | n.s. | † |
Statistical tests used:
Student's t-test
Fisher's exact test
Mann–Whitney U-test. % = percentage; cIR = complete immunological responder; iIR = inadequate immunological responder; INR = International normalized ratio; IQR = interquartile range; s.d. = standard deviation; HLA-DR = human leucocyte antigen D-related; Treg = regulatory T cell; n.s. = not significant.
The Treg percentage was increased in iIR compared to cIR patients (mean: 9 versus 7%, respectively, P = 0·022, Fig. 1a). In line with this, there was a negative correlation between CD4+ T cell absolute value and Treg percentage (P = 0·013, r = −0·267, Fig. 1b). There was no difference between groups when considering parameters associated with CD8+ T cell activation: (i) CD8+ T cells (count, percentage); (ii) CD8+HLADR+ T cell percentages; or (iii) CD8+CD38+HLADR+ T cell percentages (although a trend for increased CD8+CD38+ T cell percentages in iIR was observed) (Table 1). Neither zenith VL nor VLLV in the current blood sample were associated with the immunological response to HAART (Table 1).
Figure 1.
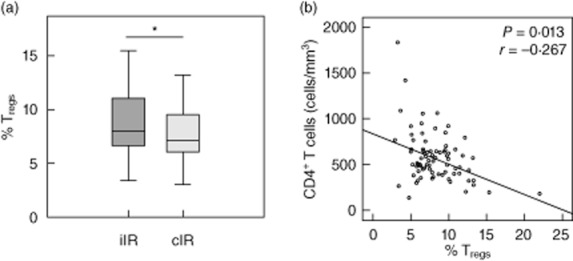
Regulatory T cell (Treg) percentages. (a) Treg percentages in inadequate immunological responder (iIR, n = 39) and complete immunological responder (cIR, n = 48) groups. (b) Association between Treg percentages and CD4+ T cells for the 87 studied patients [*P < 0·05 Student's t-test and Spearman's correlation test for (a) and (b), respectively].
Association between CD4+ T cell subsets, Treg subsets and immunological response to HAART
As neither CD8+ T cells subsets nor VLLV were associated with the immune response to HAART, we then focused upon interactions between Tregs and CD4+ T cell subsets. We observed a significant increase in every Treg subsets in iIR compared with cIR (Table 2). In line with this, activated CD4+ T cell and activated conventional effector CD4+ T cell (i.e. FoxP3–) percentages were increased significantly in the iIR group (Table 2). As shown in Fig. 2, in the whole population there was a significant negative correlation between CD4+ T cell counts and activated CD4+ T cell percentages (CD4+HLADR+ T cells, r = −0·212, P = 0·049).
Table 2.
Descriptive analysis of CD4+ T cells and regulatory T cell (Treg) subsets according to the immune response to highly active anti-retroviral therapy (HAART) (n = 87). Total activated CD4+ T cells: CD4+ human leucocyte antigen D-related (HLA-DR)+ T cells; Tregs CD4+CD25+forkhead box protein 3 (FoxP3)+ T cells; effector Tregs: CD4+CD25+FoxP3+CD45RA− T cells; terminal effector Tregs: CD4+CD25+FoxP3+CD45RA− HLA-DR+ T cells; effector (non-Tregs) CD4+ T cells: CD4+FoxP3−HLA-DR+ T cells; activated effector CD4+ T cells: CD4+FoxP3−HLA-DR+ T cells.
| Paramater | cIR group (n = 48) | iIR group (n = 39) | P | Test |
|---|---|---|---|---|
| CD4+ T cells | ||||
| CD4 T cell count, cells/mm3 (median, IQR) | 644 (586–796) | 398 (326–459) | <0·001 | ¶ |
| Total activated CD4 T cell percentage (mean, s.d.) | 4 (1·7) | 5·3 (3) | 0·014 | § |
| CD4+CD25+FoxP3+ Treg cells | ||||
| Treg cell percentage (mean, s.d.) | 7·5 (2·3) | 9 (3·5) | 0·022 | § |
| Effector Treg cell percentage (mean, s.d.) | 6·3 (2·3) | 8 (3·4) | 0·01 | § |
| Terminal effector Treg cell percentage (mean, s.d.) | 1·3 (0·8) | 1·8 (1·2) | 0·033 | § |
| Effector Treg cell percentage, among Treg cells (mean, s.d.)† | 84·6 (14·5) | 88·8 (6·8) | 0·099 | § |
| Terminal effector Treg cell percentage, among Treg cells (mean, s.d.)† | 20·7 (9·928) | 21·5 (8·8) | 0·692 | § |
| Terminal effector Treg cell percentage, among effector Treg cells (mean, s.d.)‡ | 20·8 (9·95) | 21·7 (8·9) | 0·660 | § |
| CD4+FoxP3− effector ‘non-Treg’ cells | ||||
| Effector T cells percentage (mean, s.d.) | 92·5 (2·3) | 91 (3·4) | 0·03 | § |
| Activated effector T cells percentage (mean, s.d.) | 2·6 (1·2) | 4·6 (3·8) | 0·001 | § |
Results are expressed as percentages of cells among CD4+ T cells, except for † and ‡. Statistical tests used:
Student's t-test
Mann–Whitney U-test. % = percentage; cIR = complete immunological responder; iIR = inadequate immunological responder; IQR = interquartile range; s.d. = standard deviation.
Figure 2.

Correlations between CD4+ T cell absolute count and activated CD4+ T cells (CD4+human leucocyte antigen D-related (HLA-DR)+) (Spearman's correlation test, n = 87 patients).
Parameters associated with immunological response to HAART
In the univariate logistic regression model, age, nadir of CD4+ T cell count, Tregs and CD8+CD38+ T cell percentages were found to be associated with IR to HAART with P < 0·15 (P = 0·029, P < 0·001, P = 0·024 and P = 0·14, respectively). This agrees with previous results. In particular, an increased age has been found by others to be associated with IR [39,40]. Thus, a multivariate model adjusted on age, nadir of CD4+ T cell count, Tregs and CD8+CD38+ T cell percentages was performed. Nadir of CD4+ T cell counts and Treg percentages were the only two parameters associated with immunological response to HAART (OR = 2·339, 95% CI = 1·442–3·793, P = 0·001, and OR = 0·803, 95% CI = 0·651–0·991, P = 0·041, respectively).
Association between Tregs and cellular immune activation
We next wanted to explore the association between Tregs, key regulatory cells of the immune system and immune activation of CD4+ and CD8+ T cells in the whole population (n = 87).
There were strong positive correlations between percentages of CD4+HLA-DR+ T cells and percentages of: (i) Tregs (r = 0·566, P < 0·001, Fig. 3a); (ii) effector Tregs; and (iii) terminal effector Tregs (r = 0·589, P < 0·001, r = 0·839, P < 0·001, respectively, data not shown). No correlations were observed between respective proportions of Tregs and activated CD8+ T cells, whatever the phenotype used to characterize the latter [i.e. CD8+CD38+ T cells (Fig. 3b), CD8+HLA-DR+ or CD8+CD38+HLA-DR+ T cells (Table S1)].
Figure 3.
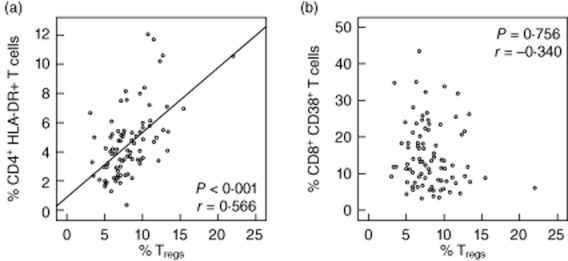
Correlations between regulatory T cells (Tregs) and immune activation. (a) Tregs and activated CD4+ T cells (CD4+human leucocyte antigen D-related (HLA-DR)+). (b) Tregs and activated CD8+ T cells (CD8+CD38+) (Pearson's correlation test, n = 87 patients).
Association between Tregs and VLLV
There were no differences in Treg percentages between patients with a VLLV on the current blood sample and patients with no detection of viral RNA (8·8 versus 8%, P = 0·38). Similarly, there were no differences when considering CD4+ T cell absolute values or immune activation of CD8+ or CD4+ T cells between these two groups.
Discussion
This observational cross-sectional study is probably the largest study on Tregs, T cell activation and VLLV in HIV-infected patients with virological success under long-term HAART (mean time: 12 years). Our main result highlights the importance of CD4+ T cell nadir and activation as well as Tregs in CD4+ recovery. The present report is of crucial interest in clinical practice, as the clinical characteristics of this cohort are representative of the majority of HIV-infected patients followed in western countries. In this population of aviraemic patients upon long-term HAART, the immunological discordant response is currently the most relevant clinical outcome and the most frequently encountered problem. Indeed, in iIR, increased mortality has been shown and neurological, cardiovascular and malignant pathologies are most frequently observed [4,6,7].
The main result is to observe that independent factors associated with an iIR to HAART were a lower nadir of CD4+ T cell count and a higher Treg percentage. Previous studies have highlighted relationships between a high percentage of Tregs, CD4+ T cell nadir and a poor immunological response to HAART [27,28,39,41,42]. In particular, Mendes-Lagares et al. have pointed out the role of Tregs in the control of naive CD4+ T cell homeostatic proliferation in 16 immunological non-responders, compared with 18 immunological responders [14]. In this study, in a multivariate analysis, we extend these results by showing the independent association of Tregs and CD4+ T cell nadir with iIR when including other immunological and viral parameters (i.e. activation status of T cells and VLLV) in a cohort of 87 HIV-infected patients under long-term HAART.
The CD4+ T cell count nadir is a well-known and well-validated predictor of immune response to HAART [41,43]. It is believed that an early diagnosis and suppression of HIV replication could increase the probability of achieving immunological response to HAART by limiting the magnitude of CD4+ T count nadir [44]. It may be speculated that the differences observed in Treg percentages between the two groups only reflect differences in CD4+ lymphocyte nadir. Indeed, the complex pattern of immune dysfunctions observed in patients with incomplete immune reconstitution could be a cause, but also the consequence, of low CD4+ cell counts [39]. However, in the current observational cross-sectional study, both Treg percentage and nadir of CD4+ T cells were independent predictors of immune response to long-term HAART. This indicates that they are both associated independently with iIR and are thus probably both actors in this clinical situation. This aspect deserves to be explored longitudinally.
The role of Tregs in HIV infection remains a matter of discussion [31,45,46]. Some recent studies highlighted the potential deleterious role of these cells in the case of suboptimal gain of CD4+ T cell counts [13,14,25,42]. Our results confirm that increased Treg frequency is an important factor associated with immunological discordant response to HAART. One explanation for previous discrepant results [32,47] might be the lack of a standardized protocol to assess Tregs and their related subsets in previous cohorts of patients. Indeed, as Tregs are identified precisely by flow cytometry using intracellular FoxP3 staining (the key transcriptional factor for Tregs [36]), until recently the technical difficulties (i.e. lengthy procedures) inherent in this intracellular staining were a limiting factor to the study of Tregs in clinical samples. Consequently, most published works were conducted in small cohorts and performed after cell cryopreservation/purification procedures known to modify cell activation status. That said, some phenotypes (such as CD4+CD25high or CD4+CD25highCD127low) are known to be good surrogate identification strategies for Treg identification [47]. However, the most widely accepted phenotype for Tregs is the co-expression of CD4, CD25 (α-chain of the IL-2 receptor), and of FoxP3, even in HIV-infected patients [14,36,38,39,48,49]. We took advantage of recent progresses in intracellular FoxP3 staining in whole blood to reduce pre-analytical procedures that may interfere with interpretation of the results [38]. Moreover, this protocol allows for the analysis of specific Treg subsets (e.g. effectors CD45RA– Tregs and terminal effector CD45RA–HLA-DR+ Tregs (reviewed in [36]). We observed that effector and terminal effector Tregs were increased significantly in iIR compared to cIR, which was never pointed elsewhere. Very few data are available concerning those Treg subsets in HIV-infected patients [39,50]. Effector Tregs have been studied in the peripheral blood mononuclear cells of 18 aviraemic patients with a good immunological response to HAART [50]. These results may indicate a specific role for Treg subsets in the control of CD4+ T cell homeostasis, but they need to be confirmed in vitro or in animal models in order to explore the chronological causative relationship between increased Tregs and the CD4+ T cell count nadir. Overall, the present results reinforce our understanding of the complex role of Treg subsets in immunological response to HAART and could lead to the development of novel therapeutic strategies targeting Treg populations [51,52].
Immune activation has also been implicated in the occurrence of iIR [10,27]. Interestingly, in the current study, CD8+ T cell immune activation was not associated with immune discordant response. Immune cell activation is a hallmark of HIV infection, especially when considering untreated viraemic patients [53]. Moreover, this immune activation is increased in HIV HAART-treated patients versus healthy control subjects [27]. However, the link between persistent activation of CD8+ T cells and immune response to HAART is unclear. Here, in agreement with other studies [10,14,15], we found that the CD8+CD38+ T cell percentage was higher in iIR than in cIR, but did not reach statistical significance (Table 1). In contrast, previous studies showed an elevated immune activation (increased percentages of CD8+CD38+ T cells) in iIR compared with HIV-infected patients with a better immunological recovery [10]. There are some explanations for such discrepancies. First, this lack of statistical significance could be due simply to a lack of statistical power (only a trend for a higher CD8+CD38+ T cell percentage in iIR, Table 1). Secondly, this could be associated with different definitions of the complete immune recovery between studies. Here, the threshold of 500 CD4+ T cells/mm3 was used because of its clinical significance [6,7]. It is probably an excellent criterion for the evaluation of immunological response in such populations with an important virological suppression time (more than 7 years, not different between the two groups). As an example, this criterion has been used by Piconi et al. [39], with a similar study design, mean virological suppression time and proportion of cIR and iIR as our study. Lastly, and most importantly, median HAART durations (before immunological exploration) were shorter in previous studies: 4 years [13], 3 years [54,55] and 12 months [10,55,56]. In contrast, our patients were on HAART for 12 years, with virological success for 7 years. This duration is similar to that of the study by Mendez-Lagares et al., which also failed to observe any statistical difference in CD8+CD38+ T cell percentages between in iIR and cIR patients (11·7 versus 9·5, respectively, P > 0·05) [15]. Thus, we cannot rule out the hypothesis that CD8+ T cell activation may be a prognostic factor for CD4+ T cell suboptimal gain despite virological suppression in the first years following HAART introduction. However, after several years on HAART, CD4+ T cell lineage characteristics appear to be the most important parameters of immune recovery.
Some authors have found associations between Tregs, VL and immune activation at different disease stages [34,57–60]. Thus, we wanted to assess relationships between Tregs, a key regulator of the immune system, and immune cellular activation of CD4+ and CD8+ T cells. Once more, interactions between Tregs and CD4+ T cells were highlighted. We observed a strong negative correlation between Tregs and immune activation of CD4+ T cells (i.e. CD4+HLA-DR+ T cells, CD4+HLA-DR+FoxP3– T cells), in agreement with the results of Del Pozo-Balado et al. (r = 0·685, P = 0·016) [32]. However, such interactions between Tregs and immune activation of CD8+ T cells were not significant, as reported previously, in aviraemic or viraemic subjects [15,32]. Of note, in this last study subsets of participants were co-infected with HCV, and it has been shown that distribution of Tregs is altered after HCV infection [61]. That said, the percentages of patients infected by HCV were not different between the two groups.
Finally, we wanted to assess the relationship between VLLV and Tregs in this long-term HAART virologically suppressed population. To our knowledge, this association has not been investigated elsewhere. It is well known that patients with virological success may retain a VLLV that can still be detected even using routine VL quantitation assay [37]. This VLLV has been proposed to be associated with an increased risk of virological failure [17], immune activation [19] or immunological failure [18], while other groups did not confirm such observations [21]. In agreement with our results, Ostrowski et al. did not find any association between VLLV and CD8+ T cells activation [22]. Importantly, we report here no apparent association between any Treg subsets and VLLV. However, this needs to be confirmed in a larger cohort, especially in a longitudinal study, to exclude a potential lack of statistical power.
Conclusion
We present here the largest study investigating simultaneously immune activation of CD4+ and CD8+ T cells, Treg percentages and VLLV upon long-term HAART. Tregs and nadir of CD4+ T cell counts were the only two parameters associated independently with the immunological response to HAART. We did not observe any relationship between iIR and VLLV or CD8+ T cell activation. In addition, there was no correlation between Treg and CD8+ T lymphocyte activation or VLLV after years of virological suppression. These results highlight the importance of monitoring CD4+ lymphocyte lineage homeostasis and variations of its subsets (activated phenotypes, Treg populations, etc.) over years to understand more clearly the putative mechanisms of immune recovery. This should be confirmed prospectively in a large cohort of patients, and may open innovative immunoadjuvant therapeutic strategies to shape an appropriate CD4+ T cell response during HAART which could have long-term effects on decreasing morbidity and mortality.
Acknowledgments
The authors thank patients and all the members of the Lyon HIV Cohort Study: physicians: Professor D. Peyramond, Professor C. Chidiac, Dr T. Ferry, Dr F. Ader, Dr L. Cotte, Dr T. Perpoint, Dr P. Miailhes, Dr F. Biron, Dr A. Boibieux, Dr E. Braun, Dr H. Champagne, Dr F. Daoud, Dr V. Gueripel, Dr J. Koffi, Dr C. Longuet, Dr S. Pailhes, Dr B. Ponceau, Dr I. Schlienger, Dr A. Senechal, Dr A. Bouaziz and Dr J. Karsenty; virologists: Professor P. André, Dr M. A. Trabaud, Dr J. C. Tardy, Dr V. Icard and Dr C.Scholtes; and immunologists: Dr G. Monneret, Dr F. Poitevin and Dr C. Malcus. This work was supported by Hospices Civils de Lyon. In addition, the study was supported by Beckman Coulter through donations of laboratory equipments and supplies. This private company had no role in the study design, collection or interpretation of the data. Similarly, Beckman Coulter had no role in the preparation of the manuscript or the decision to submit it for publication.
Disclosure
The authors have no financial conflicts of interest.
Author contributions
J. S., T. F, G. M., F. V. and J. D. designed the study, performed the immunological laboratory assessment, the statistical analysis and the writing of the manuscript. D. M. B. supervised the statistical analysis; V. I. performed the virological assessment. J. S., T. F., T. P., F. A. and C. C. recruited the patients.
Supporting Information
Additional Supporting information may be found in the online version of this article at the publisher's web-site:
Gating strategy.
Descriptive analysis of CD4+ T cells and regulatory T cell (Treg) subsets as absolute counts according to the immune response to highly active anti-retroviral therapy (HAART) (n = 87). Total activated CD4+ T cells CD4+human leucocyte antigen D-related (HLA-DR)+ T cells; Tregs CD4+CD25+forkhead box protein 3 (FoxP3)+ T cells; effector Tregs: CD4+CD25+FoxP3+CD45RA– T cells; terminal effector Tregs: CD4+CD25+FoxP3+CD45RA– HLA-DR+ T cells; effectors (non-Tregs) CD4+ T cells: CD4+FoxP3–HLA-DR+ T cells; activated effector CD4+ T cells: CD4+FoxP3–HLA-DR+ T cells. Results are expressed as absolute values.
References
- 1.Grabar S, Le Moing V, Goujard C, et al. Clinical outcome of patients with HIV-1 infection according to immunologic and virologic response after 6 months of highly active antiretroviral therapy. Ann Intern Med. 2000;133:401–410. doi: 10.7326/0003-4819-133-6-200009190-00007. [DOI] [PubMed] [Google Scholar]
- 2.Piketty C, Weiss L, Thomas F, Mohamed AS, Belec L, Kazatchkine MD. Long-term clinical outcome of human immunodeficiency virus-infected patients with discordant immunologic and virologic responses to a protease inhibitor-containing regimen. J Infect Dis. 2001;183:1328–1335. doi: 10.1086/319861. [DOI] [PubMed] [Google Scholar]
- 3.Gilson RJ, Man SL, Copas A, et al. Discordant responses on starting highly active antiretroviral therapy: suboptimal CD4 increases despite early viral suppression in the UK Collaborative HIV Cohort (UK CHIC) Study. HIV Med. 2010;11:152–160. doi: 10.1111/j.1468-1293.2009.00755.x. [DOI] [PubMed] [Google Scholar]
- 4.Gaardbo JC, Hartling HJ, Gerstoft J, Nielsen SD. Incomplete immune recovery in HIV infection: mechanisms, relevance for clinical care, and possible solutions. Clin Dev Immunol. 2012;2012:670957. doi: 10.1155/2012/670957. [DOI] [PMC free article] [PubMed] [Google Scholar]
- 5.Li T, Wu N, Dai Y, et al. Reduced thymic output is a major mechanism of immune reconstitution failure in HIV-infected patients after long-term antiretroviral therapy. Clin Infect Dis. 2005;53:944–951. doi: 10.1093/cid/cir552. [DOI] [PubMed] [Google Scholar]
- 6.Lewden C, Chene G, Morlat P, et al. HIV-infected adults with a CD4 cell count greater than 500 cells/mm3 on long-term combination antiretroviral therapy reach same mortality rates as the general population. J Acquir Immune Defic Syndr. 2007;46:72–77. doi: 10.1097/QAI.0b013e318134257a. [DOI] [PubMed] [Google Scholar]
- 7.Rodger AJ, Lodwick R, Schechter M, et al. Mortality in well controlled HIV in the continuous antiretroviral therapy arms of the SMART and ESPRIT trials compared with the general population. AIDS. 2013;27:973–979. doi: 10.1097/QAD.0b013e32835cae9c. [DOI] [PubMed] [Google Scholar]
- 8.Levacher M, Hulstaert F, Tallet S, Ullery S, Pocidalo JJ, Bach BA. The significance of activation markers on CD8 lymphocytes in human immunodeficiency syndrome: staging and prognostic value. Clin Exp Immunol. 1992;90:376–382. doi: 10.1111/j.1365-2249.1992.tb05854.x. [DOI] [PMC free article] [PubMed] [Google Scholar]
- 9.Hunt PW. HIV and inflammation: mechanisms and consequences. Curr HIV/AIDS Rep. 2012;9:139–147. doi: 10.1007/s11904-012-0118-8. [DOI] [PubMed] [Google Scholar]
- 10.Marziali M, De Santis W, Carello R, et al. T-cell homeostasis alteration in HIV-1 infected subjects with low CD4 T-cell count despite undetectable virus load during HAART. AIDS. 2006;20:2033–2041. doi: 10.1097/01.aids.0000247588.69438.fd. [DOI] [PubMed] [Google Scholar]
- 11.Erikstrup C, Kronborg G, Lohse N, Ostrowski SR, Gerstoft J, Ullum H. T-cell dysfunction in HIV-1-infected patients with impaired recovery of CD4 cells despite suppression of viral replication. J Acquir Immune Defic Syndr. 2010;53:303–310. doi: 10.1097/QAI.0b013e3181ca3f7c. [DOI] [PubMed] [Google Scholar]
- 12.Delobel P, Nugeyre MT, Cazabat M, et al. Naive T-cell depletion related to infection by X4 human immunodeficiency virus type 1 in poor immunological responders to highly active antiretroviral therapy. J Virol. 2006;80:10229–10236. doi: 10.1128/JVI.00965-06. [DOI] [PMC free article] [PubMed] [Google Scholar]
- 13.Nakanjako D, Ssewanyana I, Mayanja-Kizza H, et al. High T-cell immune activation and immune exhaustion among individuals with suboptimal CD4 recovery after 4 years of antiretroviral therapy in an African cohort. BMC Infect Dis. 2011;11:43. doi: 10.1186/1471-2334-11-43. [DOI] [PMC free article] [PubMed] [Google Scholar]
- 14.Mendez-Lagares G, del Pozo Balado Mdel M, Genebat Gonzalez M, Perganeda Sanchez AG, Leal Noval M, Pacheco Lopez YM. Severe immune dysregulation affects CD4(+)CD25(hi)FoxP3(+) regulatory T cells in HIV-infected patients with low-level CD4 T-cell repopulation despite suppressive highly active antiretroviral therapy. J Infect Dis. 2012;205:1501–1509. doi: 10.1093/infdis/jis230. [DOI] [PubMed] [Google Scholar]
- 15.Mendez-Lagares G, Garcia-Perganeda A, Pozo-Balado M, et al. Differential alterations of the CD4 and CD8 T cell subsets in HIV-infected patients on highly active antiretroviral therapy with low CD4 T cell restoration. J Antimicrob Chemother. 2012;67:1228–1237. doi: 10.1093/jac/dkr594. [DOI] [PubMed] [Google Scholar]
- 16.Doyle T, Smith C, Vitiello P, et al. Plasma HIV-1 RNA detection below 50 copies/ml and risk of virologic rebound in patients receiving highly active antiretroviral therapy. Clin Infect Dis. 2012;54:724–732. doi: 10.1093/cid/cir936. [DOI] [PubMed] [Google Scholar]
- 17.Maggiolo F, Callegaro A, Cologni G, et al. Ultrasensitive assessment of residual low-level HIV viremia in HAART-treated patients and risk of virological failure. J Acquir Immune Defic Syndr. 2012;60:473–482. doi: 10.1097/QAI.0b013e3182567a57. [DOI] [PubMed] [Google Scholar]
- 18.Gianotti N, Galli L, Racca S, et al. Residual viraemia does not influence 1 year virological rebound in HIV-infected patients with HIV RNA persistently below 50 copies/mL. J Antimicrob Chemother. 2012;67:213–217. doi: 10.1093/jac/dkr422. [DOI] [PubMed] [Google Scholar]
- 19.Bastard JP, Soulie C, Fellahi S, et al. Circulating interleukin-6 levels correlate with residual HIV viraemia and markers of immune dysfunction in treatment-controlled HIV-infected patients. Antivir Ther. 2012;17:915–919. doi: 10.3851/IMP2093. [DOI] [PubMed] [Google Scholar]
- 20.Widdrington J, Payne B, Medhi M, Valappil M, Schmid ML. The significance of very low-level viraemia detected by sensitive viral load assays in HIV infected patients on HAART. J Infect. 2011;62:87–92. doi: 10.1016/j.jinf.2010.11.001. [DOI] [PubMed] [Google Scholar]
- 21.Charpentier C, Landman R, Laouenan C, et al. Persistent low-level HIV-1 RNA between 20 and 50 copies/mL in antiretroviral-treated patients: associated factors and virological outcome. J Antimicrob Chemother. 2012;67:2231–2235. doi: 10.1093/jac/dks191. [DOI] [PubMed] [Google Scholar]
- 22.Ostrowski SR, Katzenstein TL, Thim PT, Pedersen BK, Gerstoft J, Ullum H. Low-level viremia and proviral DNA impede immune reconstitution in HIV-1-infected patients receiving highly active antiretroviral therapy. J Infect Dis. 2005;191:348–357. doi: 10.1086/427340. [DOI] [PubMed] [Google Scholar]
- 23.Fazekas de St Groth B, Landay AL. Regulatory T cells in HIV infection: pathogenic or protective participants in the immune response? AIDS. 2008;22:671–683. doi: 10.1097/QAD.0b013e3282f466da. [DOI] [PubMed] [Google Scholar]
- 24.Kassiotis G, O'Garra A. Immunology. Immunity benefits from a little suppression. Science. 2008;320:1168–1169. doi: 10.1126/science.1159090. [DOI] [PubMed] [Google Scholar]
- 25.Lund JM, Hsing L, Pham TT, Rudensky AY. Coordination of early protective immunity to viral infection by regulatory T cells. Science. 2008;320:1220–1224. doi: 10.1126/science.1155209. [DOI] [PMC free article] [PubMed] [Google Scholar]
- 26.Moreno-Fernandez ME, Presicce P, Chougnet CA. Homeostasis and function of regulatory T cells in HIV/SIV infection. J Virol. 2012;86:10262–10269. doi: 10.1128/JVI.00993-12. [DOI] [PMC free article] [PubMed] [Google Scholar]
- 27.Horta A, Nobrega C, Amorim-Machado P, et al. Poor immune reconstitution in HIV-infected patients associates with high percentage of regulatory CD4+ T cells. PLOS ONE. 2013;8:e57336. doi: 10.1371/journal.pone.0057336. [DOI] [PMC free article] [PubMed] [Google Scholar]
- 28.Foxall RB, Albuquerque AS, Soares RS, et al. Memory and naive-like regulatory CD4+ T cells expand during HIV-2 infection in direct association with CD4+ T-cell depletion irrespectively of viremia. AIDS. 2011;25:1961–1970. doi: 10.1097/QAD.0b013e32834b3554. [DOI] [PubMed] [Google Scholar]
- 29.Nilsson J, Boasso A, Velilla PA, et al. HIV-1-driven regulatory T-cell accumulation in lymphoid tissues is associated with disease progression in HIV/AIDS. Blood. 2006;108:3808–3817. doi: 10.1182/blood-2006-05-021576. [DOI] [PMC free article] [PubMed] [Google Scholar]
- 30.Tenorio AR, Martinson J, Pollard D, Baum L, Landay A. The relationship of T-regulatory cell subsets to disease stage, immune activation, and pathogen-specific immunity in HIV infection. J Acquir Immune Defic Syndr. 2008;48:577–580. doi: 10.1097/QAI.0b013e31817bbea5. [DOI] [PubMed] [Google Scholar]
- 31.Lim A, Tan D, Price P, et al. Proportions of circulating T cells with a regulatory cell phenotype increase with HIV-associated immune activation and remain high on antiretroviral therapy. AIDS. 2007;21:1525–1534. doi: 10.1097/QAD.0b013e32825eab8b. [DOI] [PubMed] [Google Scholar]
- 32.Del Pozo-Balado Mdel M, Leal M, Mendez-Lagares G, Pacheco YM. CD4(+)CD25(+/hi)CD127(lo) phenotype does not accurately identify regulatory T cells in all populations of HIV-infected persons. J Infect Dis. 2010;201:331–335. doi: 10.1086/649840. [DOI] [PubMed] [Google Scholar]
- 33.Sachdeva M, Fischl MA, Pahwa R, Sachdeva N, Pahwa S. Immune exhaustion occurs concomitantly with immune activation and decrease in regulatory T cells in viremic chronically HIV-1-infected patients. J Acquir Immune Defic Syndr. 2010;54:447–454. doi: 10.1097/QAI.0b013e3181e0c7d0. [DOI] [PMC free article] [PubMed] [Google Scholar]
- 34.Chase AJ, Yang HC, Zhang H, Blankson JN, Siliciano RF. Preservation of FoxP3+ regulatory T cells in the peripheral blood of human immunodeficiency virus type 1-infected elite suppressors correlates with low CD4+ T-cell activation. J Virol. 2008;82:8307–8315. doi: 10.1128/JVI.00520-08. [DOI] [PMC free article] [PubMed] [Google Scholar]
- 35.Jiao Y, Fu J, Xing S, et al. The decrease of regulatory T cells correlates with excessive activation and apoptosis of CD8+ T cells in HIV-1-infected typical progressors, but not in long-term non-progressors. Immunology. 2009;128:e366–375. doi: 10.1111/j.1365-2567.2008.02978.x. [DOI] [PMC free article] [PubMed] [Google Scholar]
- 36.Sakaguchi S, Miyara M, Costantino CM, Hafler DA. FOXP3+ regulatory T cells in the human immune system. Nat Rev Immunol. 2010;10:490–500. doi: 10.1038/nri2785. [DOI] [PubMed] [Google Scholar]
- 37.Saison J, Tardy JC, Scholtes C, et al. Low-level viremia is associated with non-B subtypes in patients infected with HIV with virological success following HAART introduction. J Med Virol. 2013;85:953–958. doi: 10.1002/jmv.23553. [DOI] [PubMed] [Google Scholar]
- 38.Demaret J, Saison J, Venet F, et al. Assessment of a novel flow cytometry technique of one-step intracellular staining: example of FOXP3 in clinical samples. Cytometry B Clin Cytom. 2013;84:187–193. doi: 10.1002/cyto.b.21070. [DOI] [PubMed] [Google Scholar]
- 39.Piconi S, Trabattoni D, Gori A, et al. Immune activation, apoptosis, and Treg activity are associated with persistently reduced CD4+ T-cell counts during antiretroviral therapy. AIDS. 2010;24:1991–2000. doi: 10.1097/QAD.0b013e32833c93ce. [DOI] [PubMed] [Google Scholar]
- 40.Andrade RM, Hygino J, Kasahara TM, et al. High IL-10 production by aged AIDS patients is related to high frequency of Tr-1 phenotype and low in vitro viral replication. Clin Immunol. 2012;145:31–43. doi: 10.1016/j.clim.2012.08.002. [DOI] [PubMed] [Google Scholar]
- 41.Casotti JA, Passos LN, Oliveira FJ, Cerutti C., Jr Factors associated with paradoxical immune response to antiretroviral therapy in HIV infected patients: a case control study. BMC Infect Dis. 2011;11:306. doi: 10.1186/1471-2334-11-306. [DOI] [PMC free article] [PubMed] [Google Scholar]
- 42.Arguello RJ, Balbaryski J, Barboni G, Candi M, Gaddi E, Laucella S. Altered frequency and phenotype of CD4+ forkhead box protein 3+ T cells and its association with autoantibody production in human immunodeficiency virus-infected paediatric patients. Clin Exp Immunol. 2012;168:224–233. doi: 10.1111/j.1365-2249.2012.04569.x. [DOI] [PMC free article] [PubMed] [Google Scholar]
- 43.Negredo E, Massanella M, Puig J, et al. Nadir CD4 T cell count as predictor and high CD4 T cell intrinsic apoptosis as final mechanism of poor CD4 T cell recovery in virologically suppressed HIV-infected patients: clinical implications. Clin Infect Dis. 2010;50:1300–1308. doi: 10.1086/651689. [DOI] [PubMed] [Google Scholar]
- 44.Le T, Wright EJ, Smith DM, et al. Enhanced CD4+ T-cell recovery with earlier HIV-1 antiretroviral therapy. N Engl J Med. 2013;368:218–230. doi: 10.1056/NEJMoa1110187. [DOI] [PMC free article] [PubMed] [Google Scholar]
- 45.Gaardbo JC, Nielsen SD, Vedel SJ, et al. Regulatory T cells in human immunodeficiency virus-infected patients are elevated and independent of immunological and virological status, as well as initiation of highly active anti-retroviral therapy. Clin Exp Immunol. 2008;154:80–86. doi: 10.1111/j.1365-2249.2008.03725.x. [DOI] [PMC free article] [PubMed] [Google Scholar]
- 46.Kared H, Lelievre JD, Donkova-Petrini V, et al. HIV-specific regulatory T cells are associated with higher CD4 cell counts in primary infection. AIDS. 2008;22:2451–2460. doi: 10.1097/QAD.0b013e328319edc0. [DOI] [PMC free article] [PubMed] [Google Scholar]
- 47.Saison J, Demaret J, Venet F, et al. CD4+CD25+CD127-assessment as a surrogate phenotype for FOXP3+ regulatory T cells in HIV-1 infected viremic and aviremic subjects. Cytometry B Clin Cytom. 2012;84:50–54. doi: 10.1002/cyto.b.21047. [DOI] [PubMed] [Google Scholar]
- 48.Fontenot JD, Gavin MA, Rudensky AY. Foxp3 programs the development and function of CD4+CD25+ regulatory T cells. Nat Immunol. 2003;4:330–336. doi: 10.1038/ni904. [DOI] [PubMed] [Google Scholar]
- 49.Belkaid Y, Rouse BT. Natural regulatory T cells in infectious disease. Nat Immunol. 2005;6:353–360. doi: 10.1038/ni1181. [DOI] [PubMed] [Google Scholar]
- 50.Simonetta F, Lecuroux C, Girault I, et al. Early and long-lasting alteration of effector CD45RA(-)Foxp3(high) regulatory T-cell homeostasis during HIV infection. J Infect Dis. 2012;205:1510–1519. doi: 10.1093/infdis/jis235. [DOI] [PMC free article] [PubMed] [Google Scholar]
- 51.Hodi FS, Butler M, Oble DA, et al. Immunologic and clinical effects of antibody blockade of cytotoxic T lymphocyte-associated antigen 4 in previously vaccinated cancer patients. Proc Natl Acad Sci USA. 2008;105:3005–3010. doi: 10.1073/pnas.0712237105. [DOI] [PMC free article] [PubMed] [Google Scholar]
- 52.Colombo MP, Piconese S. Regulatory-T-cell inhibition versus depletion: the right choice in cancer immunotherapy. Nat Rev Cancer. 2007;7:880–887. doi: 10.1038/nrc2250. [DOI] [PubMed] [Google Scholar]
- 53.Girard PM, Katlama C, Pialoux G. VIH. Rueil-Malmaison, France: Wolters Kluwer France; 2011. DOIN Editors. [Google Scholar]
- 54.Li T, Wu N, Dai Y, et al. Reduced thymic output is a major mechanism of immune reconstitution failure in HIV-infected patients after long-term antiretroviral therapy. Clin Infect Dis. 2011;53:944–951. doi: 10.1093/cid/cir552. [DOI] [PubMed] [Google Scholar]
- 55.Benito JM, Lopez M, Lozano S, et al. Differential upregulation of CD38 on different T-cell subsets may influence the ability to reconstitute CD4+ T cells under successful highly active antiretroviral therapy. J Acquir Immune Defic Syndr. 2005;38:373–381. doi: 10.1097/01.qai.0000153105.42455.c2. [DOI] [PubMed] [Google Scholar]
- 56.Tiba F, Nauwelaers F, Traore S, et al. Immune reconstitution during the first year of antiretroviral therapy of HIV-1-infected adults in rural Burkina Faso. Open AIDS J. 2012;6:16–25. doi: 10.2174/1874613601206010016. [DOI] [PMC free article] [PubMed] [Google Scholar]
- 57.Freguja R, Gianesin K, Mosconi I, et al. Regulatory T cells and chronic immune activation in human immunodeficiency virus 1 (HIV-1)-infected children. Clin Exp Immunol. 2011;164:373–380. doi: 10.1111/j.1365-2249.2011.04383.x. [DOI] [PMC free article] [PubMed] [Google Scholar]
- 58.Shaw JM, Hunt PW, Critchfield JW, et al. Increased frequency of regulatory T cells accompanies increased immune activation in rectal mucosae of HIV-positive noncontrollers. J Virol. 2011;85:11422–11434. doi: 10.1128/JVI.05608-11. [DOI] [PMC free article] [PubMed] [Google Scholar]
- 59.Hunt PW, Landay AL, Sinclair E, et al. A low T regulatory cell response may contribute to both viral control and generalized immune activation in HIV controllers. PLOS ONE. 2011;6:e15924. doi: 10.1371/journal.pone.0015924. [DOI] [PMC free article] [PubMed] [Google Scholar]
- 60.Prendergast A, O'Callaghan M, Menson E, et al. Factors influencing T cell activation and programmed death 1 expression in HIV-infected children. AIDS Res Hum Retroviruses. 2012;28:465–468. doi: 10.1089/AID.2011.0113. [DOI] [PubMed] [Google Scholar]
- 61.Rallon NI, Lopez M, Soriano V, et al. Level, phenotype and activation status of CD4+FoxP3+ regulatory T cells in patients chronically infected with human immunodeficiency virus and/or hepatitis C virus. Clin Exp Immunol. 2009;155:35–43. doi: 10.1111/j.1365-2249.2008.03797.x. [DOI] [PMC free article] [PubMed] [Google Scholar]
Associated Data
This section collects any data citations, data availability statements, or supplementary materials included in this article.
Supplementary Materials
Gating strategy.
Descriptive analysis of CD4+ T cells and regulatory T cell (Treg) subsets as absolute counts according to the immune response to highly active anti-retroviral therapy (HAART) (n = 87). Total activated CD4+ T cells CD4+human leucocyte antigen D-related (HLA-DR)+ T cells; Tregs CD4+CD25+forkhead box protein 3 (FoxP3)+ T cells; effector Tregs: CD4+CD25+FoxP3+CD45RA– T cells; terminal effector Tregs: CD4+CD25+FoxP3+CD45RA– HLA-DR+ T cells; effectors (non-Tregs) CD4+ T cells: CD4+FoxP3–HLA-DR+ T cells; activated effector CD4+ T cells: CD4+FoxP3–HLA-DR+ T cells. Results are expressed as absolute values.