

Abstract
Background and Purpose
Identifying and characterizing potential new therapeutic agents to target cell proliferation may provide improved treatments for neoplastic disorders such as cancer and polycystic diseases.
Experimental Approach
We used the simple, tractable biomedical model Dictyostelium to investigate the molecular mechanism of naringenin, a dietary flavonoid with antiproliferative and chemopreventive actions in vitro and in animal models of carcinogenesis. We then translated these results to a mammalian kidney model, Madin-Darby canine kidney (MDCK) tubule cells, grown in culture and as cysts in a collagen matrix.
Key Results
Naringenin inhibited Dictyostelium growth, but not development. Screening of a library of random gene knockout mutants identified a mutant lacking TRPP2 (polycystin-2) that was resistant to the effect of naringenin on growth and random cell movement. TRPP2 is a divalent transient receptor potential cation channel, where mutations in the protein give rise to type 2 autosomal dominant polycystic kidney disease (ADPKD). Naringenin inhibited MDCK cell growth and inhibited cyst growth. Knockdown of TRPP2 levels by siRNA in this model conferred partial resistance to naringenin such that cysts treated with 3 and 10 μM naringenin were larger following TRPP2 knockdown compared with controls. Naringenin did not affect chloride secretion.
Conclusions and Implications
The action of naringenin on cell growth in the phylogenetically diverse systems of Dictyostelium and mammalian kidney cells, suggests a conserved effect mediated by TRPP2 (polycystin-2). Further studies will investigate naringenin as a potential new therapeutic agent in ADPKD.
Linked Articles
This article is part of a themed section on the pharmacology of TRP channels. To view the other articles in this section visit http://dx.doi.org/10.1111/bph.2014.171.issue-10
Keywords: polycystic kidney disease, polycystin-2, naringenin, Dictyostelium, polyphenol, cell growth
Introduction
The development of new treatments for a disease requires knowledge of the molecular target(s) of those treatments. The social amoeba, Dictyostelium discoideum, is a simple biomedical model commonly used to study developmental and cellular biology. Dictyostelium has recently been used in early drug development studies (Chang et al., 2012) and to identify molecular pathways regulating drug action (Terbach et al., 2011). In its natural forest-floor habitat, Dictyostelium exists in its amoeboid state and feeds on bacterial cells by phagocytosis (Williams et al., 2006). When nutrients are scarce, cells aggregate to form fruiting bodies containing spores that are dormant and resistant to desiccation. Growth and development are controlled by a range of separate signalling pathways that can be probed at the molecular level by screening libraries of insertional mutants, constructed by restriction enzyme-mediated integration (REMI). This approach has provided new insights into how current therapeutic agents regulate cellular function (Williams et al., 2006), for example, in identifying common signalling pathways targeted by lithium and valproic acid in the treatment of bipolar disorder, and is increasingly being used to identify cellular mechanisms controlling drug targets using growth and development (Terbach et al., 2011) or cell movement (Robery et al., 2011) as phenotypic readouts.
Naringenin (4′,5,7-trihydroxyflavanone; Figure 1) is a member of the flavonone subclass of flavonoids, a large family of plant polyphenols. Naringenin is ingested mostly as naringin (its glycoside) and is available at relatively high doses (∼30 mg naringin 100 mL-1) in grapefruit juice (http://www.phenol-explorer.eu). Naringenin is bioavailable after reasonable doses; for example, a dose of 139–265 mg naringenin yielded 0.7–14.8 μM of the aglycone in the blood after absorption (Erlund et al., 2001). After phase 2 metabolism, naringenin glucuronides and sulphates are detected in low micromolar concentrations (Manach et al., 2005). In common with many flavonoids, naringenin inhibits growth in tumour cells by a number of mechanisms, including cell cycle arrest and p53-dependent apoptosis (Meiyanto et al., 2012). Naringenin also suppresses colon cancer in rats (Leonardi et al., 2010) and inhibits metastasis and tissue invasion (Weng and Yen, 2012). The chemopreventive actions of naringenin may include activation of certain cytochrome P450 isozymes and phase 2 enzymes involved in the detoxification of potential carcinogens (Moon et al., 2006; Kale et al., 2008).
Figure 1.
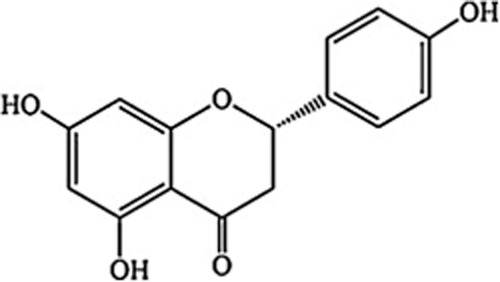
Structure of naringenin (4′,5,7-trihydroxyflavanone).
Since a previous study had shown that naringenin blocked Dictyostelium cell growth (Russ et al., 2006), we sought to identify the molecular mechanism of naringenin function in this model. By screening a library of Dictyostelium REMI mutants, it was possible to identify genes conferring resistance to naringenin. We then used the appropriate mammalian system to study the role of the identified gene product in mediating the actions of naringenin on cell growth. Our data have identified a new candidate for naringenin-mediated cell function: polycystin-2 (TRPP2), a Ca2+ permeable non-selective cation channel implicated in the development of autosomal dominant polycystic kidney disease (ADPKD; González-Perrett et al., 2001; Vassilev et al., 2001). In this disease, kidney cysts develop due to a defect in proliferation and because of fluid secretion into the cysts (Terryn et al., 2011). About 85% of ADPKD cases result from mutations in the TRPP1 (polycystic kidney disease-1) gene and protein, with the remainder accounted for by mutations in the TRPP2 (PKD2) gene and protein (Chapin and Caplan, 2010). We therefore followed up on our own initial observations in Dictyostelium by studying the involvement of TRPP2 in the effects of naringenin on the growth of Madin-Darby canine kidney (MDCK) cells and cysts. We found that TRPP2 (polycystin-2) mediated the growth-inhibitory effects of naringenin in both systems.
Methods
Dictyostelium growth assays
Dictyostelium discoideum wild-type cells (Ax2) were grown in shaking suspension in Axenic medium (ForMedium Co. Ltd, Norfolk, UK) at 120 rpm (21°C) and harvested in mid-log phase (4 × 10⁶). Cells (1 × 10⁶ cells·mL−1) were then resuspended in Axenic medium containing 100 μM naringenin or DMSO and counted at 24 h intervals.
Dictyostelium insertional mutagenesis library screening
Dictyostelium wild-type cells (Ax4) were mutagenized by REMI of plasmid DNA using pBBC plasmids, which are derivatives of the pBSR1 plasmid (Adachi et al., 1994) that contain 60mer DNA barcodes (C. Dinh, pers. comm.). REMI was performed using three combinations of restriction enzymes for plasmid linearization/electroporation (BamHI/DpnII, EcoRI/ApolI and SphI/NlaIII). Clonal transformants were propagated in 24-well culture plates and stored at –80°C in 10% DMSO for future recovery. The residual cells from these plates were spotted on a bacterial growth plate, allowed to grow for 2 days, and collected as pools (24 mutants per pool). A number of these pools of 24 (28–32 pools) were combined into 30 large pools of 672–768 mutants. Twenty-five large pools were used in the enrichment experiments that were carried out for each pool, in triplicate, in 10 cm Petri dishes with 10 mL of HL-5 supplemented with 100 μg·mL−1 streptomycin and 100 U·mL−1 penicillin (Sussman, 1987). Naringenin (200 μM final concentration) was added to 5 × 10⁶ mutant cells in 10 mL of supplemented HL-5. After 3 days or when cell concentration reached ∼2 × 10⁶ cells·mL−1, 1 mL of the initial culture media was removed and added to 9 mL of fresh media containing naringenin. The same procedure was repeated for 21 days. Genomic DNA was purified from cells that were collected from each culture dish and plasmid insertion sites were cloned as described previously (Kuspa, 2006). After a mutant's insertion site was identified by plasmid rescue, a clonal strain was recovered from the 24-well frozen stock to confirm resistance to growth inhibition by naringenin and for further analysis.
Dictyostelium pkd2− recapitulation
Knockout constructs were created using methods described previously (Pakes et al., 2012). Briefly, 5′ and 3′ fragments flanking the Dictyostelium pkd2 was amplified by PCR (peqSTAR 96 Universal Gradient, Erlangen, Germany) from wild-type genomic DNA. The 5′ terminal targeting fragment was amplified using AAGGGATCCAATACCTTGAAATTAATAATCCATC and TTAACTGCAGCTGATGCTGTC, and the 3′ terminal fragment was amplified using CTGATATTGCCTCATTCCATGGCTTCG and TTGGTGATTGTGGGGTACCAGTAC. The 5′ and 3′ PCR fragments were cloned into the plPBLP expression vector using BamHI/PstI (5′ fragment-500 bp) and NcoI/KpnI (3′ fragment-744 bp) restriction sites, respectively, incorporating the gene in the reverse orientation to the blasticidin resistance cassette. The knockout cassette was linearized and transformed into wild-type cells via electroporation (Gene Pulser Xcell, Bio-Rad, Hertfordshire, UK). Positive transformants were selected in nutrient media containing blasticidin (10 μg·mL−1). Independent clones were screened for homologous integration by PCR, using diagnostic PCR products for the presence of target gene genomic DNA and knockout vector sequences, as well as a diagnostic PCR product only found for homologous intergrant for both N and C-terminal regions of the knockout cassette. Triplicate independent isolates were identified, clonally plated onto Raoultella planticola, and isogenic colonies were used in subsequent experiments.
Dictyostelium random cell movement assay
To analyse the effect of naringenin on Dictyostelium random cell movement, wild-type and pkd2− cells were grown in shaking suspension in Axenic medium for 48 h, washed and resuspended in phosphate buffer at 1.7 × 10⁶ cells·mL−1, and treated with 30 nM cAMP at 6 min intervals while shaking at 120 rpm as described previously (Robery et al., 2011). Cells were then shaken in the presence of 200 μM naringenin or 0.7% DMSO (solvent control) for 1 h, transferred into 8-well glass coverslips (Thermo Fisher, Loughborough, UK) and random cell movement was recorded by capturing one image every 15 s for 5 min. A minimum of three independent experiments were performed for each cell and condition, whereby an average ∼10 cells were quantified per experiment. Random cell movement was analysed using the Quimp 11b software package for ImageJ (Tyson et al., 2010). Data were imported into MATLAB where changes in motility, circularity, distance travelled and number of protrusions formed were monitored for each cell line in the presence and absence naringenin. The effect of naringenin was assessed in relation to distance travelled by cells during random cell movement, cell circularity, number of protrusions and motility. Data were compared using one-way anova with Tukey's post hoc test.
MDCK cell culture
MDCK C7 cells were a generous gift from Dr Anselm Zdebik (Department of Neuroscience, Physiology & Pharmacology, University College London). MDCK cells were cultured in DMEM (Life Technologies, Ltd., Paisley, UK) containing 10% (v v-1) FBS, gentamycin (40 μg·mL−1), penicillin (100 units·mL−1) and streptomycin (1040 μg·mL−1), and were maintained at 37°C in a humidified, 5% CO2 atmosphere. Cells of less than 18 passage numbers were used for all cytotoxicity and cyst growth studies.
MDCK cell viability assays
Naringenin was dissolved in DMSO (to a maximum of 0.1% DMSO v v-1) and evaluated for its antiproliferative effect on MDCK cells using the sulforhodamine B (SRB) assay. Cells were seeded in complete DMEM in a 96-well plate (10 000 cells per well), allowed to adhere for 24 h then incubated with naringenin (1–100 μM) for 24–48 h. The medium was removed and 100 μL of SRB solution [0.4% (w/v) in 1% acetic acid] was added to each well and plates were incubated for 10 min at room temperature. The SRB solution was removed and cells were washed five times with 1% acetic acid (200 μL per well) before air drying. SRB bound to adherent cells was solubilized with 10 mM Tris base (unbuffered) and plates were placed on a horizontal shaker for at least 10 min at room temperature. Absorbance was read at 550 nm using an ELx808 Absorbance Microplate reader (Biotek, Potton, UK). Actinomycin-D (5 μM) was used as a positive control. The neutral red assay was performed as described previously (Repetto et al., 2008) with readings at 510 nm. EC50 values were calculated by four-parameter non-linear regression using GraphPad Prism (GraphPad Software, San Diego, CA, USA).
MDCK cyst culture and measurement
For cyst growth studies, we followed a published protocol (Li et al., 2004). In brief, MDCK cells were cultured in 24-well plates. A cell suspension (∼800 cells per well) was mixed with 0.4 mL ice-cold collagen (PureCol, Nutacon BV, Leimuiden, The Netherlands) supplemented with DMEM containing 10% (v/v) FBS, gentamycin (40 μg·mL−1), penicillin (100 units·mL−1), streptomycin (1040 μg·mL−1), 10 mM HEPES and 27 mM NaHCO3. Plates containing cells in collagen were incubated at 37°C in a humidified, 5% CO2 atmosphere for about 2 h until the collagen sets. DMEM (1.5 mL) containing 10% FBS and forskolin (10 μM; Tocris Biosciences, Bristol, UK) was added to each well and plates were placed back in the incubator. Cells were replenished with fresh DMEM medium supplemented with forskolin (10 μM) after every 2 days until the end of day 12. Cells transformed into cysts within 3 days of plating and were photographed using an inverted microscope (Leica, Milton Keynes, UK) at ×100 magnification. On day 6, a total of 50 cysts each with a diameter >50 μm were selected and referenced using microscope slide-grids underneath each well. The same protocol was followed for the transfected MDCK cells. To evaluate the potential effect on cyst growth, naringenin (in a maximum of 0.1% DMSO) at 1, 3, 10, 30, 60, 100 μM, or metformin (10 μM; Sigma Aldrich, Poole, UK), or vehicle control (0.1% DMSO) were added in DMEM (1.5 mL per well) containing forskolin (10 μM) on days 6, 8 and 10. Photographs of referenced cysts were taken on days 6, 8, 10 and 12. Cyst area (mm2) was measured using Image J software (v 1.4; Schneider et al., 2012).
Electrophysiological measurements of MDCK monolayers
MDCK cells were seeded onto Snapwell permeable supports (0.4 μm pore, polyester membrane, 12 mm diameter, Costar 3801; Corning Inc, Corning, NY, USA) at 2 × 10⁵ cells·cm−2. Cells formed monolayers in culture in a humidified incubator (37°C, 5% CO2). Culture medium was replaced every 2 days and monolayers were used in experiments after 12–13 days in culture. Monolayers were mounted in Ussing chambers and bathed both sides with Krebs-Henselheit (KH) buffer: in mM, NaCl 117, NaHCO3 25, KCl 4.7, MgSO4 1.2, KH2PO4 1.2, glucose 11, CaCl2 2.5, bubbled with 95% O2/5% CO2 to maintain pH at 7.45. Experiments were performed at 37°C using heated water-jacketed buffer reservoirs. The transepithelial potential difference (Vt) generated across MDCK monolayers was clamped to 0 mV and the short-circuit current (ISC) recorded using a DVC-1000 voltage-clamp amplifier (World Precision Instruments, New Haven, CT, USA) via an analog–digital convertor (Bio-Pac MP100) and Acknowledge 3.8.2 software (Bio Pac Systems Inc., Goleta, CA, USA). Brief (2 s) voltage steps from 0 to 1 mV were applied periodically and the change in current used to calculate transepithelial resistance. MDCK monolayers had a spontaneous Vt of −4.7 ± 1.3 mV on mounting, baseline ISC was 1.0 ± 0.3 μA·cm−2 and transepithelial resistance was 2152 ± 308 Ωcm2 (n = 12).
siRNA TRPP2 transfection
MDCK cells were grown until 80% confluent. For transfection experiments, cells were incubated overnight in reduced serum medium Opti-MEM (31985; Life Technologies, Ltd.) prior to transfection. Cells were then transfected with 20 nM (final concentration per well) canine TRPP2 siRNA or scrambled control siRNA (Ambion Cy3-labeled siRNA; Invitrogen) in a lipid-based transfection reagent lipofectamine 2000 (Invitrogen) at 1:1000 dilution for 24 h. Cells were allowed to recover in DMEM without antibiotics for 12 h. The following day, cells were re-transfected using a similar procedure. This double transfection procedure resulted in a transfection efficiency of approximately 60–70%. Following transfection, cells were grown for 24–48 h for Western blot analysis or further processed for cyst culture or proliferation assay. Transfection efficiency was monitored using confocal microscopy of transfected cells cultured on chambered glass slides in order to analyse siRNA subcellular localization and stability (data not shown). The molecular target nomenclature for TRPP2 (polycystin-2) conforms to BJP's Concise Guide to PHARMACOLOGY (Alexander et al., 2013).
Western blot analysis
Lysates of control and transfected cells were prepared in RIPA (50 mM Tris-HCl pH 7.4, 150 mM NaCl, 1% Triton X-100, 1% sodium deoxycholate, 0.1% SDS, 1 mM EDTA) with protease inhibitor. Protein fractions (50 μg) were separated on 4–12% Bis-Tris acrylamide gels, transferred to polyvinylidine difluoride membranes and incubated in blocking buffer (LiCor Biosciences, Lincoln, NE, USA) for 2 h and then overnight at 4°C with anti-TRPP2 antibody (Santa Cruz Biotechnology, Inc., Santa Cruz, CA, USA) or mouse monoclonal anti-β-actin (AbCam, Cambridge, UK) in PBS. Blots were washed three times in PBS/0.01% TWEEN 20 then incubated with IR Dye anti-goat/mouse secondary antiserum (1:5000; LiCor Biosciences) for 1 h, each at room temperature. Immunostained proteins were visualized and quantified using an infrared imaging system (Odyssey, LiCor Biosciences).
Data analysis and statistical procedures
Data are presented as mean and SEM from n independent experiments Statistical tests were performed using Prism 5.0.4 (GraphPad Software) as stated in the text.
Chemicals
All materials used in this study were from Sigma Aldrich unless otherwise specified.
Results
Naringenin inhibits growth of Dictyostelium
To identify the molecular mechanism of action of naringenin, we first defined conditions suitable for screening a Dictyostelium REMI mutant library. The growth of wild-type Dictyostelium in shaking cultures was reduced after 48–96 h by naringenin with an EC50 between 50 and 100 μM (Figure 2A). In contrast, development of Dictyostelium on nitrocellulose filters (where starved cells aggregate and form fruiting bodies) was unaffected in the presence of up to 200 μM naringenin (data not shown). This growth inhibition enabled the selection of cells resistant to the effect of naringenin in shaking culture using a library of REMI mutants, exposed to 200 μM naringenin for 21 days. Sequence analysis of cells resistant to naringenin under these conditions identified 26 mutants containing an interrupted open reading frame potentially controlling the effect of naringenin on growth (Supporting Information Figure S1). One of these interrupted genes, pkd2, encoded the TRPP2 protein (DDB_G0272999). This protein showed a similar overall size (82.2 kDa; 715 aa) to the human protein (variant 1; 87.0 kDa; 758 aa), with similar potential transmembrane domains (Supporting Information Figure S2) although it showed low homology to the human protein (26% identity, 49% similarity; Supporting Information Figure S3).
Figure 2.
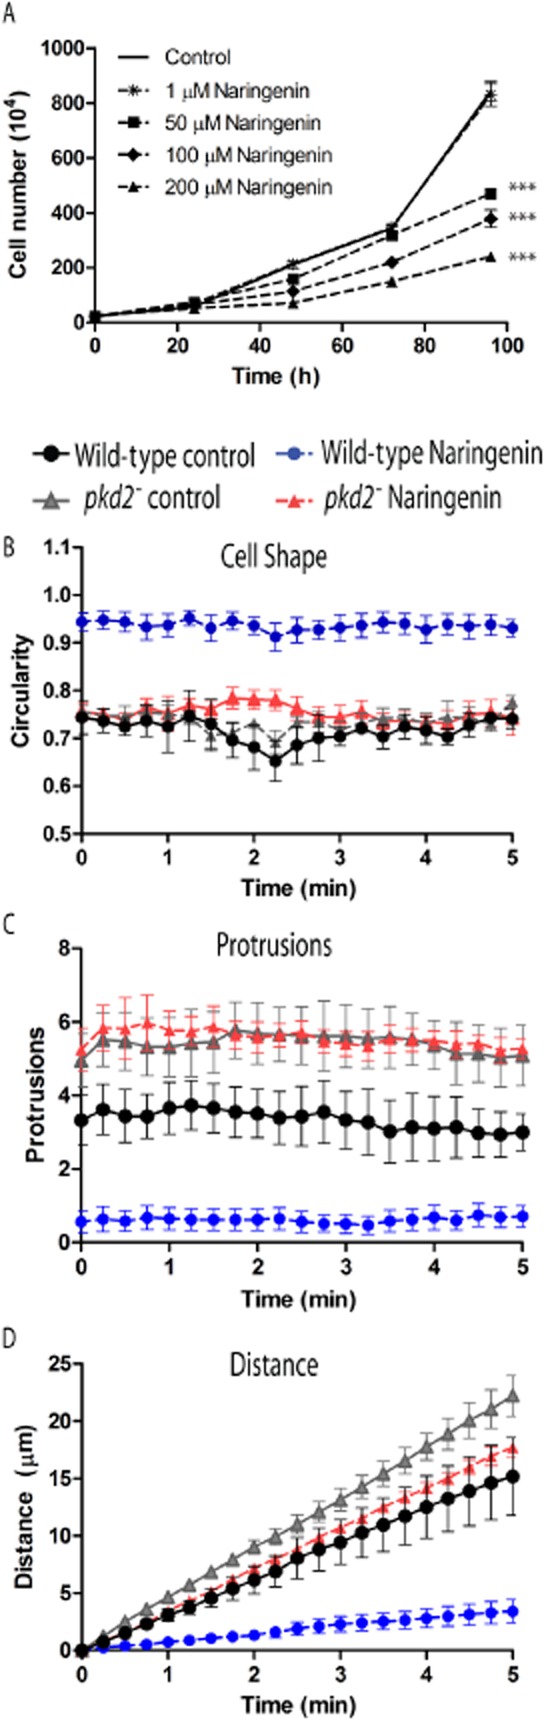
Naringenin reduced growth of Dictyostelium and inhibited cell behaviour, an effect controlled through the TRPP2 protein. (A) Dictyostelium growth in liquid culture is reduced in a concentration-dependent manner by naringenin. Ablation of the gene encoding TRPP2 showed resistance to the effect of naringenin on cell behaviour, since incubating wild-type and pkd2− cells in 200 μM naringenin (or vehicle control) for 1 h before recording and quantifying cell behaviour over a 5 min period (see Supporting Information Movies S1–S4), showed: (B) Naringenin-treated wild-type cells (blue circles) significantly increased in circularity when compared with vehicle controls (black circles). pkd2− mutant cells did not alter cell shape following naringenin treatment cells. (C) Naringenin-treated wild-type cells (blue circles) significantly decreased pseudopod formation when compared with vehicle controls or pkd2− mutant cells; and (D) Naringenin-treated wild-type cells (blue circles) significantly reduced motility (measured by distance travelled) compared with vehicle controls or pkd2− mutant cells. All data are shown from quadruplicate independent experiments ± SEM.
TRPP2 mediates the effect of naringenin on Dictyostelium
Recapitulation of the gene knockout mutant, pkd2−, in wild-type cells (Supporting Information Figure S4) enabled the comparison of the effect of naringenin on wild-type and pkd2− cells. Initial analysis of these two cell lines showed that 100 μM naringenin caused a significant 37% reduction (P < 0.001) in wild-type cell growth at 48 and 72 h (Supporting Informatioin Figure S5), whereas the pkd2− mutant showed reduced growth compared with wild-type cells in the absence of naringenin, but showed no significant change in growth in the presence of 100 μM naringenin at both time points. To better quantify this resistant phenotype, and because we have also shown the effect of a range of dietary compounds on Dictyostelium cell behaviour (Robery et al., 2011), we also examined a role for naringenin regulating cell shape and movement. In these experiments, cells were developed under control conditions over a 5 h period, and then treated with 200 μM naringenin for 60 min before recording random cell movement. Naringenin treatment (compare Supporting Information films S1 and S2) caused wild-type cells to round up (Figure 2B; P < 0.001 comparing wild-type naringenin, untreated and treated), with a loss of pseudopod formation (Figure 2C; P < 0.001 comparing wild-type naringenin, untreated and treated) and a block in cell movement (Figure 2D; P < 0.01 comparing wild-type naringenin, untreated and treated). In contrast, the naringenin-treated pkd2− mutant (see Supporting Information films S3 and S4) showed no significant change in shape, measured as roundness (Figure 2B), did not form a significantly different number of pseudopods (Figure 2C), and did not significantly change cell movement (Figure 2D). These data suggest that TRPP2 controls the function of naringenin on Dictyostelium movement.
Naringenin inhibits growth of MDCK cells and cysts
As mutations within the human TRPP2 protein are associated with growth of renal cysts in polycystic kidney disease (PKD, Chapin and Caplan, 2010), we next investigated a similar effect of naringenin on the mammalian TRPP2 during cell growth. TRPP2 is expressed in the MDCK canine kidney cell line (Scheffers et al., 2000; 2002) and cyst formation in these cells has been used as a model of PKD (Li et al., 2004; 2012). In this system, naringenin inhibited the growth of MDCK cells over 24–48 h (Figure 3) with EC50 values of 28.5 ± 1 μM using two independent assays for cell growth assessment (neutral red assay and SRB).
Figure 3.
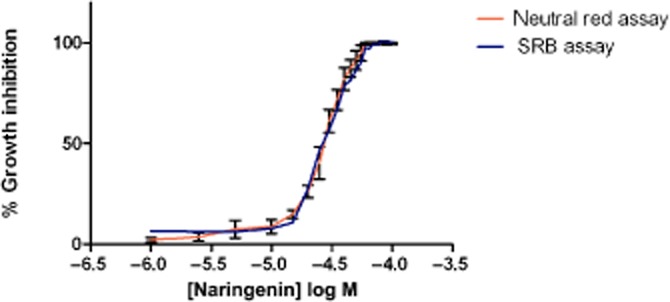
Inhibition of proliferating, unpolarized MDCK cell growth by naringenin after 48 h. Cell viability was measured using the neutral red assay and the SRB protein assay. Data are from three independent experiments showing mean and SEM (error bars not shown for SRB for clarity). EC50 values were calculated by non-linear regression (Graph Pad Prism 5). EC50 values were 28 ± 1 μM (neutral red assay) and 29 ± 1 μM (SRB assay). R values were >0.98.
To investigate the relevance of this mechanism to cyst formation, we then examined the effect of naringenin in regulating the growth of cysts in this cell line over 6 days (Figure 4). MDCK cells can be induced to form cysts by the addition of forskolin (10 μM) to the growth medium bathing a collagen gel inoculated with the cells. Following this treatment, cysts were observed after 3 days, with individual cysts reaching sizes of >50 μm in diameter 6 days after induction. Addition of naringenin (1–100 μM) caused a concentration-dependent decrease in cyst size, with an EC50 of 3–10 μM following a 12 day treatment. Growth inhibition was complete after 6 days exposure to 100 μM naringenin (12 days post-induction); no cysts remained at this concentration. Metformin (10 μM), an activator of AMP-dependent kinase, also inhibited cyst growth, as reported in another study (albeit at 1 mM over 20 days; Takiar et al., 2011).
Figure 4.
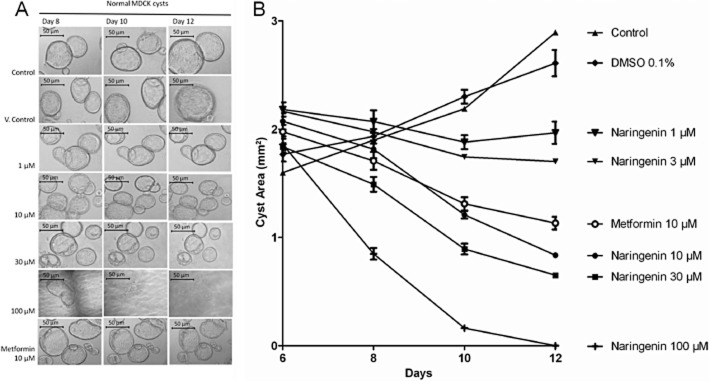
Inhibition of cyst growth by naringenin. (A) Photomicrographs of normal cysts treated from day 6 to day 12 with medium (control), 0.1% DMSO (vehicle control), naringenin 1–100 μM or metformin 10 μM. The shadows/lines in some images are the gridlines used to identify the positions of the cysts. Scale bar is 50 μm. (B) Plot of cyst size versus treatment. Naringenin inhibited cyst growth in a concentration-dependent manner. Metformin (10 μM) inhibited cyst growth as expected. Data are from three independent experiments showing mean and SEM.
Knockdown of TRPP2 (polycystin-2) protects MDCK cysts and cells from naringenin
As it was clear that naringenin inhibited the proliferation of MDCK cells and cysts, we implemented an siRNA strategy to knock down the cellular level of TRPP2 in MDCK cells. In this approach, cell extracts derived from MDCK in isolated cell culture were analysed by Western blot and were positive for TRPP2: two proteins (∼90 and ∼130 kDa) were detected as shown previously (Wang et al., 2012). Transforming these cells with siRNA specific to TRPP2 RNA or with a scrambled sequence, and leaving cells to recover for up to 48 h, enabled the assessment of reduced MDCK protein by Western blot analysis. This approach gave a dose-dependent decrease in the abundance of both TRPP2 proteins using specific TRPP2 siRNA at 10 nmol (TRPP2 + scrambled siRNA) or 20 nmol (TRPP2 siRNA only; P < 0.05 and P < 0.001, n = 5 respectively). Protein abundance was decreased (compared with untransfected cells) to 56 ± 5% with 20 nmol of TRPP2 siRNA after 24 h, 39 ± 8% after 48 h, and 32 ± 2% after 12 days (Figure 5).
Figure 5.
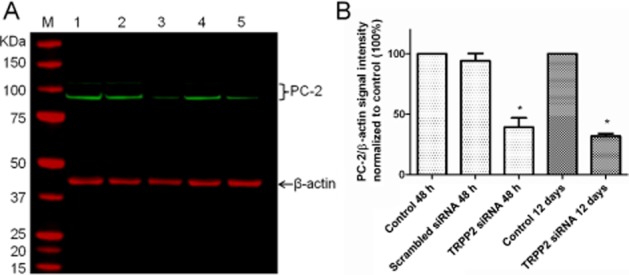
Knockdown of TRPP2 (PC-2) protein in MDCK cells. (A) Representative Western blot of TRPP2 from cells transfected 48 h (lanes 1–3) or 12 days (lanes 4–5). Lane 1: untransfected cells (48 h), Lane 2: cells transfected with scrambled siRNA (48 h), Lane 3: cells transfected with TRPP2 siRNA (48 h), Lane 4: untransfected cells (12 days), Lane 5: cells transfected with TRPP2 siRNA (12 days). M: molecular marker. Sample loading concentration 30 μg per lane. (B) Bands of TRPP2/β-actin fluorescence normalized to untransfected cells. Data are shown as mean ± SEM, n = 3–5. *P > 0.05 relative to day-matched control.
The growth of MDCK cells transfected with either scrambled siRNA or TRPP2 siRNA was then measured in the presence of increasing concentrations of naringenin for 48 h. The inhibitory effect of naringenin on growth was reduced in cells transfected with TRPP2 siRNA (Figure 6) when compared with untransfected cells and to cells transfected with scrambled siRNA. The EC50 value for naringenin was increased from 28 ± 1 μM (as in Figure 3) to 65 ± 1 μM. Transfection with scrambled siRNA had no effect on the EC50 for growth inhibition (30 μM). Thus, at a time point (48 h), when TRPP2 protein was reduced to 39% of control (Figure 5), the effect of naringenin on cell growth was blunted and the EC50 value more than doubled.
Figure 6.
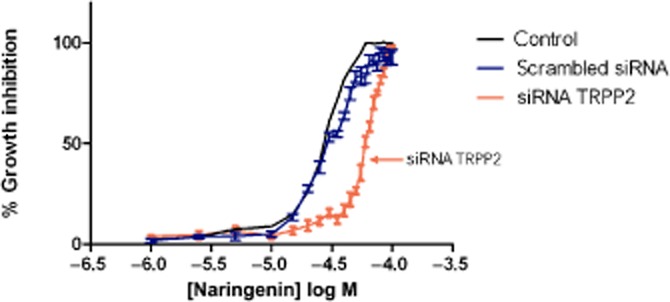
Reduced inhibition of MDCK cell growth transfected with TRPP2 siRNA by naringenin after 48 h. The growth of cells transfected with scrambled siRNA and treated with naringenin was unaffected. Cell viability was measured using the neutral red assay. Data are from three independent experiments showing mean and SEM (error bars not shown for clarity for control, untransfected cells).
Untransfected MDCK cells and cells transfected with TRPP2 siRNA, were then grown as cysts for 6 days after which naringenin (1–100 μM) was added for another 6 days (until day 12). Transfected cysts with knocked down TRPP2 were larger (both control and vehicle) than their untransfected counterparts, showing that reduced functional TRPP2 levels promotes cyst formation and growth. Transfected cysts were more resistant than control cysts (Figure 7C) to inhibition by naringenin at 10 μM and 30 μM after 6 days (at day 12). Naringenin at 100 μM progressively reduced cyst growth and cysts were absent at 12 days. Metformin (10 μM) also inhibited the growth of transfected cysts with no difference in activity compared with normal cysts, confirming the selectivity of TRPP2 siRNA treatment (Figure 7B).
Figure 7.

Transfection with siRNA TRPP2 protects cysts from the growth-inhibitory effects of naringenin. (A) Photomicrographs of transfected cysts treated from day 6 to day 12 with medium (control), 0.1% DMSO (vehicle control), naringenin 1–100 μM or metformin 10 μM. The shadows/lines in some images are of the gridlines used to identify the positions of the cysts. Scale bar is 50 μm. (B) Plot of cyst size showing effect of medium (control), DMSO 0.1% (vehicle control) or metformin (10 μM) on control and transfected cysts. (C) Plot of cyst size comparing effect of naringenin in control and transfected cysts. Data are from three independent experiments showing mean and SEM. Data from control cysts are replotted from Figure 4.
Lack of effect of naringenin on chloride secretion in MDCK monolayers
Naringenin has been reported to inhibit chloride secretion (in rat colon) at super-physiological concentrations (EC50 > 330 μM; Collins et al., 2011), while others have reported that it stimulates chloride secretion (Yang ZH et al., 2008). A reduction in cAMP-dependent chloride secretion is one method for reducing cyst growth (Li et al., 2004). We therefore performed experiments to determine the effect of naringenin on forskolin-induced chloride secretion measured as ISC (Figure 8). Monolayers were treated on both sides with naringenin (30 μM) or its vehicle (0.1% DMSO) followed by forskolin (20 μM, both sides). Forskolin increased ISC by 10.6 ± 3.1 μA·cm−2 (mean ± SEM, n = 6) in vehicle-treated monolayers, and by 11.6 ± 3.8 μA·cm−2 (n = 6) in naringenin-treated monolayers, with no significant difference between the means (P < 0.05, one-way anova). Ten minutes after addition of forskolin, ISC remained similar in vehicle-treated monolayers (2.0 ± 0.4 μA·cm−2, n = 6) and naringenin-treated monolayers (2.1 ± 0.5 μA·cm−2, n = 6, P < 0.05, one-way anova). Furosemide, an inhibitor of basolateral chloride uptake, added after the forskolin response began to decline, had little or no effect on ISC, indicating that the stimulation of chloride secretion by forskolin was transient in these cells.
Figure 8.
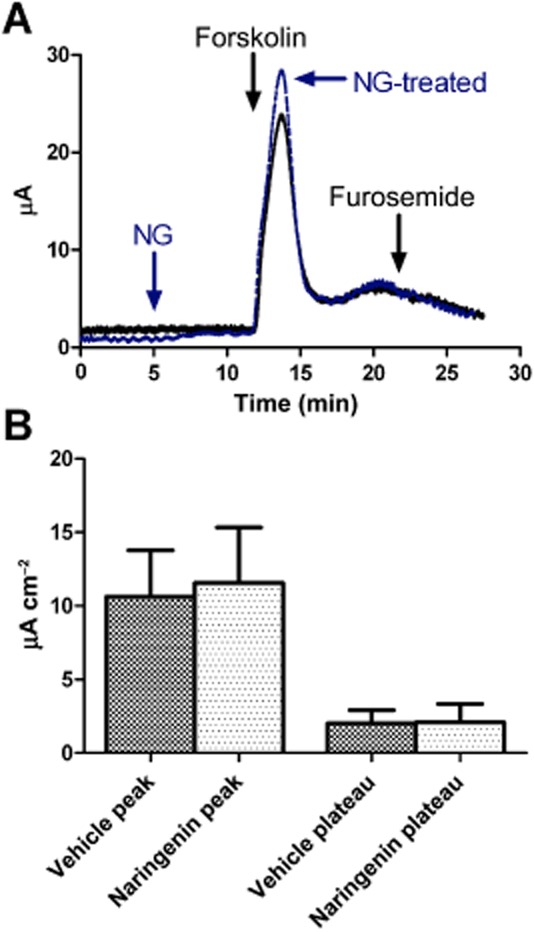
Effect of naringenin on cAMP-dependent chloride secretion. (A) Representative traces showing addition of naringenin (30 μM both sides) or vehicle (DMSO 0.1% both sides), forskolin (20 μM, both sides) and furosemide (100 μM, basolateral) on short-circuit current. (B) Summary data (mean ± SEM, n = 6) of effect of naringenin (NG) on forskolin-stimulated responses (peak and plateau, i.e. 10 min after forskolin).
Discussion and conclusions
Naringenin inhibits Dictyostelium growth via TRPP2
We show for the first time an inhibitory action of naringenin on renal tubule cell growth and cyst formation and demonstrate the involvement of TRPP2 in these processes. The identification of this effect and mechanism came from the use of Dictyostelium as a model organism for pharmacogenetics. In our experiments, naringenin inhibited Dictyostelium growth with an EC50 value of between 50 and 100 μM, higher than the previously reported value of 20 μM (Russ et al., 2006). Naringenin attenuated cell behaviour (shape, pseudopod formation, random cell movement) after 60 min treatment. The inhibitory effect of naringenin was conferred by the expression of the TRPP2 protein, because the pkd2− mutant was insensitive to naringenin-dependent reduction in cell behaviour. In another study, other flavonoids (quercitin, chrysin) including the related compound apigenin (4′,5,7-trihydroxyflavone; naringenin is 4′,5,7-trihydroxyflavanone) had no effect on Dictyostelium proliferation (Russ et al., 2006), suggesting a degree of structural specificity for naringenin presumably through a TRPP2-dependent effect.
Although a mechanism for how TRPP2 regulates Dictyostelium cell behaviour is unclear, a role for calcium signalling in Dictyostelium has been reported before (Schlatterer and Malchow, 1993; Unterweger and Schlatterer, 1995; Fache et al., 2005). These studies showed that a decrease in extracellular calcium levels instantly decreased cell speed and induced a loss of cell attachment with the substratum caused by loss of intracellular cell structure (Fache et al., 2005), consistent with our findings of a naringenin-induced alteration of cytoskeletal structure and block of cell behaviour. In addition, chelating intracellular calcium by loading with BAPTA also prevented cell movement and pseudopod emission (Schlatterer and Malchow, 1993; Unterweger and Schlatterer, 1995). The role of a potential pkd1 protein (TRPP1) in Dictyostelium (DDB_G0289409) can also be considered in future studies.
Naringenin inhibits renal cell growth via TRPP2
Growth of renal MDCK cells and cysts was inhibited by naringenin at similar EC50 values (cysts 10 μM, cells 28 μM) to Dictyostelium (50 μM). We confirmed that TRPP2 was expressed in MDCK cells and siRNA knockdown of this protein indicated that TRPP2 also regulated the growth-inhibitory action of naringenin in these mammalian cells. Knockdown of TRPP2 in MDCK cells increased resistance to the concentration of naringenin required to reduce cyst growth.
TRPP2 has a number of roles in mammalian cells, and in kidney tubule cells where it is most studied. TRPP2 or polycystin-2 is a member of the TRP family of ion channels, and is a Ca2+-permeable non-selective cation channel (González-Perrett et al., 2001; Menè et al., 2013) located in the endoplasmic reticulum (ER; Koulen et al., 2002) and in the primary cilium (Abdul-Majeed and Nauli, 2011). Shear stress bends the primary cilium and TRPP2 (bound in a complex with TRPP1) admits Ca2+ into the cytoplasm. The influx of Ca2+ stimulates Ca2+ release via TRPP2 on the ER and elevates intracellular Ca2+ concentration, with important consequences for growth. Ca2+ stimulates PDE and keeps cAMP low, suppressing the Ras/Raf/MEK/ERK pathway of cyst proliferation. When TRPP1 or TRPP2 is disrupted, as in mutations of the corresponding genes PKD1 and PKD2 in PKD, then flow-sensitive Ca2+ influx is reduced, cAMP is elevated and the Ras/Raf/MEK/ERK pathway stimulated, leading to cyst proliferation (Abdul-Majeed and Nauli, 2011).
We propose that naringenin may activate TRPP2 to cause Ca2+ influx and a decrease in cellular proliferation. Naringenin has been shown to regulate other channels such as the large conductance (BK) K+ channels in vascular myocytes causing vasorelaxation (Saponara et al., 2006). The possibility that naringenin binds and opens TRPP2, with downstream growth-inhibitory effects, is therefore intriguing and novel.
The TRPP1/TRPP2 complex has other reported effects on growth regulation, and through a diverse range of signalling pathways in addition to Ca2+ and cAMP, for example: the mammalian target of rapamycin (mTOR; to decrease cell size and protein synthesis), STAT1/3 (to decrease cell growth and division via p21/cdkc2 inhibition of the cell cycle), G-protein regulated pathways of differentiation, apoptosis and proliferation, and the β-catenin/Wnt pathway for gene expression and differentiation (Chapin and Caplan, 2010). One interesting mechanism is the binding of TRPP2 to the pro-proliferative transcription factor, Id2. In this model of ADPKD genesis, mutations to TRPP2 allow Id2 to enter the nucleus and turn off growth-suppressive genes (Li et al., 2005). A similar mechanism is proposed for TRPP2 in the promotion of phospho-ERK-meditated eIF2α phosphorylation, which down-regulates cell growth (Liang et al., 2008). The role(s) of these pathways in the actions of naringenin requires further investigation.
It is important to note that naringenin was as potent at inhibiting cyst growth as metformin and that the activity of the latter was unaffected by the transfection procedure. Metformin activates AMPK, a kinase that controls growth and metabolism, in part via the actions of mTOR, which is required for growth (Takiar et al., 2011). In addition, AMPK inhibits apical cystic fibrosis transmembrane conductance regulator (CFTR) channels required for Cl− secretion (Takiar et al., 2011; Li et al., 2012). Metformin therefore inhibits both cystogenesis and chloride secretion and is a potential drug development candidate for ADPKD.
Naringenin does not inhibit Cl− secretion
Other flavonoids (e.g. genistein and apigenin) modulate CFTR-mediated transepithelial chloride secretion (Li et al., 2004). However, while forskolin stimulated a transient increase in ISC in MDCK cells, in agreement with a previous report (Simmons, 1991), naringenin had no significant effect on ISC or on the response to forskolin. These data indicate that the reduction in cyst growth was not due to a reduction in cAMP-dependent chloride secretion.
Currently there are no approved clinical therapies for the treatment of PKD (Calvet, 2008; Takiar and Caplan, 2011). Tolvaptan, a vasopressin V2 receptor antagonist, which is used to reduce cAMP-dependent fluid secretion, reduced the decline in kidney function in patients with ADPKD, but adverse effects led to a high level of discontinuation (Torres et al., 2012). Other more experimental strategies include inhibition of CFTR by metformin or direct channel blockers (again to prevent fluid secretion into cysts; Li et al., 2004; Yang B et al., 2008; Takiar et al., 2011); inhibition of mTOR by metformin (Takiar and Caplan, 2011) and inhibition of B-Raf as the crucial point in the MEK/ERK pathway (Calvet, 2008; Takiar and Caplan, 2011). Our results allow us to speculate about a potential use for naringenin in ADPKD treatment. In the minority (15%) of ADPKD patients where TRPP2 function is lost, naringenin would presumably have no effect. In the majority of ADPKD cases, where TRPP1 function is absent (but TRPP2 is present), naringenin could potentially activate TRPP2 to inhibit cyst growth in these patients, providing a novel therapeutic approach for ADPKD treatment. Further study of naringenin as a drug for the treatment of ADPKD is now required.
Acknowledgments
This work was funded by a grant awarded jointly to DB, MAC and RSBW from the SouthWest Academic Network (SWAN), a research collaboration between Kingston University, St George's, and Royal Holloway, University of London. Thanks to Dictybase.org for genome analysis facility. We thank Dr Mark Dockrell, South West Thames Renal Institute, for helpful comments on the original paper. MHRL and SR were funded by PhD studentships from Alzheimer's Research UK and UFAW respectively, both to RSBW. Some of the work for the revised manuscript was performed by AW at his current address, in the laboratory of Dr Rita Jabr and Professor Chris Fry (Department of Biochemistry and Physiology, University of Surrey), to whom we are very grateful.
Glossary
- ADPKD
autosomal dominant polycystic kidney disease
- PKD
polycystic kidney disease
- PKD1
the gene-encoding TRPP1 in humans;
- pkd1
the gene-encoding TRPP1 in Dictyostelium
- PKD2
the gene-encoding TRPP2 in humans
- pkd2
the gene-encoding TRPP2 in Dictyostelium
- pkd2−
the Dictyostelium mutant lacking the pkd2 gene
Conflict of interest
The authors have no conflicts of interest.
Supporting information
Additional Supporting Information may be found in the online version of this article at the publisher's web-site: http://dx.doi.org/10.1111/bph.12443
Figure S1 Dictyostelium REMI mutants identified in a growth screen where cells were exposed to naringenin (200 μM) over 21 days. Genes are identified by individual dictybase identifier, gene name (where available) and potential protein functions.
Figure S2 The Dictyostelium TRPP2 (polycystein-2) like protein (DDB_G0272999) showed a similar domain structure to the human TRPP2 protein, although it lacked a clearly defined coiled-coil domain.
Figure S3 Alignment of TRPP2 proteins Dictyostelium and humans. The Dictyostelium TRPP2 protein (DDB_G0272999), human polycystic kidney disease 2-like 1 protein isoform 2 (Hs_TRPP3; NP_001240766) and human polycystic kidney disease type II protein (Hs_TRPP2_V1; AAC16004) were aligned using ClustalW. This alignment shows that the N-terminal region of TRPP2 conserved in animal species and associated with cilial targeting of the protein is not conserved in the Dictyostelium protein (Geng L etal., 2006). The GSK-3 dependent phosphorylation site S76 (Streets etal., 2006), the casine kinase 2 phosphorylation site at S812, responsible for restricting protein localisation to the ER and cilia (Cai et al., 2004), and the PKD-dependent phosphorylation site, S801 (Streets et al., 2010; all highlighted), are also not conserved in the Dictyostelium protein.
Figure S4 The Dictyostelium pkd2- mutant was recapitulated in wild-type cells by the construction of a knockout vector with the central coding region of the pkd2 gene replaced by a blasticidin resistance cassette (BsR). Homologous integration of this cassette into wild-type cells and screening by PCR for genomic (G), Vector (V) and knockout (KO) PCR products for the 5′ and 3′ targeting region identified independent pkd2-mutants.
Figure S5 Ablation of Dictyostelium the pkd2 gene provides resistance to naringenin during growth. Dictyostelium cells grown in still culture over a 72 h period show reduced proliferation in the presence of naringenin (100 μM). Ablation of pkd2 slows growth in these cells under control conditions, but cells do not show a further reduction in growth in the presence of naringenin (100 μM) suggesting resistance to naringenin during growth.
Wild-type Dictyostelium cell movement. Dictyostelium wild-type (A×2) cells, were induced to chemotax by repeated pulsing with cAMP over a 5 h period, and random cell movement was monitored by time-lapse photography, capturing one image every 15 s for 5 min. Cell behaviour was quantified by computer-generated outlines that are used to calculate average cell shape (circularity), protrusion formation and motility.
Wild-type Dictyostelium cell movement following naringenin treatment. Dictyostelium wild-type (A×2) cells, were induced to chemotax by repeated pulsing with cAMP over a 5 h period, and then exposed to 200 mM naringenin for 60 min, and random cell movement was monitored by time-lapse photography, capturing one image every 15 s for 5 min. Cell behaviour was quantified by computer-generated outlines that are used to calculate average cell shape (circularity), protrusion formation and motility.
pkd2-Dictyostelium cell movement. Dictyostelium wild-type (A×2) cells, were induced to chemotax by repeated pulsing with cAMP over a 5 h period, and random cell movement was monitored by time-lapse photography, capturing one image every 15 s for 5 min. Cell behaviour was quantified by computer-generated outlines that are used to calculate average cell shape (circularity), protrusion formation and motility.
pkd2-Dictyostelium cell movement following naringenin treatment. Dictyostelium wild-type (A×2) cells, were induced to chemotax by repeated pulsing with cAMP over a 5 h period, and then exposed to 200 mM naringenin for 60 min, and random cell movement was monitored by time-lapse photography, capturing one image every 15 s for 5 min. Cell behaviour was quantified by computer-generated outlines that are used to calculate average cell shape (circularity), protrusion formation and motility.
References
- Abdul-Majeed S, Nauli SM. Calcium-mediated mechanisms of cystic expansion. Biochim Biophys Acta. 2011;1812:1281–1290. doi: 10.1016/j.bbadis.2010.09.016. [DOI] [PMC free article] [PubMed] [Google Scholar]
- Adachi H, Hasebe T, Yoshinaga K, Ohta T, Sutoh K. Isolation of Dictyostelium discoideum cytokinesis mutants by restriction enzyme-mediated integration of the blasticidin S resistance marker. Biochem Biophys Res Commun. 1994;205:1808–1814. doi: 10.1006/bbrc.1994.2880. [DOI] [PubMed] [Google Scholar]
- Alexander SPH, Benson HE, Faccenda E, Pawson AJ, Sharman JL, Catterall WA, Spedding M, Peters JA, Harmar AJ CGTP Collaborators. The Concise Guide to PHARMACOLOGY 2013/14: Overview. Br J Pharmacol. 2013;170:1449–1867. doi: 10.1111/bph.12447. [DOI] [PMC free article] [PubMed] [Google Scholar]
- Calvet JP. Strategies to inhibit cyst formation in ADPKD. Clin J Am Soc Nephrol. 2008;3:1205–1211. doi: 10.2215/CJN.05651207. [DOI] [PubMed] [Google Scholar]
- Chang P, Orabi B, Deranieh RM, Dham M, Hoeller O, Shimshoni JA, et al. The antiepileptic drug valproic acid and other medium-chain fatty acids acutely reduce phosphoinositide levels independently of inositol in Dictyostelium. Dis Model Mech. 2012;5:115–124. doi: 10.1242/dmm.008029. [DOI] [PMC free article] [PubMed] [Google Scholar]
- Chapin H, Caplan M. The cell biology of polycystic kidney disease. J Cell Biol. 2010;191:701–710. doi: 10.1083/jcb.201006173. [DOI] [PMC free article] [PubMed] [Google Scholar]
- Collins D, Kopic S, Geibel JP, Hogan AM, Medani M, Baird AW, et al. The flavonone naringenin inhibits chloride secretion in isolated colonic epithelia. Eur J Pharmacol. 2011;668:271–277. doi: 10.1016/j.ejphar.2011.06.052. [DOI] [PubMed] [Google Scholar]
- Erlund I, Meririnne E, Alfthan G, Aro A. Plasma kinetics and urinary excretion of the flavanones naringenin and hesperetin in humans after ingestion of orange juice and grapefruit juice. J Nutr. 2001;131:235–241. doi: 10.1093/jn/131.2.235. [DOI] [PubMed] [Google Scholar]
- Fache S, Dalous J, Engelund M, Hansen C, Chamaraux F, Fourcade B, et al. Calcium mobilization stimulates Dictyostelium discoideum shear-flow-induced cell motility. J Cell Sci. 2005;118:3445–3457. doi: 10.1242/jcs.02461. [DOI] [PubMed] [Google Scholar]
- González-Perrett S, Kim K, Ibarra C, Damiano AE, Zotta E, Batelli M, et al. Polycystin-2, the protein mutated in autosomal dominant polycystic kidney disease (ADPKD), is a Ca2+-permeable nonselective cation channel. Proc Natl Acad Sci USA. 2001;98:1182–1187. doi: 10.1073/pnas.98.3.1182. [DOI] [PMC free article] [PubMed] [Google Scholar]
- Kale A, Gawande S, Kotwal S. Cancer phytotherapeutics: role for flavonoids at the cellular level. Phytother Res. 2008;22:567–577. doi: 10.1002/ptr.2283. [DOI] [PubMed] [Google Scholar]
- Koulen P, Cai Y, Geng L, Maeda Y, Nishimura S, Witzgall R, et al. Polycystin-2 is an intracellular calcium release channel. Nat Cell Biol. 2002;4:191–197. doi: 10.1038/ncb754. [DOI] [PubMed] [Google Scholar]
- Kuspa A. Restriction enzyme-mediated integration (REMI) mutagenesis. Methods Mol Biol. 2006;346:201–209. doi: 10.1385/1-59745-144-4:201. [DOI] [PubMed] [Google Scholar]
- Leonardi T, Vanamala J, Taddeo SS, Davidson LA, Murphy ME, Patil BS, et al. Apigenin and naringenin suppress colon carcinogenesis through the aberrant crypt stage in azoxymethane-treated rats. Exp Biol Med. 2010;235:710–717. doi: 10.1258/ebm.2010.009359. [DOI] [PMC free article] [PubMed] [Google Scholar]
- Li H, Findlay IA, Sheppard DN. The relationship between cell proliferation, Cl− secretion, and renal cyst growth: a study using CFTR inhibitors. Kidney Int. 2004;66:1926–1938. doi: 10.1111/j.1523-1755.2004.00967.x. [DOI] [PubMed] [Google Scholar]
- Li H, Yang W, Mendes F, Amaral MD, Sheppard DN. Impact of the cystic fibrosis mutation F508del-CFTR on renal cyst formation and growth. Am J Physiol Renal Physiol. 2012;303:F1176–F1186. doi: 10.1152/ajprenal.00130.2012. [DOI] [PubMed] [Google Scholar]
- Li X, Luo Y, Starremans PG, McNamara CA, Pei Y, Zhou J. Polycystin-1 and polycystin-2 regulate the cell cycle through the helix-loop-helix inhibitor Id2. Nat Cell Biol. 2005;7:1202–1212. doi: 10.1038/ncb1326. [DOI] [PubMed] [Google Scholar]
- Liang G, Yang JW, Wang Z, Li Q, Tang Y, Chen X-Z. Polycystin-2 down-regulates cell proliferation via promoting PERK-dependent phosphorylation of eIF2. Hum Mol Genet. 2008;17:3254–3262. doi: 10.1093/hmg/ddn221. [DOI] [PubMed] [Google Scholar]
- Manach C, Williamson G, Morand C, Scalbert A, Rémésy C. Bioavailability and bioefficacy of polyphenols in humans. I. Review of 97 bioavailability studies. Am J Clin Nutr. 2005;81:230S–242S. doi: 10.1093/ajcn/81.1.230S. [DOI] [PubMed] [Google Scholar]
- Meiyanto E, Hermawan A, Anindyajati A. Natural products for cancer-targeted therapy: citrus flavonoids as potent chemopreventive agents. Asian Pac J Cancer Prev. 2012;13:427–436. doi: 10.7314/apjcp.2012.13.2.427. [DOI] [PubMed] [Google Scholar]
- Menè P, Punzo G, Pirozzi N. TRP channels as therapeutic targets in kidney disease and hypertension. Curr Top Med Chem. 2013;13:386–397. doi: 10.2174/1568026611313030013. [DOI] [PubMed] [Google Scholar]
- Moon YJ, Wang X, Morris ME. Dietary flavonoids: effects on xenobiotic and carcinogen metabolism. Toxicol in Vitro. 2006;20:187–210. doi: 10.1016/j.tiv.2005.06.048. [DOI] [PubMed] [Google Scholar]
- Pakes NK, Veltman DM, Rivero F, Nasir J, Insall R, Williams RS. The Rac GEF ZizB regulates development, cell motility and cytokinesis in Dictyostelium. J Cell Sci. 2012;125:2457–2465. doi: 10.1242/jcs.100966. [DOI] [PubMed] [Google Scholar]
- Repetto G, del Peso A, Zurita JL. Neutral red uptake assay for the estimation of cell viability/cytotoxicity. Nat Protoc. 2008;3:1125–1131. doi: 10.1038/nprot.2008.75. [DOI] [PubMed] [Google Scholar]
- Robery S, Mukanowa J, Percie du Sert N, Andrews PL, Williams RS. Investigating the effect of emetic compounds on chemotaxis in Dictyostelium identifies a non-sentient model for bitter and hot tastant research. PLoS ONE. 2011;6:e24439. doi: 10.1371/journal.pone.0024439. [DOI] [PMC free article] [PubMed] [Google Scholar]
- Russ R, Martinez R, Ali H, Steimle PA. Naringenin is a novel inhibitor of Dictyostelium cell proliferation and cell migration. Biochem Biophys Res Commun. 2006;345:516–522. doi: 10.1016/j.bbrc.2006.04.047. [DOI] [PubMed] [Google Scholar]
- Saponara S, Testai L, Iozzi D, Martinotti E, Martelli A, Chericoni S, et al. (+/–)-Naringenin as large conductance Ca2+-activated K+ (BKCa) channel opener in vascular smooth muscle cells. Br J Pharmacol. 2006;149:1013–1021. doi: 10.1038/sj.bjp.0706951. [DOI] [PMC free article] [PubMed] [Google Scholar]
- Scheffers MS, van der Bent P, Prins F, Spruit L, Breuning MH, Litvinov SV, et al. Polycystin-1, the product of the polycystic kidney disease 1 gene, co-localizes with desmosomes in MDCK cells. Hum Mol Genet. 2000;9:2743–2750. doi: 10.1093/hmg/9.18.2743. [DOI] [PubMed] [Google Scholar]
- Scheffers MS, Le H, van der Bent P, Leonhard W, Prins F, Spruit L, et al. Distinct subcellular expression of endogenous polycystin-2 in the plasma membrane and Golgi apparatus of MDCK cells. Hum Mol Genet. 2002;11:59–67. doi: 10.1093/hmg/11.1.59. [DOI] [PubMed] [Google Scholar]
- Schlatterer C, Malchow D. Intercellular guanosine-5′-0-(3-thiotriphosphate) blocks chemotactic motility of Dictyostelium discoideum amoebae. Cell Motil Cytoskeleton. 1993;25:298–307. doi: 10.1002/cm.970250309. [DOI] [PubMed] [Google Scholar]
- Schneider CA, Rasband WS, Eliceiri KW. NIH Image to ImageJ: 25 years of image analysis. Nat Methods. 2012;9:671–675. doi: 10.1038/nmeth.2089. [DOI] [PMC free article] [PubMed] [Google Scholar]
- Simmons NL. Chloride secretion stimulated by prostaglandin E1 and by forskolin in a canine renal epithelial cell line. J Physiol. 1991;432:459–472. doi: 10.1113/jphysiol.1991.sp018394. [DOI] [PMC free article] [PubMed] [Google Scholar]
- Sussman M. Cultivation and synchronous morphogenesis of Dictyostelium under controlled experimental conditions. Methods Cell Biol. 1987;28:9–29. doi: 10.1016/s0091-679x(08)61635-0. [DOI] [PubMed] [Google Scholar]
- Takiar V, Caplan MJ. Polycystic kidney disease: pathogenesis and potential therapies. Biochim Biophys Acta. 2011;1812:1337–1343. doi: 10.1016/j.bbadis.2010.11.014. [DOI] [PMC free article] [PubMed] [Google Scholar]
- Takiar V, Nishio S, Seo-Mayer P, King JD, Jr, Li H, Zhang L, et al. Activating AMP-activated protein kinase (AMPK) slows renal cystogenesis. Proc Natl Acad Sci USA. 2011;108:2462–2467. doi: 10.1073/pnas.1011498108. [DOI] [PMC free article] [PubMed] [Google Scholar]
- Terbach N, Shah R, Kelemen R, Klein PS, Gordienko D, Brown NA, et al. Identifying an uptake mechanism for the antiepileptic and bipolar disorder treatment valproic acid using the simple biomedical model Dictyostelium. J Cell Sci. 2011;124:2267–2276. doi: 10.1242/jcs.084285. [DOI] [PMC free article] [PubMed] [Google Scholar]
- Terryn S, Ho A, Beauwens R, Devuyst O. Fluid transport and cystogenesis in autosomal dominant polycystic kidney disease. Biochim Biophys Acta. 2011;1812:1314–1321. doi: 10.1016/j.bbadis.2011.01.011. [DOI] [PubMed] [Google Scholar]
- Torres VE, Chapman AB, Devuyst O, Gansevoort RT, Grantham JJ, Higashihara E, et al. Tolvaptan in patients with autosomal dominant polycystic kidney disease. N Engl J Med. 2012;367:2407–2418. doi: 10.1056/NEJMoa1205511. [DOI] [PMC free article] [PubMed] [Google Scholar]
- Tyson RA, Epstein DBA, Anderson KI, Bretschneider T. High resolution tracking of cell membrane dynamics in moving cells: an electrifying approach. Math Model Nat Phenom. 2010;5:34–55. [Google Scholar]
- Unterweger N, Schlatterer C. Introduction of calcium buffers into the cytosol of Dictyostelium discoideum amoebae alters cell morphology and inhibits chemotaxis. Cell Calcium. 1995;17:97–110. doi: 10.1016/0143-4160(95)90079-9. [DOI] [PubMed] [Google Scholar]
- Vassilev PM, Guo L, Chen XZ, Segal Y, Peng JB, Basora N, et al. Polycystin-2 is a novel cation channel implicated in defective intracellular Ca2+ homeostasis in polycystic kidney disease. Biochem Biophys Res Commun. 2001;282:341–350. doi: 10.1006/bbrc.2001.4554. [DOI] [PubMed] [Google Scholar]
- Wang Q, Dai XQ, Li Q, Wang Z, Cantero MdR, Li LS, et al. Structural interaction and functional regulation of polycystin-2 by filamin. PLoS ONE. 2012;7:e40448. doi: 10.1371/journal.pone.0040448. [DOI] [PMC free article] [PubMed] [Google Scholar]
- Weng CJ, Yen GC. Flavonoids, a ubiquitous dietary phenolic subclass, exert extensive in vitro anti-invasive and in vivo anti-metastatic activities. Cancer Metastasis Rev. 2012;31:323–351. doi: 10.1007/s10555-012-9347-y. [DOI] [PubMed] [Google Scholar]
- Williams RS, Boeckeler K, Gräf R, Müller-Taubenberger A, Li Z, Isberg RR, et al. Towards a molecular understanding of human diseases using Dictyostelium discoideum. Trends Mol Med. 2006;12:415–424. doi: 10.1016/j.molmed.2006.07.003. [DOI] [PubMed] [Google Scholar]
- Yang B, Sonawane ND, Zhao D, Somlo S, Verkman AS. Small-molecule CFTR inhibitors slow cyst growth in polycystic kidney disease. J Am Soc Nephrol. 2008;19:1300–1310. doi: 10.1681/ASN.2007070828. [DOI] [PMC free article] [PubMed] [Google Scholar]
- Yang ZH, Yu HJ, Pan A, Du JY, Ruan YC, Ko WH, et al. Cellular mechanisms underlying the laxative effect of flavonol naringenin on rat constipation model. PLoS ONE. 2008;3:e3348. doi: 10.1371/journal.pone.0003348. [DOI] [PMC free article] [PubMed] [Google Scholar]
Associated Data
This section collects any data citations, data availability statements, or supplementary materials included in this article.
Supplementary Materials
Figure S1 Dictyostelium REMI mutants identified in a growth screen where cells were exposed to naringenin (200 μM) over 21 days. Genes are identified by individual dictybase identifier, gene name (where available) and potential protein functions.
Figure S2 The Dictyostelium TRPP2 (polycystein-2) like protein (DDB_G0272999) showed a similar domain structure to the human TRPP2 protein, although it lacked a clearly defined coiled-coil domain.
Figure S3 Alignment of TRPP2 proteins Dictyostelium and humans. The Dictyostelium TRPP2 protein (DDB_G0272999), human polycystic kidney disease 2-like 1 protein isoform 2 (Hs_TRPP3; NP_001240766) and human polycystic kidney disease type II protein (Hs_TRPP2_V1; AAC16004) were aligned using ClustalW. This alignment shows that the N-terminal region of TRPP2 conserved in animal species and associated with cilial targeting of the protein is not conserved in the Dictyostelium protein (Geng L etal., 2006). The GSK-3 dependent phosphorylation site S76 (Streets etal., 2006), the casine kinase 2 phosphorylation site at S812, responsible for restricting protein localisation to the ER and cilia (Cai et al., 2004), and the PKD-dependent phosphorylation site, S801 (Streets et al., 2010; all highlighted), are also not conserved in the Dictyostelium protein.
Figure S4 The Dictyostelium pkd2- mutant was recapitulated in wild-type cells by the construction of a knockout vector with the central coding region of the pkd2 gene replaced by a blasticidin resistance cassette (BsR). Homologous integration of this cassette into wild-type cells and screening by PCR for genomic (G), Vector (V) and knockout (KO) PCR products for the 5′ and 3′ targeting region identified independent pkd2-mutants.
Figure S5 Ablation of Dictyostelium the pkd2 gene provides resistance to naringenin during growth. Dictyostelium cells grown in still culture over a 72 h period show reduced proliferation in the presence of naringenin (100 μM). Ablation of pkd2 slows growth in these cells under control conditions, but cells do not show a further reduction in growth in the presence of naringenin (100 μM) suggesting resistance to naringenin during growth.
Wild-type Dictyostelium cell movement. Dictyostelium wild-type (A×2) cells, were induced to chemotax by repeated pulsing with cAMP over a 5 h period, and random cell movement was monitored by time-lapse photography, capturing one image every 15 s for 5 min. Cell behaviour was quantified by computer-generated outlines that are used to calculate average cell shape (circularity), protrusion formation and motility.
Wild-type Dictyostelium cell movement following naringenin treatment. Dictyostelium wild-type (A×2) cells, were induced to chemotax by repeated pulsing with cAMP over a 5 h period, and then exposed to 200 mM naringenin for 60 min, and random cell movement was monitored by time-lapse photography, capturing one image every 15 s for 5 min. Cell behaviour was quantified by computer-generated outlines that are used to calculate average cell shape (circularity), protrusion formation and motility.
pkd2-Dictyostelium cell movement. Dictyostelium wild-type (A×2) cells, were induced to chemotax by repeated pulsing with cAMP over a 5 h period, and random cell movement was monitored by time-lapse photography, capturing one image every 15 s for 5 min. Cell behaviour was quantified by computer-generated outlines that are used to calculate average cell shape (circularity), protrusion formation and motility.
pkd2-Dictyostelium cell movement following naringenin treatment. Dictyostelium wild-type (A×2) cells, were induced to chemotax by repeated pulsing with cAMP over a 5 h period, and then exposed to 200 mM naringenin for 60 min, and random cell movement was monitored by time-lapse photography, capturing one image every 15 s for 5 min. Cell behaviour was quantified by computer-generated outlines that are used to calculate average cell shape (circularity), protrusion formation and motility.