

SUMMARY
In mice, clonal tracking of hematopoietic stem cells has revealed variations in repopulation characteristics. However, it is unclear whether similar properties apply in primates. Here, we examined this issue through tracking of thousands of hematopoietic stem and progenitor cells (HSPCs) in rhesus macaques for up to 12 years. Approximately half of the clones analyzed contributed to long-term repopulation (over 3–10 years) and likely represent self-renewing hematopoietic stem cells (HSCs), while the remainder contributed primarily for the first year. The long-lived clones could be further subdivided into functional groups contributing primarily to myeloid, lymphoid or both lineages. Over time, the 4–10% of clones with robust dual lineage contribution predominated in repopulation capacity. HSPCs expressing a CCR5 shRNA transgene behaved similarly to controls. Our study therefore documents HSPC behavior in a clinically-relevant model over a long time frame, and provides a substantial system-level dataset that is a reference point for future work.
INTRODUCTION
Blood is a highly regenerative, multi-functional tissue and a relatively small population of self-renewing hematopoietic stem cells (HSCs) can regenerate all blood cell types for the lifetime of the host (Kondo et al., 2003). Transplant of HSCs exploits these properties for treatment of various human diseases and as a means to gene-modify hematopoietic cells for genetic therapies (Kohn and Candotti, 2009; Weissman, 2000). Repopulation following transplant occurs through the combined engraftment, growth, and differentiation of a large number of hematopoietic stem and progenitor cells (HSPCs) including self-renewing HSCs as well as more differentiated and lineage committed progenitor cells, yet, the individual and cumulative behavior of the HSPCs at the system-level is not well understood. Murine models have provided valuable insights into the regenerative potentials of HSCs, having the benefit of established assays for purification of HSC from among the diverse HSPCs in the bone marrow(Purton and Scadden, 2007). Historically, HSCs have been presumed to be biologically homogeneous and possess an unlimited self-renewal potential. More recently, however, single-cell studies have reported significant cell-to-cell variations in repopulation kinetics, life span, and sensitivity to extracellular stimuli (Benveniste et al., 2010; Copley et al., 2012; Jordan and Lemischka, 1990; McKenzie et al., 2006; Morita et al., 2010; Muller-Sieburg et al., 2002; Osawa et al., 1996; Pina et al., 2012; Smith et al., 1991). Interestingly, even the multipotent behavior of HSCs has recently been shown to vary with some HSCs being biased towards either myeloid or lymphoid lineages (Copley et al., 2012; Lu et al., 2011; Muller-Sieburg et al., 2012). Unlike the extensive polyclonal repopulation seen in primates, murine studies demonstrated the behaviors of a single or a few repopulating clones per mouse(Copley et al., 2012; Jordan and Lemischka, 1990; Lemischka et al., 1986; Muller-Sieburg et al., 2012; Smith et al., 1991). Some recent studies have investigated oligoclonal repopulation (dozens of clones) in mice (Cornils et al., 2012; Gerrits et al., 2010; Lu et al., 2011; Naik et al., 2013; Verovskaya et al., 2013), nevertheless, translating these studies into understanding human repopulation is limited because of the far greater complexity of polyclonal reconstitution as well as the greater demands placed on stem cells within the larger and longer-lived human system. Thus, despite the significant advances in our understanding of the HSC biology from murine models, the functional properties of primate HSPCs following transplant remain poorly characterized.
All current transplant protocols for humans and non-human primate models utilize partially purified CD34+ cell populations of which only a small proportion represent true HSCs. Since purification of primate HSCs is not as yet technically feasible, the primary method utilized to track repopulation in transplant for human diseases has been through the use of integrating retroviral vectors that “mark” individual HSPC through differential semi-random genomic integration sites. In early clinical studies, the use of gamma-retroviral vectors skewed repopulation due to insertional mutagenesis often resulting in malignant transformation (Hacein-Bey-Abina et al., 2010; Nienhuis et al., 2006; Stein et al., 2010). More recent clinical trials using lentiviral vectors have tracked repopulation without obvious genotoxic effects, revealing long-term repopulation by thousands of gene engineered cells(Aiuti et al., 2013; Biffi et al., 2013; Cartier et al., 2009; Cavazzana-Calvo et al., 2010). These studies showed that the early phase of the hematopoietic reconstitution in patients (1.5–2 years) was achieved by a large number of low-frequency clones, many of which transiently contributed to the blood. However, the long-term behavior patterns of the vast number of HSPCs working together to reconstitute the complex polyclonal hematopoietic system remain unclear. It is also important to note that human clinical studies may not be the best setting to study normal HSPC repopulation since for ethical reasons all such studies are in the context of a diseased hematopoietic system and the introduction of disease-corrective transgenes may provide favorable repopulation by the gene-corrected HSPCs.
The non-human primate autologous HSPC transplant model is arguably the animal model most closely resembling humans; its treatment conditions – including the use of CD34+ cells, and mobilization and conditioning regimens – all parallel those of human(Heim and Dunbar, 2000; Shi et al., 2002). We previously demonstrated long-term stable hematopoietic reconstitution in rhesus macaques after transplantation of autologous CD34+ HSPCs transduced with lentiviral vectors (An et al., 2007; An et al., 2001; Sander et al., 2006). These animals maintained stable long-term marking for as long as 12 years without any genotoxic effects resulting from transplant. The behavior of HSPC clones at the system-level were characterized using a deep-sequencing-based clonal tracking assay(Kim et al., 2010) which can quantify a large number of individual clones in parallel by VIS sequence enumeration. We observed that thousands of HSPCs engrafted, and they maintained long-term hematopoiesis at a constant level through sequential expansions of different groups of clones. High-throughput, long-term clonal tracking in our test animals revealed high variability in HSCs for their lineage outputs, including myeloid-biased, lymphoid-biased, and balanced subtypes.
RESULTS
Long-term Stable Marking after CD34+ HSPC Transplantation
The subjects of this study were four rhesus macaques transplanted with autologous CD34+ HSPCs from mobilized peripheral blood (mPB) after a myeloablative dosage of total body irradiation for periods of 4 to 12 years(An et al., 2007; An et al., 2001; Sander et al., 2006). Long-term repopulation of HSPC in two animals (95E132 and 2RC003) was analyzed after transplant with CD34+ cells marked with lentiviral vectors [human immunodeficiency virus (HIV)-based, self-inactivating (SIN-HIV) vectors expressing EGFP] (An et al., 2001; Sander et al., 2006). As a model of genetic therapy for HIV-1 disease, two other animals (RQ3570 and RQ5427) were transplanted with CD34+ HSPCs engineered with simian immunodeficiency virus (SIV)-based vectors expressing both EGFP and shRNA against the HIV-1 co-receptor, C-C chemokine receptor type 5 (CCR5) (An et al., 2007). The potency and safety of the shRNA (sh1005), selected from hundreds of other candidates, was previously demonstrated both in vivo and in vitro (Shimizu et al., 2010; Shimizu et al., 2009). Animal 2RC003 was co-transplanted with CD34+ HSPCs transduced with SIN-HIV vectors expressing the mutant herpes simplex virus-1 thymidine kinase (HSV1-sr39tk) gene for position emission tomography (Sander et al., 2006). These HSV1-sr39tk expressing cells repopulated at 0.01–0.2% of total blood for the first year and were removed by the ganciclovir IV treatment at 23 months post-transplant. In all animals, the lymphocyte recovery was slower than the granulocytes or the monocytes. After an initial phase of fluctuation for about 6–12 months, all tested blood lineages showed stable marking over the long-term (Fig. 1). To date, all animals remain healthy, with no sign of malignant transformation.
Figure 1. Longitudinal EGFP Marking in Four Rhesus Macaques.

The levels of EGFP expression in granulocytes (Grans; green), monocytes (Monos; brown), lymphocytes (Lymphs; red), red blood cells (RBC; purple), and platelets (PLT; blue) were assayed by flow cytometry, based on the forward scatter versus side scatter plot. PLTs were also gated on CD41+ cells. Data represent longitudinal follow-up for 38 to 145 months post-transplant, depending on the test animal. Data gathered during the ganciclovir IV treatment (see arrow at 23 months post-transplant) and within the two week period after leukapheresis have been excluded. See Table S1 for more details.
Total peripheral blood cells (PBCs) for 95E132 and fractionated granulocytes (Grans) and peripheral blood mononuclear cells (PBMCs) for animals 2RC003, RQ5427, and RQ3570 were serially collected over the entire analysis period to study the longitudinal behavior patterns of repopulating HSPC clones in these animals (Table 1). Different blood cell types (CD4+, CD8+, CD14+, CD18+, CD20+ cells and mPB CD34+ HSPCs) were also isolated near the experiment end-point to study lineage-output potentials of long-term engrafted clones. All sorted cell samples showed at least 98.7% purity except for CD4+ cells from RQ5427 and 2RC003 (94.1% purity) (Table S1).
Table 1.
Summary of vector integration site sequence analysis.
| Animal ID | Infused CD34+ HSPCs (Marking)a | Cell Typesb | Months | Uniq. VIc | QVI (LT-QVI)d | Genom. Sitese |
|---|---|---|---|---|---|---|
| 95E132§ | 36×106 (20%; 7×10⁶ GFP+) | Serial PBC (12) | 4 – 145 | 803 | 492 (233) | 726 |
| CD4, CD8, CD20, CD14, CD18, CD34 | 116 – 117 | 399 | 259 (259) | 365 | ||
| Total | - | 846 | 517 (259) | 759 | ||
| 2RC003§* | 30×106 (30%; 9×10⁶ GFP+) | Serial Grans (9) | 3 – 103 | 679 | 475 (229) | 562 |
| Serial PBMC (9) | 3 – 103 | 607 | 425 (210) | 508 | ||
| CD4, CD8, CD20, CD14, CD18, CD34 | 70 – 71 | 360 | 279 (279) | 282 | ||
| Total | - | 938 | 614 (279) | 737 | ||
| RQ5427¶ | 160×106 (7%; 11×106 GFP+) | Serial Grans (9) | 2 – 67 | 932 | 694 (349) | 716 |
| Serial PBMC (10) | 2 – 67 | 1,074 | 808 (385) | 862 | ||
| CD4, CD8, CD20, CD14, CD18, CD34 | 63 – 64 | 632 | 477 (477) | 533 | ||
| Total | - | 1,527 | 1,120 (477) | 1,147 | ||
| RQ3570¶ | 160×106 (18%; 29×106 GFP+) | Serial Grans (6) | 2 – 38 | 2,213 | 1,809 (913) | 1,754 |
| Serial PBMC (7) | 2 – 38 | 3,965 | 3,295 (1,306) | 3,470 | ||
| CD4, CD8, CD20, CD14, CD18, CD34 | 36 – 37 | 2,664 | 2,095 (2,095) | 2,257 | ||
| Total | - | 5,758 | 4,586 (2,095) | 4,817 |
HSPC: hematopoietic stem cell and progenitor cell; EGFP: enhanced green fluorescent protein; QVI: quantifiable vector integrant; LT-QVI: long-term QVI; Genom. Sites: unambiguous genomic integration sites; PBC: total peripheral blood cells; Grans: granulocytes; PBMC: peripheral blood mononuclear cells.
Human immunodeficient virus (HIV)-based, self-inactivating lentivirus vectors (SIN-HIV vectors) expressing EGFP were used to transduce the CD34+ cells prior to transplant (An et al., 2001; Sander et al., 2006).
SIN-HIV vectors expressing the mutant viral herpes simplex virus-1 thymidine kinase (HSV1-sr39tk) gene were also used for animal 2RC003 for position emission tomography (Sander et al., 2006).
Simian immunodeficient virus (SIV)- based lentivirus vectors expressing both EGFP and shRNA against the HIV-1 co-receptor, C-C chemokine receptor type 5 (CCR5), were used to transduce the CD34+ cells prior to transplant (An et al., 2007).
The number of infused CD34+ HSPCs is shown. The levels of EGFP marking at infusion and the estimated number of EGFP-marked cells are shown within parenthesis.
The cell types analyzed in this study. For longitudinal analysis, PBCs or Grans/PBMCs were analyzed (the number of time points is indicated in the parenthesis). CD4+ and CD8+, CD20+, CD14, CD18+, and CD34+ cells were also analyzed near the experimental endpoints.
The total number of unique vector integrants (Uniq. VI) per animal
The total number of QVI per animal. The total number of LT-QVI is provided in the parenthesis.
The total number unambiguously mapped genomic VIS loci (Genom.Site) per animal.
Clonal Tracking Assay
The repopulation of individual HSPC were tracked by the distinguishing VIS of each vector marked clone. The frequency of each clone was quantitatively analyzed by large-scale VIS sequencing and bioinformatics analysis of VIS sequences. We optimized the assay conditions to enable quantitative VIS sequencing, including the amount of input DNA, the intensity of sequencing, data analysis standards to restrict detection biases and the conditions for concurrent analysis of the 5′ and the 3′ vector-host junctions (Kim et al., 2010). Briefly, the genomic loci and the relative frequencies of individual vector integrants were determined by a TaqaI-mediated, bi-directional VIS assay (see Suppl. Methods for details). During the assay, the TaqaI restriction enzyme generated different lengths of PCR amplicons, each harboring a distinct VIS sequence (Fig. S1). Due to inefficient sequencing of PCR amplicons of >500 bp with our experimental conditions, only the vector integrants that generated ≤500 bp VIS PCR amplicons at either the left or right vector-host junctions - defined as quantifiable vector integrants (QVIs) - were subjected to quantitative analysis. The assay results were validated by clone-specific real-time PCR of six chosen QVI clones (Fig. S2A).
Long-term Reconstitution by Thousands of HSPC Clones with Highly Variable Detection Frequencies
Variable levels of polyclonal repopulation were observed in each animal. VIS analysis revealed a range of 30 to 1,338 unique vector integrants, each representing progeny derived from a single vector-marked HSPC, per test sample; totaling 846–5,758 per animal (Table 1 and Table S2). The total number of unique vector integrants recovered from each animal was proportional to the number of vector marked HSPCs that were infused at the beginning of the experiment (Fig. 2A). We previously estimated that approximately 40.3% of vectors were QVI, based on a simulation with random vector integration sites (Kim et al., 2010). In our data sets, 61–83% of the total recovered vector integrants were QVIs (Table 1). The discrepancy between the computational prediction and the assay results may be due to an assay limitation to detect some vectors remotely located from the TaqαI restriction sites in the genome. Further biostatistical analysis demonstrating optimization of VIS analysis is in Suppl. Document (see Fig. S2B). Individual QVI clones in each animal showed highly variable detection frequencies. While thousands of different clones presented, only a small number of clones dominated the blood repopulation over time. For example, the 5% most frequent QVI clones contributed on average 49–72 % of the total QVI repopulation (up to 60–88% over time) in each animal with the most prevalent clone showing an average relative detection frequency of 0.0322 to 0.1028 (based on an average across all time points)(Fig. 2B). In contrast, the majority of QVI clones (43–71%) were infrequently detected with an average frequency of < 0.0002, contributing to < 7% of total QVI repopulation over time in all animals except RQ3570. In animal RQ3570, the QVI clones with < 0.0002 frequency contributed to < 23% of total repopulation. In this animal, the mean and the standard deviation of the relative frequencies among individual clones were lower than those of other animals (see Fig. 2B), due most likely to a relatively short follow-up time (3 years) and also to the greater presence of clones (4 to 7 times as many) in this animal.
Figure 2. Polyclonal Repopulation with Highly Variable Detection Frequencies Among Clones.
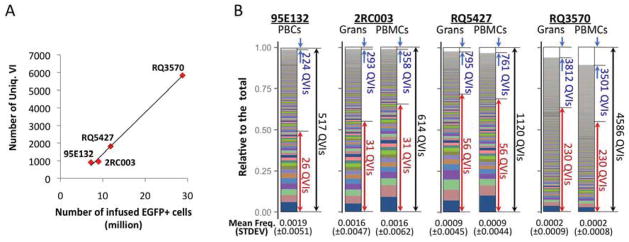
(A) The total number of unique vector integrants recovered in each animal [Uniq.VI (y-axis) at all time points and for all cell types (see Table 1)] showed a linear correlation with the total number of EGFP+ cells transplanted at the beginning of the experiment (x-axis). (B) The stacked area charts show the average detection frequencies of individual QVI clones in serial peripheral blood analysis, with the most prevalent QVI clone located at the bottom. Total peripheral blood cells (PBC) in animal 95E132, and both granulocytes (Grans) and peripheral blood mononuclear cells (PBMCs) in animals 2RC003, RQ5427, and RQ3570 are shown. The left vertical axis shows the cumulative contribution to overall repopulation by individual QVI clones. The total number of QVI clones recovered in each animal appears beside a black arrow at the right of each chart. A large number (43–71%) of QVI clones (denoted by blue arrows) were detected at an extremely low average frequency of <0.0002, contributing to < 7% of total blood repopulation over the entire course of observation, except in animal RQ3570, where the contribution was <23%. By contrast, the 5% most frequently detected clones (denoted by red arrows) contributed to an average of 49 – 72% of total blood repopulation, depending on the animal and cell type. The mean and standard deviation (±STDEV) of QVIs are noted at the bottom of each chart. See Fig. S1 and Fig. S2 for more details.
Long-term, Stable Hematopoietic Reconstitution was Maintained through Sequential Expansion of Different HSPC Clones
In test animals, the levels of total vector-marked cells in the blood were maintained at relatively constant levels for years following the first 6 to 12 months post-transplant. To determine how the large number of HSPC clones maintained hematopoietic homeostasis, we analyzed the patterns of clonal repopulation over time by clustering QVIs based on their frequency profiles in serially collected PBCs (in animal 95E132) or Grans/PBMCs (in animals 2RC003, RQ5427, and RQ3570) (Fig. 3A). Only QVIs with an average relative frequency of ≥0.0002 (calculated across all time points) were included for cluster analysis as they provided reliable signals of clonal behavior over time. These QVIs were often detected at more than three time-points, thereby enabling a traceable trajectory of their longitudinal behaviors (see Fig. S2D for details). Low-frequency clones (<0.0002 relative frequency) were excluded from the analysis because their signals were expected to be noisier and inconsistently available across time points due possibly to uneven PCR amplification of low-frequency clones during the assay process. QVI clones with an average frequency of ≥ 0.0002 were clustered into 5–8 groups, depending on cell types and animals, using the WGCNA package (Langfelder and Horvath, 2008) (Fig. 3A and Fig. S3A). Except for the smallest cluster among the data sets (cluster-1 with 9 clones in the 2RC003 PBMC data set), all clusters were clearly separable, with a significance level |Zsummary.qual| of >10 (Langfelder and Horvath, 2008). The repopulation kinetics of clusters-1 to -8 demonstrate sequential expansions of different clones, peaking at different time points. Cluster-1 corresponds to the first wave of clones repopulating at the earliest time point, followed by cluster-2 and continuing through the final cluster (cluster-5 or -6 for RQ3570 and cluster-7 or -8 for all other animals) (Fig. 3A). Fluctuations in clonal frequencies were higher early after transplant (2–9 months) –when the cluster-1 and -2 clones were the primary source of blood repopulation – than at later time points (Fig. S3B). Most of the cluster-1 and -2 clones lasted for only months whereas the clones that emerged later expanded and decayed over years. These results indicate that repopulation occurs in at least two kinetically distinct phases: 1) an initial phase lasting about 1 year where clones rapidly appear and disappear and 2) a long-term phase where more stable clones gradually emerged and pre-dominated HSPC repopulation. Furthermore, even the most stable clones appear to have a finite lifespan. Sequential declines of hundreds of clones are compensated for by expansion of others, maintaining a relatively stable level of marked cells over the ensuing years in each animal (Fig. S3C).
Figure 3. Repopulation Kinetics of HSPC Clones.

(A) Sequential Expansions of HSPC Clones Over Time. Major clonal kinetics patterns in serial PBC (in animal 95E132) and PBMC and Grans (in animals 2RC003, RQ5427, and RQ3570) were derived using average linkage hierarchical clustering based on clonal frequency profiles over time. The relative frequencies of QVI clones at different time points (shown in months at the top of each chart) appear in a white–black–yellow color scheme, with white denoting zero frequency and yellow the highest frequency (see the numbers at the bottom of each chart). QVIs were grouped into 5 – 8 clusters (denoted by different colored arrows), depending on animal and cell type, using the WGCNA package (Langfelder and Horvath, 2008). All clusters were clearly separable, with a significance level (|Zsummary.qual|) of >10 (Langfelder and Horvath, 2008), except for the cluster-1 in the 2RC003 PBMC data set (only 9 QVI clones). Results showed that different groups of QVI clones, beginning with Cluster 1, expanded sequentially over time. See Fig. S3 for more details. (B) Repopulation of Long-term and Short-term QVI Clones. Long-term (LT-QVIs) and short-term QVI clones (ST-QVIs) were segregated based on the presence of these clones in blood lineages isolated at 116–117 months (95E132), 70–71 months (2RC003), 63–64 months (RQ5427), or 36–37 months (RQ3570) months post-transplant. The relative contribution (y-axis) of LT-QVIs (orange) and ST-QVIs (black) in serial PBC (95E132) or Grans/PBMCs (2RC003, RQ5427, and RQ3570) are shown over time. See Fig. S4 for more details.
Segregation of Long-term and Short-term Repopulating Clones
Clones persisting for many years likely represent repopulation by the progeny of HSCs. To specifically study the long-term repopulating clones, we segregated QVI clones that were detected near the experimental endpoint [long-term QVIs (LT-QVIs), hereafter] in mature blood lineages (at 36, 64, 70, or 116 months from animals RQ3570, RQ5427, 2RC003, and 95E132, respectively) and in mPB CD34+ HSPCs isolated within one month of the mature lineage isolation (see Fig. S4 and Table 1). Of all identified QVI clones, about half (42–50%) were LT-QVIs, which indicates that approximately 0.01% (0.008–0.017% in each animal) of vector-marked CD34+ HSPCs transplanted into each animal were capable of long-term repopulation above the detection level (see Suppl. Methods for details). The remainder (50–58%) were defined as short-term QVI clones (ST-QVIs). Most of LT-QVIs were undetectable or infrequent at 2–4 months post-transplant, but beginning around 7–13 months post-transplant they became the primary source of repopulating cells, contributing to > 80% of total repopulation (Fig. 3B). ST-QVIs primarily occurred very early after transplant (within 2–4 months) and dropped in frequency after the first year before the LT-QVI dominated. About half of detected clones were ST-QVI, but it is likely that there were a greater number of short-term clones repopulating during this period that were undetected in the analysis because of the limited blood sampling and analysis time points. Thus, the ST-QVI clones possibly represent progeny of hematopoietic progenitor cells that provided a rapid reconstitution of hematopoiesis within the first year after transplant, while LT-QVI clones likely represent HSCs that arose more gradually and provided a longer lasting hematopoiesis.
Lineage Disparate Subtypes of Long-term Repopulating Clones
We determined the lineage output of LT-QVI clones by fractionating cells near the experimental endpoint into subpopulations of myeloid (CD14+ and CD18+) and lymphoid (CD4+, CD8+, and CD20+) cells. Individual LT-QVIs showed highly variable detection frequencies in different cell types. To obtain reliable patterns of clonal lineage potentials, LT-QVIs with an average detection frequency of < 0.0002 [average of myeloid (CD14+ and CD18+), T-cells (CD4+ and CD8+), and B-cells (CD20+)] were excluded from the analysis. The results revealed three clearly distinguishable subtypes among the LT-QVIs that differed in the proportion of lineage output to myeloid or lymphoid cells (Fig. 4A–D and Fig. S5A–B). Myeloid-biased (My-bi), lymphoid-biased (Ly-bi), and balanced (Bal) LT-QVIs were defined based on the myeloid (GM) and lymphoid (BT) ratios of ≥ 3:1, ≤ 1:3, and between 3:1 and 1:3, respectively. These showed a high quality of separation for all data sets (|Zsummary.qual| > 10 using the WGCNA R package (Langfelder and Horvath, 2008)), except animal 2RC003, which had the two smallest clusters (with only 30 and 38 clones) that did not achieve significance. In animals 95E132, RQ5427, and RQ3570, the proportions of the My-bi, Bal, and Ly-bi clones among the analyzed LT-QVIs were 25–31%, 23–33%, and 40–46%, respectively. In animal 2RC003, the My-bi proportion was much greater (59%) than the others (18% and 23% for Bal and Ly-bi, respectively), possibly affected by ganciclovir IV treatment at 23 months post-transplant. These results provide the first demonstration of highly heterogeneous lineage output behaviors of long-term polyclonal repopulation in primates.
Figure 4. Functional Subtypes of Long-term Repopulating Clones.

(A–D) Myeloid-biased (My-bi), balanced (Bal), and lymphoid-biased (Ly-bi) subtypes among the LT-QVIs are shown for each animal. The My-bi (blue), Bal (magenta), and Ly-bi (green) groups were determined based on myeloid (GM): lymphoid (BT) cell ratios of ≥ 3:1, between 3:1 and 1:3, and ≤ 1:3, respectively. In each Figure i), the frequency profiles of individual QVIs are shown in a white-black-yellow color scheme for lymphoid cells (BT: CD4+, CD8+, and CD20+ cells), myeloid cells (GM: CD18+ and CD14+ cells) and mPB CD34+ cells near the endpoint, and serial PBC(95E132) or Grans/PBMC (2RC003, RQ5427, and RQ3570). The range of clones detected in CD34+ cells is indicated by a red arrow. The numbers of QVI clones appear in parentheses. In Figures ii) and iii), the ternary diagrams show the lineage output potentials of each clone (indicated by the positions of the circles relative to the points of the triangle). The relative frequencies of clones (indicated by the size of the circles) in mature lineages (ii) are compared to those of identical clones in mPB CD34+ cells (iii). (E) The total contribution to blood repopulation by My-bi, Bal, and Ly-bi QVIs (upper chart) and the average contribution by individual QVIs within each group (lower chart) are shown over time. Error bars indicate standard errors. See Fig. S5 and Fig. S6 for more details.
Dynamics of My-bi, Ly-bi, and Bal Clone Repopulation Over Time
We observed that LT-QVIs became the dominant source of hematopoietic reconstitution after rapid but transient reconstitution by a large number of ST-QVIs that declined primarily within the first year (see Fig. 3B). Here, we tracked the clones constituting three LT-QVI subtypes over time to understand how these subtype clones contributed to long-term hematopoietic reconstitution. Interestingly, a small number of Bal type LT-QVI clones, constituting only 4–10% of total recovered QVIs, expanded extensively during the first 10–20 months and, after which time, became the predominant source of long-term hematopoietic reconstitution, ultimately contributing up to 71% (95E132), 42–52% (2RC003), 61–67% (RQ5427), and 25–32 % (RQ3570) of total QVI repopulation (Fig. 4E). The My-bi LT-QVIs, constituting 6–16% of total QVIs, also increased gradually but maintained relatively lower levels than the Bal type. In contrast to the My-bi and Bal clones, which increased consistently over time, the Ly-bi LT-QVIs (6.2–12.8% of total QVIs) expanded for the first 10–20 months and then gradually declined. The greatest proportion of repopulation is ultimately contributed by the balanced type clones (Bal) which contribute relatively equally to myeloid and lymphoid repopulation.
We further examined the utilization of these clones over time in blood cells fractionated for granulocytes and PBMC. Serial analysis of fractionated Grans and PBMCs in animals 2RC003, RQ5427, and RQ3570, showed that the lineage-biased or –balanced patterns of these clones started to be apparent at about 10 months post-transplant and sustained until the end-point (Fig. 4E and see Fig. S6A for 10 most frequent clones).
Correlation of Clonal Behavior with Cluster Analysis
Through clonal tracking analysis, we were able to define four functionally distinct repopulating subpopulations arising from the transplanted CD34+ HSPC pool, including short-term repopulating clones and three subtypes (My-bi, Bal, and Ly-bi) of long-term repopulating clones. We also determined their relative contributions to hematopoietic reconstitution over time (see Fig. 5A for a summary). In order to investigate the more detailed dynamics of the clones constituting these subgroups, they were compared with the kinetics clusters defined in Figure 3A. As expected, the ST-QVIs were highly enriched in cluster-1, representing clones that appeared first and disappear shortly after, except serial PBMCs in 2RC003(Fig. 5B). Conversely, LT-QVIs were found primarily in clusters appearing later. As expected from the increasing patterns over time, My-bi and Bal type QVIs were enriched in the clusters that appeared the latest (Clusters 7 or 8 for 95E132, 2RC003, and RQ5427, and Clusters 5 or 6 for RQ3570) whereas Ly-bi clones did not show such a pattern (Fig. 5B). The results indicate that within each given lineage subtype, individual clones rise, peak, and fall at different times.
Figure 5. Summary Diagrams Showing the Relative Proportions of HSPC Subpopulations and Their Contributions to Blood Repopulation Over Time.

(A) Summary Diagrams. Figure (i) shows the relative proportions of long-term repopulating cells within the transplanted CD34+ cell pool. Figure (ii) shows the contributions of short-term clones (ST-Clones) and the three subtypes of long-term clones over time. (B) These charts show variable repopulation kinetics among the clones within each subpopulation. The numbers of My-bi, Bal, Ly-bi, and ST-QVI clones in the various kinetics clusters are indicated by bar graphs. The clusters and color codes for each cluster are the same as those in Fig. 3A. (C) The bar graphs show the proportions of My-bi, Bal, and Ly-bi clones present in the CD34+ HSPC pool near the endpoint (denoted by red bars) relative to the total detected in the mature lineages (denoted by black bars) (see Fig. 4A–D(i) for individual clones in mature lineages and CD34+ cells). The long-term HSPC population is relatively enriched for the Bal and the My-bi clones. (D) Comparison of clonal compositions across cell types. The relative frequencies of individual clones are compared between cell types. The Pearson correlations coefficient value (r) is indicated by a rainbow color scheme.
The Relative Proportions of My-bi, Bal, and Ly-bi Clones in The CD34+ HSPC Pool
As some mature cells persist for years, the relative proportions of My-bi, Bal, and Ly-bi clones assessed in mature cells may not reflect those in stem cells or progenitors. The relative frequencies of these long-term QVI clones in mature lineages were compared near the experimental endpoints for each animal with those in the underlying HSPC pool (37, 63, 71, or 117 months). mPB CD34+ HSPCs were collected within one month of the blood used for lineage fractionation (Table 1). For most animals the majority of the Bal and My-bi clones were present in the HSPC pool (57–96% of the Bal type and 38–80% of My-bi clones were shared with the HSPC pool) (Fig. 5C and also see Fig. 4A–D). In contrast, only 17–50% of Ly-bi clones were common to the HSPC pool. When My-bi, Bal, and Ly-bi LT-QVI clones that were present in the CD34+ HSPCs were tracked over time, we found that the unique lineage-biased or -balanced patterns of these clones became apparent at around 1 year post-transplant and were maintained over time (Fig. S6B). The majority of Ly-bi clones occurred in both Grans and PBMCs at earlier time points but persisted primarily in PBMCs until the end-point. We also observed that the clonal composition between the HSPCs and the lymphoid cells (CD4+, CD8+, and CD20+ cells) was generally less correlated than the clonal compositions between the HSPCs and CD18+ granulocytes (Fig. 5D), as is expected since the relatively short life span of granulocytes would reflect the immediate output of precursor cell differentiation. These results indicate that the long-term HSPC population is relatively enriched for the Bal and the My-bi clones. A smaller proportion of Ly-bi LT-QVIs were maintained above the detection level in the long-term engrafted HSPC pool. This result may reflect the longer life-span of lymphoid-cells and consequently a decreased requirement for lymphoid-biased clones with age.
VIS Analysis Indicates Benign Integration Bias Without Selection for Any Particular Cell Type
As seen in previous gene-therapy clinical studies using murine leukemia virus (MLV) vectors, insertional mutagenesis may cause aberrant clonal proliferation or skewed differentiation. While low genotoxic effects of lentivirus vectors have been demonstrated in recent studies by VIS analysis for up to 2 years in humans (Aiuti et al., 2013; Biffi et al., 2013; Cartier et al., 2009; Cavazzana-Calvo et al., 2010), careful monitoring of the long-term effects by lentivirus vectors is required since gene modified HSC will be maintained for a lifetime. Genomic VIS patterns of repopulating cells in our test animals largely reflect those of freshly transduced CD34+ HSPCs (acute infection) (Fig. S7A). We also found several local VIS hot-spots common in all test animals but undetected in acute infection of mPB CD34+ cells (Fig. 6). These hot-spots were characterized using a Bayesian change-point (BCP) model that defines VIS hot-spots relatively independently of data set size(Presson et al., 2011). Lentivirus vectors showed distinctive VIS hot-spot patterns that differed from oncogenic MLV vectors. Clinical gene-therapy studies with MLV vectors have revealed hot-spots consisting of densely clustered VISs in a small genomic region, typically near the transcription start site of a gene, that often differed across individuals (Deichmann et al., 2007; Presson et al., 2011; Wang et al., 2010). In contrast, the lentivirus vector hot-spots in our test animals consisted of VIS spread across multi-genic, megabase-scale regions (Fig. S7B). These hot-spots were conserved in all time points and cell types without any notable changes in size or intensity (Fig. S7C). Similar hot-spot patterns were also observed at homologous regions in humans (Presson et al., 2011) and in mice (Biffi et al., 2011). Through analysis of PBMC, Grans, and PBC data sets, we found VIS hot-spots were not correlated with highly expanded clones (data not shown). When the genes hosting VIS in My-bi, Bal, Ly-bi or ST-QVI data sets were compared with each other, no notable functional gene group was associated with any specific cell type (Fig. S7D–E). Thus, these results demonstrate an apparently benign integration bias not associated with any particular HSC subtype.
Figure 6. Vector Integration Site Bias Conserved Across Animals and Functional Subgroups.

(A–B) Genomic VIS hot-spots in four test animals are shown in (A) in comparison with those of published (pub) and freshly infected naïve CD34+ cells (acute). Hot-spots in My-bi, Ly-bi, Bal, and ST-QVIs (four animals combined) are shown in (B). Each row shows the complete VIS pattern for one data set, where data set names are indicated on the y-axis, and the x-axis gives the genomic location of the VIS in Mb units. Vertical black bars indicate chromosomal boundaries. Color definitions were assigned for each data set independently, based on relative VIS density. Hot-spot regions are colored in red. One of the strongest hot-spots was located at chromosome (chr) 4 (29.94–34.01 Mb) hosting about 4.22% of the total VIS with a density of about 69 VIS per Mb. The second major hot-spot was defined as a 4.99 Mb region at rhesus chr14 (5.98–10.97 Mb) containing 5.54% of VIS at a density of 73 VIS/Mb. Hot-spots among subtypes were significantly correlated, with overlap ranging between 29–79% among subtypes and overlap p-values (based on a Fisher’s exact test for hot-bin overlap) ranging from 1.7×10⁻⁷ to 3.3×10⁻²². See Table S3 and Fig. S7 for more details.
DISCUSSION
To date, our understanding of the primate hematopoietic system lags far behind the level desired for current and future use of HSPC-based therapies (Cavazzana-Calvo et al., 2011; Copley et al., 2012; Doulatov et al., 2012). Despite the significant advances in HSPC-based therapies, the phenotypic properties of primate HSCs during hematopoietic reconstitution after transplant remain unclear. We provide here a detailed system-level description of the decade-long properties of a large number of heterogeneous clones following non-human primate CD34+ cell transplant and address how long-term and stable hematopoietic reconstitution over 4 to 12 years was achieved through the combined contributions of thousands of clones. Remarkably, despite waves of HSPC utilization lasting for periods of months or years, total marking remains relatively constant for over ten years. And, despite lineage disparate behaviors of HSPC, normal repopulation of blood cell lineages is maintained, initially through the contribution of short-lived HSPC clones, but eventually the majority of repopulation is determined by a few stable clones having a relatively balanced multi-lineage output. The results suggest tremendous diversity as well as intricate control of HSPC repopulation.
Classically, HSCs were thought to be largely biologically homogeneous in regards to self-renewal and differentiation potential. Recent single cell transplant studies in mice introduced new complexity into the regulation of the hematopoietic system, showing significant heterogeneity in longevity, self-renewal and differentiation potentials among the most primitive HSCs (Copley et al., 2012; Muller-Sieburg et al., 2012). Unlike the murine transplant studies using purified HSCs, primate transplant occurs through the combined and competitive repopulation by a vastly greater number of HSPC clones over a longer period of time. The majority of repopulating clones in our test animals showed a kinetic pattern indicating finite life-spans of engrafted HSPCs. These clones made their peak contribution at different time points and could be grouped into several clusters based on their repopulation kinetics, showing sequential expansions of different groups of clones over months for the earliest clones and over years for those clones appearing later after repopulation (Fig. 3A). Of the clones detected, approximately equal numbers are long-term (designated LT-QVI) and short-term (designated ST-QVI) clones. Although the assay endpoint given to each animal to distinguish long-term and short-term clones ranged from 3 to 10 years, this variation in endpoints did not significantly affect our findings regarding the relative frequencies of these two populations insofar as the clonal kinetics in all animals became more stable after 1 to 2 years. We estimated approximately 0.01% of transplanted CD34+ cells (1 in 1 to 2 million mobilized peripheral blood mononuclear cells) were capable of long-term repopulation above the detection limit. Our estimate is comparable to an estimate of the human HSC frequency (1 in 1 to 6 million cells in cord blood, adult bone marrow, or mobilized peripheral blood) by limiting dilution analysis using immunodeficient mouse xenotransplant models (Doulatov et al., 2012; Wang et al., 1997). An exquisite balance exists between the expansions of newly arising clones and the declines of preceding ones ensuring stable hematopoietic homeostasis of transplanted clones in the blood over years. The clones detected early after transplant (within the first 7 to 9 months) were of large number, mostly low-frequency, and persisted transiently, whereas the clones detected later were kinetically more stable, expanding slowly and often intensively over years before subsiding and being replaced by new groups of clones. This sequential pattern of polyclonal repopulation suggests that stable long-term hematopoietic reconstitution is achieved by expansions of HSPCs with different longevities. Differences in the life-span of HSCs have also been observed in mice where transplantation of single HSC exhibited wide differences in longevity (Benveniste et al., 2010; Sieburg et al., 2011). We hypothesize that the large number of early clones represent more differentiated progenitors that repopulate into the blood relatively quickly, making only brief contributions but ensuring adequate hematopoiesis and consequently survival of the host during this critical early period after myeloablation, while those HSC at a more primitive stage take more time to make their peak contribution to the blood and persist for much longer but still finite times. Many clones remain undetected until many years after transplant before arising to replace decaying clones. The replacement of subsiding clones with new groups of HSC in order to maintain a constant level of marked hematopoietic output further suggests that there exist host environmental cues that instruct new clones to emerge as old clones decay.
Long-term clones exhibit highly variable lineage output. Many clones were relatively balanced in terms of their contributions to myeloid and lymphoid lineages (balanced subtype), but others showed a biased differentiation pattern favoring either myeloid output (myeloid-biased) or lymphoid output (lymphoid-biased). Among the lymphoid-biased clones, some were highly skewed towards either T or B cells. Over the long-term, a small number of the balanced subtype clones (4–10%) expanded extensively and predominantly contributed to the total blood repopulation (25–71%). While the detailed lineage cell-sorting fractionations were performed at a single late time point, we demonstrated in three animals that within blood fractionated at multiple time points for granulocytes, representing myeloid-cells, and PBMC, representing 80–90% lymphoid-cells, those balanced subtype clones predominated after about 1 to 2 years (see Fig 4E). The dominance of the balanced subtype was also suggested in a recent murine study (Lu et al., 2011) however, this study was performed at only a single time point, thus lacking longitudinal HSC behavior data. Thus, these results provide evidence for the co-existence of phenotypically lineage disparate clones contributing to hematopoiesis in primates. The dominance of balanced type HSC clones is to be teleologically expected in order to maintain uniform blood lineage production over time.
The lymphoid-biased and myeloid-biased clones are present in each of the animals over the duration of our study although contributing less than balanced clones to total repopulation. The analysis of these clones in granulocyte and PBMC fractions suggests conservation of these lineage properties over time, although more detailed longitudinal cell fractionation will be required for confirmation. In murine studies, the clones restricted for myeloid output (lymphoid-biased) correlates with short longevity: self-renewal activity of this type of cell was exhausted within 6–7 months (Dykstra et al., 2007). In our studies, lymphoid-biased clones were maintained over the long term; however, each animal showed a notable decrease in the number of lymphoid-biased clones within the CD34+ progenitor cell population at the assay endpoint (3 to 10 years post-transplant), suggesting potential quiescence or exhaustion of some previously activated lymphoid-biased progenitors. By contrast, balanced and myeloid-biased long-term clones were relatively well conserved in the CD34+ cells (see Fig. 4A–D and Fig. 5C). Since mature lymphoid cells have a far greater life-span than myeloid cells, the reduced frequency of lymphoid-biased clones in CD34+ cells may reflect a reduced requirement for lymphoid-biased HSC over time. The role of the lineage-biased clones is unknown, but it is interesting to speculate that they may be instructed by environmental factors to contribute to certain blood lineages in times of particular need or stress.
Previous clinical trials with gamma-retroviral vectors have been associated with cancers (Hacein-Bey-Abina et al., 2010; Nienhuis et al., 2006; Stein et al., 2010), hence the safety and efficacy of therapeutic vectors have been a concern for future HSPC-based genetic therapies. Despite safer clonal repopulation patterns found in recent human gene therapy studies with lentiviral vectors followed for 1.5–2 years by VIS analysis (Aiuti et al., 2013; Biffi et al., 2013; Cartier et al., 2009; Cavazzana-Calvo et al., 2010), potentially life-long persistence of engineered stem cells warrants more careful monitoring of repopulating clones for a much longer period. We demonstrate safe and stable hematopoietic reconstitution in non-human primates over 4 to 12 years (equivalent to 10 to 30 years in humans, based on the average life-span of the two species) without evidence of clones with obvious aberrant behavior. Gene modification of HSPC with an shRNA directed to CCR5, an essential co-receptor for R5-tropic strains of HIV-1(An et al., 2007) and targeting the same region of CCR5 as a candidate anti-HIV gene therapeutic for human clinical trials (www.clinicaltrials.gov; protocol NCT01734850) showed no notable effects on HSPC longevity or lineage-output behaviors. Thus, our long-term analysis can serve as a frame of reference for monitoring the safe use of HSPCs and lentiviral delivery in the clinic, including HIV gene therapy and other therapies using HSPCs.
EXPERIMENTAL PROCEDURES
Animal Care and Peripheral Blood Cell Isolation
Four rhesus macaques were maintained in accordance with federal guidelines and the policies of the Veterinary Research Program of the National Institutes of Health according to the protocols approved by the Animal Care and Use Committee of the National Heart, Lung, and Blood Institute. Procedures for peripheral blood cell isolation can be found in the Supplemental Document.
Vector Integration Site Analysis
Vector integration sites (VISs) in repopulating cell samples were analyzed by TaqαI-mediated, bi-directional VIS sequencing and bioinformatics analysis, as described previously(Kim et al., 2010) with modifications for animals 2RC003, RQ3570, and RQ5427 (see Supplemental Document for details).
Kinetics Clusters
Major clonal kinetics patterns were derived using the WGCNA R package v.1.20(Langfelder and Horvath, 2008). Clusters were defined by using thresholds that were specific to each data set, where each threshold was selected to yield clusters with visually distinct kinetics profiles. The significance of the clusters was quantified using the modulePreservation function in the WGCNA package(Langfelder and Horvath, 2008) as described above (See Supplemental Document for details).
Lineage Analysis
Analogous to previous studies(Dykstra et al., 2007; Lu et al., 2011), the relative contributions of individual LT-QVIs toward granulocytes/monocytes(GM: CD14 and CD18), T-cells (CD4 and CD8), and B-cells (CD20) were determined with ternary plots and cluster analysis using the WGCNA R package v.1.20 (see Supplemental Document for details).
Genomic Vector Integration Site Hot-Spots
The Bayesian change-point (BCP) model(Presson et al., 2011) was used to define hot-spots (see Suppl.Methods for details). The correlation of hot-spots among different HSPC subtypes was tested based on a Fisher’s exact test for hot-bin overlap (see Supplemental Document for details).
Supplementary Material
HIGHLIGHTS.
Tracking of lentivirally-labeled rhesus macaque CD34+ cells after transplantation
Long-term repopulation maintained by sequentially expanding clones
Myeloid and/or lymphoid lineage bias evident in repopulating clone activity
Clones with balanced lineage output predominated from 1 to 2 years post transplant
Acknowledgments
We thank: the animal support and veterinary staff of both 5 Research Court and the Division of Veterinary Resources for maintaining these non-human primates for all these years; Keyvan Keyvanfar of the Hematology Branch and Ann Williams of the Core Flow Cytometry Laboratory, NHLBI, for performing cell sorting. This work was supported in part by the intramural program of the NIH, Hematology Branch, National Heart, Lung and Blood Institute; NIH grants AI055281-06A2, CA68859, and K99HL116234-01; the California Institute of Regenerative Medicine DR1-01431; The UCLA AIDS Institute/Center for AIDS Research AI28697; Korean NRF grants (20110030770 & 20120009215) and Next-Gen BioGreen21 (PJ008019 & PJ008068). ISYC is a founder of Calimmune, Inc., a company developing genetic therapies for HIV disease.
Footnotes
Supplementary Data include Supplementary figures, Supplementary experimental procedures, Supplementary tables, Supplementary references, Supplementary VIS raw data, Supplementary QVI frequency data.
Publisher's Disclaimer: This is a PDF file of an unedited manuscript that has been accepted for publication. As a service to our customers we are providing this early version of the manuscript. The manuscript will undergo copyediting, typesetting, and review of the resulting proof before it is published in its final citable form. Please note that during the production process errors may be discovered which could affect the content, and all legal disclaimers that apply to the journal pertain.
References
- Aiuti A, Biasco L, Scaramuzza S, Ferrua F, Cicalese MP, Baricordi C, Dionisio F, Calabria A, Giannelli S, Castiello MC, et al. Lentiviral Hematopoietic Stem Cell Gene Therapy in Patients with Wiskott-Aldrich Syndrome. Science. 2013 doi: 10.1126/science.1233151. [DOI] [PMC free article] [PubMed] [Google Scholar]
- An D, Donahue R, Kamata M, Poon B, Metzger M, Mao S, Bonifacino A, Krouse A, Darlix J, Baltimore D, et al. Stable reduction of CCR5 by RNAi through hematopoietic stem cell transplant in non-human primates. Proc Natl Acad Sci U S A. 2007;104:13110–13115. doi: 10.1073/pnas.0705474104. [DOI] [PMC free article] [PubMed] [Google Scholar]
- An D, Kung S, Bonifacino A, Wersto R, Metzger M, Agricola B, Mao S, Chen I, Donahue R. Lentivirus vector-mediated hematopoietic stem cell gene transfer of common gamma-chain cytokine receptor in rhesus macaques. Journal of Virology. 2001;75:3547–3555. doi: 10.1128/JVI.75.8.3547-3555.2001. [DOI] [PMC free article] [PubMed] [Google Scholar]
- Benveniste P, Frelin C, Janmohamed S, Barbara M, Herrington R, Hyam D, Iscove NN. Intermediate-Term Hematopoietic Stem Cells with Extended but Time-Limited Reconstitution Potential. Cell Stem Cell. 2010;6:48–58. doi: 10.1016/j.stem.2009.11.014. [DOI] [PubMed] [Google Scholar]
- Biffi A, Bartolomae C, Cesana D, Cartier N, Aubourg P, Ranzani M, Cesani M, Benedicenti F, Plati T, Rubagotti E, et al. Lentiviral vector common integration sites in preclinical models and a clinical trial reflect a benign integration bias and not oncogenic selection. Blood. 2011;117:5332–5339. doi: 10.1182/blood-2010-09-306761. [DOI] [PubMed] [Google Scholar]
- Biffi A, Montini E, Lorioli L, Cesani M, Fumagalli F, Plati T, Baldoli C, Martino S, Calabria A, Canale S, et al. Lentiviral Hematopoietic Stem Cell Gene Therapy Benefits Metachromatic Leukodystrophy. Science. 2013 doi: 10.1126/science.1233158. [DOI] [PubMed] [Google Scholar]
- Cartier N, Hacein-Bey-Abina S, Bartholomae C, Veres G, Schmidt M, Kutschera I, Vidaud M, Abel U, Dal-Cortivo L, Caccavelli L, et al. Hematopoietic stem cell gene therapy with a lentiviral vector in X-linked adrenoleukodystrophy. Science. 2009;326:818–823. doi: 10.1126/science.1171242. [DOI] [PubMed] [Google Scholar]
- Cavazzana-Calvo M, Fischer A, Bushman FD, Payen E, Hacein-Bey-Abina S, Leboulch P. Is normal hematopoiesis maintained solely by long-term multipotent stem cells? Blood. 2011;117:4420–4424. doi: 10.1182/blood-2010-09-255679. [DOI] [PMC free article] [PubMed] [Google Scholar]
- Cavazzana-Calvo M, Payen E, Negre O, Wang G, Hehir K, Fusil F, Down J, Denaro M, Brady T, Westerman K, et al. Transfusion independence and HMGA2 activation after gene therapy of human β-thalassaemia. Nature. 2010;467:318–322. doi: 10.1038/nature09328. [DOI] [PMC free article] [PubMed] [Google Scholar]
- Copley MR, Beer PA, Eaves CJ. Hematopoietic Stem Cell Heterogeneity Takes Center Stage. Cell Stem Cell. 2012;10:690–697. doi: 10.1016/j.stem.2012.05.006. [DOI] [PubMed] [Google Scholar]
- Cornils K, Bartholomae CC, Thielecke L, Lange C, Arens A, Glauche I, Mock U, Riecken K, Gerdes S, von Kalle C, et al. Comparative clonal analysis of reconstitution kinetics after transplantation of hematopoietic stem cells gene marked with a lentiviral SIN or a gamma-retroviral LTR vector. Experimental hematology. 2012;41:28–38. e23. doi: 10.1016/j.exphem.2012.09.003. [DOI] [PubMed] [Google Scholar]
- Deichmann A, Hacein-Bey-Abina S, Schmidt M, Garrigue A, Brugman M, Hu J, Glimm H, Gyapay G, Prum B, Fraser C, et al. Vector integration is nonrandom and clustered and influences the fate of lymphopoiesis in SCID-X1 gene therapy. Journal of Clinical Investigation. 2007;117:2225–2232. doi: 10.1172/JCI31659. [DOI] [PMC free article] [PubMed] [Google Scholar]
- Doulatov S, Notta F, Laurenti E, Dick JE. Hematopoiesis: A Human Perspective. Cell Stem Cell. 2012;10:120–136. doi: 10.1016/j.stem.2012.01.006. [DOI] [PubMed] [Google Scholar]
- Dykstra B, Kent D, Bowie M, McCaffrey L, Hamilton M, Lyons K, Lee S, Brinkman R, Eaves C. Long-term propagation of distinct hematopoietic differentiation programs in vivo. Cell Stem Cell. 2007;1:218–229. doi: 10.1016/j.stem.2007.05.015. [DOI] [PubMed] [Google Scholar]
- Gerrits A, Dykstra B, Kalmykowa O, Klauke K, Verovskaya E, Broekhuis M, de Haan G, Bystrykh L. Cellular barcoding tool for clonal analysis in the hematopoietic system. Blood. 2010;115:2610–2618. doi: 10.1182/blood-2009-06-229757. [DOI] [PubMed] [Google Scholar]
- Hacein-Bey-Abina S, Hauer J, Lim A, Picard C, Wang GP, Berry CC, Martinache C, Rieux-Laucat Fdr, Latour S, Belohradsky BH, et al. Efficacy of Gene Therapy for X-Linked Severe Combined Immunodeficiency. New England Journal of Medicine. 2010;363:355–364. doi: 10.1056/NEJMoa1000164. [DOI] [PMC free article] [PubMed] [Google Scholar]
- Heim DA, Dunbar CE. Hematopoietic stem cell gene therapy: towards clinically significant gene transfer efficiency. ImmunolRev. 2000;178:29–38. 29–38. doi: 10.1034/j.1600-065x.2000.17802.x. [DOI] [PubMed] [Google Scholar]
- Jordan C, Lemischka I. Clonal and systemic analysis of long-term hematopoiesis in the mouse. Genes and Development. 1990;4:220–232. doi: 10.1101/gad.4.2.220. [DOI] [PubMed] [Google Scholar]
- Kim S, Kim N, Presson A, An D, Mao S, Bonifacino A, Donahue R, Chow S, Chen I. High-throughput, sensitive quantification of repopulating hematopoietic stem cell clones. Journal of Virology. 2010;84:11771–11780. doi: 10.1128/JVI.01355-10. [DOI] [PMC free article] [PubMed] [Google Scholar]
- Kohn DB, Candotti F. Gene Therapy Fulfilling Its Promise. New England Journal of Medicine. 2009;360:518–521. doi: 10.1056/NEJMe0809614. [DOI] [PubMed] [Google Scholar]
- Kondo M, Wagers A, Manz M, Prohaska S, Scherer D, Beilhack G, Shizuru J, Weissman I. Biology of hematopoietic stem cells and progenitors: implications for clinical application. Annual Review of Immunology. 2003;21:759–806. doi: 10.1146/annurev.immunol.21.120601.141007. [DOI] [PubMed] [Google Scholar]
- Langfelder P, Horvath S. WGCNA: an R package for weighted correlation network analysis. BMC Bioinformatics. 2008;9:559. doi: 10.1186/1471-2105-9-559. [DOI] [PMC free article] [PubMed] [Google Scholar]
- Lemischka IR, Raulet DH, Mulligan RC. Developmental potential and dynamic behavior of hematopoietic stem cells. Cell. 1986;45:917–927. doi: 10.1016/0092-8674(86)90566-0. [DOI] [PubMed] [Google Scholar]
- Lu R, Neff N, Quake S, Weissman I. Tracking single hematopoietic stem cells in vivo using high-throughput sequencing in conjunction with viral genetic barcoding. Nature Biotechnology. 2011;29:928–933. doi: 10.1038/nbt.1977. [DOI] [PMC free article] [PubMed] [Google Scholar]
- McKenzie J, Gan O, Doedens M, Wang J, Dick J. Individual stem cells with highly variable proliferation and self-renewal properties comprise the human hematopoietic stem cell compartment. Nature Immunology. 2006;7:1225–1233. doi: 10.1038/ni1393. [DOI] [PubMed] [Google Scholar]
- Morita Y, Ema H, Nakauchi H. Heterogeneity and hierarchy within the most primitive hematopoietic stem cell compartment. Journal of Experimental Medicine. 2010;207:1173–1182. doi: 10.1084/jem.20091318. [DOI] [PMC free article] [PubMed] [Google Scholar]
- Muller-Sieburg C, Sieburg H, Bernitz J, Cattarossi G. Stem cell heterogeneity: implications for aging and regenerative medicine. Blood. 2012;119:3900–3907. doi: 10.1182/blood-2011-12-376749. [DOI] [PMC free article] [PubMed] [Google Scholar]
- Muller-Sieburg CE, Cho RH, Thoman M, Adkins B, Sieburg HB. Deterministic regulation of hematopoietic stem cell self-renewal and differentiation. Blood. 2002;100:1302–1309. [PubMed] [Google Scholar]
- Naik SH, Perie L, Swart E, Gerlach C, van Rooij N, de Boer RJ, Schumacher TN. Diverse and heritable lineage imprinting of early haematopoietic progenitors. Nature. 2013;496:229–232. doi: 10.1038/nature12013. [DOI] [PubMed] [Google Scholar]
- Nienhuis AW, Dunbar CE, Sorrentino BP. Genotoxicity of Retroviral Integration In Hematopoietic Cells. Mol Ther. 2006;13:1031–1049. doi: 10.1016/j.ymthe.2006.03.001. [DOI] [PubMed] [Google Scholar]
- Osawa M, Hanada K, Hamada H, Nakauchi H. Long-term lymphohematopoietic reconstitution by a single CD34- low/negative hematopoietic stem cell. Science. 1996;273:242–245. doi: 10.1126/science.273.5272.242. [DOI] [PubMed] [Google Scholar]
- Pina C, Fugazza C, Tipping AJ, Brown J, Soneji S, Teles J, Peterson C, Enver T. Inferring rules of lineage commitment in haematopoiesis. Nat Cell Biol. 2012;14:287–294. doi: 10.1038/ncb2442. [DOI] [PubMed] [Google Scholar]
- Presson A, Kim N, Xiaofei Y, Chen I, Kim S. Methodology and software to detect viral integration site hot-spots. BMC Bioinformatics. 2011;12:367. doi: 10.1186/1471-2105-12-367. [DOI] [PMC free article] [PubMed] [Google Scholar]
- Purton LE, Scadden DT. Limiting Factors in Murine Hematopoietic Stem Cell Assays. Cell Stem Cell. 2007;1:263–270. doi: 10.1016/j.stem.2007.08.016. [DOI] [PubMed] [Google Scholar]
- Sander W, Metzger M, Morizono K, Bonifacino A, Penzak S, Xie Y, Chen I, Bacon J, Sestrich S, Szajek L, et al. Noninvasive molecular imaging to detect transgene expression of lentiviral vector in nonhuman primates. Journal of Nuclear Medicine. 2006;47:1212–1219. [PubMed] [Google Scholar]
- Shi PA, Hematti P, Kalle Cv, Dunbar CE. Genetic marking as an approach to studying in vivo hematopoiesis: progress in the non-human primate model. oncogne. 2002;21:3274–3283. doi: 10.1038/sj.onc.1205320. [DOI] [PubMed] [Google Scholar]
- Shimizu S, Hong P, Arumugam B, Pokomo L, Boyer J, Koizumi N, Kittipongdaja P, Chen A, Bristol G, Galic Z, et al. A highly efficient short hairpin RNA potently down-regulates CCR5 expression in systemic lymphoid organs in the hu-BLT mouse model. Blood. 2010;115:1534–1544. doi: 10.1182/blood-2009-04-215855. [DOI] [PMC free article] [PubMed] [Google Scholar]
- Shimizu S, Kamata M, Kittipongdaja P, Chen K, Kim S, Pang S, Boyer J, Qin F, An D, Chen I. Characterization of a potent non-cytotoxic shRNA directed to the HIV-1 co-receptor CCR5. Genetic Vaccines and Therapy. 2009;7:8. doi: 10.1186/1479-0556-7-8. [DOI] [PMC free article] [PubMed] [Google Scholar]
- Sieburg HB, Rezner BD, Muller-Sieburg CE. Predicting clonal self-renewal and extinction of hematopoietic stem cells. Proceedings of the National Academy of Sciences. 2011;108:4370–4375. doi: 10.1073/pnas.1011414108. [DOI] [PMC free article] [PubMed] [Google Scholar]
- Smith LG, Weissman IL, Heimfeld S. Clonal analysis of hematopoietic stem-cell differentiation in vivo. Proceedings of the National Academy of Sciences. 1991;88:2788–2792. doi: 10.1073/pnas.88.7.2788. [DOI] [PMC free article] [PubMed] [Google Scholar]
- Stein S, Ott M, Schultze-Strasser S, Jauch A, Burwinkel B, Kinner A, Schmidt M, Krämer A, Schwäble J, Glimm H, et al. Genomic instability and myelodysplasia with monosomy 7 consequent to EVI1 activation after gene therapy for chronic granulomatous disease. Nature Medicine. 2010;16:198–204. doi: 10.1038/nm.2088. [DOI] [PubMed] [Google Scholar]
- Verovskaya E, Broekhuis MJC, Zwart E, Ritsema M, van Os R, de Haan G, Bystrykh LV. Heterogeneity of young and aged murine hematopoietic stem cells revealed by quantitative clonal analysis using cellular barcoding. Blood. 2013;122:523–532. doi: 10.1182/blood-2013-01-481135. [DOI] [PubMed] [Google Scholar]
- Wang G, Berry C, Malani N, Leboulch P, Fischer A, Hacein-Bey-Abina S, Cavazzana-Calvo M, Bushman F. Dynamics of gene-modified progenitor cells analyzed by tracking retroviral integration sites in a human SCID-X1 gene therapy trial. Blood. 2010;115:4356–4366. doi: 10.1182/blood-2009-12-257352. [DOI] [PMC free article] [PubMed] [Google Scholar]
- Wang JC, Doedens M, Dick JE. Primitive human hematopoietic cells are enriched in cord blood compared with adult bone marrow or mobilized peripheral blood as measured by the quantitative in vivo SCID-repopulating cell assay. Blood. 1997;89:3919–3924. [PubMed] [Google Scholar]
- Weissman IL. Translating Stem and Progenitor Cell Biology to the Clinic: Barriers and Opportunities. Science. 2000;287:1442–1446. doi: 10.1126/science.287.5457.1442. [DOI] [PubMed] [Google Scholar]
Associated Data
This section collects any data citations, data availability statements, or supplementary materials included in this article.