

Abstract
It has been long known that patients treated with ionizing radiation carry a risk of developing a second cancer in their lifetimes. Factors contributing to the recently renewed concern about the second cancer include improved cancer survival rate, younger patient population as well as emerging treatment modalities such as intensity-modulated radiation treatment (IMRT) and proton therapy that can potentially elevate secondary exposures to healthy tissues distant from the target volume. In the past 30 years, external-beam treatment technologies have evolved significantly, and a large amount of data exist but appear to be difficult to comprehend and compare. This review article aims to provide readers with an understanding of the principles and methods related to scattered doses in radiation therapy by summarizing a large collection of dosimetry and clinical studies. Basic concepts and terminology are introduced at the beginning. That is followed by a comprehensive review of dosimetry studies for external-beam treatment modalities including classical radiation therapy, 3D-conformal x-ray therapy, intensity-modulated x-ray therapy (IMRT and tomotherapy) and proton therapy. Selected clinical data on second cancer induction among radiotherapy patients are also covered. Problems in past studies and controversial issues are discussed. The needs for future studies are presented at the end.
1. Introduction
The metaphor of a double-edged sword portrays a probably less-known fact about ionizing radiation’s therapeutic power. Owing to ever advancing medical technologies, the odds have been steadily improving in the cure of cancer patients treated by radiation alone or combined with surgery and/or systemic therapy (chemical, immunological and genetic). There is a serious and growing concern, however, about the risk of radiation-induced cancer and of late tissue injury among cancer survivors who are now younger and are living longer—thus potentially allowing for such radiation effects to manifest at a rate never seen before (Followill et al 1997, Hall and Wuu 2003, Kry et al 2005a, 2005b, Howell et al 2006, Paganetti et al 2006). A number of newly developed conformal radiotherapy procedures and modalities such as intensity-modulated radiation treatment (IMRT) and proton therapy are being widely adopted. A precautious question remains today: are we advancing these technologies at an ignored latent cost? The history of radiotherapy suggests that it is prudent for us to keep our eyes open on these rapidly evolving radiation treatment technologies and to ensure that an improved local tumor control does not have to compromise the protection of patients against adverse long-term effects.
The potentially carcinogenic effect of ionizing radiation is well known and has been extensively investigated. Early experiences in the 1900s were based on individuals accidentally exposed while working, for example, as radium dial painters, uranium miners or in physics or chemistry research. Most of our understanding of radiation effects on humans, including functional dose–response relationships, is largely based on incidence and cancer mortality for solid cancers and leukemia among atomic-bomb survivors in Japan (Preston et al 2003, 2004, Pierce and Preston 2000). These nuclear explosions caused acute radiation exposures over a very short period of time. Such exposures have different biological damage mechanisms than those experienced by radiotherapy patients who are treated with prolonged exposures in fractionated intervals. Many research groups have directly studied second cancer incidence rates among radiotherapy patients. Epidemiological data have shown that an exposure to ionizing radiation above 50–100 mSv increases the risk of, for examples, second prostate cancer (Brenner et al 2003) and second breast cancer in patients 30 years after the initial treatment (Travis et al 2003). A recent study has concluded that, even 40 years after initial radiation treatment of cervical cancer, survivors remain at an increased risk of second cancers (Chaturvedi et al 2007).
Although the long-time practice of radiotherapy has produced a considerable amount of literature on radiation-induced second malignancies among cancer survivors, these data are difficult to utilize toward improving our understanding and management of such radiation side effects. From the perspective of radiation dosimetry, a patient can be exposed to rather different levels of scattered radiation depending on the distance of an organ to the treated volume. Yet, detailed dosimetric information for these organs is not always available. Studies of radiation-induced cancer in patients can be divided into two general categories: dosimetric and epidemiological. Dosimetry studies focus on quantitative determination of the absorbed dose at a point or in an organ in the patient for a specific type of treatment procedure or modality. Dosimetry studies are performed by measurements, Monte Carlo calculations or both. Epidemiological studies, on the other hand, use patient data to assess the risk of radiation-induced second malignancies by quantifying the change in ‘incidence of cancer’ or ‘mortality from cancer’ using patient data either from a single institution or that extracted from tumor registries. In the past 50 years, radiation treatment techniques have evolved remarkably. Consequently, the dosimetry methods in the literature are quite diverse and the terminology is, sometimes, confusing.
To set a foundation for this review, we first introduce basic concepts and terminology in section 2. Section 3 is devoted to extensive dosimetry studies for external-beam treatment modalities including classical radiation therapy, 3D conformal x-ray therapy (3D-CRT), intensity-modulated x-ray therapy (IMRT and tomotherapy), proton therapy and other treatment modalities including stereotactic radiation therapy and carbon-ion radiation therapy. This is followed by sections 4, which covers selected clinical data on second cancer induction among radiotherapy patients and risk response functions. Section 5 discusses issues that need to be further addressed and is followed by a concluding section. This review article aims to provide readers with an understanding of principles, methods and unresolved issues related to this subject that has significantly evolved in the past several decades.
2. Basic concepts and terminology
2.1. Criteria for a malignancy to be classified as a radiation-induced second tumor
Criteria for classifying second cancers were originally defined by Cahan et al (1948) and are adopted here: (1) the second tumor occurs in locations irradiated by primary or secondary therapeutic beams, (2) the histology of the second tumor is different from that of the original disease so a metastasis is excluded, (3) the existence of a latency period, typically of several years, (4) the second tumor was not present at the time of radiation treatment and (5) the patient does not have a cancer-prone syndrome.
2.2. Secondary radiation sources in external-beam radiation treatment
External-beam radiation treatment is the most popular form of radiotherapy. Machines based on kilovoltage x-rays and cobalt-60 gamma rays have been replaced by linear electron accelerators that produce energy-tunable bremsstrahlung x-rays up to 18 MV of energy for 3D conformal therapy. There are three unintended radiation sources from such an accelerator: (1) scattered radiation inside the patient body, (2) scattered radiation from the head of the accelerator where collimators are located and (3) leakage radiation from other parts of the accelerator. When the energy is high enough, secondary neutrons are also produced from photonuclear interactions. The threshold energy for photoneutron production lies in the range of 6–13 MeV for most materials. Such neutrons will irradiate the patient in locations away from the tumor. Photonuclear interactions can result in short-lived radionuclides via photon and/or neutron activations in the accelerator and surroundings materials. More recently developed intensity modulation techniques require the accelerator to be energized for a longer time (typically by about a factor of 3–4) than that for 3D-CRT methods, thus increasing the overall exposure of a patient to secondary radiation. On the other hand, IMRT typically uses 6 MV photons, thus avoiding the production of secondary neutrons.
In proton therapy, secondary neutrons are produced in the treatment head and in the patient. These neutrons deposit dose indirectly outside the main radiation field. Two treatment techniques, based on different principles, are commonly used for proton therapy: the passive scattering technique and the beam scanning technique. The first method needs various scatterers, beam-flattening devices, collimators and energy modulation devices. Additionally, for each patient, individual apertures and compensators are used. For proton beam scanning, a proton pencil beam is magnetically scanned over the target volume without the need for scattering, flattening or compensating devices. Because of fewer scattering devices, the scanning method produces a lower neutron background than passive scattering.
2.3. Modalities, radiation energies and dose ranges
In a typical external photon beam treatment that delivers a lethal dose to the tumor, the healthy tissues will be inevitably irradiated by primary and/or scattered radiation at very different levels. For example, using 50 and 5 percentiles, organs adjacent to, near to, and distant from the tumor target can receive high (50 Gy and above), intermediate (5–50 Gy) and low level of doses (<5 Gy). The low-level doses are received by organs located far away from the treated tumor and are at a level that is more comparable to doses from diagnostic procedures that irradiate a healthy tissue more uniformly. This classification of dose levels, though arbitrary, can be useful when different dosimetry methods and biological effects are discussed. In addition to external-beam treatment, a patient may also undergo brachytherapy or radionuclide-based nuclear medicine procedures. Furthermore, during the course of external-beam treatment, a patient is subjected to ‘concomitant dose’ from image-guided localization and verification procedures (Waddington and McKenzie 2004, Aird 2004, Murphy et al 2007). Table 1 summarizes various radiotherapy and diagnostic imaging modalities and the associated radiation dose levels. It needs to be noted that radiation doses from multiple procedures are recorded separately and most dosimetry studies only focus on a single modality/procedure. In this article, we only review studies related to the secondary radiation in external-beam treatment.
Table 1.
Modalities, radiation energies and approximated dose levels.
| Radiation type | Energy | Approximate dose level
|
||
|---|---|---|---|---|
| Primary target | Organs outside the treatment volume | |||
| (1) Radiation treatment | ||||
| (a) External beam | Photons, electrons, protons and neutrons | 1.32 and 1.17 MeV from a Co-60 source, 4–250 MeV from various x-ray and proton beams | Up to 100 Gy (or Gy × RBE) | Low-dose level: <5 Gy Intermediate-dose level: 5–50 Gy High-dose level: >50 Gy |
| (b) Brachytherapy | Gamma-ray photons, electrons and neutrons (Ra-226, Cs-137, Ir-192, I-125 and electronic x-ray sources) | <2 MeV | ~60 Gy | ~1 Gy |
| (c) Radioimmunotherapy (RIT) | Photons, electrons, alphas (Y-90, Bi-214, etc) | <5 MeV | ~100 Gy | ~10 Gy |
| (2) Diagnostic imaging | ||||
| (a) Radiography | X-ray photons | <150 kVp | ~0.01 Sv effective dose per scan | |
| (b) Multi-slice CT (4D) | X-ray photons | <140 kVp | ~0.05–0.1 Sv effective dose per scan | |
| (c) Interventional fluoroscopy | X-ray photons | <140 kVp | ~0.2 Sv effective dose per scan | |
| (d) Hybrid PET/CT | Photons/positrons | 0.511 keV | ~0.02 Sv effective dose per scan | |
| (e) Cone beam CT procedures for image-guided RT | X-ray photons | MV or KV | Up to ~1 Sv effective dose for30 fractions | |
2.4. Geometry of secondary radiation
For treatment planning purposes, the patient’s anatomy can be divided into three regions. The first region is the target (tumor) area, which is characterized by the gross tumor volume, clinical target volume and planning target volume (ICRU 1994). The second region is made up of organs at risk (OARs), which are located adjacent to the tumor. OARs may or may not intersect directly with the beam path and are allowed to receive intermediate-level doses according to dose constraints specified in a treatment plan. The third region is the rest of the patient body, which is typically not covered by any diagnostic imaging procedure in a treatment plan, may receive low-level scattered doses from the accelerator head. The priority in the treatment plan is to apply the maximum dose to the tumor based on dose constraints of the surrounding OARs. These dose constraints are based on clinical experience and aim at minimizing side effects (normal tissue complications). Such side effects can potentially include second cancers. It is believed that the therapeutic dose aims at killing all tumor cells thus leaving little chance for cell mutation. For this reason, dosimetry studies of second cancers often focused on regions that were ‘outside the treatment volume’. Most studies, as reviewed later in this article, have identified second tumors to be located adjacent to the target volume in the intermediate-dose level. However, several studies have considered tissues partially inside the treatment volume in the high-dose level. Another term, ‘out-of-field’, has also been frequently used in earlier literature to mean all locations inside a physical phantom outside of the ‘field edge’ defined by the accelerator jaws in classical treatment methods. Similar terms such as ‘peripheral dose’ and ‘non-target dose’ have also been used. In a treatment plan, dosimetry information often exists for organs that are irradiated within the primary beam path. However, dosimetry for organs or tissues outside the portion of the body that is imaged for treatment planning will need to be reconstructed using whole-body patient models and Monte Carlo calculations. The term ‘integral dose’ is sometimes used to describe the mean energy imparted (in a unit of kg Gy) in a given volume such as the whole body of the patient including the tumor as well as all healthy tissues.
2.5. Relevant dose and risk quantities
Many different dosimetry and risk quantities have been used in the literature on second cancer studies. Some of the radiation protection quantities and algorithms have undergone several revisions (ICRP 1991, 2007). Here, we provide a summary of selected quantities that will be used in later sections to avoid confusion.
2.5.1. Physical dosimetry
In radiation dosimetry, the basic quantity is the absorbed dose, which is determined as the quotient of mean energy imparted from any type of radiation and the mass of any irradiated material of interest. The SI unit of absorbed dose is J kg−1 or gray (Gy). Absorbed dose is typically measured or calculated as an average quantity over a volume of mass. The term ‘absorbed dose’ is often referred as ‘dose’ such as in the ‘target dose’.
2.5.2. Radiation protection
The relative biological effectiveness (RBE) depends on the type of radiation (e.g., photons, electrons, neutrons) as well as the particle energy, the dose and the biological endpoint. The RBE is normalized to a reference radiation (x-rays or gamma rays) for a given biological effect (ICRP 2007). For radiation protection involving relatively low-dose levels, the ‘radiation weighting factor’ is used as a conservative and simplified measure of the RBE (ICRP 2007). The ICRP also defines a protection quantity, ‘equivalent dose’, as the average absorbed dose in an organ or tissue T, multiplied by the radiation weighting factor for the type, and sometimes the energy, of the radiation (ICRP 1991, 2007). An older quantity ‘dose equivalent’ was defined for a point in the medium (ICRP 1977). The radiation weighting factor converts the absorbed dose in Gy to Sievert (Sv). In the 2007 ICRP recommendations for photons and electrons, the radiation weighting factor is defined as 1, whereas, for neutrons, the weighting factor depends on specific energy and, for alpha particles, the weighting factor is defined as 20 (ICRP 1991, 2007). In particular, the calculation of neutron equivalent dose for an organ requires the knowledge about the underlying neutron energy distribution—information obtainable only from dedicated experiments or Monte Carlo calculations. Another radiation protection quantity is ‘effective dose’ which is calculated as weighted sum of various organ or tissue doses and is used to indicate whole-body stochastic risk (ICRP 1991, 2007). The ICRP developed the concept of effective dose (and it predecessor, effective dose equivalent) in order to recommend an occupational dose limit for radiation protection. The ICRP (1991, 2007) has stated that, for situations involving high doses, doses should be evaluated in terms of absorbed dose and, where high-LET radiations (e.g. neutrons or alpha particles) are involved, an absorbed dose weighted with an appropriate RBE should be used (Cox and Kellerer 2003). Furthermore, ICRP (1991, 2007) stated that the effective dose concept should not be used to indicate risk for specific individuals.
2.5.3. Epidemiological risk assessment
Cancer risk is either specified as the risk for incidence or the risk for mortality and dose–response relationships are typically defined as a function of age, gender and site. The cancer incidence rate at a given point in time is defined as the ratio of diagnosed individuals in a time interval divided by the interval duration and the total number of unaffected individuals at the beginning of this interval. Cancer risk, on the other hand, is defined as the probability for disease occurrence in the population under observation, i.e. risk equals the ratio of diagnosed to total number of individuals in the given time interval. The baseline risk refers to the incidence of cancer observed in a group without a specific risk factor (e.g., the unirradiated reference population). In order to obtain a measure of the relation between the incidence rate in the exposed population and the incidence rate in the unexposed population one can use either their difference or their ratio. Relative risk (RR) is the rate of disease among groups with a specific risk factor (e.g., having received some radiation) divided by the rate among a group without that specific risk factor. Excess relative risk (ERR) is defined as the rate of an effect (e.g. cancer incidence or mortality) in an exposed population divided by the rate of the effect in an unexposed population minus 1 or RR − 1. Thus, in risk models using ERR, the excess risk is expressed relative to the background risk. Absolute risk (AR) is the rate of a disease among a population, e.g., cancer cases per capita per year. Excess absolute risk (EAR) is the rate of an effect (e.g. cancer incidence or mortality) in an exposed population minus the rate of the effect in an unexposed population, i.e. the excess absolute risk (EAR) is the difference between two absolute risks. Thus, in risk models using EAR, the excess risk is expressed as the difference in the total risk and the background risk. When modeling a dose–response relationship for a specific disease (e.g. radiation-induced cancer), one can either use the concept of ERR or the concept of EAR. In general, estimates based on relative risks (and ERR) can have less statistical uncertainties and thus are more meaningful for small risks. On the other hand, absolute risk (and EAR) is often used to describe the impact of a disease on the population. The excess risk can be calculated as a function of attained age of the individual, age at exposure, dose received, sex index and an index denoting population characteristics. Another term, the lifetime attributable risk (LAR), provides the probability that an individual will die from (or develop) a disease associated with the exposure. The LAR can be calculated by integrating ERR or EAR (preferred) over the expected lifetime. The BEIR (2006) report provides formalisms for calculating risks of cancer incidence and mortality for a variety of sites.
3. Dosimetry data
In this section, dosimetry studies are presented for external photon, proton and additional modalities. Under section 3.1 on photon treatments, classical radiation treatments including 3D-CRT and earlier modalities are covered first. This is followed by IMRT, tomotherapy and stereotactic radiation therapy. Section 3.1.5 summarizes the data from selected studies in several graphs. Section 3.2 covers passive scattering technique and beam scanning for intensity-modulated proton therapy. Finally, section 3.3 addressed neutron and electron therapy, stereotactic body radiation therapy as well as carbon-ion therapy.
3.1. External photon beam radiation therapy
3.1.1. Classical radiation therapy including 3D-CRT
Radiation treatment depends on specific radiation delivery technologies. Over the years, treatment technology and understanding about second cancer effects have evolved considerably. Prior to 1970s, there was a limited attention on scattered radiation and the potential to induce second cancers for patients (Laughlin 1951, Martin and Evans 1959, Keller et al 1974). Later, many studies were performed to investigate secondary photon and neutron exposures for the protection of both the patient and environment for some of the most widely used radiation therapeutic modalities. Table 2 chronologically summarizes major dosimetry studies on classical treatment techniques that were developed prior to the advent of IMRT, tomotherapy and stereotactic radiation therapy. While these more conventional radiation therapy methods have been mostly replaced by modern treatments, especially in more developed countries, these dosimetry methods are important in understanding the second cancer data on patients who continue to be monitored in epidemiological studies. Many of these studies focused on occupational radiation safety (ORS) for medical personnel instead of patient safety and very few reported averaged organ doses.
Table 2.
Dosimetry studies on classical treatment techniques prior to 3D-CRT and IMRT. The last column describes the type of dose data that was presented. The acronym ORS stands for occupational radiation safety studies.
| Author | Dosimetry method | Secondary radiation | Accelerator | Quantity |
|---|---|---|---|---|
| Wilenzick et al (1973) | Measurement | Neutron | a | ORS |
| McGinley et al (1976) | Measurement | Neutron | Varian Clinac 18 Allis-Chalmers Betatron BBC betatron |
ORS |
| Rawlinson and Johns (1977) | Measurement | Photon | a | ORS |
| Holeman et al 1977) | Measurement | Neutron | CGR Sagittaire | ORS |
| McCall et al (1978) | Measurement and Monte Carlo | Neutron |
239PuBe source 252Cf source |
ORS |
| McCall and Swanson (1979) | Measurement and Monte Carlo | Neutron | b | ORS |
| Tochilin and LaRiviere (1979) | Measurement | Photon | Varian Clinac 18 | ORS |
| Dixon (1980) | Measurement | Photon | Varian Clinac 18 | ORS |
| Swanson (1979) | Measurement and Monte Carlo | Neutron | b | Integral dose |
| Herman et al (1980) | Measurement | Photon | Siemens Mevatron XX | ORS |
| Rogers and Van Dyk (1981) | Measurement | Neutron | AECL Therac 20 Sagittaire Thorac 40 Varian Clinac 18,35 Allis-Chalmers Betatron Siemens Mevatron XX |
ORS |
| Ing and Shore (1982) | Monte Carlo | Photon and neutron | Varian Clinac 35 | Integral dose |
| Ing et al (1982) | Monte Carlo | Photon and neutron | Varian Clinac 35 | Integral dose |
| Allen and Chaudhri (1982) | Neutron, proton and alpha | b | In-field dose | |
| Fraass and van de Geijn (1983) | Measurement | Photon |
60Co AECL Eldorado 79 Varian Clinac 4/100 Siemens Mevatron VI |
Out-of-field dose |
| Kase et al (1983) | Measurement | Photon | a | Out-of-field dose |
| Greene et al (1983) | Measurement | Photon | a | Out-of-field dose |
| Palta et al (1984) | Measurement | Neutron | Siemens Mevatron 77 | ORS |
| Nath et al (1984) | Measurement | Neutron | a | Out-of-field dose |
| Sherazi and Kase (1985) | Measurement | Photon | a | Out-of-field dose |
| LaRiviere (1985) | Measurement | Neutron | Varian Clinac 2500 | ORS |
| Uwamino et al (1986) | Measurement and generic model | Neutron | MM2 microtron | ORS |
| Allen and Chaudhri (1988) | Measurement | Neutron | b | In-field dose |
| Francois et al (1988) | Measurement and generic model | Photon |
60Co AECL Theratron 80 CGR Sagittaire |
Out-of-field dose |
| Stovall et al (1989) | Measurement | Photon | Phillips RT 250 60Co AECL Theratron 80 Van de Graff Generator Allis-Chalmers Betatron |
Organ equivalent dose |
| McParland and Fair (1992) | Measurement and generic model | Photon | Varian Clinac 6/100 | Out-of-field dose |
| van der Giessen and Hurkmans (1993) | Measurement and generic model | Photon | 60Co AECL Theratron 780 | Out-of-field dose |
| van der Giessen (1994) | Measurement and generic model | Photon | AECL Therac 6 GE Saturne 41 GE Saturne 25 |
Out-of-field dose |
| Stovall et al (1995) | Measurement | Photon | Varian Clianc 2100C, 4, 4/100 Siemens Mevatron 74 Philips SL25 AECL Therac 6 60Co AECL Theratron 780 |
Out-of-field dose |
| Agosteo et al (1995) | Monte Carlo | Neutron | Varian Clinac 2100C | Out-of-field dose |
| Diallo et al (1996) | Measurement and generic model | Photon |
60Co AECL Theratron 780 4 MV Orion-GE |
Out-of-field dose |
| van der Giessen (1996a, 1996b) | Measurement and generic model | Photon | See references | Out-of-field dose |
| van der Giessen (1997) | Measurements and generic model | Photon | GE Saturne 41/43 60Co AECL Theratron 780 |
Out-of-field dose |
| van der Giessen and Bierhuizen (1997) | Measurements and generic model | Photon | GE Saturne 41/43 60Co AECL Theratron 780 |
Out-of-field dose |
| Allen and Chaudhri (1997) | Neutron, proton and alpha | b | In-field dose | |
| Mao et al (1997) | Monte Carlo (EGS4) | Neutron | Varian Clinac 2100/2300C |
ORS |
| Stevens et al (1998) | Measurement | Photon | Varaina Clinac 6/100 60Co AECL Theratron |
Organ equivalent dose |
| d’Errico et al (1998a, 1998b) | Measurement | Neutron | CGR Saturne 20 | Out-of-field dose |
| Kase et al (1998) | Monte Carlo (EGS4) | Neutron | Varian Clinac 2100/2300C |
ORS |
| Mazonakis et al (2003) | Measurement | Photon | Phillips SL 75/5 | Out-of-field dose |
| Stovall et al (2004) | Measurement and generic model | Photon |
60Co AECL Theratron 80 Varian Clinac 4, 2100C Allis-Chalmers Betatron Philips SL25 |
Organ equivalent dose |
Unable to obtain machine type.
Medical accelerator not used in study. Instead a bremstrahlung source was generated using a monoenergetic electron beam.
In the 1970s, the transition from low-energy radiation sources such as betatrons and 60Co machines to high-energy linear accelerators prompted early concerns about the potential neutron production when using beam energies in excess of the common 6 MV. Many of these studies from 1970s to 1990s focused on the occupational radiation safety of medical personnel (Wilenzick et al 1973, McGinley et al 1976, Rawlinson and Johns 1977, Holeman et al 1977, McCall et al 1978, McCall and Swanson 1979, Tochilin and LaRiviere 1979, Herman et al 1980, Greene et al 1983, Rogers and Van Dyke 1981, Palta et al 1984, LaRiviere 1985, Uwamino et al 1986, Agosteo et al 1995, Mao et al 1997, Kase et al 1998). Although these studies do not provide specific data on risk of radiation-induced second cancer, the early experiences in assessing neutron contamination were quite useful later on.
Unfortunately, there were limited studies on the patient safety from neutron contamination during early times (Herman 1980, Ing and Shore 1982, Ing et al 1982, Nath et al 1984, d’Errico et al 1998a, 1998b). These studies were most performed to demonstrate the need for various national committees (USCSG 1978) to consider neutron production in setting various regulatory limits on radiation treatment machines. Ing and Shore (1982) and Ing et al (1982) used Monte Carlo methods to calculate photon and neutron dose inside and outside the treatment field. In this study a monoenergetic radiation beam was considered, and simple slab phantom was used to represent the patient. For two different field sizes, the integral dose inside and outside the treatment volume was calculated. For the smaller field size of 100 cm2, the integral dose was 0.12 g Gy. The authors also included concrete walls to account for room scattering in their simulations. The walls increased neutron doses by about 20%. Swanson (1979) used measurement data to estimate the risk of cancer induction in radiation therapy. He found that the leakage neutron component contributes to about 5 × 10⁻² g Gy to the integral dose for a therapeutic dose of 50 Gy. The difference in the two integral dose values from these studies was due to the fact that the value of neutron fluence assumed by Ing et al (1982) was four times larger than that used by Swanson (1979). The data reported by Swanson (1979) was eventually used to supplement an AAPM task group report that focused on estimating the increased risk to a radiation therapy patient from neutron irradiation (Nath et al 1984). Using risk coefficients from epidemiological studies on radiation-induced leukemia, the Task Group estimated that 5.0 × 10⁻⁵ fatal second cancers per year may develop as a result of the increase of neutron dose to the patient.
d’Errico et al (1998a, 1998b) used superheated drop detectors with different neutron energy responses to evaluate equivalent dose for photoneutrons produced. Measurements were carried out in patients undergoing high-energy x-ray radiation therapy and were also repeated in-phantom, under similar irradiation geometries. The neutron equivalent dose measured near the cervix for a patient undergoing a mantle field irradiation was determined to be 0.42 mSv per treatment Gy for this patient. The neutron equivalent dose measured near the cervix for a patient undergoing a pelvic field irradiation was determined to be 1.6 mSv per treatment Gy. The equivalent dose values differed between in vivo and in-phantom measurements by ±20%. In a subsequent study, d’Errico et al (2001) took similar in-phantom measurements using a different accelerator.
Allen and Chaudhri (1982) were among the first to investigate the secondary exposures from photonuclear reactions inside patients during radiotherapy. These reactions create neutrons, protons, alpha particles and heavy recoil nuclei, which give rise to dose components to the patient both inside and outside the treatment field. For 24 MeV bremsstrahlung x-ray beams, photonuclear reaction yields were calculated. It was found that 61% of the dose was from protons, while 34% and 5% of the dose was from neutrons and alpha particles, respectively. The authors reported that, for beam energies less than 16 MV, isotopes such as 2H, 13C, 15N, 17O and 18O contribute the most to the neutron production in tissue. However, at 18 MV and above, 16O is the predominate contributor of the photoneutron yield (Allen and Chaudhri 1988). In a subsequent study, Allen and Chaudhri (1997) recalculated charged photonuclear particle yields for bremsstrahlung x-ray energies from 3 to 28 MeV. The new photonuclear reaction yields were only slightly different than those from the previous study. However, the equivalent dose to the patient was not adequately studied.
While patient exposure to neutron contamination was a major concern during 1970s and 1980s, several groups also studied photon doses outside the treatment field (Fraass and van de Geijn 1983, Kase et al 1983, Sherazi and Kase 1985, Stovall et al 1989). Fraass and van de Geijn (1983) were one of the first groups to perform detailed studies of the various components of out-of-field photon dose. The authors compared several megavoltage photon beams and characterized the dose outside the treatment field as a function of beam energy. The group also devised a scheme to measure leakage and scattered radiation separately using lead shielding. Kase et al (1983) measured dose from 4 and 8 MV accelerators and a 60Co machine. The group differentiated contributions from leakage and scatter radiation, noting that collimator scatter contributes to about 20–40% of the total dose outside of the treatment field, depending on machine, field size and distance from the field. It was reported that leakage radiation was the major contribution to the out-of-field dose in locations beyond 60 cm from the central axis. Sherazi and Kase (1985) made similar measurements but included the effects of blocks and field wedges. The group found that the use of wedges caused 2–4 times increase in the scattered radiation at any point outside the field.
As a part of an epidemiological study on cervical cancer, Stovall et al (1989) developed a systematic dosimetric method for determining tissue doses for about 20 000 patients who were treated for cancer of the uterine cervix at many institutions in the United States, Canada and Europe from 1916 to 1975. This work was the most significant dosimetry effort related to second cancer studies. The authors measured and calculated doses from external-beam radiation therapy involving several treatment machines. Measurements were made in an anthropomorphic female phantom. Calculations were done by either using Monte Carlo or by using measurement-based models to analyze the contribution of leakage and scatter radiation. Other measurement-based models to estimate dose outside the treatment field have been developed (Francois et al 1988, McParland and Fair 1992, Diallo et al 1996). Later, Stovall et al (2004) reconstructed gonadal dose for childhood cancer patients as part of a multi-institutional effort to study the genetic effects of radiation therapy using methods previously developed (Stovall et al 1989). Another dose reconstruction project was performed by Stevens et al (1998) for children who underwent prophylactic cranial conventional radiation therapy. Doses were determined for these children using both anthropomorphic and in vivo measurements. These dosimetry data were then used to improve risk models of thyroid complications to children undergoing similar treatments.
Perhaps the most complete dataset of photon doses outside of the treatment field was provided by the AAPM Task Group Report No. 36 (Stovall et al 1995). This report described dosimetry techniques and data for pregnant radiation therapy patients. Dosimetry data in a slab phantom for locations outside the treatment field were provided for various beam energies, measurement depths and field sizes. The data were meant to help medical physicists to estimate dose to the fetus before physical measurements are taken. It was later shown that dose calculations using the TG-36 data can lead to either overestimates or underestimates of the fetal dose for irregular fields (Kry et al 2007a). Mazonakis et al (2003) measured fetal dose to patients receiving conventional radiation therapy for Hodgkin’s disease. For both anterior–posterior (AP) and posterior–anterior (PA) fields, dose measurements using several irregular fields were taken as a function of distance from the isocenter. All measurements were made in an anthropomorphic Rando phantom with and without fetal shielding devices.
An extensive effort to develop simple and generally applicable methods using measurement data to estimate out-of-field dose was reported by van der Giessen and colleagues (van der Giessen and Hurkmans 1993, van der Giessen 1994, 1996a, 1996b, 1997, van der Giessen and Bierhuizen 1997). Two papers were published on generalized models and measurement data from one 60Co machine and three linear accelerators of energies 6, 10 and 23 MV (1993 MV (1994). The authors concluded that the contribution to the dose outside the treatment field from radiation leakage and scatter did not differ considerably between treatment machines from different manufacturers. In a later study, van der Giessen (1996a) further compared measurement data from several machines. It was determined that there was no large variation in leakage radiation dose between different accelerator types, but there was some variation of collimator scatter dose, due to collimator angle and design. The previous model developed by van der Giessen and Hurkmans (1993) was improved upon by averaging several published values of dose outside the treatment field (van der Giessen 1996b). It was assumed that the contributions to out-of-field dose only depended on energy and was irrespective of the machine under consideration. Therefore, data were provided for a combined treatment energy ranging from 4 to 25 MV for various field sizes. In a more recent paper, van der Giessen (1997) compared the above method with measured out-of-field dose in patients. For all treatments combined, the calculated dose exceeded the measured dose by about 9%.
During the 1970s and 1980s, studies on neutron and photon dose outside the treatment field greatly improved our understanding of dose distributions inside patients who underwent classical radiation treatments. By the early 1990s, it was clear that (1) the photon dose decreases exponentially with increasing distance from the field edge used in the classical modalities; (2) the neutron dose is relatively independent of distance from the field edge; (3) the dependence of photon dose outside the treatment field on both depth and beam energy is very weak; (4) the dependence of neutron dose on depth and beam energy is very strong and (5) the dose outside the treatment field increases with increasing field size. Furthermore, the dependence of collimator scatter, patient scatter and leakage on distance from the field edge was also well understood. The major contributors of dose to tissues in close proximity to the field edge are collimator scatter and patient scatter. As the distance increases from the field edge collimator scatter decreases, and patient scatter becomes more dominant. At greater distances patient scatter and head leakage are approximately equal, and eventually leakage begins to dominate.
3.1.2. IMRT
In the mid-1990s, there was a renewed concern about secondary radiation associated with the shift from classical radiation therapy modalities (including the 3D-CRT) to intensity-modulated radiation therapy (IMRT). Using medical linear accelerators equipped with multileaf collimator systems (MLCs) and sophisticated optimization algorithms, IMRT techniques can achieve better dose conformality in the high-dose region by carefully modulating photon fluence within a subset of the beams (Webb 2000, 2004). By design, an IMRT procedure involves the irradiation of a larger volume of normal tissue and the total treatment time is longer (Followill et al 1997, Hall and Wuu 2003). For worst-case scenarios, Followill et al (1997) computed that risks from 6 MV conventional radiation therapy, 6 MV IMRT and 6 MV tomotherapy are 0.4%, 1.0% and 2.8%, respectively. The calculated risks are even higher for 18 MV IMRT treatments that produce neutrons. The biggest contributor to the potential increase in second cancer risk for these novel treatment techniques is the fact that both IMRT and tomotherapy require many more monitor units (MU) to deliver the same amount of prescribed dose to the tumor. In modern radiation therapy treatment machines, ionization chambers are used to monitor the radiation output for precise delivery of the prescribed dose. As a common practice, such monitor chambers are calibrated in such a way that 1 MU corresponds to 1 cGy at the depth of the maximum dose on the central axis under reference dosimetry conditions. Since IMRT and tomotherapy use modulated radiation beams, these techniques require more radiation output, or MUs, than conventional treatments. Since 1997, it became apparent that more attention should be focused on studying dose distributions from both photons and neutrons outside the treatment volume from these new treatment techniques. Table 3 outlines various measurements and Monte Carlo calculations for accelerators used for IMRT. Studies involving tomotherapy and stereotactic radiotherapy are also included in the table.
Table 3.
Dosimetry studies on IMRT procedures. The last column describes the type of dose data that was presented in each study. ORS stands for occupational radiation safety studies.
| Author | Dosimetry method | Secondary radiation | Accelerator | Quantity |
|---|---|---|---|---|
| IMRT | ||||
| Followill et al (1997) | Measurement | Neutron and photon | GE Saturne 43 | Whole-body dose equivalent |
| Mutic and Klein (1999) | Measurement | Photon | Varian Clinac 2300C/D | Out-of-field dose |
| Stern et al (1999) | Measurement | Photon | Clinac 2100C 6 MV Clinac 600C |
Out-of-field dose |
| Verellen and Vanhavere (1999) | Measurement | Photon | Siemens (KDS 2) Mevatron | Whole-body dose equivalent |
| Ongaro et al (2000) | Monte Carlo (MCNP-GN) | Neutron | Elekta SL20 Siemens Mevatron |
Out-of-field dose |
| Lin et al (2001) | Measurement | Neutron | Siemens Primus | ORS |
| Mutic et al (2002) | Measurement | Photon | Elekta Precise | Out-of-field dose |
| Followill et al (2003) | Measurement | Neutron | Varian Clinac 2100C, 2300C, 2500 Siemens Primus, KD, MD, MD2 Elekta SL20, SL25 GE Saturne 43 |
Q-value |
| Difilippo et al (2003) | Monte Carlo (MCNPX) | Neutron, proton and alpha | a | In-field dose Organ dose |
| Chibani and Ma (2003) | Monte Carlo (MCNPX) | Neutron, proton and alpha | Varian Clinac 2160C Siemens Primus |
In-field dose Out-of-field dose |
| Vanhavere et al (2004) | Measurement | Neutron and photon | Varian Clinac 2300C/D | Organ equivalent dose |
| Zanini et al (2004) | Monte Carlo (MCNP-GN) | Neutron | Varian Clinac 2300C/D | Out-of-field dose |
| Koshy et al (2004) | Measurement | Photon | a | Organ equivalent dose |
| Barquero et al (2005) | Monte Carlo (MCNPX) | Neutron | b | Organ equivalent dose |
| Pena et al (2005) | Monte Carlo (MCNPX) | Neutron | Siemens Primus | ORS |
| Kry et al (2005a, 2005b) | Measurement | Neutron and photon | Varian Clinac 2100C Siemens Primus |
Out-of-field dose organ equivalent dose Whole-body dose equivalent |
| Howell et al (2005) | Measurement | Neutron | Varian 2300C/D | Out-of-field dose |
| Howell et al (2006) | Measurement | Neutron and photon | Varian Trilogy Clinac, 23EX | Organ equivalent dose |
| Klein et al (2006) | Measurement | Photon | Varian Clinac 23EX | Out-of-field dose |
| Mazonakis et al (2006) | Monte Carlo (MCNP) | Photon | Philips SL75/5 | Out-of-field dose |
| Reft et al (2006) | Measurement | Neutron and photon | Siemens Primus Philips SL-C Varian Clinac 2100 |
Out-of-field dose |
| Sharma et al (2006a, 2006b) | Measurement | Photon | Varian Clinac 2100 C/D | Out-of-field dose |
| Wang and Xu (2007) | Measurement | Photon | Varian Clinac 21EX | |
| Kry et al (2006) | Monte Carlo (MCNPX) | Photon | Varian Clinac 2100C | Out-of-field dose |
| Kry et al (2007b) | Monte Carlo (MCNPX) | Neutron and photon | Varian Clinac 2100C | Out-of-field dose |
| Mansur et al (2007) | Measurement | Photon | a | Organ equivalent dose |
| Tomotherapy | ||||
| Mutic and Low (1998) | Measurement | Photon | Peacock/MIMIC tomotherapy Varian Clinac 6/100 |
Out-of-field dose |
| Robinson et al (2000) | Generic model | Photon | a | ORS |
| Meeks et al (2002) | Measurement | Photon | Clinac 18/R – CORVUS TPS |
Out-of-field dose |
| Jeraj et al (2004) | Monte Carlo (MCNP) | Photon | TomoTherapy Hi-Art II | |
| Balog et al (2005) | Measurement | Photon | TomoTherapy Hi-Art II | ORS |
| Ramsey et al (2006) | Measurement | Photon | TomoTherapy Hi-Art Varian Clinac 21EX |
Out-of-field dose |
| Stereotactic radiotherapy | ||||
| Shepherd et al (1997) | Measurement | Photon | Philips SL75/5 | |
| Ioffe et al (2002) | measurement | Photon | 60Co Leksell Gamma Knife | Out-of-field dose |
| Maarouf et al (2005) | Measurement | Photon | Elekta SL 75/20 | Out-of-field dose |
| Petti et al (2006) | Measurement | Photon | CyberKnife Radiosurgery System | Out-of-field dose |
| Hasanzadeh et al (2006) | Measurement | Photon | 60Co Leksell Gamma Knife | Organ equivalent dose |
Unable to obtain machine type.
Model of neutron source used.
Earlier studies on out-of-field dose from classical treatment methods took measurements from a static radiation field, usually with the gantry fixed at 0°, in tissue- or water-equivalent slab phantoms (Fraass and van de Geijn 1983, Stovall et al 1995). For each of these measurements different parameters were varied including beam energy, field size and measurement depth. Similar measurements were taken for machines that were equipped with MLC for IMRT treatments (Mutic and Klein 1999, Stern et al 1999, Mutic et al 2002, Sharma et al 2006a, 2006b, Kry et al 2006, Klein et al 2006). For these measurements the MLCs were either retracted or set to match the field size defined by the secondary collimators. Therefore, only fixed treatment fields that included extra out-of-field shielding by the multi-leaf collimators (MLC) were considered. Mutic and Klein (1999) and Stern (1999) were among the first to compare out-of-field dose from machines equipped with and without MLCs. Both groups studied 6 and 18 MV photon beams; however, neutron production from the 18 MV was not considered. Compared to radiation fields from machines unequipped with MLCs, the out-of-field dose is reduced by as much as a factor of 2 for machines with MLCs aligned with the field edge. The MLC significantly reduces the out-of-field dose due to a reduction in scatter from the primary and secondary collimator, transmission through the collimator and head leakage. These two studies reported differences in out-of-field dose data caused by the orientation of the secondary collimator during measurements. Mutic and Klein (1999) concluded that, at distances larger than 30 cm from the field edge, there was larger dose reduction for a secondary collimator angle of 90° than 180°. Using similar irradiation conditions, Klein et al (2006) provided additional data for smaller field sizes. In their subsequent paper, Mutic et al (2002) studied the influence of universal wedges on out-of-field doses. For all fields and beam energies, the dose outside the treatment field was higher for the wedged field than the open field. Sharma et al (2006a, 2006b) provided similar out-of-field data for radiation fields from machines equipped with MLCs, but also compared segmental and dynamic MLC modes. With segmental MLC, the leaves are stationary while the treatment beam is turned on. With dynamic MLC, the leaves are moving while the beam is turned on. It was determined that an MLC-shaped static field is almost four times larger than that of the uniform dynamic MLC field at a distance of 12 cm from the isocenter. Again, this is due to the increase in collimator scatter and transmission, which becomes less important in locations further away from the isocenter.
Kry et al (2006, 2007b) compared measured out-of-field dose data from conventional fields with calculated data from Monte Carlo simulations. The group developed detailed Monte Carlo models of both 6 MV (Kry et al 2006) and 18 MV (2007b) accelerators equipped with MLCs. Various field settings were studied with the MLC both retracted and matched to the field defined by the secondary collimator. The average local differences between measured and calculated doses for the 6 MV and 18 MV beams were 16% and 17%, respectively. The largest difference occurred at locations far from the treatment field. For the 18 MV beam, neutron equivalent dose was also determined. Differences between measured and simulated equivalent doses for 3.6 cm × 4.0 cm and 9 cm × 9 cm were 8% and 13%, respectively.
Neutron production from high-energy medical accelerators equipped with MLCs was also investigated. Some of these studies focused on occupational radiation safety for the medical personnel instead of patient (Lin et al 2001, Pena et al 2005, Becker et al 2007). However, a number of groups determined out-of-field neutron dose from conventional treatment fields using accelerators equipped with MLCs (Ongaro et al 2000, Followill et al 2003, Zanini et al 2004, Howell et al 2005). Ongaro et al (2000) calculated out-of-field photon dose and neutron equivalent dose data from models of the primary beam components (i.e., target, primary collimator, flattening filter, secondary collimator, MLCs) of a 15 MV Mevatron Siemens accelerator and an SL201-Elekta accelerator. All simulations were done using a fixed 10 cm × 10 cm field. There was no mention of the radiation weighting factors used for neutron equivalent dose calculations. For both accelerators and various locations from the isocenter the neutron equivalent doses ranged between 1 and 4.8 mSv per treatment Gy. The neutron equivalent doses were more than double for the Elektra accelerator than the Siemens accelerator for all locations considered. Followill et al (2003) measured the neutron source strengths from several different accelerators including those equipped with MLCs. For most measurements, the secondary collimators were set to 20 cm × 20 cm, and for IMRT setups the MLCs were set to 4 cm × 4 cm. A total of 30 Gy at the depth of maximum dose were delivered to the isocenter for all beams. Neutron doses were not provided, but their data clearly show that the neutron dose to the patient will depend heavily on the energy of the primary treatment beam.
Zanini et al (2004) calculated neutron doses at various distances from the central axis on the patient plane from 18 MV conventional treatment beams. Like Ongaro et al (2000), the authors only modeled the primary beam components in the accelerator. The neutron equivalent dose ranged from about 4.0 mSv per treatment Gy at 1 cm from the isocenter (jaws set to 10 cm × 10 cm and MLC set to 40 cm × 40 cm) to 1.8 mSv per treatment Gy at 15 cm from the isocenter (jaws set to 40 cm × 40 cm and MLC set to 10 cm × 10 cm). Neutron equivalent doses were also measured by Howell et al (2005). The authors measured neutron doses from radiation fields with a fixed secondary collimator setting of 10 cm × 10 cm and various MLCs field settings. A total of 5000 MUs were delivered for each field. The highest neutron equivalent dose was 1.46 mSv per treatment Gy for a 0 cm × 0 cm field and the lowest dose equivalent was 1.23 mSv per treatment Gy for a 10 cm × 10 cm field.
Measurements are unable to differentiate between neutron dose from neutrons generated in the accelerator and patient. Monte Carlo methods, on the other hand, can track neutrons as well as particles produced from photonuclear interactions inside the patient. Chibani and Ma 2003 used Monte Carlo methods to determine dose distributions from photons, neutrons, protons and alpha particles in a tissue-equivalent phantom. Models of the primary beam components of several accelerators were considered. A modulation scaling factor was included in the dose calculations to account for the increase in MUs used for IMRT treatments. The maximum equivalent dose accounting for neutrons, protons and alphas was 0.66, 1.52 and 2.86 cSv per treatment Gy for an 18 MV Siemens machine, a 15 MV Varian machine and an 18 MV Varian machine, respectively. For all beams neutrons contributed to 75% of these equivalent dose values.
The need to compare dose distributions from conventional and IMRT treatments has been addressed by a few groups (Kry et al 2005a, 2005b, Howell et al 2005, Mazonakis et al 2006, Klein et al 2006, Sharma et al 2006a, 2006b, Reft et al 2006). Kry et al (2005a) made photon and neutron dose measurements from one conventional and six IMRT treatments for prostate cancer. The conventional treatment was delivered with an 18 MV beam. The IMRT treatments were delivered with 6 MV, 10 MV, 15 MV and 18 MV segmental MLCs. All treatments fields were delivered to an anthropomorphic Rando phantom. The prescribed dose to the isocenter was 78 Gy. The authors reported photon dose equivalent, neutron dose equivalent and total dose equivalent to several points in the patient for all treatment plans considered. These values were based on dose equivalents taken at 11 measurement points. The photon dose equivalent decreased with increasing distance from the central axis, but did not vary substantially with depth. The neutron dose equivalent decreased with increasing depth since neutrons are heavily attenuated near the surface of the patient. However, the out-of-field neutron dose equivalent was weakly dependent on distance from the central axis. For beams greater than 15 MV, neutrons were a major contributor to the out-of-field dose equivalent compared to photons. Wang and Xu (2007) made similar dose measurements from conventional and IMRT treatments of the prostate in a Rando phantom. A 6 MV beam using 2850 MUs was used to deliver the IMRT treatment. Two conventional treatments using 6 MV and 18 MV beams were investigated. The 6 MV conventional treatment used 1308 MUs and the 18 MV treatment used 1260 MUs. Organ equivalent doses as a function of distance to the prostate target were shown for these cases.
Reft et al (2006) also investigated photon and neutron doses from 6 and 18 MV IMRT prostate treatments using both in vivo and phantom measurements. A total of 12 treatment plans were considered for the 18 MV method and 6 plans were considered for the 6 MV method. For the 18 MV IMRT treatments, the photon dose equivalents were higher than the neutron dose equivalents at a given location for all cases. The photon dose equivalent was higher for 6 MV IMRT treatments compared to 18 MV IMRT treatments. There was a noticeable variation of the photon and neutron dose measurements taken from different accelerator models. The phantom measurements were done to compare out-of-field dose differences between 18 MV IMRT and 18 MV conventional plans, each having a prescribed dose of 14 Gy. The neutron dose equivalent per treatment Gy from IMRT treatments was found to be higher than conventional treatments for all cases.
Howell et al (2005) determined the neutron dose equivalent at 21 cm from the isocenter for 18 MV conventional and IMRT treatments of the prostate. The prescribed dose for each plan was 45 Gy. The conventional and IMRT plans involved 5346 MUs and 14 400 MUs, respectively. The dose equivalents per treatment Gy for the IMRT and conventional treatment plans were 5.17 and 1.85 mSv Gy−1, respectively. Therefore, the IMRT plan resulted in almost three times the neutron dose equivalent compared to the conventional plan.
Similar to the prostate studies addressed above, Sharma et al (2006a, 2006b) measured out-of-field dose data from 7 6 MV IMRT treatments of head and neck and cervical cancers using dynamic MLCs. The prescribed dose for the cervical and head and neck cancer treatments was 50 Gy and 75 Gy, respectively. Each of the seven treatment plans required a different number of monitor units. All measurements were taken in a tissue-equivalent phantom. The out-of-field dose per treatment Gy appeared to be independent of the treatment site. Petti et al (2006) provided out-of-field dose data from a 6 MV IMRT treatment for a lesion in the brain. A total of 3987 MUs were used to deliver a prescribed dose of 15 Gy. All measurements were taken in the Rando phantom. In this study, the IMRT dose was compared with that from CyberKnife and gamma knife treatments. Another study comparing out-of-field dose to pediatric patients from 6 MV IMRT with dynamic MLCs and conventional treatments for lesions in the brain was performed by Klein et al (2006). All measurements were taken in a pediatric phantom. Five different cases were considered for the IMRT and conventional treatments. The authors concluded that the doses to vital organs from brain treatments were higher for pediatric patients than adult patients.
3.1.3. Tomotherapy
IMRT has been a major focus for recent out-of-field dosimetry studies and secondary cancer risk assessments. However, another modality that has raised concerns about these issues has been tomotherapy. Depending on the complexity of the target volume, the total number of MUs delivered in a single tomotherapy treatment may be an order of magnitude greater than that used for conventional treatments. Some reports have focused on the occupational safety aspect of tomotherapy (Robinson et al 2000, Jeraj et al 2004, Balog et al 2005), while others have focused on patient dose (Mutic and Low 1998, Meeks et al 2002, Ramsey et al 2006). Mutic and Low (1998) measured the out-of-field dose in a water-equivalent slab phantom from tomotherapy treatments using a Peacock/MIMIC (NOMOS, Inc., Sewickley, PA). A typical head and neck treatment was studied using five deliveries, each using an average of 360 MUs. The authors concluded that the out-of-field dose from tomotherapy is higher than the out-of-field dose from conventional radiation therapy, due to the increased number of MUs necessary for tomotherapy delivery. Leakage contributes to a major portion of the out-of-field dose at close and distant locations from the treatment field. Meeks et al (2002) measured the out-of-field dose from a MIMIC collimator attached to a linac, and similar to Mutic and Low (1998) concluded that the out-of-field dose from tomotherapy is higher than that from conventional radiation therapy.
A similar study was done by Ramsey et al (2006). Using a conventional field defined by a tomotherapy unit, the authors measured the out-of-field dose and compared their results with other studies and with the out-of-field dose from a typical conventional treatment. For conventional and tomotherapy treatments, measurements were taken in a scanning water tank and a water-equivalent test phantom, respectively. Based on their measurements, the dose drops to 0.4% of the prescribed dose at 20 cm from the isocenter. In contradiction with conclusions drawn by Mutic and Low (1998) and Meeks et al (2002), the leakage dose measured by Ramsey et al (2006) is less than or equal to that from IMRT. The authors contribute this difference to additional shielding in the particular tomotherapy unit studied.
3.1.4. Stereotactic radiation therapy (SRT)
The SRT procedure dates back to the early 1950s for treating intracranial targets. However, recent advances using conformal beams and image-guidance technology have allowed this technique to be used for other parts of the body such as the lungs. The SRT procedure delivers a very high dose, 10–20 Gy per fraction, in an abbreviated, hypofractionated regimen of five or fewer fractions. In contrast, IMRT is typically delivered in daily fractions of about 2 Gy, in order to reach a total dose of about 70 Gy. Due to a large amount of dose delivered in a single fraction in SRT, secondary dose outside the treatment volume is an important issue.
Studies on out-of-field doses from SRT have typically focused on either gamma knife (Ioffe et al 2002, Petti et al 2006, Hasanzadeh et al 2006) and/or CyberKnife (Petti et al 2006) delivery systems, but Linac-based treatments have also been considered (Maarouf et al 2005). Ioffe et al (2002) measured dose rates as a function of distance from the treatment isocenter from gamma knife treatments using the Rando phantom. The group took measurements for various collimator settings, and at different depths in the phantom. Hasanzadah et al (2006) took similar measurements in a Rando phantom for typical intracranial targets. Out-of-field doses were measured as a function of distance in their study. Petti et al (2006) compared out-of-field doses from IMRT and SRT. Both the gamma knife and CyberKnife delivery techniques were considered. Treatment plans were developed for two targets in the Rando phantom, one in the thorax and another in the brain. For the brain lesion, gamma knife and 6 MV IMRT plans were also developed. It was found that out-of-field doses for Cyberknife were two to five times larger than those measured for comparable gamma knife treatments, and up to a factor of 4 times larger than those measured in the IMRT treatment. For distances larger than 40 cm the CyberKnife dose was directly related to the number of MUs delivered.
A novel treatment technique closely related to SRT is stereotactic body radiation therapy (SBRT), which uses SRT to treat extracranial targets. However, very little out-of-field dose measurements have been performed for SBRT. Stereotactic radiation therapy is also performed with proton beams.
3.1.5. Graphic comparison of selected data
Measured or Monte Carlo calculated out-of-field dose data are often presented as a function of distance from the field edge or central axis relative to the tumor target in the patient. In this section, we summarize results from selected papers to illustrate the basic behavior of the data. Two treatment energies, 6 and 18 MV, are considered separately and the neutron contribution is relevant in the higher energy group. For each energy group, data are presented in two plots representing conventional and intensity-modulated or stereotactic irradiations. Conventional irradiations in this context involve irradiation of water or tissue-equivalent slab phantoms using one gantry angle and fixed secondary collimator and MLC settings. Procedures include IMRT, tomotherapy and stereotactic radiotherapy that are treatment specific involving an anthropomorphic phantom or a modified slab phantom.
Figures 1(a) and (b) summarize out-of-field doses for 6 MV photon beams. For the conventional procedures shown in figure 1(a), one set of out-of-field dose data from an accelerator not equipped with MLCs (Stovall et al 1995) and five other sets from accelerators that were equipped with MLCs are provided (Mutic and Klein 1999, Stern et al 1999, Kry et al 2006, Sharma et al 2006a, 2006b). The study by Kry et al (2006) used Monte Carlo simulations, while the remaining studies were based on measurements. For the MLC data, the MLCs are either matched to the field size defined by the secondary collimator or retracted. Figure 1(a) shows that, while all the data share a very similar trend, machines equipped with MLCs have lower out-of-field doses than accelerators without MLCs. The reduction in the out-of-field dose is due to additional shielding provided by the MLCs.
Figure 1.

Summary of out-of-field doses for 6 MV treatment plans as a function of distance from the central axis for (a) conventional treatments and (b) IMRT and stereotactic treatments. All conventional measurements were taken in a slab phantom from a 10 cm × 10 cm field at a depth of 5 cm. The conventional data by Kry et al (2006) are from Monte Carlo simulations for a 10 cm × 10 cm field at a depth of 3.75 cm. For machines equipped with MLCs, the MLCs were either retracted or matching the field size setting. Data for prostate treatments, head and neck treatments, and brain treatments are compared. Also, for the same treatment site, a comparison is made between a Varian and Siemens machine. All data are presented in absorbed dose per MU.
Figure 1(b) provides out-of-field dose data for 6 MV procedures for IMRT (Kry et al 2005a, 2005b, Wang and Xu 2007, Sharma et al 2006a, 2006b, Petti et al 2006), tomotherapy (Mutic and Low 1998, Meeks et al 2002) and stereotactic radiotherapy (Petti et al 2006). The datasets are arranged by treatment technique and treatment site. Also provided is a comparison of out-of-field doses from the same treatment plan using two different machines by Varian and Siemens (Kry et al 2005a). For IMRT treatments, data from segmental MLC (SMLC) and dynamic MLC (DMLC) methods are included. A comparison between treatments that use SMLC (Kry et al 2005a, Wang and Xu 2007, Petti et al 2006) and a treatment that uses DMLCs (Sharma et al 2006a, 2006b) demonstrates that the DMLC treatment produces more out-of-field dose per MU using different treatment sites. However, the amount of monitor units for a given treatment depends heavily on the treatment site and on the planning system that is being used. The tomotherapy data shows higher out-of-field doses per MU at most locations compared to most IMRT treatments (Mutic and Low 1998, Meeks et al 2002). This could be due to less peripheral shielding in tomotherapy units. In addition, these treatments often use more MUs for delivery compared to IMRT. Data from CyberKnife and gamma knife treatments are also provided (Petti et al 2006). The out-of-field dose per MU from CyberKnife is higher than that from gamma knife, but CyberKnife treatments typically use one-fifth the amount of MUs per treatment (Petti et al 2006). Even so, the dose from CyberKnife appears to be higher than the dose from IMRT and gamma knife.
A comparison of published data on the out-of-field dose from 18 MV beams is provided in figure 2. Once again, data are separated between conventional and intensity-modulated or stereotactic procedures. Also indicated in each of these figures is the type of radiation considered: photons only, neutrons only or both photons and neutrons. All data are provided as dose equivalent because of the potential neutron component. For the conventional fields shown in figure 2(a), the out-of-field photon dose from accelerators equipped with MLCs is lower than accelerators without MLCs at distances greater than 40 cm. At distances less than 40 cm the differences between retracted MLCs is much less, but a reduction is achieved for matched MLCs. The neutron dose equivalent is much less than the photon dose equivalent for distances close to the central axis. However, as the distance from the central axis increases the neutron dose equivalent becomes relatively more important. The differences between three sets of neutron dose equivalent values seen in figure 2(a) are due to the accelerator type and not the presence or configuration of the MLCs. The data from Zanini et al (2004) and Howell et al (2005) are from a Varian Clinac, while the data from Ongaro et al (2000) are from a Siemens Primus.
Figure 2.

18 MV out-of-field dose data as a function of distance from the central axis for (a) conventional and (b) IMRT treatments (including 3D-CRT datasets for comparison). All conventional photon measurements were taken in a slab phantom using a 10 cm × 10 cm field size at a depth of 10 cm. The data of Kry et al (2007a) are from Monte Carlo simulations using a 10 cm × 10 cm field size at a depth of 3.75 cm. The neutron dose equivalents from conventional procedures provided by Zanini et al (2004) and Ongaro et al (2000) are from Monte Carlo simulations. For the conformal treatments both IMRT and 3D-CRT are considered. Data from measurements and simulations that accounted for photons or neutrons or both are provided. The prostate is the treatment site for all studies considered. All data are given in dose equivalent per MU.
Figure 2(b) provides out-of-field dose data from IMRT treatments. For comparative purposes, two datasets on 3D-CRT are also provided. The prostate was the treatment site for studies considered. At distances close to the central axis, the total photon and neutron dose equivalent per MU from 3D-CRT is greater than that from IMRT, as shown by Kry et al (2005b). Considering the fact that IMRT requires more MUs than 3D-CRT, the total out-of-field dose from IMRT would be higher than 3D-CRT. When only photons are included, as in the data by Wang and Xu (2007), the dose curve follows a steeper decrease in locations beyond 30 cm from the central axis probably due to a lack of neutron component in their measurements. When only photon component in the data from Kry et al (2005b) was plotted, a similar slope is seen suggesting that the neutrons are relatively more important in distant locations for both 3D-CRT and IMRT treatments (this agrees with the observation in figure 2(a) for conventional treatments).
3.1.6. Organ-averaged equivalent doses
For the purposes of deriving dose–response functions in epidemiological studies or risk assessment for specific patient, organ-averaged equivalent doses need to be determined. Although some of the publications summarized below have additionally reported the effective dose, the ICRP has advised against the use of effective dose for applications beyond radiation protection because the tissue weighting factors used to derive the effective dose have been averaged over both gender and all age groups (ICRP 2007). See section 4.4 for a discussion on parameters to be used for epidemiological studies.
Vanhavere et al (2004) studied prostate treatments using 6 MV IMRT and 18 MV 3D-CRT procedures. For the 3D-CRT treatments, the field size was set at 10 cm × 10 cm, and a target dose of 2 Gy using 200 MUs was delivered. For IMRT, five fixed gantry angles were considered. The total treatment, 2 Gy in the target, consisted of 475 MUs, evenly distributed over the five angles. The authors estimated organ doses by determining the position of relevant organs in an anthropomorphic Rando phantom relative to the prostate for a standard man. Measurements in the phantom made it clear that photon doses are more localized than that of the neutron dose. Only organs far away from the prostate, such as the thyroid, received a higher neutron dose than photon dose. For the skin, the neutron and photon doses are similar. The IMRT dose for the phantom was higher than that for the 3D-CRT with MU scaling. The IMRT doses from photons and neutrons were calculated to be 26 and 4 mSv, respectively. Howell et al (2006) also considered treatments of the prostate involving both 3D-CRT and IMRT plans. The 3D-CRT plans used four fields and the IMRT plans used five fields. The prescribed dose for all plans was 45 Gy. Beam energies of 6, 15 and 18 MV were considered. The reported doses were higher for 3D-CRT compared to IMRT for all treatment energies, despite the increase in MUs for IMRT delivery. The authors conclude that IMRT greatly reduces dose to nearby organs, such as the gonads and bladder, thereby lowering the effective doses compared to 3D-CRT.
Wang et al (2007) measured dose equivalents in the Rando phantom to estimate organ-averaged equivalent dose. Two 18 MV 3D-CRT and one IMRT treatment to the prostate were considered. The organs closest to the target volume had the highest equivalent doses. The effective doses were also calculated using dosimeter locations for various critical organs. Barquero et al (2005) calculated organ dose equivalents from neutrons in a stylized computational phantom using Monte Carlo simulations. A simplified geometry was assumed for the accelerator head. The angular dependence of the neutron doses on a patient receiving pelvic irradiation was determined for anterior–posterior (AP), posterior–anterior (PA), right lateral (RL) and left lateral (LL) gantry angles. All major organs were considered in this study. The maximum organ equivalent dose per treatment dose was 719 μSv Gy−1 to the rectum. Difillippo et al (2003) used a similar stylized computational phantom to calculate the organ dose produced by photonuclear processes that occur in a patient during radiation treatments. Doses from neutrons, protons, deuterons, tritons and He-3 were calculated for a simplified geometry of the treatment beam. The authors conclude that Monte Carlo methods provide the ability to calculate dose from photonuclear contamination in the patient, which is often unaccounted for in conventional treatment planning.
To provide a different way to quantify the dose to healthy tissues close to the tumor volume over a large volume from the IMRT procedure, a quantity called ‘integral dose’, was proposed to be equal to the mean absorbed dose multiplied by the mass of irradiated tissue (Pirzkall et al 2002, D’Souza and Rosen 2003). Unlike the studies above, the integral dose does not average the absorbed dose throughout an organ. Pirzkall et al (2002) compared IMRT plans with different energies (6, 10 and 18 MV photons) and found that the non-tumor integral dose varied less than 5% between plans. A study by D’Souza and Rosen (2003) concluded that, with four or more beams and the clinical margin values, the variation in the non-tumor integral dose was less than 1% as a function of beams. With eight or more beams the variation was less than 0.5%. Findings by Aoyama et al (2006) were consistent with those of D’Souza and Rosen (2003) and Pirzkall et al (2002). Therefore, based on the above arguments, the increase number of fields should have a negligible effect on the risk of developing a second cancer near the primary beam. However, these studies only considered a portion of the body that is covered in a CT scan, thus organs or tissues located at a larger distance from the treatment volume are ignored.
Organ-averaged equivalent doses, as determined from these studies above, are necessary for deriving risks associated with each of the organs. The information on the effective dose should not be used for risk assessment for radiation.
3.2. Proton therapy
Proton beams provide the possibility of highly conformal dose distributions with the potential of dose escalation. In addition, the integral dose delivered with protons is significantly lower than with photon beams, which would imply a lower risk for radiation-induced cancers when using protons (Miralbell et al 2002). However, some have argued that the risk associated with undesired neutron production was not well understood and that neutrons can potentially negate this advantage (Hall 2006, Paganetti et al 2006). Unlike x-ray therapy, the dose outside the main radiation field in proton therapy is entirely due to neutrons generated in nuclear interactions. Neutron sources originate either from the treatment head or in the patient, the latter being obviously unavoidable. In the majority of proton therapy facilities patients are treated with the passive scattering technique in which patient-specific apertures and compensators are irradiated by a broad beam of protons. Most facilities are planning on upgrading toward beam scanning technique that involves magnetically scanned pencil beams over the target volume (Paganetti and Bortfeld 2005).
This section covers several dosimetry studies in terms of the proton passive scattering and beam scanning techniques as summarized in table 4.
Table 4.
Dosimetry studies on passive scattering and beam scanning proton therapy.
| Author | Dosimetry method | Beam delivery type |
|---|---|---|
| Binns and Hough (1997) | Measurement | Passive scattering |
| Yan et al (2002) | Measurement | Passive scattering |
| Roy and Sandison (2004) | Measurement | Passive scattering |
| Mesoloras et al (2006) | Measurement | Passive scattering |
| Tayama et al (2006) | Measurement | Passive scattering |
| Wroe et al (2007) | Measurement | Passive scattering |
| Schneider et al (2002) | Measurement | Beam scanning |
| Zheng et al (2007) | Monte Carlo (MCNPX) | Passive scattering |
| Polf and Newhauser (2005) | Monte Carlo (MCNPX) | Passive scattering |
| Agosteo et al (1998) | Monte Carlo (MCNPX) | Passive scattering Beam scanning |
| Jiang et al (2005) | Monte Carlo (Geant4) | Passive scattering |
| Zacharatou-Jarlskog et al (2008) | Monte Carlo (Geant4) | Passive scattering |
3.2.1. Passive scattering technique
The neutron yield and the dose deposited via secondary neutrons depend on many geometrical and physical parameters. For neutrons generated in the treatment head, the materials and specific arrangements of the beam shaping devices are important. Therefore, the neutron dose is dependent on the facility and on the settings for each patient field. Neutrons can potentially be generated in scattering devices, modulators that are used to reduce the beam energy (and to produce spread-out Bragg peaks) as well as in the patient-specific aperture or compensator. Because of its proximity to the patient, the field aperture often dominates as the source of secondary neutrons. Passive scattering proton machines typically only allow the use of a limited set of different field sizes. Thus, a considerable portion of the beam may be stopped in the aperture, which causes the neutron dose to be dependent on the ratio of the field size and aperture opening (Gottschalk 2006, Paganetti et al 2006). Thus, the neutron yield typically decreases with increasing field size (Zacharatou-Jarlskog et al 2008). The treatment head is the dominant neutron source compared to the patient contribution (Jiang et al 2005, Zacharatou-Jarlskog et al 2008). The neutron yield in the patient increases with beam range (i.e. the beam energy) and treatment volume (Zacharatou-Jarlskog et al 2008). Thus, unlike the treatment head contribution, the neutron yield in the patient increases with the field size.
Secondary neutron dose in a 200 MeV proton beam was measured by Binns and Hough (1997). The experiment investigated the shielding requirements for a proton therapy facility. Other measurements were performed by Yan et al (2002) at the Harvard Cyclotron Laboratory. A 160 MeV proton beam with a passive scattering beam delivery system was used to irradiate a small field (small aperture opening) causing the beam to be almost entirely stopped in the aperture. The setup resulted in neutron equivalent doses of 1–15 mSv Gy−1 (mSv Gy−1 denotes equivalent dose per treatment dose). Tayama et al (2006) measured neutron equivalent doses in a 200 MeV proton beam and detected up to 2 mSv Gy−1. While these experiments were done using a water phantom, Roy and Sandison (2004) irradiated an anthropomorphic phantom with a 198 MeV proton beam and found that the scattered neutron equivalent dose varied between 0.1 and 0.26 mSv Gy−1. A comprehensive experimental study using anthropomorphic phantoms was done by Mesoloras et al (2006). In this work, the influence of various treatment head parameters on the neutron dose was investigated. It was confirmed that the neutron equivalent dose decreased with increasing aperture size. The brass collimator contributed significantly to the neutron equivalent doses which were found to vary from 0.03 to 0.87 mSv Gy−1. Using microdosimetric detectors, Wroe et al (2007) found the neutron equivalent dose to be 3.9 and 0.18 mSv Gy−1 for locations 2.5 cm and 60 cm from the field edge, respectively.
Monte Carlo simulations have also been used in several studies. Polf and Newhauser (2005) found in their MCNPX calculations that the neutron dose decreased from 6.3 to 0.63 mSv Gy−1 when the distance from the field center increased from 50 to 150 cm. In a subsequent study this group has reported equivalent doses up to 20 mSv Gy−1 (Zheng et al 2007). The dose increased as the modulation range was increased. Monte Carlo simulations were also performed by Agosteo et al (1998) to analyze the neutron dose for a passive beam delivery system with a beam energy of 65 MeV. The absorbed dose due to neutrons varied between 3.7 × 10⁻⁷ and 1.1 × 10⁻⁴ Gy per treatment Gy depending on the distance to the field. For a high-energy proton beam, the secondary dose due to the total scattered photons and neutrons varied from 0.146 to 7.1×10⁻² mGy per treatment Gy considering depths ranging from 1 to 8 cm and distances to the field edge ranging from 9 to 15 cm. Figure 3 summarizes selected results on neutron doses as a function of lateral distance to the field edge for various proton beam facilities and beam parameters. These data share a very similar trend although the values contain significant variations associated with different beam and field parameters.
Figure 3.

Neutron dose equivalent as a function of distance to the field edge reported by three different proton experiments (Yan et al 2002, Wroe et al 2007, Mesoloras et al 2006) and three sets of Monte Carlo simulations using passive scattering techniques (Zacharatou-Jarlskog et al 2008, Polf and Newhauser 2005, Zheng et al 2007). Also included are data from proton beam scanning (Schneider et al 2002). Because of the significant dependency of neutron doses on beam parameters in proton therapy, two curves are shown from each publication to represent the best-and worst-case scenarios.
While data as shown in figure 3 help to understand differences among different beam delivery conditions, epidemiological studies require the use of organ-specific doses needed for proper risk analysis. To this end, a number of recently studies have used whole-body patient phantoms and Monte Carlo simulations to calculate organ doses for different proton treatment conditions. Jiang et al (2005) used the Geant4 code to simulate an adult male model, VIP-Man, using two proton therapy treatment plans for lung and paranasal sinus cancers. The authors concluded that the neutrons produced in the proton treatment nozzle were the major contributor to organ equivalent doses. They also analyzed equivalent dose to the red bone marrow. In a later study, Zacharatou-Jarlskog et al (2008) used the Geant4 code to assess and compare organ doses for pediatric and adult patients. The pediatric phantoms were developed by Lee et al (2006). The authors concluded that pediatric patients would receive higher organ equivalent doses than adults. For typical pediatric head and neck tumor cases, the neutron equivalent dose was as high as 10 mSv Gy−1 in organs located near the target but decreased rapidly with distance (Zacharatou-Jarlskog et al 2008). The authors analyzed the dependence of neutron equivalent dose on field parameters, organ location and patient age. It was found that there was a significant increase in organ doses in younger patients who have smaller body sizes. They also reported that the contribution of neutrons from the treatment head is typically between 65% and 99% depending on the aperture opening, i.e. the field size.
3.2.2. Beam scanning including intensity-modulated proton therapy
Ideally, the scanning method does not require scattering devices in the treatment head or patient apertures and compensators. As a result, overall secondary neutron production in the treatment head is reduced and the majority of the secondary neutrons are now generated in the patient’s body. For these reasons, the proton beam scanning technique yields the lowest scattered dose when compared with various x-ray therapy and proton therapy techniques (Schneider et al 2002).
For the proton beam scanning system at Paul Scherrer Institute in Switzerland, Schneider et al (2002) measured the neutron dose to be between 2 and 5 mSv Gy−1 for target volumes of 211 (sacral chordoma) and 1253 cm3 (rhabdoyosarcoma), respectively, and 0.002–8 mSv Gy−1 for lateral distances of 100–7 cm from the treatment beam axis. These values are significantly lower than those reported for most passive scattered systems. Miralbell et al (2002) assessed the potential influence of improved dose distribution on the incidence of treatment-induced second cancers in pediatric oncology in a comparison study of proton and photon treatment modalities. Two children, one with a parameningeal rhabdomyosarcoma (RMS) and a second with a medulloblastoma, were considered for these two types of radiation. They showed that proton beams had the potential to reduce the incidence of radiation-induced second cancers for the RMS patient by a factor of 2 and for the medulloblastoma case by a factor of 8–15 when compared with either IMRT or conventional x-rays. Because these data are for scanned proton beams, they do not have any secondary neutron component and the improvement is simply due to a smaller irradiated high-dose volume and due to the fact that no beam shaping devices were needed.
3.3. Other treatment techniques
3.3.1. Neutron and electron therapy (including total body irradiation)
Although boron–neutron capture therapy (BNCT) (Barth et al 1990), electron beam therapy (Hogstrom and Almond 2006) and electron total body irradiation (TBI) (AAPM 1986) have been utilized in radiation treatment, there is practically no literature available on second cancers from these modalities.
3.3.2. Carbon-ion therapy
Although the cross sections for nuclear interactions are much higher for therapeutic carbon-ion beams compared to proton beams, the neutron production is expected to be similar (albeit with a different neutron energy distribution). Due to the higher LET of carbon ions, less particles are needed to deliver the same dose compared to protons. The depth–dose profiles of heavy-ion beams show a fragment tail beyond the Bragg peak (Matsufuji et al 2005, Schimmerling et al 1989). Neutron production by fragmentation of light ions in water and graphite was investigated by Cecil et al (1980) and Kurosawa et al (1999), respectively. The neutron contamination in therapeutic 12C beams has been studied experimentally (Gunzert-Marx et al 2004, Schardt et al 2006). The emission of secondary fragments from 200 MeV/u carbon ions and energy spectra, angular distributions and yields of fast neutrons and charged particles were measured. From the resulting yield of 0.54 neutrons (En >10 MeV) per primary ion, a neutron dose of 5.4 mSv per cobalt gray equivalent delivered to the target was estimated.
Schardt et al (2006) performed a comparison between neutron doses in proton and carbon-ion therapy involving beam scanning techniques. The secondary neutron doses per treatment dose were found to be similar because of the much lower number of 12C ions needed to deliver the same biologically effective dose than with protons. The energy spectra and angular distributions of secondary neutrons emerging from the water target were also studied. It was found that the neutrons were mainly emitted in the forward direction. The reported neutron dose of 8 mGy per treatment Gy was less than 1% of the treatment dose. This is in good agreement with those reported by Pshenichnov et al (2005).
4. Risk of developing second cancers due to scattered radiation
The data reviewed in the previous section give an overview of the scattered doses that have been either measured or calculated for various treatment modalities and treatment conditions. While such information is helpful to medical physicists in comparing patient safety of different modalities and in treatment planning, many epidemiologists and clinicians are interested in probabilities for such patients to develop second cancers. Epidemiological studies observe a cohort of patients and eventually report findings in terms of dose–response functions. Dosimetry data are one of the many factors that could help to establish a reasonable assessment of risk.
4.1. Second cancers in radiation therapy
Treatment-related cancers are a well-recognized side effect of radiotherapy (van Leeuwen et al 2005, de Vathaire et al 1989). The likelihood of developing second cancer depends on both the entire irradiated volume and on the volume of the high-dose region. With respect to radiation-induced sarcoma, the main concern is not primarily the dose far away from the beam edge, but the dose delivered directly in the beam path. However, carcinomas appear to arise in lower dose areas, although even these are more likely to appear in the high-dose region (Brenner et al 2000). The cumulative risk for the development of second cancers has been estimated as ranging from 5% to 12% over a 25 year follow-up interval (de Vathaire et al 1989, Hawkins et al 1987, Olsen et al 1993, Tucker et al 1984) with radiation therapy as a predisposing factor (Tucker et al 1987, de Vathaire et al 1989, Potish et al 1985, Strong et al 1979). Cancer incidence and mortality data for various sites in the human body have been summarized in the BEIR VII report (BEIR 2006). For example, it is recognized that radiation is associated with the development of intracranial tumors after therapeutic cranial irradiation for leukemia (Neglia et al 1991), tinea capitis (Ron et al 1988, Sadetzki et al 2002) and intracranial tumors (Kaschten et al 1995, Liwnicz et al 1985, Simmons and Laws 1998). Kuttesch et al (1996) found that the median latency to the diagnosis of the second cancer was 7.6 years. Brenner et al (2000) examined second cancer from prostate radiotherapy and found that the absolute risk was 1.4% for patients surviving longer than 10 years. Brada et al (1992) and Minniti et al (2005) studied patients with pituitary adenoma and reported a cumulative risk of second brain tumors of 1.9–2.4% at ~20 years after radiotherapy and a latency period for tumor occurrence of 6–21 years. The relative risk of developing a second cancer is less in patients with smaller treatment volumes (Kaido et al 2005, Loeffler et al 2003, Shamisa et al 2001, Shin et al 2002, Yu et al 2000).
For childhood cancers, the relative 5 years survival rate has risen from 56% for children diagnosed within 1974–1976 to 79% for those diagnosed in the period 1995–2001 (Jemal et al 2006) (the current 10 years survival rate is ~75% (Ries et al 2006)). Although the majority of children with cancer can expect a long life post-treatment, a second cancer will occur in some pediatric cancer patients following successful treatment of the original disease (Ron 2006). Most published data are based on the Childhood Cancer Survivor Study, an ongoing multi-institutional retrospective study of over 14,000 cases (Sigurdson et al 2005, Bassal et al 2006, Kenney et al 2004, Neglia et al 2001). Excess risks of subsequent malignancies of thyroid, breast, bone, soft tissue and central nervous system following radiation treatment for childhood cancer have been reported (Neglia et al 2001, Bhatia and Landier 2005). Subsequent malignant neoplasm (SMN) (Bhatia et al 1996, Delaat and Lampkin 1992, Hawkins et al 1996, 1992, Heyn et al 1992, Kimball Dalton et al 1998, Meadows et al 1985, Robinson et al 2002) were found to be one of the most common causes of death in survivors of childhood cancer (Mertens et al 2001, Robertson et al 1994). Garwicz et al (2000) found that the relative risk (to non-exposed) of developing SMN in the irradiated volume was 4.3. The risk was highest in children diagnosed before the age of 5 years. Neglia et al (2001) concluded that the largest observed excess SMNs were bone and breast cancers with an estimated incidence of 3.2% after 20 years. Besides bone cancers and soft-tissue sarcomas (Tucker et al 1987, Newton et al 1991, Meadows et al 1985, Breslow et al 1995), carcinomas of the parotid gland, lung, gastrointestinal tract, bladder and kidney, and female and male genitourinary tract have been reported (Bhatia et al 1996, 2002, 2003, Kimball Dalton et al 1998, Kenney et al 2004, Neglia et al 2001, Perkins et al 2005, Metayer et al 2000, Swerdlow et al 2000, Altinok et al 2005, Aung et al 2002, de Vathaire et al 1999, Green et al 1994, 1996, 2000, Jenkinson et al 2004, Leung et al 2001, Rosso et al 1994). SMNs of the breast, thyroid and skin have been seen (Kenney et al 2004, Neglia et al 2001, Perkins et al 2005). Guerin et al (2003) showed that the risk of developing melanoma after a childhood cancer is 9.1 times the one for the general population. Similar effects were found for thyroid cancer (Tucker et al 1991) and second sarcomas after Ewing’s sarcoma (Kuttesch et al 1996). Little et al (1998) studied the risk of brain tumor induction following treatment for cancer in childhood.
While the increased risk for developing acute non-lymphocytic leukemia and for developing non-Hodgkin’s lymphoma levels off after 10 years, the risk for solid tumors seems to continue to increase even beyond 20 years following treatment (Foss Abrahamsen et al 2002). Neglia et al (2006) reported on childhood cancer survivors who developed radiation-induced CNS tumors. Second gliomas rarely occurred more than 15 years after therapeutic radiation, whereas second meningiomas appeared after 15 years with the excess risk increasing with time. Bassal et al (2006) found that carcinomas after childhood cancer were diagnosed on average 15 years after treatment. Survivors of neuroblastoma had a 329-fold increased risk of renal cell carcinomas; survivors of Hodgkin’s lymphoma had a 4.5-fold increased risk of gastrointestinal carcinomas. Elevated risk of head and neck carcinoma occurred in survivors of sarcoma, neuroblastoma and leukemia. In children, who were treated with whole-brain irradiation as part of their leukemia therapy, the median time for astrocytoma formation was 9 years as compared to 16.6 years for meningioma (Kimball Dalton et al 1998).
Ronckers et al (2006) analyzed thyroid cancer cases in childhood cancer survivors. Thyroid cancer is the second most frequent second cancer. A trend for decreasing risk with increasing age at irradiation has been reported (Shore 1992). This is due to a greater radiation effect in humans during the period of rapid cell proliferation, i.e. during the development of the thyroid gland (Ron et al 1995). It is the only tissue with clear evidence for risk even at ~0.1 Gy (Shore 1992). Lundell and Holm (1995) reported on solid tumors after irradiation in infancy for skin hemangioma. Thyroid cancer incidence was significantly increased.
In most studies, solid cancers are found within or close to the primary cancer irradiation field (Foss Abrahamsen et al 2002). However, even doses delivered far outside the main field have been associated with second tumors. Decades ago, children in Israel were irradiated to the scalp to induce alopecia for the purpose of aiding the topical treatment of tinea capitis (Ron et al 1988). Mean doses to the neural tissue were ~1.5 Gy. The relative risk of tumor formation at 30 years compared with the general population was 18.8 for schwannomas, 9.5 for meningiomas and 2.6 for gliomas with a mean interval for tumor occurrence of 15, 21 and 14 years, respectively. Sadetzki et al (2002) reports on the development of meningiomas after radiation for tinea capitis with a time from exposure to meningioma diagnosis of 36 years. A recent study has concluded that even 40 years after initial radiation treatment of cervical cancer survivors remain at an increased risk of second cancers (Chaturvedi et al 2007).
4.2. Dose–response relationships in second cancer from radiation therapy
Most of the dosimetry data summarized in section 3 do not allow a direct estimation of the dose deposited in various organs under realistic treatment conditions. This makes interpretation and development of dose–response relationships based on clinical data extremely difficult. Monte Carlo simulations of organ equivalent doses for realistic patient geometries are certainly helpful but are done only within the last few years and require long-term follow-up before adding valuable information. To establish a more precise dose–response relationship for second cancers as a function of modality, treatment site, beam characteristics and patient population, progressively larger epidemiological studies are required to quantify the risk to a useful degree of precision in the low-dose regions (Brenner et al 2003). In order to facilitate the evaluation of dose–response relationships as defined in epidemiological models, organ-specific dosimetry is needed. In fact, one of the reasons for considerable uncertainties in the current risk models is that actual second cancer incidences from radiation therapy patients are difficult to interpret due to the lack of accurate organ-specific dosimetric information.
With limited organ-specific dosimetry data, many clinical studies established a dose response (relative risk) relationship. The following summarizes some of the studies of second cancer incidences and mortalities at different anatomical sites after radiation therapy. There are certainly many other studies (see for example, BEIR (2006)). However, our selection highlights the significant uncertainties and variations in the studies of dose–response relationships for second cancer.
A considerable ERR for stomach cancer of 1.08 Gy−1 (0.69 Gy−1 after 10 years, 0.54 Gy−1 after 5 years; based on doses >1 Gy and 348 second stomach cancer cases) was found in radiotherapy patients treated for cervical cancer (Boice et al 1988). Analyzing a cohort of 1216 women who were treated with radiation for breast diseases, the ERR for stomach cancer was determined as to be 1.3 Gy−1 with a linear dose–response relationship by Mattsson et al (1997). Carr et al (2002) also investigated the ERR for stomach cancer and came up with 0.2 Gy−1 after treatment for peptic ulcer for doses below 10 Gy. They analyzed 3719 patients who had received a mean stomach dose of 14.8 Gy. A much lower ERR was reported by Weiss et al (1994). They found an ERR of just 0.004 Gy−1 after more than 25 years after treatment for ankylosing spondylitis.
Similar studies exist for breast cancer. Here, the ERR/Gy was estimated to be 2.48 after thymus irradiation in infancy (Hildreth et al 1989). Others have reported much smaller values. For example, Travis et al (2003) reported an ERR for breast cancer of 0.15 Gy−1 for women who had been treated for Hodgkin’s disease (chest radiotherapy only). Their study was based on 105 breast cancer incidences matched to 266 incidences without Hodgkin’s disease. Lundell and Holm (1996) and Lundell et al (1999) published two studies on breast cancer risk after radiation treatment for skin hemangioma. They reported an ERR of 0.38 Gy−1 based on 9675 women irradiated in infancy resulting in 75 breast cancer incidences. The mean absorbed dose to the breast was 0.39 Gy (1.5 Gy in the breast cancer cases). In the second study, they analyzed a cohort of 17 202 women and found an ERR for breast cancer of 0.35 Gy−1 (245 breast cancer incidences were reported). Most patients were treated with radium-226 applicators with a mean absorbed dose to the breasts of 0.29 Gy (range up to 35.8 Gy).
Lung cancers have been seen as a result of radiation therapy as well. Radiation-induced lung cancer was evaluated in a study of Hodgkin’s disease by Gilbert et al (2003). The ERR was found to be 0.15 Gy−1 (0.18 for men and 0.044 for women). The study was based on 227 patients with lung cancer. One has to keep in mind that Hodgkin’s disease is treated with high doses and that these patients are typically immunodeficient. Thus, the relevance of this study for assessing low dose radiation effects may be limited. Analysis of lung cancers after treatment for breast cancer leads to an estimate for ERR of 0.2 Gy−1 in a study by Inskip et al (1994). The authors analyzed 76 cases for second lung cancer out of a large cohort of patients being treated for breast cancer. In women treated for benign breast disease lung cancers have been reported leading to an estimate in ERR of 0.38 Gy−1 (Mattsson et al 1997). The lungs received a scattered dose of, on average, 0.75 Gy. A considerably higher ERR of 1.4 Gy−1 was found in analyzing lung cancer after treatment of skin hemangioma (Lundell and Holm 1995). Carr et al (2002) found an ERR for lung cancer in patients treated for peptic ulcer of 0.43 Gy−1 in the low-dose region.
A very radiation sensitive organ is the thyroid. Consequently, the thyroid cancer incidence after radiation therapy has been analyzed by several groups. Ron et al (1989) looked at 98 thyroid tumors in subjects that had been treated for tinea captis. The ERR was 30.0 Gy−1. Thyroid cancers have been analyzed in patients who had been treated for skin hemangioma in infancy. An ERR for thyroid cancer of 4.92 Gy−1 was estimated by Lundell et al (1994). A cohort of 14 351 infants treated for skin hemangioma was analyzed. The mean dose to the thyroid was 0.26 Gy and 17 thyroid cancers were registered with a mean thyroid dose of 1.07 Gy. Similarly, Lindberg et al 1995 analyzed thyroid cancer after skin hemangioma treatment resulting in an ERR of 7.5 Gy−1. Cancer mortality data were analyzed for 3719 subjects treated for peptic ulcer by Carr et al (2002). For doses below 10 Gy, the ERR for pancreas was reported to be 0.34 Gy−1.
Many studies looked at leukemia as a consequence of radiation therapy. The ERR (mortality) for leukemia following radiotherapy for uterine bleeding was given as 0.19 Gy−1 by Inskip et al (1990). The average dose to the bone marrow in these treatments was estimated as to be 53 cGy (4483 patients were analyzed). The same group estimated the ERR for leukemia to be 0.29 Gy−1 based on treatments with radium and x-rays for pelvic benign disease (Inskip et al 1993). An extensive study based on a cohort of 150 000 women with cancer of the uterine cervix was done by Boice et al (1987) to assess the leukemia risk after radiation therapy for these patients. ERR for leukemia was given as 0.88 Gy−1 for low doses (where cell killing is negligible). Lundell and Holm (1996) analyzed data of mortality due to leukemia in a group of subjects treated in infancy for skin hemangioma. The ERR for leukemia was found to be 1.6 Gy−1. Extensive analysis of the bone marrow exposure was performed for 14 624 subjects.
The risk for developing second intracranial tumors was analyzed by Karlsson et al (1997). After treatment for skin hemangioma in infancy the ERR for intracranial tumors was reported as 1.05 Gy−1. The result was based on 11 805 infants treated with radioactive source Ra-226 (mean dose to the brain was 7.2 cGy) and the appearance of 47 intracranial tumors. A subsequent study for the same treatment looked at 28 008 infants and found an ERR for intracranial tumors of 2.7 Gy−1 (Karlsson et al 1998). The ERR for malignant brain tumors was given as 1.98 Gy−1 for subjects treated for tinea captis based on 40 years follow-up (Ron et al 1988).
Studies on leukemia suggest that the carcinogenic effect of radiation decreases at high doses because cell killing starts to dominate mutation (Upton 2001). Often the highest incidence of radiation-associated second tumors occurs at field peripheries and not at the field center (Epstein et al 1997). Patients treated with radiation for cervical cancer showed an increased risk of developing leukemia with doses up to ~4 Gy, which decreased at higher doses (Blettner and Boice 1991, Boice et al 1987). Sigurdson et al 2005 analyzed second thyroid cancer after childhood cancer and found that the risk increased with doses up to ~29 Gy and then decreased. There is other evidence that the risk of solid tumors might level off at 4–8 Gy (Curtis et al 1997, Tucker et al 1987). The exact shape of the dose–response curve and its site dependence is not known. The true dose–response curve is thought to have some inward curvature and presumably levels off at higher doses (BEIR 2006).
For pediatric patients, Ron et al (1995) showed that a linear dose–response relationship best described the radiation response down to 0.1 Gy. Although it was found that the relative risks of cancer from treatment were generally less than those in comparable subsets of the bomb survivor data, a linearity of the dose–response curve was concluded for both series (Little 2000, 2001).
4.3. Modeling the risk for radiation-induced cancer
Models on radiation-induced cancer focus mainly on low-dose risks where the linear dose–response curve can be assumed. The BEIR report (2006) suggests that the relationship between radiation dose and induced solid cancer is a straight line even at low doses with different endpoints having different slopes. Leukemia was modeled as a linear-quadratic function of dose. Various low-dose-response relationships have been discussed elsewhere (Hall 2006, Brenner et al 2003). Based on Hall 2004, figure 4 illustrates the cancer risk for various dose levels of interest to radiation treatment discussed earlier in table 1.
Figure 4.

Qualitative dose–response relationship for radiation-induced second cancer in patients using similar illustration of Hall (2004). The solid line is based on atomic-bomb data for doses from ~0.05 to 2.5 Sv. Uncertainties existing above and below this region are discussed in the text. Refer to table 1 for the choice of dose levels in radiation treatment.
The observation that a single particle can cause mutations in a single-cell irradiation process supports the assumption of a linear dose–response relationship (Barcellos-Hoff 2001). For doses from 0.1 to 4 Gy, most data are consistent with this assumption (Frankenberg et al 2002, Han and Elkind 1979, Heyes and Mill 2004, NCRP 2001). However, at doses less than 0.1 Gy a small decrease in transformation has been reported (Ko et al 2004) while some data suggest a nonlinear dose–response curve (Sasaki and Fukuda 1999). Some data even suggest a protective effect (Calabrese and Baldwin 2000, 2003, Feinendegen 2005, Hall 2004, Upton 2001). Results of whole-body irradiation (WBI) of primates with a follow-up of 24 years show no increase in cancer for 0.25–2.8 Gy (Wood 1991).
Our knowledge (and the basis of epidemiological response models) of radiation-induced tumors is largely based on the atomic-bomb survivor data (Pierce et al 1996, Preston et al 2004). Most currently used risk models are based on these data and several risk models have been proposed and used to estimate the risk of second cancers from radiation treatment. Both the BEIR VII Committee (2006) and the ICRP (1991) recommend, for doses below 0.1 Gy, a ‘linear no-threshold’ (LNT) model. The relative risk of irradiated versus non-irradiated population for fatal solid cancer for persons 30 years of age at 1 Sv whole-body irradiation was estimated to be 1.42 (Preston et al 2004). Pierce et al (1996) estimated lifetime excess risks of radiation-associated solid cancer death rates and lifetime excess risks for leukemia as a function of age, gender and dose. The risk was higher for those exposed at younger ages (Imaizumi et al 2006). High rates of late (50 years after exposure) second cancers are pertinent to risk estimates based on patient follow-up data extending to only 10–20 years. Thus, estimates of radiation-induced cancer risk in radiation-treated patients must be considered to be less than the actual lifetime risk.
Data on solid tumor mortality among the atomic-bomb survivors are consistent with linearity up to ~2.5 Sv with a risk of ~10% Sv−1 (Pierce et al 1996, Preston et al 2003). However, some analysis show a linear dose response for cancer incidence between 0.005 and 0.1 Sv (Pierce and Preston 2000), some indicate a deviation from linearity (Preston et al 2004) and some find no increased cancer rate at doses less than 0.2 Sv (Heidenreich et al 1997). There is even some evidence for a decreasing slope for cancer mortality and incidence. This may be caused by the existence of small subpopulations of individuals showing hypersensitivity (ICRP 1999). There might also be reduced radioresistance in which a small dose decreases the radiosensitivity as has been reported for carcinogenesis (Bhattacharjee and Ito 2001), cellular inactivation (Joiner et al 2001), mutation induction (Ueno et al 1996), chromosome aberration formation (Wolff 1998) and in vitro oncogenic transformation (Azzam et al 1994). Further, linearity would not necessarily hold if multiple radiation-damaged cells influenced each other (Ballarini et al 2002, Nagasawa and Little 1999, Little 2000, Ullrich and Davis 1999). An increasing slope seems to fit dose–effect relations for radiation-induced leukemia (Preston et al 2003), while a threshold in dose seems to be present for radiation-induced sarcoma (White et al 1993). Also, animal data have not shown significant cancer excess for doses below 100 mSv (Tubiana 2005). The lack of evidence of a carcinogenic effect for low doses could be because the carcinogenic effect is too small to be detected by statistical analysis or because there is a threshold.
By developing models based on the atomic-bomb data, differences in the radiation exposure from compared to radiation treatments need to be considered. Even though most bomb survivors were exposed to low doses (<0.1 Gy), some were exposed to doses exceeding 0.5 Gy, thus influencing the risk estimation. The risk is also dose-rate dependent. Grahn et al (1972) observed reduction in leukemia incidence by a factor of ~5 by reduction of dose to 0.2–0.3 Gy per day. Ullrich et al (1987, 1980) reported on dose-rate dependences for the incidence of lung adenocarcinoma in mice. Maisin et al (1991) found that ten fractions of 0.6 Gy yielded more cancers than a dose of 6 Gy in mice following WBI. Brenner and Hall (1992) discussed this inverse effect of dose protraction for cancer induction. Dose-rate effects are well understood for therapeutic dose levels with low-LET radiation (Paganetti 2005). Most risk models account for dose-rate effects by introducing scaling factors. However, the effect of dose protraction may be different in the low-dose regions in particular for neutron irradiation. While a positive ‘dose and dose-rate effect factor’ (DDREF) is established for scattered photon doses, there is evidence for DDREF = 0 or even a reverse dose-rate effect for low doses of neutron radiation. This effect is a well-known phenomenon for high-LET radiation (Kocher et al 2005).
4.4. Deriving risk from dosimetry data using predetermined dose-risk conversion coefficients
In many situations, risk estimates are performed using whole-body effective doses and organ weighting factors (NCRP 1993a, 1993b, ICRP 1991, 2007, EPA 1994). The NCRP defines probabilities of fatal cancer for bladder, bone marrow, bone surface, breast, esophagus, colon, liver, lung, ovary, skin, stomach, thyroid and remainder of the body (NCRP 116). The ICRP defines a whole-body effective dose with organ-specific weighting factors (ICRP 2007). Tissue weighting factors employed by the NCRP and ICRP for the effective dose are gender- and age-averaged values. The methodology is originally designed for setting radiation protection limits by making sure that the radiation exposures to workers are controlled to a level that is considered to be safe (ICRP 1991, 2007). The conversion from a specific value of the effective dose to a risk of cancer is only valid for the average population of workers who are exposed to relatively low level of radiation. As such, the ICRP has advised against the use of the effective dose for the risk of a single patient and of a site-specific tumor. Nevertheless, the summary of studies that estimated cancer risk given below also includes studies that are based on the effective dose (or ‘whole-body dose equivalent’).
The whole-body dose equivalent was used to estimate the risk by a few groups (Followill et al 1997, Verellen and Vanhavere 1999, Kry et al 2005b). In this approach, the whole-body dose equivalent is determined for a point in the patient, usually 40–50 cm from the edge of the treatment field. This value is then multiplied by a whole-body risk coefficient—usually 5% per Sv. Followill et al (1997) measured whole-body dose equivalent for neutrons and photons at a point 50 cm away from the isocenter. The radiation weighting factor of 20 for neutrons was used. As the beam energy increased, the neutron contribution increased dramatically. For each treatment modality, the whole-body dose equivalent for 25 MV beams was found to be eight times greater than that for the 6 MV beams. For a given energy, the whole-body dose equivalent was the highest for serial tomotherapy and lowest for 3D-CRT procedures. The risk of any fatal second cancer associated with the scattered dose from the 6 MV unwedged conventional technique was estimated by the authors to be 0.4%. Risk for the 25 MV tomotherapy technique was estimated to be 24.4%. The increased risks depended on the increase in the total number of MUs used for each treatment technique. Another series of calculations of whole-body dose equivalents for 3D-CRT and IMRT prostate treatments were carried out by Kry et al (2005b). The authors reported major differences between using this method and organ-specific risk calculations.
Kry et al (2005b) used the dose equivalents determined in their previous work (Kry et al 2005a) to calculate the risk of fatal second cancers from IMRT of the prostate to individual organs. Risks of fatal second cancers for seven organs that received exposures up to 2–5 Sv were calculated by taking the product of the dose equivalent at each organ and the organ-specific fatal cancer probability coefficient recommended by the NCRP (1993). It was reported that the risk of inducing a fatal second cancer was lowest for the 18 MV conventional plan compared to the IMRT plans. The group concluded that this reduction in risk is due to the 75% reduction of MUs used for the 3D-CRT compared to IMRT. Considering only IMRT cases, the risk was lowest for the 10 MV treatment given from the Varian accelerator. Similar methods were used by Shepherd et al (1997), Koshy et al (2004) and Mansur et al (2007) for selected organs.
Verellen and Vanhavere (1999) compared 6 MV 3D-CRT and 6 MV IMRT head and neck treatment plans. In vivo measurements were taken for a 75 Gy treatment that required 585 MUs and 3630 MUs for the conventional and IMRT treatment, respectively. They reported the normalized whole-body dose equivalent for the 3D-CRT and IMRT to be 1.2 × 10⁻² mSv/MU and 1.6 × 10⁻² mSv/MU, respectively. Using the ICRP-60 nominal probability coefficient for a lifetime risk of excess cancers, the authors concluded that the IMRT treatment would increase the second cancer risk by a factor of 8.
There are many different contributions that provide uncertainties in absolute risk estimates that have been provided in the literature. Kry et al (2007c) recently examined the uncertainty in absolute risk estimates and in the ratio of risk estimates between different treatment modalities using the NCRP/ICRP risk model and a risk model suggested by the US Environmental Protection Agency (EPA). They found that the absolute risk estimates of fatal second cancers were associated with very large uncertainties, thus making it difficult to distinguish between risks associated with different treatment modalities considered. They suggested that the ratio of risk estimates is more statistically significant when comparing treatment plans such as 6 MV IMRT versus 18 MV IMRT for prostate therapy.
Epidemiological risk assessments should be based on organ-specific equivalent doses. Such an approach has been followed by Brenner and Hall (2008) using the organ-average equivalent doses for an adult male reported by Jiang et al (2005). They estimated second cancer risks for various organs assuming a neutron RBE value of 25. They reported that lifetime cancer risk due to external neutrons is 4.7% and 11.1% for a cured 15-year-old male and female, respectively. The estimations were based on a proton treatment for lung cancer. The risk decreased to 2% and 3%, respectively, for an adult patient.
Schneider et al (2005) proposed the concept of ‘organ equivalent dose (OED)’ in which any dose distribution in an organ is equivalent and corresponds to the same OED if it causes the same radiation-induced cancer incidence. For low doses, the OED is simply the average organ dose, since for these doses the dose–response function behaves linearly with dose. However, at high doses the OED is different, because cell killing becomes important. The basis for the OED model is the dose–response relationship for radiation-induced cancer for different organs. Since there is limited data for specific organs the authors chose to use the available data on radiation-induced cancers in patients treated for Hodgkin’s disease. These patients were usually young at diagnosis and underwent treatments using several radiation fields. The model is a linear-exponential dose–response model that takes into account cell killing effects by an exponential function that depends on the dose and the organ-specific cell sterilization factor that is determined by the Hodgkin’s disease data. The dose distributions used to determine the organ-specific cell sterilization factor were calculated in individual organs for which cancer incidence data were available. The organ-specific cell sterilization factor varied from 0.017 for the mouth and pharynx to 1.592 for the bladder. A subsequent paper by Schneider and Kaser-Hotz (2005) calculated OEDs based on a plateau dose–response relationship. Using this relationship, new organ-specific cell sterilization factors were determined. In their reply to Schneider, Kry et al pointed out that developing concepts like the OED model suffer from major deficiencies, such as single specific irradiated populations. Therefore, most groups stand by the conventional risk assessment technique (Kry et al 2005a, 2005b).
5. Discussions
There is a tremendous amount of data on dosimetry and on epidemiological studies related to radiation-induced cancers in patients who have received radiation treatment. The majority of the dosimetry studies focused on determining what is called ‘out-of-field’ dose or ‘peripheral dose’ that are measured in a water phantom at different positions relative to the high-dose (target) area or relative to the edge of the accelerator collimator. Such data are useful in comparing the relative level of secondary radiation from different accelerators or treatment procedures (Stovall et al 1995, Mutic and Klein 1999, Stern et al 1999, Klein et al 2006). However, to estimate cancer risks for specific anatomical sites, organ-averaged absorbed dose or equivalent dose should be accurately determined using measurements or Monte Carlo calculations. Stovall et al (1989) developed the first dosimetric method to link organ-averaged dose to second cancer epidemiological studies. Recently, Howell et al (2006) used 197Au-based Bonner system for neutron measurements. Wang and Xu (2007) reported organ doses for photons using real-time MOSFET dosimeters inside the RANDO phantom that were labeled with organ locations for easy dosimeter placement. Organ-averaged doses can also be calculated accurately using whole-body models as demonstrated by Jiang et al (2005) and Zacharatou Jarlskog et al (2006, 2008) in their studies on proton treatments involving models of adult male and children. Using the organ-average equivalent doses for an adult male reported by Jiang et al (2005), Brenner and Hall (2008) estimated second cancer risks for various organs. Similarly, Kry et al (2005b) used the equivalent doses determined in the RANDO phantom to calculate the risk of fatal second cancers from an IMRT prostate case to individual organs. The methodologies demonstrated in these experimental and Monte Carlo investigations should be considered in future second cancer studies. The use of the effective dose and direct assessment of whole-body risk should be avoided.
5.1. Where are the second cancers found?
Most dosimetry studies focused on dose in regions far away from the target volume because the dose close to the target appears to be unavoidable when treating the primary cancer. On the other hand, the most cancer incidence data are based on second cancers found near the target volume due to the obvious reasons that there is a greater chance for a second cancer to occur in these relatively higher dose levels. A study by Dorr and Herrmann (2002) found that between 60% and 90% of second tumors occur with 5 cm of the margins of the treatment field. Boice et al (1985) found that 43% of second tumors developed near the primary field. These findings are especially significant when considering the improved dose conformality by IMRT in comparison with 3D-CRT and other conventional radiotherapy. For regions that are outside of the target volume and outside of the volumes affected by the therapeutic beams, the level of radiation dose responsible for the second cancer can vary significantly. In the high-dose regions, cell killing is the dominant effect and consequently the risk for developing a second cancer will likely be smaller than that predicted by the LNT model for the low-dose region (Dorr and Herrmann 2002, Boice et al 1985, Rubino et al 2005). Schneider (2006) pointed out that several recent papers, including Kry et al (2005a, 2005b), have only considered secondary exposures to sites far from the treatment volume, thus ignoring the contribution from the primary beam to second cancer incidence. The LNT model relationship for these tissues near the treatment volume tends to overestimate the risk. Sachs and Brenner (2005) believed that the LNT models could overestimate the risk at high doses, while the competition models may underestimate the second cancer risk at high doses. They therefore proposed a biologically based and minimally parameterized model that incorporates carcinogenic effects, cell killing and proliferation/repopulation effects that were consistent with clinical data for high-dose second cancer data. Given the wide range of dose levels observed for various medical exposures as summarized in table 1, guidelines about the selection of risk models for different locations relative to the target volume are needed for future practice.
5.2. Neutron equivalent dose
In determining neutron equivalent doses, the assignment of neutron radiation weighting factor(s) is critical. For radiation protection purposes, the radiation weighting factor for neutrons has been proposed in two ways—a step function defining five neutron energy ranges with values of 5, 10 and 20, respectively (ICRP 1991) or by a continuous function with a peak value of 20 at around 1 MeV (ICRP 2007). Based on the ICRP curve, for example, energy-averaged neutron weighting factors in proton therapy treatments are typically between 2 and 11 (Yan et al 2002, Jiang et al 2005, Wroe et al 2007). One must keep in mind that the majority of neutron energies are deposited by neutrons of relatively high energies. These high-energy neutrons have weighting factors that presumably differ from the peak value in the ICRP curve. On the other hand, the ICRP radiation weighting factors are not very reliable for very low doses (Kellerer 2000). These may underestimate the biological effectiveness for neutrons for cell mutation at low doses. For neutrons in the 1–2 MeV region, the NCRP has reported elevated neutron weighting factors of up to 100 considering several radiation endpoints (NCRP 1990). Dennis (1987) has summarized experimental neutron RBE data and found maximum values (for low doses) to be between 6.44 and 71 in vivo. Brenner and Hall (2008) assumed a constant value of 25 for neutrons in proton therapy treatments. Thus, interpreting the neutron equivalent doses is associated with considerable uncertainties. In future studies, it is prudent to record not only equivalent doses but also absorbed organ doses that can be used with future experimental data on the neutron RBE.
5.3. Age-dependent dosimetry
The risk of radiation-induced second malignancies is of particular interest in the treatment of pediatric and pregnant patients. There is convincing data to support that young children are about 5–10 times more likely to develop cancer for the same dose of radiation than in adults (BEIR 2006). In comparison, the risk of a second cancer for older patients is significantly smaller and the latent period likely exceeds the life expectancy. Further, since anatomical structures in pediatric patients are closer in proximity to the treated target, there will be an increased radiation dose in the same tissue compared to adult patients. The importance of using age-specific patient models in Monte Carlo calculations was demonstrated in a recent study on neutron dose in proton treatments (Zacharatou-Jarlskog et al 2008). Similarly, cancer risk is extremely high for fetuses in roughly 3500 pregnant women who are diagnosed with cancer and eventually undergo radiation treatment each year in the United States. This number is only expected to increase since women are delaying pregnancies until later ages of fertility coupled with the fact that new technology allows for more accurate means of detection. Due to the elevated susceptibility of the fetus to develop radiation-induced cancer, the quantification of dose to the fetus from radiation therapy treatments is increasingly important. This topic has been moderately discussed in the literature (Stovall et al 1995, Roy and Sandison 2000, 2004, Mesoloras et al 2006, Kry et al 2007a, Bednarz et al 2008).
5.4. Whole-body patient models
To assess organ-specific doses, whole-body anatomical phantoms and Monte Carlo codes are needed. Ideally, the models should match the patient anatomy as closely as possible. To date, more than 30 models representing adult male and female, children and pregnant women have been developed from carefully segmented and labeled whole-body images, mostly for radiation protection purposes (Zaidi and Xu 2007). A list of the latest models can be found at www.virtualphantoms.org. Several of such anatomically realistic patient models have been used for the study of second cancers. The VIP-Man, for example, is a whole-body, organ-segmented voxel model including such tissues as the skin, lens of the eye and red bone marrow (Xu et al 2000). VIP-Man was used to study secondary neutron doses from proton treatment plans (Jiang et al 2005). A voxelized model of the Rando phantom (Wang et al 2004, Xu et al 2006) and a series of RPI-P pregnant female models representing 3 months, 6 months and 9 months gestational periods (Xu et al 2007, Bednarz et al 2008) have also been reported. To calculate organ doses, detailed accelerator models have been developed to simulate the secondary radiation source terms (Bednarz et al 2007, Bednarz and Xu 2007). Age-specific pediatric models have been developed and used for second cancer studies (Lee et al 2006, Zacharatou-Jarlskog et al 2008). Figure 5 shows several patient models. A stylized model called ADAM was used, in a European project called MAESTRO, to assess the risk of second malignancy induction from various radiation therapy treatment modalities (Rijkee et al 2006). The authors observed large discrepancies in the dose to the prostate, bladder and rectum between the ADAM phantom and dose determined in the treatment planning system. This discrepancy is a result of differences in the anatomical models. In the future studies, patient models defined in advanced surface geometries that allow for efficient organ and body size adjustment will be needed to model-specific patients more accurately (Xu et al 2008).
Figure 5.
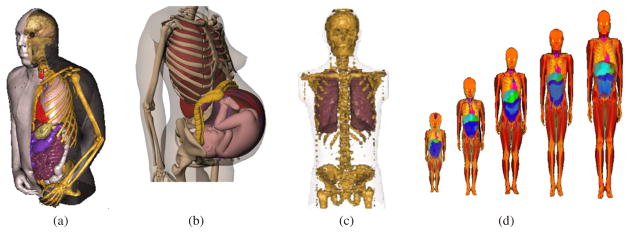
Computational phantoms: (a) VIP-Man (Xu et al 2000), (b) the RPI-P9 model for a 9-month pregnant female (Xu et al 2007), (c) voxel model of the Rando phantom (Wang et al 2004) and (d) pediatric phantoms (Lee et al 2006).
5.5. Patient exposures from various medical procedures
This review only included external-beam radiation treatment which has been the focus of second cancer studies in the past. It is conceivable that brachytherapy and radionuclide therapy face a similar challenge, although related data are sparse. The AAPM Task Group 158 and the National Council on Radiation Protection and Measurements Scientific Committee 1–17 have both decided to exclude brachytherapy and radionuclide therapy from their considerations due to a lack of data. Patient exposures associated with image-guided radiation treatment procedure for localization and verification have recently gained significant attentions (Murphy et al 2007). As shown in table 1, such imaging doses are at the low-dose level although healthy tissues are irradiated uniformly. However, there is currently an increasing awareness about these so-called concomitant exposures and some have argued whether or not it was necessary to set a dose action level in accordance with regulations in the United Kingdom (IR(ME)R 2000, Waddington and McKenzie 2004, Munro 2004). With the widespread adoption of IGRT procedures, it makes sense to combine the concomitant and scattered therapy doses in second cancer risk assessment and even in the treatment planning when the imaging dose accounts for several per cents of the therapeutic dose in organs at risk. Furthermore, the lifetime exposure of a patient, in terms of organ-averaged equivalent doses, should be recorded for all radiological procedures through national cancer registries and be made available for epidemiological studies.
6. Conclusion
We have hopefully covered some of the major dosimetry studies that were carried out to compare or estimate the risk of radiation-induced second cancers after external-beam radiation therapy. Increased cancer risk has been confirmed in patient 30 years (Travis et al 2003) and 40 years (Chaturvedi et al 2007) after the radiation treatment of the original cancer, respectively. Such a risk is especially alarming in younger patients who are much more susceptible to radiation than the adults.
Many of the past dosimetry studies are based on inconsistent and sometimes confusing dose quantities and a systematic dosimetry methodology for quantifying secondary organ absorbed doses needs to be developed in the future. The majority of the studies focused on determining the so-called out-of-field dose or ‘peripheral dose’ that are measured in a water phantom at different locations from the edge of the treatment delivery system. Such data are useful in comparing the relative level of secondary radiation from different accelerators or treatment procedures. This type of studies should continue especially for the evaluation of new treatment modalities. However, the protection quantity, effective dose, should not be used for absolute risk assessment for specific patient or for epidemiological studies. Instead, organ-specific equivalent doses must be used and documented. Therapeutically irradiated populations provide increasingly valuable data for large-scale epidemiological studies on radiation effects involving a wide range of dose levels. If collected carefully, dosimetry data for patients can be more accurate (and more relevant because of the well-defined fractionation schemes and well-known radiation field) than those collected for atomic-bomb survivors and workers, thus making it possible to reduce the uncertainty in the derived risk estimates for patients. As the atomic-bomb survivors age eventually cease to be epidemiologically useful, patients irradiated by both therapeutic and diagnostic imaging procedures will become a critical source of data for continuous refinement of dose–response functions especially in low-level exposures. Such knowledge will in turn allow the radiation oncology community to optimize the radiation treatment procedures. Obviously, challenges exist in designing epidemiological studies that enable a higher degree of specification of site-specific second cancers among those patients treated with adjuvant chemotherapy.
This review uncovers an unfortunate fact that some of the most important studies in the past were not based on organ-specific absorbed doses. Recognizing the lack of statistical power in the low-dose region, the BEIR VII report (BEIR 2006) states that ‘Epidemiologic studies, in general, have limited ability to define the shape of the radiation dose–response curve and to provide quantitative estimates of risk in relation to radiation dose, especially for relatively low doses. To even attempt to do so, a study should be based on accurate, individual dose estimates, preferably to the organ of interest …’. It is therefore strongly recommended that physical and computational human phantoms with well-defined radiosensitive organs be used in future dosimetry studies. These phantoms should include organs and tissues explicitly listed in the table of the tissue weighting factors defined by the ICRP (1991, 2007). To ensure that such data are recorded for every patient being treated (or at least for patients with increased risk factors such as pediatric patients), it may be necessary to calculate and record organ-specific doses in the entire body as part of the treatment planning using a library of reference computational phantoms that can be deformed (Xu et al 2008). Such realistic patient models can be easily coupled with state-of-the-art Monte Carlo codes and models of medical accelerators to simulate IMRT and proton therapy procedures.
Compared to classical radiation treatments, IMRT and proton therapy offer the potential for significant improvement in local tumor control because of their highly conformal dose distributions. The proton therapy brings the additional advantage of a lower integral dose compared to the photon therapy (Miralbell et al 2002). However, better local tumor controls in IMRT and proton therapy do not necessarily lead to a lower scattered (equivalent) dose to regions distant from the treatment volume. For 6 MV IMRT, the reduction in secondary photon dose due to prolonged treatment time and leakage radiation should be strongly encouraged. Manufacturers of medical accelerators should investigate ways to reduce the leakage and scattered radiation by possibly increasing shielding. For 18 MV photon IMRT or proton therapy, the main concern is the secondary neutron irradiation. Measures can be taken to reduce the photonuclear interactions. In proton therapy, active-scanning systems can clearly reduce the secondary neutron production and should be introduced to facilities that currently rely on the passive scanning method. It is important to note that there is considerable uncertainty in the current understanding of the biological effectiveness from these neutrons. More data on neutron-induced side effects in tissues, particularly for low doses, are therefore needed in the future studies.
Given the real threat of a patient developing a second cancer in his or her lifetime, it is prudent for the radiation oncology and physics community to continue to monitor new treatment technologies such as the IMRT and proton therapy. Although this article only reviewed studies related to the external-beam treatment, we have become acutely aware of the need for patient doses from multiple procedures to be integrated for future epidemiological studies and for the better management of second cancer risk in therapeutically irradiated patients. Currently, several ICRP, NCRP and AAPM committees have been charged with the task of making recommendations regarding various aspects of this subject. It is hoped that these recommendations will eventually lead to a concerted effort at the national and international levels in standardized data recording, preservation and sharing so that the clinical database on radiation-treated cancer survivors can be fully utilized.
Acknowledgments
The authors are supported in part by a grant (R01CA116743) from the National Cancer Institute. We would like to acknowledge information provided by and discussions with many colleagues who serve on the relevant ICRP, NCRP and AAPM committees. Drs David Followill, Stephen Kry, David Brenner and James Purdy provided helpful comments on the manuscript.
References
- AAPM. AAPM Report No. 17. 1986. The physical aspects of total and half body photon irradiation. [Google Scholar]
- Agosteo S, Foglio AP, Maggioni B, Sanguist V, Terrani S, Borasi G. Radiation transport in a radiotherapy room. Health Phys. 1995;68:27–34. doi: 10.1097/00004032-199501000-00003. [DOI] [PubMed] [Google Scholar]
- Agosteo S, et al. Secondary neutron and photon dose in proton therapy. Radiother Oncol. 1998;48:293–305. doi: 10.1016/s0167-8140(98)00049-8. [DOI] [PubMed] [Google Scholar]
- Aird EGA. Second cancer risk, concomitant exposures, and IRMER (2000) Br J Radiol. 2004;77:983–5. doi: 10.1259/bjr/56613233. [DOI] [PubMed] [Google Scholar]
- Allen PD, Chaudhri MA. The dose contribution due to photonuclear reactions during radiotherapy. Med Phys. 1982;9:904–5. doi: 10.1118/1.595229. [DOI] [PubMed] [Google Scholar]
- Allen PD, Chaudhri MA. Photoneutron production in tissue during high energy bremsstrahlung radiotherapy. Phys Med Biol. 1988;33:1017–36. doi: 10.1088/0031-9155/33/9/002. [DOI] [PubMed] [Google Scholar]
- Allen PD, Chaudhri MA. Charged photoparticle production in tissue during radiotherapy. Med Phys. 1997;24:837–9. doi: 10.1118/1.598004. [DOI] [PubMed] [Google Scholar]
- Altinok G, et al. Pediatric renal carcinoma associated with Xp11.2 translocations/TFE3 gene fusions and clinicopathologic associations. Pediatr Dev Pathol. 2005;8:168–80. doi: 10.1007/s10024-004-9106-3. [DOI] [PubMed] [Google Scholar]
- Aoyama H, et al. Integral radiation dose to normal structures with conformal external beam radiation. Int J Radiat Oncol Biol Phys. 2006;64:962–7. doi: 10.1016/j.ijrobp.2005.11.005. [DOI] [PubMed] [Google Scholar]
- Aung L, et al. Second malignant neoplasms in long-term survivors of osteosarcoma: memorial Sloan-Kettering cancer center experience. Cancer. 2002;95:1728–34. doi: 10.1002/cncr.10861. [DOI] [PubMed] [Google Scholar]
- Azzam EI, Raaphorst GP, Mitchell RE. Radiation-induced adaptive response for protection against micronucleus formation and neoplastic transformation in C3H 10T1/2 mouse embryo cells. Radiat Res. 1994;138:S28–31. [PubMed] [Google Scholar]
- Ballarini F, et al. Cellular communication and bystander effects: a critical review for modelling low-dose radiation action. Mutat Res. 2002;501:1–12. doi: 10.1016/s0027-5107(02)00010-6. [DOI] [PubMed] [Google Scholar]
- Balog J, DeSouza C, Crilly R. Helical tomotherapy radiation leakage and shielding considerations. Med Phys. 2005;32:710–19. doi: 10.1118/1.1861521. [DOI] [PubMed] [Google Scholar]
- Barcellos-Hoff MH. It takes a tissue to make a tumor: epigenetics, cancer and the microenvironment. J Mammary Gland Biol Neoplasia. 2001;6:213–21. doi: 10.1023/a:1011317009329. [DOI] [PubMed] [Google Scholar]
- Barquero R, Edwards TM, Iniguez MP, Vega-Carillo HR. Monte Carlo simulation estimates of neutron doses to critical organs of a patient undergoing 18 MV x-ray LINAC-based radiotherapy. Med Phys. 2005;32:3579–88. doi: 10.1118/1.2122547. [DOI] [PubMed] [Google Scholar]
- Bassal M, et al. Risk of selected subsequent carcinomas in survivors of childhood cancer: a report from the Childhood Cancer Survivor Study. J Clin Oncol. 2006;24:476–83. doi: 10.1200/JCO.2005.02.7235. [DOI] [PubMed] [Google Scholar]
- Barth RF, Soloway AH, Fairchild RG. Boron neutron capture therapy of cancer. Cancer Res. 1990;50:1061–70. [PubMed] [Google Scholar]
- Becker J, Brunchorst E, Schmidt R. Photoneutron production of Siemens Primus linear accelerator studied by Monte Carlo methods and a paired magnesium and boron coated magnesium ionization chamber system. Phys Med Biol. 2007;52:6375–87. doi: 10.1088/0031-9155/52/21/002. [DOI] [PubMed] [Google Scholar]
- Bednarz B, Taranenko V, Shi CY, Xu XG. Radiation safety of pregnant patients during radiation treatment: a detailed modeling of the accelerator, patient anatomy, and non-target doses. Proc. AAPM Annual Meeting; Minneapolis. 22–26 July.2007. [Google Scholar]
- Bednarz B, Taranenko V, Xu XG. Calculation of fetal doses to pregnant patients in 6-MV photon treatments using Monte Carlo methods and anatomically realistic phantoms. Med Phys. 2008 doi: 10.1118/1.2938519. in press. [DOI] [PMC free article] [PubMed] [Google Scholar]
- Bednarz B, Xu XG. The need for detailed Monte Carlo studies of medical accelerators. Proc. 2007 American Nuclear Society Annual Meeting; Boston. 24–28 June; 2007. [Google Scholar]
- BEIR. BEIR VII, Phase 2. National Research Council, National Academy of Science; 2006. Health risks from exposure to low levels of ionizing radiation. [Google Scholar]
- Bhatia S, Landier W. Evaluating survivors of pediatric cancer. Cancer J. 2005;11:340–54. doi: 10.1097/00130404-200507000-00010. [DOI] [PubMed] [Google Scholar]
- Bhatia S, et al. Breast cancer and other second neoplasms after childhood Hodgkin’s disease. New Engl J Med. 1996;334:745–51. doi: 10.1056/NEJM199603213341201. [DOI] [PubMed] [Google Scholar]
- Bhatia S, et al. Low incidence of second neoplasms among children diagnosed with acute lymphoblastic leukemia after 1983. Blood. 2002;99:4257–64. doi: 10.1182/blood.v99.12.4257. [DOI] [PubMed] [Google Scholar]
- Bhatia S, et al. High risk of subsequent neoplasms continues with extended follow-up of childhood Hodgkin’s disease: report from the late effects study group. J Clin Oncol. 2003;21:4386–94. doi: 10.1200/JCO.2003.11.059. [DOI] [PubMed] [Google Scholar]
- Bhattacharjee D, Ito A. Deceleration of carcinogenic potential by adaptation with low dose gamma irradiation in vivo. 2001;15:87–92. [PubMed] [Google Scholar]
- Binns PJ, Hough JH. Secondary dose exposures during 200 MeV proton therapy. Radiat Prot Dosim. 1997;70:441–4. [Google Scholar]
- Blettner M, Boice JD. Radiation dose and leukaemia risk: general relative risk techniques for dose–response models in a matched case-control study. Stat Med. 1991;10:1511–26. doi: 10.1002/sim.4780101004. [DOI] [PubMed] [Google Scholar]
- Boice JD., Jr . Ionizing radiation. In: Schottenfeld D, Fraumeni JF Jr, editors. Cancer Epidemiology and Prevention. 3. New York: Oxford University Press; 2006. pp. 259–93. [Google Scholar]
- Boice JD, Jr, et al. Second cancers following radiation treatment for cervical cancer. an international collaboration among cancer registries. J Natl Cancer Inst. 1985;74:955–75. [PubMed] [Google Scholar]
- Boice JD, Jr, et al. Radiation dose and leukemia risk in patients treated for cancer of the cervix. J Natl Cancer Inst. 1987;79:1295–311. [PubMed] [Google Scholar]
- Boice JD, Jr, et al. Radiation dose and second cancer risk in patients treated for cancer of the cervix. Radiat Res. 1988;116:3–55. [PubMed] [Google Scholar]
- Brada M, et al. Risk of second brain tumour after conservative surgery and radiotherapy for pituitary adenoma. BMJ. 1992;304:1343–6. doi: 10.1136/bmj.304.6838.1343. [DOI] [PMC free article] [PubMed] [Google Scholar]
- Brenner DJ, Curtis RE, Hall EJ, Ron E. Second malignancies in prostate carcinoma patients after radiotherapy compared with surgery. Cancer. 2000;88:398–406. doi: 10.1002/(sici)1097-0142(20000115)88:2<398::aid-cncr22>3.0.co;2-v. [DOI] [PubMed] [Google Scholar]
- Brenner DJ, Hall EJ. Commentary 2 to Cox and Little: radiation-induced oncogenic transformation: the interplay between dose, dose protraction, and radiation quality. Adv Radiat Biol. 1992;16:167–79. doi: 10.1016/b978-0-12-035416-0.50012-4. [DOI] [PubMed] [Google Scholar]
- Brenner DJ, Hall EJ. Secondary neutrons in clinical proton radiotherapy: a charged issue. Radiother Oncol. 2008;86:165–70. doi: 10.1016/j.radonc.2007.12.003. [DOI] [PubMed] [Google Scholar]
- Brenner DJ, et al. Cancer risks attributable to low doses of ionizing radiation: assessing what we really know. Proc Natl Acad Sci USA. 2003;100:13761–6. doi: 10.1073/pnas.2235592100. [DOI] [PMC free article] [PubMed] [Google Scholar]
- Breslow NE, et al. Second malignant neoplasms following treatment for Wilm’s tumor: a report from the National Wilms’ tumor study group. J Clin Oncol. 1995;138:1851–9. doi: 10.1200/JCO.1995.13.8.1851. [DOI] [PubMed] [Google Scholar]
- Cahan WG, Woodard HQ, Higonbotham NL, Stewart FW, Coley BL. Sarcoma arising in irradiated bone: report of eleven cases. Cancer. 1948;1:3–29. doi: 10.1002/(sici)1097-0142(19980101)82:1<8::aid-cncr3>3.0.co;2-w. [DOI] [PubMed] [Google Scholar]
- Calabrese EJ, Baldwin LA. The effects of gamma rays on longevity. Biogerontology. 2000;1:309–19. doi: 10.1023/a:1026510001286. [DOI] [PubMed] [Google Scholar]
- Calabrese EJ, Baldwin LA. The hormetic dose–response model is more common than the threshold model in toxicology. Toxicol Sci. 2003;71:246–50. doi: 10.1093/toxsci/71.2.246. [DOI] [PubMed] [Google Scholar]
- Carr ZA, et al. Malignant neoplasms after radiation therapy for peptic ulcer. Radiat Res. 2002;157:668–77. doi: 10.1667/0033-7587(2002)157[0668:mnartf]2.0.co;2. [DOI] [PubMed] [Google Scholar]
- Cecil RA, et al. Neutron angular and energy distributions from 710-MeV alphas stopping in water, carbon and lead, and 640-MeV alphas stopping in lead. Phys Rev C. 1980;21:2471. [Google Scholar]
- Chaturvedi, et al. Second cancers among 104760 survivors of cervical cancer: evaluation of long term risk. JCNI. 2007;99:1634–43. doi: 10.1093/jnci/djm201. [DOI] [PubMed] [Google Scholar]
- Chibani O, Ma CC. Photonuclear dose calculations for high-energy photon beams from Siemens and Varian linacs. Med Phys. 2003;30:1990–2000. doi: 10.1118/1.1590436. [DOI] [PubMed] [Google Scholar]
- Cox R, Kellerer AM. A current view on radiation weighting factors and effective dose (ICRP Publ. 92) Ann ICRP. 2003;33:1–4. [Google Scholar]
- Curtis RE, et al. Solid cancers after bone marrow transplantation. New Engl J Med. 1997;336:897–904. doi: 10.1056/NEJM199703273361301. [DOI] [PubMed] [Google Scholar]
- d’Errico F, Luszik-Bhadra M, Nath R, Siebert BRL, Wolf U. Depth dose-equivalent and effective energies of photoneutrons generated by 6–18 MV x-ray beams for radiotherapy. Health Phys. 2001;80:4–11. doi: 10.1097/00004032-200101000-00003. [DOI] [PubMed] [Google Scholar]
- d’Errico F, Nath R, Silvano G, Tana L. In vivo neutron dosimetry during high-energy bremsstrahlung radiotherapy. Int J Radiat Oncol Biol Phys. 1998b;41:1185–92. doi: 10.1016/s0360-3016(98)00162-x. [DOI] [PubMed] [Google Scholar]
- d’Errico F, Nath R, Tana L, Curzio G, Alberts WG. In-phantom dosimetry if photoneutrons from an 18 MV linear accelerator. Med Phys. 1998a;25:1717–24. doi: 10.1118/1.598352. [DOI] [PubMed] [Google Scholar]
- DeLaat CA, Lampkin BC. Long-term survivors of childhood cancer: evaluation and identification of sequelae of treatment CA. Cancer J Clin. 1992;42:263–82. doi: 10.3322/canjclin.42.5.263. [DOI] [PubMed] [Google Scholar]
- Dennis JA. The relative biological effectiveness of neutron radiation and its implications for quality factor and dose limitation. Program Nucl Energy. 1987;20:133–49. [Google Scholar]
- de Vathaire F, et al. Role of radiotherapy and chemotherapy in the risk of second malignant neoplasms after cancer in childhood. Br J Cancer. 1989;59:792–6. doi: 10.1038/bjc.1989.165. [DOI] [PMC free article] [PubMed] [Google Scholar]
- de Vathaire F, et al. Second malignant neoplasms after a first cancer in childhood: temporal pattern of risk according to type of treatment. Br J Cancer. 1999;79:1884–93. doi: 10.1038/sj.bjc.6690300. [DOI] [PMC free article] [PubMed] [Google Scholar]
- Diallo I, et al. Estimation of the radiation dose delivered to any point outside the target volume per patient treated with external beam radiotherapy. Radiother Oncol. 1996;38:269–71. doi: 10.1016/0167-8140(96)01713-6. [DOI] [PubMed] [Google Scholar]
- Difilippo F, Papiez L, Moskvin V, Peplow D, DesRosiers C, Johnson J, Timmerman R, Randall M, Lillie R. Contamination dose from photoneutron processes in bodily tissues during therapeutic radiation delivery. Med Phys. 2003;30:2849–54. doi: 10.1118/1.1612947. [DOI] [PubMed] [Google Scholar]
- Dixon RL. Accelerator leakage measurements. Med Phys. 1980;7:390. doi: 10.1118/1.594701. [DOI] [PubMed] [Google Scholar]
- Dorr W, Herrmann T. Second primary tumors after radiotherapy for malignancies, treatment-related parameters. Strahlenther Onkol. 2002;178:357–62. doi: 10.1007/s00066-002-0951-6. [DOI] [PubMed] [Google Scholar]
- D’Souza W, Rosen I. Nontumor integral dose variation in conventional radiotherapy treatment planning. Med Phys. 2003;30:2065–71. doi: 10.1118/1.1591991. [DOI] [PubMed] [Google Scholar]
- EPA. US Environmental Protection Agency—estimating radiogenic cancer risks. Washington, DC: 1994. EPA 402-R-93-076. [Google Scholar]
- Epstein R, Hanham I, Dale R. Radiotherapy-induced second cancers: are we doing enough to protect young patients? Eur J Cancer. 1997;33:526–30. doi: 10.1016/s0959-8049(97)00056-7. [DOI] [PubMed] [Google Scholar]
- Feinendegen LE. Evidence for beneficial low level radiation effects and radiation hormesis. Br J Radiol. 2005;78:3–7. doi: 10.1259/bjr/63353075. [DOI] [PubMed] [Google Scholar]
- Followill D, Geis P, Boyer A. Estimates of whole-body dose equivalent produced by beam intensity modulated conformal therapy. Int J Radiat Oncol Biol Phys. 1997;38:667–72. doi: 10.1016/s0360-3016(97)00012-6. [DOI] [PubMed] [Google Scholar]
- Followill DS, Stovall MS, Kry SF, Ibbott GS. Neutron source strength measurements for Varian, Siemens, Elekta, and General Electric linear accelerators. J Appl Clin Med Phys. 2003;4:189–94. doi: 10.1120/jacmp.v4i3.2514. [DOI] [PMC free article] [PubMed] [Google Scholar]
- Foss Abrahamsen A, et al. Long-term risk of second malignancy after treatment of Hodgkin’s disease: the influence of treatment, age and follow-up time. Ann Oncol. 2002;13:1786–91. doi: 10.1093/annonc/mdf289. [DOI] [PubMed] [Google Scholar]
- Fraass BA, van de Geijn J. Peripheral dose from megavolt beams. Med Phys. 1983;10:809–18. doi: 10.1118/1.595359. [DOI] [PubMed] [Google Scholar]
- Francois P, Beurtheret C, Dutreix A. Calculation of the dose delivered to organs outside the radiation beams. Med Phys. 1988;15:879–83. doi: 10.1118/1.596170. [DOI] [PubMed] [Google Scholar]
- Frankenberg D, et al. Enhanced neoplastic transformation by mammography x-rays relative to 200 kVp x-rays: indication for a strong dependence on photon energy of the RBE(M) for various end points. Radiat Res. 2002;157:99–105. doi: 10.1667/0033-7587(2002)157[0099:entbmx]2.0.co;2. [DOI] [PubMed] [Google Scholar]
- Garwicz S, et al. Second malignant neoplasms after cancer in childhood and adolescence: a population-based case-control study in the 5 nordic countries. The Nordic Society for Pediatric Hematology and Oncology The Association of the Nordic Cancer Registries. Int J Cancer. 2000;88:672–8. doi: 10.1002/1097-0215(20001115)88:4<672::aid-ijc24>3.0.co;2-n. [DOI] [PubMed] [Google Scholar]
- Gilbert ES, et al. Lung cancer after treatment for Hodgkin’s disease: focus on radiation effects. Radiat Res. 2003;159:161–73. doi: 10.1667/0033-7587(2003)159[0161:lcatfh]2.0.co;2. [DOI] [PubMed] [Google Scholar]
- Gottschalk B. Neutron dose in scattered and scanned proton beams: in regard to Eric J Hall (Int. J. Radiat. Oncol. Biol. Phys. 2006 65 1–7) Int J Radiat Oncol Biol Phys. 2006;66:1594. doi: 10.1016/j.ijrobp.2006.08.014. (author reply 1595) [DOI] [PubMed] [Google Scholar]
- Grahn D, Fry RJ, Lea RA. Analysis of survival and cause of death statistics for mice under single and duration-of-life gamma irradiation. Life Sci Space Res. 1972;10:175–86. [PubMed] [Google Scholar]
- Green DM, et al. Second malignant tumors following treatment during childhood and adolescence for cancer. Med Pediatr Oncol. 1994;22:1–10. doi: 10.1002/mpo.2950220102. [DOI] [PubMed] [Google Scholar]
- Green DM, et al. Second malignant tumors following treatment during childhood and adolescence for cancer. Med Pediatr Oncol. 1996;26:72. doi: 10.1002/mpo.2950220102. erratum. [DOI] [PubMed] [Google Scholar]
- Green DM, et al. Second malignant neoplasms after treatment for Hodgkin’s disease in childhood or adolescence. J Clin Oncol. 2000;18:1492–9. doi: 10.1200/JCO.2000.18.7.1492. [DOI] [PubMed] [Google Scholar]
- Greene D, Chu DL, Thomas DW. Dose levels outside radiotherapy beams. Br J Radiol. 1983;56:543–50. doi: 10.1259/0007-1285-56-668-543. [DOI] [PubMed] [Google Scholar]
- Guerin S, et al. Radiation dose as a risk factor for malignant melanoma following childhood cancer. Eur J Cancer. 2003;39:2379–86. doi: 10.1016/s0959-8049(03)00663-4. [DOI] [PubMed] [Google Scholar]
- Gunzert-Marx K, Schardt D, Simon RS. The fast neutron component in treatment irradiations with 12C beam. Radiother Oncol. 2004;73:S92–5. doi: 10.1016/s0167-8140(04)80023-9. [DOI] [PubMed] [Google Scholar]
- Hall EJ. Henry S Kaplan Distinguished Scientist Award 2003: the crooked shall be made straight—dose response relationships for carcinogenesis. Int J Radiat Biol. 2004;80:327–37. doi: 10.1080/09553000410001695895. [DOI] [PubMed] [Google Scholar]
- Hall EJ. Intensity-modulated radiation therapy, protons, and the risk of second cancers. Int J Radiat Oncol Biol Phys. 2006;65:1–7. doi: 10.1016/j.ijrobp.2006.01.027. [DOI] [PubMed] [Google Scholar]
- Hall E, Wuu CS. Radiation induced second cancers: the impact of 3D-CRT and IMRT. Int J Radiat Oncol Biol Phys. 2003;56:83–9. doi: 10.1016/s0360-3016(03)00073-7. [DOI] [PubMed] [Google Scholar]
- Han A, Elkind MM. Transformation of mouse C3H/10T1/2 cells by single and fractionated doses of x-rays and fission-spectrum neutrons. Cancer Res. 1979;39:123–30. [PubMed] [Google Scholar]
- Hasanzadeh H, Sharafi A, Allah Verdi M, Nikoofar A. Assessment of absorbed dose to thyroid, parotid and ovaries in patients undergoing gamma knife radiosurgery. Phys Med Biol. 2006;51:4375–83. doi: 10.1088/0031-9155/51/17/016. [DOI] [PubMed] [Google Scholar]
- Hawkins MM, Draper GJ, Kingston JE. Incidence of second primary tumours among childhood cancer survivors. Br J Cancer. 1987;56:339–47. doi: 10.1038/bjc.1987.200. [DOI] [PMC free article] [PubMed] [Google Scholar]
- Hawkins MM, et al. Epipodophyllotoxins, alkylating agents, and radiation and risk of secondary leukaemia after childhood cancer. BMJ. 1992;304:951–8. doi: 10.1136/bmj.304.6832.951. [DOI] [PMC free article] [PubMed] [Google Scholar]
- Hawkins MM, et al. Radiotherapy, alkylating agents, and risk of bone cancer after childhood cancer. J Natl Cancer Inst. 1996;88:270–8. doi: 10.1093/jnci/88.5.270. [DOI] [PubMed] [Google Scholar]
- Heidenreich WF, Paretzke HG, Jacob P. No evidence for increased tumor rates below 200 mSv in the atomic bomb survivors data. Radiat Environ Biophys. 1997;36:205–7. doi: 10.1007/s004110050073. [DOI] [PubMed] [Google Scholar]
- Herman MW, Dockter AE, Scallon JE. Definition of source for head shielding requirements in linear accelerators may affect room shielding design. Med Phys. 1980;7:70. doi: 10.1118/1.594768. [DOI] [PubMed] [Google Scholar]
- Heyes GJ, Mill AJ. The neoplastic transformation potential of mammography x-rays and atomic bomb spectrum radiation. Radiat Res. 2004;162:120–7. doi: 10.1667/rr3212. [DOI] [PubMed] [Google Scholar]
- Heyn R, et al. Second malignant neoplasms in children treated for rhabdomyosarcoma. Intergroup Rhabdomyosarcoma Study Committee. J Clin Oncol. 1992;11:262–70. doi: 10.1200/JCO.1993.11.2.262. [DOI] [PubMed] [Google Scholar]
- Hildreth NG, Shore RE, Dvoretsky PM. The risk of breast cancer after irradiation of the thymus in infancy. New Engl J Med. 1989;321:1281–4. doi: 10.1056/NEJM198911093211901. [DOI] [PubMed] [Google Scholar]
- Hogstrom KR, Almond PR. Review of electron beam therapy physics. Phys Med Biol. 2006;51:R455–89. doi: 10.1088/0031-9155/51/13/R25. [DOI] [PubMed] [Google Scholar]
- Holeman GR, Price KW, Friedman LF, Nath R. Neutron spectral measurements in an intense photon field associated with a high-energy x-ray radiotherapy machine. Med Phys. 1977;4:508–15. doi: 10.1118/1.594339. [DOI] [PubMed] [Google Scholar]
- Howell RM, Ferenci MS, Hertel NE, Fullerton GD. Investigation of secondary neutron dose for 18 MV dynamic MLC IMRT delivery. Med Phys. 2005;32:786–93. doi: 10.1118/1.1861162. [DOI] [PubMed] [Google Scholar]
- Howell RM, Hertel NE, Wang Z, Hutchinson J, Fullerton GD. Calculation of effective dose from measurement of secondary neutron spectra and scattered photon dose from dynamic MLC IMRT for 6 MV, 15 MV, and 18 MV beam energies. Med Phys. 2006;33:360–8. doi: 10.1118/1.2140119. [DOI] [PubMed] [Google Scholar]
- ICRP. ICRP Publication 26. Oxford: Pergamon; 1977. Recommendations of the International Commission on Radiological Protection. [Google Scholar]
- ICRP. ICRP Publication 60. Oxford: Pergamon; 1991. Recommendations of the International Commission on Radiological Protection. [Google Scholar]
- ICRP. ICRP Publication 79. Oxford: Pergamon; 1999. Genetic Susceptibility to Cancer. (Ann. ICRP vol 28/1–2) [Google Scholar]
- ICRP. ICRP Publication 103. Vol. 37. Oxford: Pergamon; 2007. Recommendations of the International Commission on Radiological Protection; pp. 2–4. [DOI] [PubMed] [Google Scholar]
- ICRU. ICRU Report No 50. Bethesda, MD: ICRU; 1994. Prescribing, Reporting, and Recording Photon Beam Therapy. [Google Scholar]
- Imaizumi M, et al. Radiation dose–response relationships for thyroid nodules and autoimmune thyroid diseases in Hiroshima and Nagasaki atomic bomb survivors 55–58 years after radiation exposure. JAMA. 2006;295:1011–22. doi: 10.1001/jama.295.9.1011. [DOI] [PubMed] [Google Scholar]
- Ing H, Nelson WR, Shore RA. Unwanted photon and neutron radiation resulting from collimated photon beams interacting with the body of radiotherapy patients. Med Phys. 1982;9:27–33. doi: 10.1118/1.595137. [DOI] [PubMed] [Google Scholar]
- Ing H, Shore RA. Unwanted radiation produced by leakage neutrons from medical electron accelerators. Med Phys. 1982;9:34–6. doi: 10.1118/1.595067. [DOI] [PubMed] [Google Scholar]
- Inskip PD, Stovall M, Flannery JT. Lung cancer risk and radiation dose among women treated for breast cancer. J Natl Cancer Inst. 1994;86:983–8. doi: 10.1093/jnci/86.13.983. [DOI] [PubMed] [Google Scholar]
- Inskip PD, et al. Leukemia following radiotherapy for uterine bleeding. Radiat Res. 1990;122:107–19. [PubMed] [Google Scholar]
- Inskip PD, et al. Leukemia, lymphoma, and multiple myeloma after pelvic radiotherapy for benign disease. Radiat Res. 1993;135:108–24. [PubMed] [Google Scholar]
- Ioffe V, et al. Fetal and ovarian radiation dose in patients undergoing gamma knife radiosurgery. Surg Neurol. 2002;58:32–41. doi: 10.1016/s0090-3019(02)00742-5. [DOI] [PubMed] [Google Scholar]
- Ionising Radiation (Medical Exposure) Regulations 2000 SI NO. 1059 (London: HMSO)
- Jemal A, et al. Cancer statistics. CA Cancer J Clin. 2006;56:106–30. doi: 10.3322/canjclin.56.2.106. [DOI] [PubMed] [Google Scholar]
- Jenkinson HC, et al. Long-term population-based risks of second malignant neoplasms after childhood cancer in Britain. Br J Cancer. 2004;91:1905–10. doi: 10.1038/sj.bjc.6602226. [DOI] [PMC free article] [PubMed] [Google Scholar]
- Jeraj R, et al. Radiation characteristics of helical tomotherapy. Med Phys. 2004;31:396–404. doi: 10.1118/1.1639148. [DOI] [PubMed] [Google Scholar]
- Jiang H, Wang B, Xu XG, Suit HD, Paganetti H. Simulation of organ-specific patient effective dose due to secondary neutrons in proton radiation treatment. Phys Med Biol. 2005;50:4337–53. doi: 10.1088/0031-9155/50/18/007. [DOI] [PubMed] [Google Scholar]
- Joiner MC, et al. Low-dose hypersensitivity: current status and possible mechanisms. Int J Radiat Oncol Biol Phys. 2001;49:379–89. doi: 10.1016/s0360-3016(00)01471-1. [DOI] [PubMed] [Google Scholar]
- Kaido T, et al. Radiosurgery-induced brain tumor. Case report. J Neurosurg. 2005;95:710–13. doi: 10.3171/jns.2001.95.4.0710. [DOI] [PubMed] [Google Scholar]
- Karlsson P, et al. Intracranial tumors after radium treatment for skin hemangioma during infancy—a cohort and case-control study. Radiat Res. 1997;148:161–7. [PubMed] [Google Scholar]
- Karlsson P, et al. Intracranial tumors after exposure to ionizing radiation during infancy: a pooled analysis of two Swedish cohorts of 28,008 infants with skin hemangioma. Radiat Res. 1998;150:357–64. [PubMed] [Google Scholar]
- Kaschten B, et al. Radiation-induced gliosarcoma. Case report and review of the literature. J Neurosurg. 1995;83:154–62. doi: 10.3171/jns.1995.83.1.0154. [DOI] [PubMed] [Google Scholar]
- Kase KR, Mao XS, Nelson WR, Liu JC, Kleck JH, Elsalim M. Neutron fluence and energy spectra around the Varian Clinac 2100C/2300C medical accelerator. Health Phys. 1998;74:38–47. doi: 10.1097/00004032-199801000-00005. [DOI] [PubMed] [Google Scholar]
- Kase KR, Svensson GK, Wolbarst AB, Marks MA. Measurement of dose from secondary radiation outside a treatment field. Int J Radiat Oncol Biol Phys. 1983;9:1173–83. doi: 10.1016/0360-3016(83)90177-3. [DOI] [PubMed] [Google Scholar]
- Keller B, Mathewson C, Rubin P. Scattered radiation dosage as a function of energy. Radiology. 1974;111:447–9. doi: 10.1148/111.2.447. [DOI] [PubMed] [Google Scholar]
- Kellerer, et al. Risk estimates for radiation-induced cancer—the epidemiological evidence. Radiat Environ Biophys. 2000;39:17–24. doi: 10.1007/pl00007679. [DOI] [PubMed] [Google Scholar]
- Kenney LB, et al. Breast cancer after childhood cancer: a report from the Childhood Cancer Survivor Study. Ann Int Med. 2004;141:590–7. doi: 10.7326/0003-4819-141-8-200410190-00006. [DOI] [PubMed] [Google Scholar]
- Kimball Dalton VM, et al. Second malignancies in patients treated for childhood acute lymphoblastic leukemia. J Clin Oncol. 1998;16:2848–53. doi: 10.1200/JCO.1998.16.8.2848. [DOI] [PubMed] [Google Scholar]
- Klein EE, Maserang B, Wood R, Mansur D. Peripheral dose from pediatric IMRT. Med Phys. 2006;33:2525–31. doi: 10.1118/1.2207252. [DOI] [PubMed] [Google Scholar]
- Ko SJ, et al. Neoplastic transformation in vitro after exposure to low doses of mammographic-energy x-rays: quantitative and mechanistic aspects. Radiat Res. 2004;162:646–54. doi: 10.1667/rr3277. [DOI] [PubMed] [Google Scholar]
- Kocher, et al. Radiation effectiveness factors for use in calculating probability of causation of radiogenic cancers. Health Phys. 2005;89:3–32. doi: 10.1097/01.hp.0000154172.48895.45. [DOI] [PubMed] [Google Scholar]
- Koshy, et al. Extra-target doses in children receiving multileaf collimator (MLC) based intensity modulated radiation therapy (IMRT) Pediatr Blood Cancer. 2004;42:626–30. doi: 10.1002/pbc.20030. [DOI] [PubMed] [Google Scholar]
- Kry SF, Salehpour M, Followill DS, Stovall M, Kuban DA, White RA, Rosen I. The calculated risk of fatal secondary malignancies from intensity-modulated radiation therapy. Int J Radiat Oncol Biol Phys. 2005a;62:1195–203. doi: 10.1016/j.ijrobp.2005.03.053. [DOI] [PubMed] [Google Scholar]
- Kry SF, Salehpour M, Followill DS, Stovall M, Kuban DA, White RA, Rosen II. Out-of-field photon and neutron dose equivalents from step-and-shoot intensity-modulated radiation therapy. Int J Radiat Oncol Biol Phys. 2005b;62:1204–16. doi: 10.1016/j.ijrobp.2004.12.091. [DOI] [PubMed] [Google Scholar]
- Kry SF, Starkschall G, Antolak JA, Salehpour M. Evaluation of the accuracy of fetal dose estimates using TG-36 data. Med Phys. 2007a;34:1193–7. doi: 10.1118/1.2710332. [DOI] [PubMed] [Google Scholar]
- Kry SF, Titt U, Followill DS, Ponisch F, Vassiliev ON, White RA, Stovall M, Salehpour M. A Monte Carlo model for out-of-field dose calculation from high-energy photon therapy. Med Phys. 2007b;34:3489–99. doi: 10.1118/1.2756940. [DOI] [PubMed] [Google Scholar]
- Kry SF, et al. Uncertainty of calculated risk estimates for secondary malignancies after radiotherapy. Int J Radiat Oncol Biol Phys. 2007c;68:1265–71. doi: 10.1016/j.ijrobp.2007.04.014. [DOI] [PubMed] [Google Scholar]
- Kry SF, Titt U, Ponisch F, Followill DS, Vassiliev ON, White RA, Mohan R, Salehpour M. A Monte Carlo model for calculating out-of-field dose from a Varian 6 MV beam. Med Phys. 2006;33:4405–13. doi: 10.1118/1.2360013. [DOI] [PubMed] [Google Scholar]
- Kurosawa T, et al. Measurements of secondary neutrons produced from thick targets bombarded by high-energy helium and carbon ions. Nucl Sci Eng. 1999;132:30–57. [Google Scholar]
- Kuttesch JF, Jr, et al. Second malignancies after Ewing’s sarcoma: radiation dose-dependency of secondary sarcomas. J Clin Oncol. 1996;14:2818–25. doi: 10.1200/JCO.1996.14.10.2818. [DOI] [PubMed] [Google Scholar]
- LaRiviere PD. Neutron sources in a 24-MV medical linear accelerator. Med Phys. 1985;12:806–9. doi: 10.1118/1.595743. [DOI] [PubMed] [Google Scholar]
- Laughlin JS. Use of 23-MeV betatron. Nucleonics. 1951;8:5. [PubMed] [Google Scholar]
- Lee C, et al. Whole-body voxel phantoms of paediatric patients—UF Series B. Phys Med Biol. 2006;51:4649–61. doi: 10.1088/0031-9155/51/18/013. [DOI] [PubMed] [Google Scholar]
- Leung W, et al. Second malignancy after treatment of childhood acute myeloid leukemia. Leukemia. 2001;15:41–5. doi: 10.1038/sj.leu.2401948. [DOI] [PubMed] [Google Scholar]
- Lin, et al. Monte Carlo simulation of a clinical linear accelerator. Appl Radiat Isot. 2001;55:759–65. doi: 10.1016/s0969-8043(01)00130-0. [DOI] [PubMed] [Google Scholar]
- Lindberg S, et al. Cancer incidence after radiotherapy for skin haemangioma during infancy. Acta Oncol. 1995;34:735–40. doi: 10.3109/02841869509127180. [DOI] [PubMed] [Google Scholar]
- Little MP. A comparison of the degree of curvature in the cancer incidence dose–response in Japanese atomic bomb survivors with that in chromosome aberrations measured in vitro. Int J Radiat Biol. 2000;76:1365–75. doi: 10.1080/09553000050151646. [DOI] [PubMed] [Google Scholar]
- Little MP. Comparison of the risks of cancer incidence and mortality following radiation therapy for benign and malignant disease with the cancer risks observed in the Japanese A-bomb survivors. Int J Radiat Biol. 2001;77:431–64. doi: 10.1080/09553000010022634. [DOI] [PubMed] [Google Scholar]
- Little MP, et al. Risk of brain tumour following treatment for cancer in childhood: modification by genetic factors, radiotherapy and chemotherapy. Int J Cancer. 1998;78:269–75. doi: 10.1002/(SICI)1097-0215(19981029)78:3<269::AID-IJC1>3.0.CO;2-T. [DOI] [PubMed] [Google Scholar]
- Liwnicz BH, et al. Radiation-associated gliomas: a report of four cases and analysis of postradiation tumors of the central nervous system. Neurosurgery. 1985;17:436–45. doi: 10.1227/00006123-198509000-00007. [DOI] [PubMed] [Google Scholar]
- Loeffler JS, Niemierko A, Chapman PH. Second tumors after radiosurgery: tip of the iceberg or a bump in the road? Neurosurgery. 2003;52:1436–42. doi: 10.1227/01.neu.0000064809.59806.e8. [DOI] [PubMed] [Google Scholar]
- Lundell M, Hakulinen T, Holm LE. Thyroid cancer after radiotherapy for skin hemangioma in infancy. Radiat Res. 1994;140:334–9. [PubMed] [Google Scholar]
- Lundell M, Holm LE. Risk of solid tumors after irradiation in infancy. Acta Oncol. 1995;34:727–34. doi: 10.3109/02841869509127179. [DOI] [PubMed] [Google Scholar]
- Lundell M, Holm LE. Mortality from leukemia after irradiation in infancy for skin hemangioma. Radiat Res. 1996;145:595–601. [PubMed] [Google Scholar]
- Lundell M, et al. Breast cancer risk after radiotherapy in infancy: a pooled analysis of two Swedish cohorts of 17,202 infants. Radiat Res. 1999;151:626–32. [PubMed] [Google Scholar]
- Maarouf M, et al. Radiation exposure of extracranial organs at risk during stereotactic linac radiosurgery. Strahlenther Onkol. 2005;181:463–7. doi: 10.1007/s00066-005-1391-x. [DOI] [PubMed] [Google Scholar]
- Maisin JR, et al. Life-shortening and disease incidence in mice after exposure to gamma rays or high-energy neutrons. Radiat Res. 1991;128:S117–23. [PubMed] [Google Scholar]
- Mansur DB, Klein EE, Maserang BP. Measured peripheral dose in pediatric radiation therapy: a comparison of intensity-modulated and conformal techniques. Radiother Oncol. 2007;82:179–84. doi: 10.1016/j.radonc.2007.01.002. [DOI] [PubMed] [Google Scholar]
- Mao XS, Kase KR, Lui JC, Nelson WR, Kleck JH, Johnsen S. Neutron sources in the Varian Clinac 2100C/2300C medical accelerator calculated by the EGS4 code. Health Phys. 1997;72:524–9. doi: 10.1097/00004032-199704000-00003. [DOI] [PubMed] [Google Scholar]
- Martin JH, Evans A. Radiation outside the defined field. Br J Radiol. 1959;32:7–12. doi: 10.1259/0007-1285-32-373-7. [DOI] [PubMed] [Google Scholar]
- Matsufuji N, et al. Spatial fragment distribution from a therapeutic pencil-like carbon beam in water. Phys Med Biol. 2005;50:3393–403. doi: 10.1088/0031-9155/50/14/014. [DOI] [PubMed] [Google Scholar]
- Mattsson A, et al. Incidence of primary malignancies other than breast cancer among women treated with radiation therapy for benign breast disease. Radiat Res. 1997;148:152–60. [PubMed] [Google Scholar]
- Mazonakis, et al. Risk estimation of radiation-induced thyroid cancer from treatment of brain tumors in adults and children. Int J Oncol. 2003;22:221–5. [PubMed] [Google Scholar]
- Mazonakis M, et al. Scattered dose to thyroid from prophylactic cranial irradiation during childhood: a Monte Carlo study. Phys Med Biol. 2006;51:N139–45. doi: 10.1088/0031-9155/51/8/N01. [DOI] [PubMed] [Google Scholar]
- McCall RC, Jenkins TM, Shore RA. Transport of accelerator produced neutrons in a concrete room. SLAC Pub. 1978;2214:1–10. [Google Scholar]
- McCall RC, Swanson WP. Neutron sources and their characteristics. SLAC Pub. 1979;2292:1–12. [Google Scholar]
- McGinley PH, Wood M, Mills M, Rodriguez R. Dose levels due to neutrons in the vicinity of high-energy medical accelerators. Med Phys. 1976;3:397–402. doi: 10.1118/1.594256. [DOI] [PubMed] [Google Scholar]
- McParland BJ, Fair HI. A method of calculating peripheral dose distributions of photon beams below 10 MV. Med Phys. 1992;19:283–93. doi: 10.1118/1.596858. [DOI] [PubMed] [Google Scholar]
- Meadows AT, et al. Second malignant neoplasms in children: an update from the Late Effects Study Group. J Clin Oncol. 1985;3:532–8. doi: 10.1200/JCO.1985.3.4.532. [DOI] [PubMed] [Google Scholar]
- Meeks, et al. In vivo determination of extra-target doses received from serial tomotherapy. Radiother Oncol. 2002;63:217–22. doi: 10.1016/s0167-8140(02)00074-9. [DOI] [PubMed] [Google Scholar]
- Mertens AC, et al. Late mortality experience in five-year survivors of childhood and adolescent cancer: the Childhood Cancer Survivor Study. J Clin Oncol. 2001;19:3163–72. doi: 10.1200/JCO.2001.19.13.3163. [DOI] [PubMed] [Google Scholar]
- Mesoloras G, et al. Neutron scattered dose equivalent to a fetus from proton radiotherapy of the mother. Med Phys. 2006;33:2479–90. doi: 10.1118/1.2207147. [DOI] [PubMed] [Google Scholar]
- Metayer C, et al. Second cancers among long-term survivors of Hodgkin’s disease diagnosed in childhood and adolescence. J Clin Oncol. 2000;18:2435–43. doi: 10.1200/JCO.2000.18.12.2435. [DOI] [PubMed] [Google Scholar]
- Minniti G, et al. Risk of second brain tumor after conservative surgery and radiotherapy for pituitary adenoma: update after an additional 10 years. J Clin Endocrinol Metab. 2005;90:800–4. doi: 10.1210/jc.2004-1152. [DOI] [PubMed] [Google Scholar]
- Miralbell R, et al. Potential reduction of the incidence of radiation-induced second cancers by using proton beams in the treatment of pediatric tumors. Int J Radiat Oncol Biol Phys. 2002;54:824–9. doi: 10.1016/s0360-3016(02)02982-6. [DOI] [PubMed] [Google Scholar]
- Munro AJ. Motes and beams: some observations on an IR(ME)R inspection in radiotherapy. Br J Radiol. 2004;77:273–5. doi: 10.1259/bjr/96768668. [DOI] [PubMed] [Google Scholar]
- Murphy, et al. The management of imaging dose during image-guided radiotherapy: Report of the AAPM Task Group 75. Med Phys. 2007;34:4041–63. doi: 10.1118/1.2775667. [DOI] [PubMed] [Google Scholar]
- Mutic S, Esthappan J, Klein E. Peripheral dose distributions for a linear accelerator equipped with a secondary multileaf collimator and universal wedge. J Appl Clin Med Phys. 2002;3:302–9. doi: 10.1120/jacmp.v3i4.2554. [DOI] [PMC free article] [PubMed] [Google Scholar]
- Mutic S, Klein E. A reduction to the AAPM TG-36 reported peripheral dose distributions with tertiary multileaf collimation. Int J Radiat Oncol Biol. 1999;44:947–53. doi: 10.1016/s0360-3016(99)00092-9. [DOI] [PubMed] [Google Scholar]
- Mutic S, Low D. Whole-body dose from tomotherapy delivery. Int J Radiat Oncol Biol Phys. 1998;42:229–32. doi: 10.1016/s0360-3016(98)00199-0. [DOI] [PubMed] [Google Scholar]
- Nagasawa H, Little JB. Unexpected sensitivity to the induction of mutations by very low doses of alpha-particle radiation: evidence for a bystander effect. Radiat Res. 1999;152:552–7. [PubMed] [Google Scholar]
- Nath R, Epp ER, Laughlin JS, Swanson WP, Bond BP. Neutrons from high-energy x-ray medical accelerators: an estimate of risk to the radiotherapy patient. Med Phys. 1984;11:231–41. doi: 10.1118/1.595497. [DOI] [PubMed] [Google Scholar]
- National Cancer Institute. [Accessed March 2007];2005 Guidelines for the Use of Intensity-Modulated Radiation Therapy in Clinical Trials. 2005 Jan; Available at: http://atc.wustl.edu/home/NCI/IMRTNCIGuidelinesv4.0.pdf.
- NCI. SEER Cancer Registries 1979–2000. SEER Pub; 2006. New malignancies among cancer survivors. [Google Scholar]
- NCRP. National Council on Radiation Protection and Measurements Report. 1979. Radiation protection design guidelines for 0.1–100 MeV particle accelerator facilities; p. 51. [Google Scholar]
- NCRP. National Council on Radiation Protection and Measurements Report. 1984. Neutron contamination from medical electron accelerators; p. 79. [Google Scholar]
- NCRP. National Council of Radiation Protection and Measurements Report. 1990. The relative biological effectiveness of radiations of different quality; p. 104. [Google Scholar]
- NCRP. National Council on Radiation Protection and Measurements Report No 116. 1993a. Limitation of exposure to ionizing radiation (Supersedes NCRP Report No 91) [Google Scholar]
- NCRP. National Council on Radiation Protection and Measurements Report No 116. 1993b. Risk estimates for radiation protection. [Google Scholar]
- NCRP. National Council on Radiation Protection and Measurements Report No 115. 2001. Evaluation of the linear-nonthreshold dose–response model for ionizing radiation. [Google Scholar]
- Neglia JP, et al. Second neoplasms after acute lymphoblastic leukemia in childhood. New Engl J Med. 1991;325:1330–6. doi: 10.1056/NEJM199111073251902. [DOI] [PubMed] [Google Scholar]
- Neglia JP, et al. Second malignant neoplasms in five-year survivors of childhood cancer: Childhood Cancer Survivor Study. J Natl Cancer Inst. 2001;93:618–29. doi: 10.1093/jnci/93.8.618. [DOI] [PubMed] [Google Scholar]
- Neglia JP, et al. New primary neoplasms of the central nervous system in survivors of childhood cancer: a report from the Childhood Cancer Survivor Study. J Natl Cancer Inst. 2006;98:1528–37. doi: 10.1093/jnci/djj411. [DOI] [PubMed] [Google Scholar]
- Newton WA, Jr, et al. Bone sarcomas as second malignant neoplasms following childhood cancer. Cancer. 1991;67:193–201. doi: 10.1002/1097-0142(19910101)67:1<193::aid-cncr2820670132>3.0.co;2-b. [DOI] [PubMed] [Google Scholar]
- Olsen JH, et al. Second malignant neoplasms after cancer in childhood or adolescence. Nordic Society of Paediatric Haematology and Oncology Association of the Nordic Cancer Registries. BMJ. 1993;307:1030–6. doi: 10.1136/bmj.307.6911.1030. [DOI] [PMC free article] [PubMed] [Google Scholar]
- Ongaro C, Zanini A, Nastasi U, Rodenas J, Ottaviano G, Manfredotti C. Analysis of photoneutron spectra produced in medical accelerators. Phys Med Biol. 2000;45:L55–61. doi: 10.1088/0031-9155/45/12/101. [DOI] [PubMed] [Google Scholar]
- Paganetti H. Changes in tumor cell response due to prolonged dose delivery times in fractionated radiation therapy. Int J Radiat Oncol Biol Phys. 2005;63:892–900. doi: 10.1016/j.ijrobp.2005.07.953. [DOI] [PubMed] [Google Scholar]
- Paganetti H, Bortfeld T. Proton therapy. In: Schlegel W, Bortfeld T, Grosu AL, editors. New Technologies in Radiation Oncology. Heidelberg: Springer; 2005. pp. 345–63. Series: Medical Radiology; Subseries: Radiation Oncology. [Google Scholar]
- Paganetti H, Bortfeld T, Delaney TF. Neutron dose in proton radiation therapy: in regard to Eric J. Hall Int J Radiat Oncol Biol Phys. 2006;66:1595. doi: 10.1016/j.ijrobp.2006.08.005. [DOI] [PubMed] [Google Scholar]
- Palta JR, Hogstrom KR, Tannanonta C. Neutron leakage measurements from a medical linear accelerator. Med Phys. 1984;11:498–501. doi: 10.1118/1.595543. [DOI] [PubMed] [Google Scholar]
- Pena J, et al. Mote Carlo study of Siemens PRIMUS photoneutron production. Phys Med Biol. 2005;50:5921–33. doi: 10.1088/0031-9155/50/24/011. [DOI] [PubMed] [Google Scholar]
- Perkins JL, et al. Nonmelanoma skin cancer in survivors of childhood and adolescent cancer: a report from the Childhood Cancer Survivor Study. J Clin Oncol. 2005;23:3733–41. doi: 10.1200/JCO.2005.06.237. [DOI] [PubMed] [Google Scholar]
- Petti P, Chuang C, Smith V, Larson D. Peripheral doses in Cyberknife radiosurgery. Med Phys. 2006;33:1770–9. doi: 10.1118/1.2198173. [DOI] [PubMed] [Google Scholar]
- Pierce DA, Preston DL. Radiation-related cancer risks at low doses among atomic bomb survivors. Radiat Res. 2000;154:178–86. doi: 10.1667/0033-7587(2000)154[0178:rrcral]2.0.co;2. [DOI] [PubMed] [Google Scholar]
- Pierce DA, et al. Studies of the mortality of atomic bomb survivors. Radiat Res. 1996;146:1–27. Report 12, Part I, Cancer: 1950–1990. [PubMed] [Google Scholar]
- Pirzkall, et al. The effect of beam energy and number of fields on photon-based IMRT for deep-seated targets. Int J Radiat Oncol Biol Phys. 2002;53:434–42. doi: 10.1016/s0360-3016(02)02750-5. [DOI] [PubMed] [Google Scholar]
- Polf JC, Newhauser WD. Calculations of neutron dose equivalent exposures from range-modulated proton therapy beams. Phys Med Biol. 2005;50:3859–73. doi: 10.1088/0031-9155/50/16/014. [DOI] [PubMed] [Google Scholar]
- Potish RA, et al. The incidence of second neoplasms following megavoltage radiation for pediatric tumors. Cancer. 1985;56:1534–7. doi: 10.1002/1097-0142(19851001)56:7<1534::aid-cncr2820560711>3.0.co;2-o. [DOI] [PubMed] [Google Scholar]
- Preston DL, et al. Studies of mortality of atomic bomb survivors. Radiat Res. 2003;160:381–407. doi: 10.1667/rr3049. Report 13: Solid cancer and noncancer disease mortality: 1950–1997. [DOI] [PubMed] [Google Scholar]
- Preston DL, et al. Effect of recent changes in atomic bomb survivor dosimetry on cancer mortality risk estimates. Radiat Res. 2004;162:377–89. doi: 10.1667/rr3232. [DOI] [PubMed] [Google Scholar]
- Pshenichnov I, Mishustin I, Greiner W. Neutrons from fragmentation of light nuclei in tissue-like media: a study with the GEANT4 toolkit. Phys Med Biol. 2005;50:5493–507. doi: 10.1088/0031-9155/50/23/005. [DOI] [PubMed] [Google Scholar]
- Ramsey CR, et al. Out-of-field dosimetry measurements for a helical tomotherapy system. J Appl Clin Med Phys. 2006;7:1–11. doi: 10.1120/jacmp.v7i3.2212. [DOI] [PMC free article] [PubMed] [Google Scholar]
- Rawlinson JA, Johns HE. A fresh look at radiation leakage levels from high-energy radiation therapy equipment. Med Phys. 1977;4:456–7. doi: 10.1118/1.594335. [DOI] [PubMed] [Google Scholar]
- Reft CS, Runkel-Muller R, Myrainthopoulos L. In vivo and phantom measurements of the secondary photon and neutron doses for prostate patients undergoing 18 MV IMRT. Med Phys. 2006;33:3734–42. doi: 10.1118/1.2349699. [DOI] [PubMed] [Google Scholar]
- Ries LAG, et al. SEER cancer statistics review, 1975–2003. 2006 Available at http://seer.cancer.gov/csr/1975_2003/
- Rijkee AG, Zoetelief J, Raaijmakers CPJ, Van Der Marck SC, Van Der Zee W. Assessment of induction of secondary tumors due to various radiotherapy modalities. Radiat Prot Dosim. 2006;118:219–26. doi: 10.1093/rpd/ncl020. [DOI] [PubMed] [Google Scholar]
- Robertson CM, Hawkins MM, Kingston JE. Late deaths and survival after childhood cancer: implications for cure. BMJ. 1994;309:162–6. doi: 10.1136/bmj.309.6948.162. [DOI] [PMC free article] [PubMed] [Google Scholar]
- Robinson D, Scrimger JW, Field GC, Fallone BG. Shielding considerations for tomotherapy. Med Phys. 2000;27:2380–4. doi: 10.1118/1.1308281. [DOI] [PubMed] [Google Scholar]
- Robison LL, et al. Study design and cohort characteristics of the Childhood Cancer Survivor Study: a multi-institutional collaborative project. Med Pediatr Oncol. 2002;38:229–39. doi: 10.1002/mpo.1316. [DOI] [PubMed] [Google Scholar]
- Rogers DWO, Van Dyk G. Use of a neutron remmeter to measure leakage neutrons from medical electron accelerators. Med Phys. 1981;8:163–6. doi: 10.1118/1.594928. [DOI] [PubMed] [Google Scholar]
- Ron E. Childhood cancer—treatment at a cost. J Natl Cancer Inst. 2006;98:1510–1. doi: 10.1093/jnci/djj437. [DOI] [PubMed] [Google Scholar]
- Ron E, et al. Tumors of the brain and nervous system after radiotherapy in childhood. New Engl J Med. 1988;319:1033–9. doi: 10.1056/NEJM198810203191601. [DOI] [PubMed] [Google Scholar]
- Ron E, et al. Thyroid neoplasia following low-dose radiation in childhood. Radiat Res. 1989;120:516–31. [PubMed] [Google Scholar]
- Ron E, et al. Thyroid cancer after exposure to external radiation: a pooled analysis of seven studies. Radiat Res. 1995;141:259–77. [PubMed] [Google Scholar]
- Ronckers CM, et al. Thyroid cancer in childhood cancer survivors: a detailed evaluation of radiation dose response and its modifiers. Radiat Res. 2006;166:618–28. doi: 10.1667/RR3605.1. [DOI] [PubMed] [Google Scholar]
- Rosso P, et al. Second malignant tumors after elective end of therapy for a first cancer in childhood: a multicenter study in Italy. Int J Cancer. 1994;59:451–6. doi: 10.1002/ijc.2910590402. [DOI] [PubMed] [Google Scholar]
- Roy SC, Sandison GA. Shielding for neutron scattered dose to the fetus in patients treated with 18 MV x-ray beams. Med Phys. 2000;27:1800–3. doi: 10.1118/1.1287438. [DOI] [PubMed] [Google Scholar]
- Roy SC, Sandison GA. Scattered neutron dose equivalent to a fetus from proton therapy of the mother. Radiat Phys Chem. 2004;71:997–8. [Google Scholar]
- Rubino C, et al. Radiation dose and risk of soft tissue and bone sarcoma after breast cancer treatment. Breast Cancer Res Treat. 2005;89:277–88. doi: 10.1007/s10549-004-2472-8. [DOI] [PubMed] [Google Scholar]
- Sachs RK, Brenner DJ. Solid tumor risks after high doses of ionizing radiation. Proc Natl Acad Sci USA. 2005;102:13040–5. doi: 10.1073/pnas.0506648102. [DOI] [PMC free article] [PubMed] [Google Scholar]
- Sadetzki S, et al. Radiation-induced meningioma: a descriptive study of 253 cases. J Neurosurg. 2002;97:1078–82. doi: 10.3171/jns.2002.97.5.1078. [DOI] [PubMed] [Google Scholar]
- Sasaki S, Fukuda N. Dose–response relationship for induction of solid tumors in female B6C3F1 mice irradiated neonatally with a single dose of gamma rays. J Radiat Res (Tokyo) 1999;40:229–41. doi: 10.1269/jrr.40.229. [DOI] [PubMed] [Google Scholar]
- Schardt D, et al. Experimental investigation of secondary fast neutrons produced in carbon ion radiotherapy. Int. Workshop on Fast Neutron Detectors.2006. [Google Scholar]
- Schimmerling W, et al. The fragmentation of 670A MeV neon-20 as a function of depth in water: I. Exp Radiat Res. 1989;120:36–71. [PubMed] [Google Scholar]
- Schneider U. Calcualted risk of fatal secondary malignancies from intensity-modulated radiotherapy: in regard to Kry et al. Int J Radiat Oncol Biol Phys. 2006;64:1290–1. doi: 10.1016/j.ijrobp.2005.10.032. [DOI] [PubMed] [Google Scholar]
- Schneider U, Kaser-Hotz B. Radiation risk estimates after radiotherapy: application of the organ equivalent dose concept to plateau dose–response relationships. Radiat Environ Biophys. 2005;44:235–9. doi: 10.1007/s00411-005-0016-1. [DOI] [PubMed] [Google Scholar]
- Schneider U, Zwahlen D, Ross D, Kaser-Hotz B. Estimation of radiation-induced cancer from three-dimensional dose distributions: concept of organ equivalent dose. Int J Radiat Oncol Biol Phys. 2005;61:1510–5. doi: 10.1016/j.ijrobp.2004.12.040. [DOI] [PubMed] [Google Scholar]
- Schneider U, et al. Secondary neutron dose during proton therapy using spot scanning. Int J Radiat Oncol Biol Phys. 2002;53:244–51. doi: 10.1016/s0360-3016(01)02826-7. [DOI] [PubMed] [Google Scholar]
- Shamisa A, et al. Glioblastoma multiforme occurring in a patient treated with gamma knife surgery. Case report and review of the literature. J Neurosurg. 2001;94:816–21. doi: 10.3171/jns.2001.94.5.0816. [DOI] [PubMed] [Google Scholar]
- Sharma D, et al. Use of peripheral dose data from uniform dynamic multileaf collimation fields to estimate out-of-field organ dose in patients treated employing sliding window intensity modulated radiotherapy. Phys Med Biol. 2006a;51:2987–95. doi: 10.1088/0031-9155/51/11/020. [DOI] [PubMed] [Google Scholar]
- Sharma D, et al. Peripheral dose from uniform dynamic multileaf collimation fields: implications for sliding window intensity-modulated radiotherapy. Br J Radiol. 2006b;79:331–5. doi: 10.1259/bjr/16208090. [DOI] [PubMed] [Google Scholar]
- Shepherd SF, Childs PJ, Graham JD, Warrington AP, Brada M. Whole body doses from linear accelerator-based stereotactic radiotherapy. Int J Radiat Oncol Biol Phys. 1997;38:657–65. doi: 10.1016/s0360-3016(97)89490-4. [DOI] [PubMed] [Google Scholar]
- Sherazi S, Kase KR. Measurements of dose from secondary radiation outside a treatment field: effects of wedges and blocks. Int J Radiat Oncol Biol. 1985;11:2171–6. doi: 10.1016/0360-3016(85)90100-2. [DOI] [PubMed] [Google Scholar]
- Shin M, et al. Malignant transformation of a vestibular schwannoma after gamma knife radiosurgery. Lancet. 2002;360:309–10. doi: 10.1016/S0140-6736(02)09521-1. [DOI] [PubMed] [Google Scholar]
- Shore RE. Issues and epidemiological evidence regarding radiation-induced thyroid cancer. Radiat Res. 1992;131:98–111. [PubMed] [Google Scholar]
- Sigurdson AJ, et al. Primary thyroid cancer after a first tumour in childhood (the Childhood Cancer Survivor Study): a nested case-control study. Lancet. 2005;365:2014–23. doi: 10.1016/S0140-6736(05)66695-0. [DOI] [PubMed] [Google Scholar]
- Simmons NE, Laws ER., Jr Glioma occurrence after sellar irradiation: case report and review. Neurosurgery. 1998;42:172–8. doi: 10.1097/00006123-199801000-00038. [DOI] [PubMed] [Google Scholar]
- Stern R. Peripheral dose from a linear accelerator equipped with multileaf collimation. Med Phys. 1999;26:559–62. doi: 10.1118/1.598557. [DOI] [PubMed] [Google Scholar]
- Stevens G, Downes S, Ralston A. Thyroid dose in children undergoing prophylactic cranial irradiation. Int J Radiat Oncol Biol Phys. 1998;42:385–90. doi: 10.1016/s0360-3016(98)00222-3. [DOI] [PubMed] [Google Scholar]
- Stovall M, Smith SA, Rosenstein M. Tissue doses from radiotherapy of cancer of the uterine cervix. Med Phys. 1989;16:726–33. doi: 10.1118/1.596331. [DOI] [PubMed] [Google Scholar]
- Stovall M, et al. Fetal dose from radiotherapy with photon beams: Report of AAPM Radiation Therapy Committee Task Group No. 36. Med Phys. 1995;22:63–82. doi: 10.1118/1.597525. [DOI] [PubMed] [Google Scholar]
- Stovall M, et al. Genetic effects of radiotherapy for childhood cancer: gonadal dose reconstruction. Int J Radiat Oncol Biol Phys. 2004;60:542–52. doi: 10.1016/j.ijrobp.2004.03.017. [DOI] [PubMed] [Google Scholar]
- Strong LC, et al. Risk of radiation-related subsequent malignant tumors in survivors of Ewing’s sarcoma. J Natl Cancer Inst. 1979;62:1401–6. [PubMed] [Google Scholar]
- Swanson WP. Estimate of the risk in radiation therapy due to unwanted neutrons. Med Phys. 1979;7:141–4. doi: 10.1118/1.594774. [DOI] [PubMed] [Google Scholar]
- Swerdlow AJ, et al. Risk of second malignancy after Hodgkin’s disease in a collaborative British cohort: the relation to age at treatment. J Clin Oncol. 2000;18:498–509. doi: 10.1200/JCO.2000.18.3.498. [DOI] [PubMed] [Google Scholar]
- Tayama R, et al. Measurement of neutron dose distribution for a passive scattering nozzle at the Proton Medical Research Center (PMRC) Nucl Instrum Methods Phys Res A. 2006;564:532–6. [Google Scholar]
- Tochilin E, LaRiviere D. Attenuation of primary and leakage radiation in concrete for x-rays from a 10 MV linear accelerator. Health Phys. 1979;36:387. doi: 10.1097/00004032-197903000-00015. [DOI] [PubMed] [Google Scholar]
- Travis LB, et al. Breast cancer following radiotherapy and chemotherapy among young women with Hodgkin disease. JAMA. 2003;290:465–75. doi: 10.1001/jama.290.4.465. [DOI] [PubMed] [Google Scholar]
- Tubiana M. Dose–effect relationship and estimation of the carcinogenic effects of low doses of ionizing radiation: the joint report of the Academie des Sciences (Paris) and of the Academie Nationale de Medecine. Int J Radiat Oncol Biol Phys. 2005;63:317–9. doi: 10.1016/j.ijrobp.2005.06.013. [DOI] [PubMed] [Google Scholar]
- Tucker MA, et al. Cancer risk following treatment of childhood cancer. In: Boice JD Jr, Fraumeni JF Jr, editors. Radiation Carcinogenesis: Epidemiology and Biological Significance. New York: Raven; 1984. pp. 211–24. [Google Scholar]
- Tucker MA, et al. Bone sarcomas linked to radiotherapy and chemotherapy in children. New Engl J Med. 1987;317:588–93. doi: 10.1056/NEJM198709033171002. [DOI] [PubMed] [Google Scholar]
- Tucker MA, et al. Therapeutic radiation at a young age is linked to secondary thyroid cancer. The Late Effects Study Group. Cancer Res. 1991;51:2885–8. [PubMed] [Google Scholar]
- Ueno AM, et al. A low, adaptive dose of gamma-rays reduced the number and altered the spectrum of S1-mutants in human–hamster hybrid AL cells. Mutat Res. 1996;358:161–9. doi: 10.1016/s0027-5107(96)00117-0. [DOI] [PubMed] [Google Scholar]
- Ullrich RL. Effects of split doses of x-rays or neutrons on lung tumor formation in RFM mice. Radiat Res. 1980;83:138–45. [PubMed] [Google Scholar]
- Ullrich RL, Davis CM. Radiation-induced cytogenetic instability in vivo. Radiat Res. 1999;152:170–3. [PubMed] [Google Scholar]
- Ullrich RL, et al. Radiation carcinogenesis: time–dose relationships. Radiat Res. 1987;111:179–84. [PubMed] [Google Scholar]
- Upton AC. Radiation hormesis: data and interpretations. Crit Rev Toxicol. 2001;31:681–95. doi: 10.1080/20014091111956. [DOI] [PubMed] [Google Scholar]
- USCSG. Suggested State Regulations for the Control of Radiation. 1978. p. F45. [Google Scholar]
- Uwamino Y, Nakamura T, Ohkubo T, Hara A. Measurement and calculation of neutron leakage from a medical electron accelerator. Med Phys. 1986;13:374–84. doi: 10.1118/1.595879. [DOI] [PubMed] [Google Scholar]
- van der Giessen PH. Calculation and measurement of the dose at points outside the primary beam for photon energies of 6,10, and 23 MeV. Int J Radiat Oncol Biol Phys. 1994;30:1239–46. doi: 10.1016/0360-3016(94)90335-2. [DOI] [PubMed] [Google Scholar]
- van der Giessen PH. Collimator-related radiation dose for different cobalt machines and linear accelerators. Int J Radiat Oncol Biol Phys. 1996a;35:399–405. doi: 10.1016/0360-3016(96)00083-1. [DOI] [PubMed] [Google Scholar]
- van der Giessen PH. A simple and generally applicable method to estimate the peripheral dose in radiation teletherapy with high energy x-rays or gamma radiation. Int J Radiat Oncol Biol Phys. 1996b;35:1059–68. doi: 10.1016/0360-3016(96)00254-4. [DOI] [PubMed] [Google Scholar]
- van der Giessen PH. Measurement of the peripheral dose for the tangential breast treatment technique with Co-60 gamma radiation and high energy x-rays. Radiother Oncol. 1997;42:257–64. doi: 10.1016/s0167-8140(96)01884-1. [DOI] [PubMed] [Google Scholar]
- van der Giessen PH, Bierhuizen WJ. Comparison of measured and calculated peripheral doses in patients undergoing radiation therapy. Radiother Oncol. 1997;42:265–70. doi: 10.1016/s0167-8140(96)01885-3. [DOI] [PubMed] [Google Scholar]
- van der Giessen PH, Hurkmans CW. Calculation and measurement of the dose to points outside the primary beam for Co-60 gamma radiation. Int J Radiat Oncol Biol Phys. 1993;27:717–24. doi: 10.1016/0360-3016(93)90401-g. [DOI] [PubMed] [Google Scholar]
- Vanhavere F, Huyskens D, Struelens L. Peripheral neutron and gamma doses in radiotherapy with an 18 MV linear accelerator. Radiat Prot Dosim. 2004;110:607–12. doi: 10.1093/rpd/nch135. [DOI] [PubMed] [Google Scholar]
- Van Leeuwen FE, et al. Role of radiotherapy and chemotherapy in the risk of second malignant neoplasms after cancer in childhood. Br J Cancer. 2005;56:792–6. doi: 10.1038/bjc.1989.165. [DOI] [PMC free article] [PubMed] [Google Scholar]
- Verellen D, Vanhavere F. Risk assessment of radiation-induced malignancies based on whole-body equivalent dose estimates for IMRT treatment in the head and neck region. Med Phys. 1999;53:199–203. doi: 10.1016/s0167-8140(99)00079-1. [DOI] [PubMed] [Google Scholar]
- Waddington SP, McKenzie AL. Assessment of effective dose from concomitant exposures required in verification of the target volume in radiotherapy. Br J Radiol. 2004;77:557–61. doi: 10.1259/bjr/67235257. [DOI] [PubMed] [Google Scholar]
- Wang B, Xu XG. Radiat Prot Dosim. 2007. Measurements of non-target organ doses using MOSFET dosemeters for selected IMRT and 3DCRT radiation treatment procedures. (Advanced Access, 1–7) [DOI] [PubMed] [Google Scholar]
- Wang B, Xu XG, Kim CH. A Monte Carlo CT model of the Rando phantom. Am Nucl Soc Trans. 2004;90:473–4. [Google Scholar]
- Webb S. Intensity Modulated Radiation Therapy. Bristol: Institute of Physics Publishing; 2000. [Google Scholar]
- Webb S. Contemporary IMRT—Developing Physics and Clinical Implementation. Bristol: Institute of Physics Publishing; 2004. [Google Scholar]
- Weiss HA, Darby SC, Doll R. Cancer mortality following x-ray treatment for nkylosing spondylitis. Int J Cancer. 1994;59:327–38. doi: 10.1002/ijc.2910590307. [DOI] [PubMed] [Google Scholar]
- White RG, et al. Bone sarcoma characteristics and distribution in beagles fed strontium-90. Radiat Res. 1993;136:178–89. [PubMed] [Google Scholar]
- Wilenzick RM, Almond PR, Oliver GD, de Almeida CE. Measurement of fast neutrons produced by high-energy x-ray beams of medical electron accelerators. Phys Med Biol. 1973;18:396–408. doi: 10.1088/0031-9155/18/3/005. [DOI] [PubMed] [Google Scholar]
- Wolff S. The adaptive response in radiobiology: evolving insights and implications. Environ Health Perspect. 1998;106:277–83. doi: 10.1289/ehp.98106s1277. [DOI] [PMC free article] [PubMed] [Google Scholar]
- Wood DH. Long-term mortality and cancer risk in irradiated rhesus monkeys. Radiat Res. 1991;126:132–40. [PubMed] [Google Scholar]
- Wroe A, Rosenfeld A, Schulte R. Out-of-field dose equivalents delivered by proton therapy of prostate cancer. Med Phys. 2007;34:3449–56. doi: 10.1118/1.2759839. [DOI] [PubMed] [Google Scholar]
- Xu XG, Bednarz B, Wang B. Measured and simulated organ doses for IMRT and 3DCRT. Trans Am Nucl Soc. 2006;95:613–4. [Google Scholar]
- Xu XG, Chao TC, Bozkurt A. VIP-MAN: an image-based whole-body adult male model constructed from color photographs of the visible human project for multi-particle Monte Carlo calculations. Heath Phys. 2000;78:476–86. doi: 10.1097/00004032-200005000-00003. [DOI] [PubMed] [Google Scholar]
- Xu XG, Taranenko V, Zhang J, Shi C. A boundary-representation method for designing whole-body radiation dosimetry models: pregnant females representing three gestational periods-RPI-P3, -P6 and -P9. Phys Med Biol. 2007;52:7023–44. doi: 10.1088/0031-9155/52/23/017. [DOI] [PubMed] [Google Scholar]
- Xu XG, Zhang JY, Na YH. Preliminary data for mesh-based deformable phantom development: is it possible to design person-specific phantoms on-demand. Int. Conf. on Radiation Shielding-11; 14–17 April 2008.2008. [Google Scholar]
- Yan X, et al. Measurement of neutron dose equivalent to proton therapy patients outside of the proton radiation field. Nucl Instrum Methods Phys Res A. 2002;476:429–34. [Google Scholar]
- Yu JS, et al. Glioblastoma induction after radiosurgery for meningioma. Lancet. 2000;356:1576–7. doi: 10.1016/S0140-6736(00)03134-2. [DOI] [PubMed] [Google Scholar]
- Zacharatou-Jarlskog C, Jiang H, Lee C, Bolch WE, Xu XG, Paganetti H. Monte Carlo simulations using whole-body pediatric and adult phantoms as virtual patients to assess secondary organ doses in proton radiation therapy. Med Phys. 2006;33:2123. [Google Scholar]
- Zacharatou-Jarlskog C, Lee C, Bolch W, Xu XG, Paganetti H. Assessment of organ specific neutron equivalent doses in proton therapy using whole-body age-dependent voxel phantoms. Phys Med Biol. 2008;53:693–717. doi: 10.1088/0031-9155/53/3/012. [DOI] [PMC free article] [PubMed] [Google Scholar]
- Zaidi H, Xu XG. Computational anthropomorphic models of the human anatomy: the path to realistic Monte Carlo modeling in radiological sciences. Ann Rev Biomed Eng. 2007;9:471–500. doi: 10.1146/annurev.bioeng.9.060906.151934. [DOI] [PubMed] [Google Scholar]
- Zanini A, et al. Monte Carlo simulation of the photoneutron field in linac radiotherapy treatments with different collimation systems. Phys Med Biol. 2004;49:571–82. doi: 10.1088/0031-9155/49/4/008. [DOI] [PubMed] [Google Scholar]
- Zheng Y, Newhauser W, Fontenot J, Taddei P, Mohan R. Monte Carlo study of neutron dose equivalent during passive scattering proton therapy. Phys Med Biol. 2007;52:4481–96. doi: 10.1088/0031-9155/52/15/008. [DOI] [PubMed] [Google Scholar]