

Abstract
The proteome expanding effects of alternative pre-mRNA splicing have had a profound impact on eukaryotic evolution. The events that create this diversity can be placed into four major classes: exon skipping, intron retention, alternative 5′ splice sites, and alternative 3′ splice sites. Although the regulatory mechanisms and evolutionary pressures among alternative splicing classes clearly differ, how these differences affect the evolution of splicing regulation remains poorly characterized. We used RNA-seq to investigate splicing differences in D. simulans, D. sechellia, and three strains of D. melanogaster. Regulation of exon skipping and tandem alternative 3′ splice sites (NAGNAGs) were more divergent than other splicing classes. Splicing regulation was most divergent in frame-preserving events and events in noncoding regions. We further determined the contributions of cis- and trans-acting changes in splicing regulatory networks by comparing allele-specific splicing in F1 interspecific hybrids, because differences in allele-specific splicing reflect changes in cis-regulatory element activity. We find that species-specific differences in intron retention and alternative splice site usage are primarily attributable to changes in cis-regulatory elements (median ∼80% cis), whereas species-specific exon skipping differences are driven by both cis- and trans-regulatory divergence (median ∼50% cis). These results help define the mechanisms and constraints that influence splicing regulatory evolution and show that networks regulating the four major classes of alternative splicing diverge through different genetic mechanisms. We propose a model in which differences in regulatory network architecture among classes of alternative splicing affect the evolution of splicing regulation.
Alternative pre-mRNA splicing is a central process in eukaryotic gene expression. The combination of exon sequences from single genomic loci into multiple isoforms greatly expands the proteome, magnifying the diversity of functional gene products from a comparably smaller number of genes (Nilsen and Graveley 2010). Alternative splicing is regulated through complex networks comprised of cis-regulatory sequence elements and trans-acting factors (Wang and Burge 2008). Three sequence elements interact directly with components of the spliceosome and are required for splicing of each intron: the 5′ splice site, the branchpoint, and the 3′ splice site. The sequences of these elements can modulate their “strength”—the probability that they will be recognized by the spliceosome. Additional elements in both introns and exons can act as splicing enhancers or silencers. Two families of trans-acting regulatory proteins, hnRNP and SR proteins, which generally repress and enhance interactions with the core spliceosome, respectively, recognize splicing enhancers and silencers.
Four major classes of alternative splicing events can be broadly defined: exon skipping (SE), intron retention (RI), alternative 5′ splice sites (A5SS), and alternative 3′ splice sites (A3SS) (Fig. 1B). Comparative genomic analyses suggest significant differences in the regulation and evolution of splicing classes. Compared with constitutive exons, skipped exons tend to have weaker splice sites and higher sequence conservation (Clark and Thanaraj 2002; Koren et al. 2007; Merkin et al. 2012), which may reflect selective pressure to maintain the binding sites of splicing regulatory proteins. In contrast, intron retention appears to be largely dependent on intron length and cis-regulatory sequence elements recognized directly by the spliceosome (Sakabe and de Souza 2007). Alternative 5′ and 3′ splice sites appear to originate via mutations in ancestral constitutive exons, creating new splice sites that compete with the original sites (Koren et al. 2007). Perhaps the simplest examples of this involve tandem alternative 3′ sites, a specific subclass of A3SS events separated by a single NAG (commonly referred to as “NAGNAGs”). Gains and losses of NAGNAG sites have accelerated protein evolution (Bradley et al. 2012). The relative strength of alternative 5′ and 3′ splice sites is correlated with their usage, however, only when the competing sites are in close proximity (Chasin 2007). Surprisingly, splicing regulatory sequences can modulate alternative 5′ splice site usage through direct interaction with the spliceosome, bypassing the need for trans-acting protein factors (Yu et al. 2008).
Figure 1.

Comparing splicing regulation among Drosophila species. (A) Comparison of divergence times for strains and species used. (B) The four major classes of alternative splicing. Constitutive and alternative exonic regions are depicted in blue and pink, respectively. (C) Example of cross-species comparison of intron retention using RNA-seq. (Top) IGV Genome Browser tracks depict differences in read coverage within the retained intron in each strain and species. The Fit1 intron is more frequently retained in all strains of D. melanogaster, compared with D. simulans and D. sechellia. (Bottom) RT-PCR using primers spanning the retained intron correlates with RNA-seq estimates of divergent splicing.
Species-specific differences in exon skipping are common and imply that splicing regulatory divergence could contribute to phenotypic variation. Early work revealed that ∼7%–10% of exon skipping events were differentially regulated in human and chimpanzee liver and brain samples (Calarco et al. 2007; Blekhman et al. 2010; Lin et al. 2010). More recently, extensive comparisons in multiple tissues from numerous vertebrate species showed that exon skipping is diverging more rapidly than transcript abundance (Barbosa-Morais et al. 2012; Merkin et al. 2012). Divergent exon skipping was more frequent in transcripts encoding RNA-binding proteins (Barbosa-Morais et al. 2012) and in protein domains targeted for phosphorylation (Merkin et al. 2012). Together these studies demonstrate considerable divergence of exon skipping. In comparison, the extent of divergence in other alternative splicing classes remains poorly characterized. The genetic mechanisms of splicing regulatory evolution are also unclear.
Comparative studies of C. elegans strains point toward cis-acting variants as the main contributors to divergent exon skipping. Although both cis- and trans-acting differences can affect strain-specific exon skipping (Barberan-Soler and Zahler 2008), 77% of strain-specific alternative splicing quantitative trait loci appear to act locally, which suggests changes in cis-regulatory elements (Li et al. 2010). Similarly, Lin et al. (2010) found that divergent exon skipping events in humans and chimpanzees were associated with increased sequence divergence, suggesting that changes in cis-regulatory elements could be responsible for divergent splicing. However, divergent exon skipping in humans and chimpanzees was not associated with changes in splice site strength or density of exonic splicing regulatory elements (Irimia et al. 2009). More recently, the splicing patterns of 13 human exons were examined in a transgenic mouse, revealing that cis-regulatory changes contributed significantly to interspecies differences in exon skipping (Barbosa-Morais et al. 2012). A similar survey from Drosophila F1 hybrid head tissue reported 65 genes showing cis-acting differences in alternative isoform expression (Graze et al. 2012)
Results from other studies suggest that changes in the activity or abundance of trans-acting factors may contribute to divergent splicing. The expression levels of splicing regulatory proteins vary between species, suggesting trans-acting network changes (Grosso et al. 2008). In addition, the SR and hnRNP families of splicing regulatory proteins have evolved through numerous duplication and divergence events, highlighting the potential for trans-regulatory changes in splicing regulatory networks (Busch and Hertel 2011). For example, the testes-specific splicing regulator LS2 evolved from duplication of the constitutive splicing factor U2AF50 in Drosophila. The targets of LS2 have diverged substantially from those of U2AF50, leading to its current function as a splicing repressor (Taliaferro et al. 2011). Thus, changes in trans-acting factor abundance, activity, or specificity could be an important source of splicing regulatory evolution. As a result, the relative contributions of cis- and trans-regulatory changes toward divergence of alternative splicing remain uncertain. Furthermore, differences in the regulatory networks controlling the four classes of alternative splicing could affect the evolution of splicing regulation.
Here we used RNA-seq to compare alternative splicing in multiple D. melanogaster strains and one strain each of its closest phylogenetic relatives, D. sechellia and D. simulans. This choice of species allows us to sample a divergence time that is intermediate between that of previous studies investigating strains of C. elegans (Li et al. 2010) and vertebrate species (Barbosa-Morais et al. 2012; Merkin et al. 2012). Divergence of alternative splicing increases over evolutionary time, from ∼5% among D. melanogaster strains to ∼10% between species. Regulation of alternative splicing events in protein-coding regions was roughly half as likely to be divergent compared with noncoding regions. Of the coding region events that do exhibit divergent splicing, frame-shifting splicing events were half as likely to be divergent. Although skipped exons are known to have highly conserved sequences, we found that they are the most likely class of events to have interspecific differences in regulation. Alternative 3′ splice sites were also highly divergent, due mostly to divergence of NAGNAG tandem acceptor sites. Species-specific differences in splice site strength influenced divergent regulation at A3SS, much more than other classes of alternative splicing.
To estimate the relative effects of cis- and trans-acting regulatory changes in alternative splicing, we further compared allele-specific alternative splicing in hybrids of these species. In F1 hybrids, pre-mRNA from both parental alleles are subject to the same regulatory environments, thus observed differences in allele-specific splicing reflect cis-regulatory divergence. We used this approach previously to dissect cis- and trans-regulatory changes in mRNA abundance (McManus et al. 2010a). By applying this to alternative splicing, we find that divergent regulation of intron retention and alternative splice sites has occurred almost exclusively through changes in cis-acting sequences, while divergence of exon skipping results from both cis and trans-acting regulatory changes. Intriguingly, exon skipping is the most dynamic class of alternative splicing throughout D. melanogaster development, suggesting that this class of alternative splicing may have more trans-regulatory factors than intron retention and alternative splice sites. Taken together, our results support a model in which differences in regulatory network architecture among alternative splicing classes affect the evolution of splicing regulation.
Results
Comparing alternative splicing among closely related Drosophila species
We used paired-end RNA-seq to compare alternative splicing in 2- to 10-d-old adult female flies from three closely related Drosophila species: D. melanogaster, D. sechellia, and D. simulans. We also measured alternative splicing in three strains of D. melanogaster—the original genome project strain (Celniker et al. 2002), the cosmopolitan strain zhr (Sawamura et al. 1993), and the African-type strain z30 (Wu 1995)—to compare inter- and intra-specific splicing divergence (Fig. 1A). The publicly available genome assemblies of these species are of vastly different quality. The genomes of D. melanogaster, D. sechellia, and D. simulans were originally sequenced to ∼12-, five-, and threefold coverage, respectively (Drosophila 12 Genomes Consortium 2007). In addition, the strains used in our study likely differ from the reference genome to various extents. Differences in genome quality could complicate comparisons of alternative splicing. To avoid these complications, we resequenced the genomes of the strains (Coolon et al. 2012) and species used in this study to an average of 26-fold coverage. This further increased the size of the D. sechellia and D. simulans assemblies by 1.6 and 12.6 Mbp, respectively, and corrected, on average, 806,805 SNPs and indels per strain (Supplemental Table S1), improving our ability to map RNA-seq reads from each sample. Paired-end cDNA sequencing resulted in an average of 18.9 million read pairs from each sample, with ∼3.2 million reads per sample aligning uniquely to exon-junction databases (Supplemental Table S2).
We used exon-junction reads to determine splicing differences for the four major types of alternative splicing: skipped exons (SE), retained introns (RI), alternative 5′ splice sites (A5SS), and alternative 3′ splice sites (A3SS) (Fig. 1B). These events were extracted from the D. melanogaster transcriptome annotation generated from the modENCODE developmental time course analysis (Graveley et al. 2011). A minimum threshold of 20 exon-junction reads per splicing event in all samples allowed comparisons of 193 SE, 772 RI, 71 A5SS, and 559 A3SS events. The “percent spliced in” (PSI) metric was calculated for splicing events from each sample, and Fisher’s exact tests were used to identify significant pairwise differences between PSI values (ΔPSI ≥ 10%; FDR ≤ 5%) (Wang et al. 2008). The validity of the RNA-seq splicing analysis pipeline was confirmed using semiquantitative RT-PCR (Fig. 1C) for six SE and four RI events. In both cases, the RNA-seq and RT-PCR PSI values agreed (Supplemental Fig. S1; R2 = 0.84, N = 50).
Because we generated sequence data from species with multiple divergence times, our data set allows us to compare changes in splicing regulation with evolutionary divergence. D. melanogaster is estimated to have last shared a common ancestor with D. simulans and D. sechellia ∼2.5 million yr ago (Cutter 2008), D. simulans and D. sechellia are thought to have diverged 0.25 million yr ago (Garrigan et al. 2012), and the North American and African D. melanogaster strains we used shared common ancestors ∼10,000 yr ago (David and Capy 1988; Lachaise et al. 1988). Splicing regulatory divergence was highly correlated with sequence divergence (Pearson’s R2 = 0.94; Supplemental Fig. S2). This correlation between the frequency of splicing divergence and divergence time was significant over all events (P = 0.029). Separating the splicing events by type (Supplemental Table S3) indicated that this correlation was strongest for SE (R2 = 0.90; P < 0.05) and A3SS events (R2 = 0.93, P = 035), was comparatively weaker for RI (R2 = 0.77; P < 0.13), and not significant for A5SS events (R2 = 0.5; P < 0.29). These data support the conclusion that alternative splicing regulatory divergence increases with divergence time.
Since many alternative splicing events are tissue specific, interspecies differences in relative tissue abundance could result in inaccurate inferences of divergent splicing regulation. To investigate this potential caveat, we looked for enrichment of genes with tissue-specific functions using gene ontology analysis (GO). Of the splicing events analyzed, genes exhibiting divergent splicing were not enriched for any GO categories. To further examine possible links between tissue abundance and splicing divergence, we asked whether genes with divergent splicing were enriched in species differences in mRNA abundance, calculated as described previously (McManus et al. 2010a). In all comparisons, divergently spliced genes were no more likely to be divergently expressed than genes with conserved splicing (Supplemental Table S4). Thus, differences in tissue-specific expression do not appear to impact our analyses of alternative splicing divergence.
Differences in splicing regulatory divergence among classes of alternative splicing
There are several differences in the regulatory divergence of the four classes of alternative splicing. SE events differed the most both among and between species, with 5.4% to 12.6% of these events showing divergent alternative splicing. SE events were 1.8–2.2-fold more likely to be divergent than other alternative splicing types in most intra- and interspecific comparisons (FET; P < 0.04) (Fig. 2A). NAGNAGs were also particularly divergent (Fig. 2B). Up to 23% of NAGNAG sites had divergent regulation. In fact, NAGNAGs are two to three times more likely to be divergent than non-NAGNAG A3SS events (FET; P = 0.021 D. mel vs. D. sec; P = 0.002 D. mel vs. D. sim). Thus, exon skipping and tandem alternative 3′ splice sites are the most divergent subgroups of alternative splicing.
Figure 2.

Rates of splicing regulatory divergence among classes of alternative splicing. The percentage of all testable splicing events from each comparison is shown. (A) Regulation of skipped exons is diverging more rapidly than that of other splicing classes, while A3SS also show frequent divergence in the most distant comparisons. (B) Tandem A3SS (NAGNAG) are extremely divergent, compared to other A3SS.
Alternative splicing can alter mRNA sequence both in protein-coding and noncoding regions. Consequently, divergent splicing regulation can affect either the sequence of the resulting protein or regulatory regions. We compared the relative frequency of divergent splicing in coding and noncoding regions. Considering all classes of alternative splicing, events located in noncoding regions were more likely to be divergent than coding region events (Table 1). This enrichment of regulatory divergence in noncoding regions was significant for D. melanogaster/D. sechellia comparisons (2.05-fold enrichment, FET P < 7.8 × 10⁻⁵), but not for other interspecific comparisons. However, increased divergence of events in noncoding regions may be partially masked by the highly divergent NAGNAGs as ∼90% of NAGNAGs are located in coding regions. After excluding NAGNAG events, enriched divergence in noncoding regions was even more apparent (1.5- to 2.4-fold) (Table 1).
Table 1.
Distribution of divergent splicing events in coding and noncoding regions
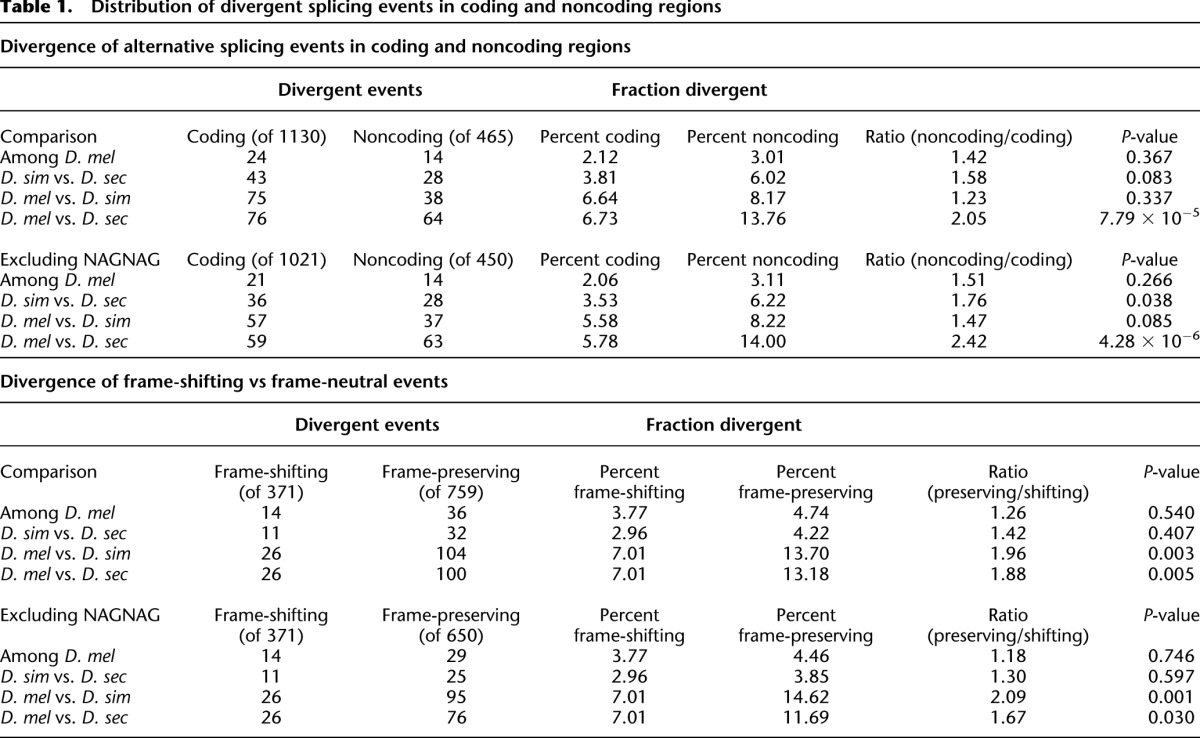
In protein-coding regions, alternative splicing can either maintain the phase of the open reading frame, or more drastically affect the ORF by shifting the reading frame. Due to their less extreme effects on protein-coding sequences, we reasoned that regulation of frame-preserving splicing events would be more divergent between species. Indeed, frame-preserving events were roughly twice as likely to be divergent when compared with frame-shifting events (Table 1) (FET; P < 0.003). This enriched divergence of frame-preserving events is seen even when NAGNAG events are excluded (P = 0.023) (Table 1). These results show that regulation of alternative splicing diverges more rapidly in noncoding regions than in coding regions and (within coding regions) in frame-preserving events than in frame-shifting events.
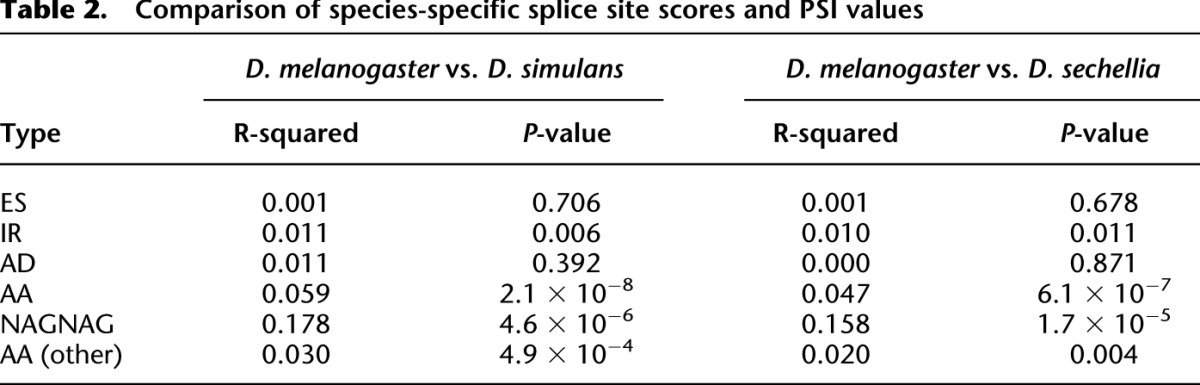
Sequences flanking splice sites play an important role in alternative splicing by affecting splice site strength. For example, the difference in strength at proximal and distal NAGNAG splice sites is correlated with their relative usage (Bradley et al. 2012). Likewise, the combined strengths of the 5′ and 3′ splice sites of skipped exons correlates with their inclusion levels (Baek and Green 2005; Shepard et al. 2011). To investigate the relationship between splice site strength and alternative splicing in our data set, we retrained the MaxEntScan scoring system (Yeo and Burge 2004) using D. melanogaster splice site sequences and calculated maximum entropy scores for each species and strain. As expected, we found correlations in splice site strength and relative usage of alternative 5′ and 3′ splice sites (R2 = 0.373; R2 = 0.404; P < 10−16). Similarly, the combined strength of donor and acceptor sites was correlated with exon skipping and intron retention (R2 = 0.105; R2 = 0.291; P < 10−16). These results show that splice site strength is an important determinant of A5SS, A3SS, and RI alternative splicing levels in Drosophila, with less influence over SE events.
The correlation between splice site strengths and PSI values suggests that mutations affecting site strength might contribute to splicing regulatory evolution. To directly investigate this possibility, we compared differences in splice site strength with differences in PSI for D. melanogaster, D. simulans, and D. sechellia. Weak significant correlations were seen between species-specific differences in splice site strength and splicing inclusion for A3SS and RI events, but not for SE and A5SS events (Table 2). Compared to other alternative splicing types, NAGNAG events showed the highest correlation of change in site strength with change in splicing regulation (R2 = 0.16–0.18; P < 10−4) (Table 2). Thus, mutations affecting splice site strength contribute to divergent regulation of tandem 3′ splice sites, and have little to no affect on RI, A5SS, and SE regulation.
Table 2.
Comparison of species-specific splice site scores and PSI values
Cis- and trans-regulatory differences underlying divergent alternative splicing
After identifying interspecific differences in alternative splicing, we next addressed the relative contributions of cis- and trans-acting differences in splicing regulation using interspecies F1 hybrids. In F1 hybrid nuclei, pre-mRNAs from both parental alleles are exposed to the same trans-regulatory environment. This normalization of trans-acting factors means that allele-specific splicing differences in hybrids reflect differences in pre-mRNA cis-regulatory elements. Trans-acting contributions can then be inferred by comparison of interspecific differences with allele-specific differences in the hybrid (Wittkopp et al. 2004). We compared allele-specific alternative splicing levels in two F1 hybrids, resulting from crosses of D. melanogaster with D. sechellia, and D. simulans, respectively, to determine the contributions of cis- and trans-acting regulatory differences to divergent alternative splicing. Paired-end sequencing of RNA isolated from adult females resulted in 49.8 million read-pairs from the D. simulans × D. melanogaster hybrids and 54.1 million read-pairs from the D. sechellia × D. melanogaster hybrids. Similar transcriptome coverage was obtained from mixed-control cDNA libraries prepared from a mixture of equal concentrations of total mRNA from each parent (Supplemental Table S2). Sequence reads were aligned to genomes and splice-junction databases from each parental species to identify allele-specific reads that mapped uniquely to a single species without mismatches (McManus et al. 2010a). Paired-end sequencing of D. melanogaster/D. simulans F1 hybrids resulted in an effective read-length of 152 bp, thereby allowing identification of allele specificity for ∼73% of genomic and 82% of splice-junction reads. Data from D. melanogaster × D. sechellia hybrids included published 2 × 37-bp read pairs (McManus et al. 2010a), resulting in a somewhat lower fraction of allele-specific read assignments (Supplemental Table S2).
Bioinformatic analyses can introduce errors in assigning reads to alleles (Degner et al. 2009), largely due to alignment bias in favor of alleles that more closely match a reference genome. Aligning reads to allele-specific genomes, as was done for this study, alleviates most of these errors (Stevenson et al. 2013). We used two approaches to assess the performance of our allele-specific splicing analysis pipeline. First, we used allele-specific RT-PCR (McManus et al. 2010b) to measure ΔPSI values from separate species and F1 hybrids for seven RI and eight SE events. Allele-specific ΔPSI values measured via RT-PCR were consistent with RNA-seq measurements (R2 = 0.70; N = 60; Supplemental Fig. S3). As a second approach to assess our allele-specific analysis pipeline, we compared PSI estimates from separate species mRNA libraries with allele-specific PSI values from libraries made by mixing equal amounts of two species mRNA (“mix-control”). PSI values from separate species samples correlate quite well with allele-specific PSIs from the mix-control libraries (average R2 = 0.94; Supplemental Table S5). However, ΔPSI values between species were less well-correlated (average R2 = 0.48; Supplemental Table S5). To avoid potential errors, we focused on “well-behaved” splicing events—events for which separate and allele-specific ΔPSI values varied by <10%. This subset includes ∼70% of the alternative splicing events used in interspecific comparisons. Together, these results indicate that our bioinformatic analysis of allele-specific alternative splicing performs well.
We compared D. melanogaster to D. simulans and D. sechellia to determine the number of alternative splicing events with cis- and trans-regulatory differences. Example cis- and trans-acting differences in alternative splicing are shown in Figure 3. Of the 983 well-behaved splicing events in the D. melanogaster/D. simulans comparison, 64 had divergent regulation, 36 exhibited cis-, and 10 had trans-regulatory divergence (FDR = 0.05). The higher frequency of cis-regulatory (compared to trans-regulatory) differences was also seen in the D. melanogaster/D. sechellia comparison. Of 681 well-behaved splicing events, 32 were divergently regulated, and 19 and three events exhibited cis- and trans-regulatory divergence, respectively (FDR = 0.05). Thus, more alternative splicing events are affected by divergence in cis-regulatory elements than in trans-acting factors.
Figure 3.
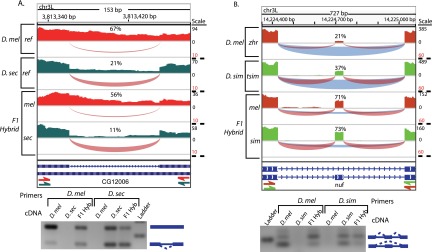
Cis- and trans-acting differences in alternative splicing. IGV Genome Browser images show RNA-seq read coverage, depicted in a bar graph (above). Arcs depict splice-junction read coverage (per million mapped junction reads). The width of each arc represents the relative number of junction reads. For exon skipping, exclusion junctions are shown in blue and inclusion junctions are shown in red. The percent spliced in (PSI) for each sample is shown above the alternative event. Gel images show the results of RT-PCR experiments using species-specific primers. (A) An intron in CG12006 is retained much more frequently in D. melanogaster than in D. sechellia. In F1 hybrids, allele-specific splicing differences show that the divergence is predominantly cis-acting. (B) An exon in nuf is skipped more frequently in D. melanogaster than in D. simulans. Allele-specific RNA-seq from F1 hybrids shows equal inclusion levels, suggesting that divergence in nuf splicing is predominantly trans-acting.
Differences in regulatory network structure among the four major types of alternative splicing could impact the evolution of splicing regulation. To examine this, we determined the relative frequency of cis- and trans-acting regulatory changes in each splicing class. While cis-regulatory changes were most prevalent among RI, A5SS, and A3SS events, many SE events exhibited trans-regulatory changes (Fig. 4A; Table 3). However, the existence of trans-regulatory differences does not, in and of itself, reflect the relative contribution of trans-regulatory divergence. To more directly evaluate the contributions of cis- and trans-regulatory changes on divergent splicing, we compared the fraction of divergent splicing attributable to cis-regulatory differences (% cis) (Wittkopp et al. 2008) among splicing classes. As shown in Figure 4B, SE events had significantly lower % cis than other splicing classes, indicating that cis-regulatory changes contribute less to exon skipping divergence than to other classes of alternative splicing.
Figure 4.

Exon skipping divergence is influenced more by differences in trans-acting factors than other classes of alternative splicing. (A) Percentage of alternative splicing events affected by cis- and trans-acting regulatory divergence for two F1 hybrid crosses. Skipped exons (SE) have many more events affected by trans-regulatory divergence. (B) Relative contribution of cis-regulatory divergence in divergent alternative splicing. The fraction of species-specific splicing differences attributable to cis-acting changes (% cis) is plotted for four classes of alternative splicing. Exon skipping has a much lower contribution from cis-acting changes, reflecting a higher contribution of trans-regulatory divergence. P-values indicate the results of Wilcoxon rank sum tests comparing the mean % cis of different alternative splicing types.
Table 3.
Relative contributions of cis- and trans-regulatory changes to divergent alternative splicing
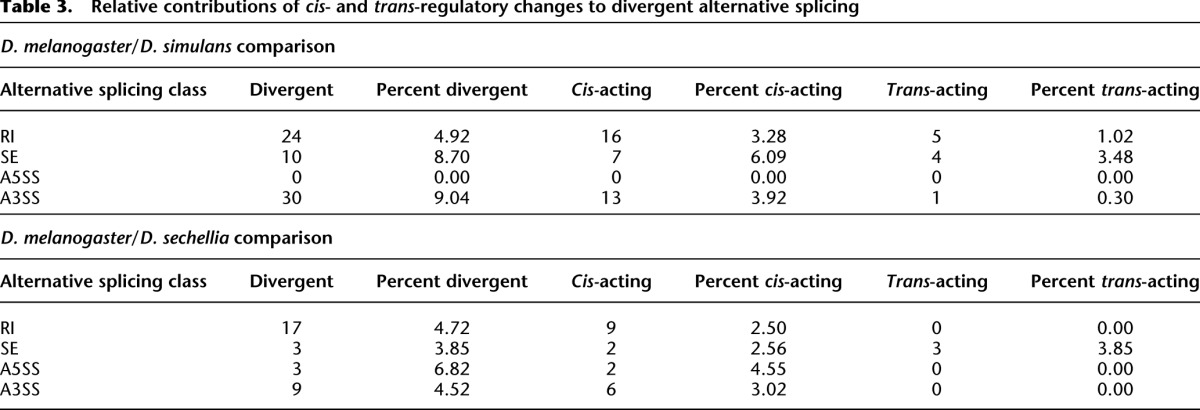
The importance of splice site strength for A3SS NAGNAG events could make them more susceptible to cis-regulatory divergence. We found that NAGNAG events were 3.7-fold and 7.4-fold more likely to diverge through cis-regulatory changes than non-NAGNAG events when comparing splicing in D. melanogaster with D. simulans and D. sechellia, respectively (P < 0.026, FET). For the eight cis-divergent NAGNAG events, five have mutations in the NAGNAG site that alter one of the two AGs in one or more species. Another site has a CAGCAG to AAGCAG mutation. CAG is a better match to 3′ end consensus sequences than AAG (Mount et al. 1992), suggesting that this mutation shifts the balance in splice site strength. The remaining two NAGNAG events with cis-regulatory divergence preserve the NAGNAG sequence, but have multiple mutations in the upstream intron sequence. Thus, NAGNAG sites are indeed hotspots for cis-regulatory changes, and most of the mutations responsible alter the NAGNAG sequence itself.
Discussion
Here we used RNA-seq to analyze the rate and mechanisms of alternative splicing regulatory evolution in Drosophila. While prior studies used this approach to examine the evolution of exon skipping (Barbosa-Morais et al. 2012; Merkin et al. 2012), the evolution of other types of alternative splicing remains largely unexplored. The four major classes of alternative splicing are regulated through different molecular mechanisms. Our results provide a unique comparison of regulatory divergence among splicing classes and suggest that differences in their underlying mechanisms of regulation strongly impact the course of their evolution.
We compared the regulation of SE, RI, A5SS, and A3SS among strains of D. melanogaster and its sister species D. simulans and D. sechellia. Our analysis shows that regulation of SE and NAGNAG events has diverged roughly twice as rapidly as other classes of alternative splicing. One interpretation of this result is that SE and NAGNAG regulatory networks are more pliable than other classes of alternative splicing. Increased pliability could reflect reduced selective pressure to maintain inclusion levels and/or increased complexity of their regulatory networks. In the case of NAGNAGs, the former explanation seems most reasonable, as their usage alters only a single amino acid. Indeed, a recent study found that single codon insertions and deletions were greatly enriched at the 5′ ends of exons, consistent with frequent mutational gain and loss of NAGNAG sites (Bradley et al. 2012).
Divergent exon skipping is likely to have more significant effects on protein-coding sequences. As such, the rapid divergence of SE requires another explanation. Landry and colleagues have shown that mutational variance, or probability that a mutation affects the expression of a gene, is correlated with the number of cis- and trans-regulatory components that control a gene’s expression (Landry et al. 2007). Genes with more complex regulatory networks are more susceptible to changes in their regulation. One possibility is that SE regulatory networks are more complex than those that control other types of alternative splicing. If this is true, we would expect SE to be more dynamically regulated than other splicing classes. To investigate this, we calculated the switch scores (Maximum PSI–Minimum PSI) of alternative splicing events across the lifecycle of D. melanogaster (Graveley et al. 2011) and compared switch scores between splicing classes (Fig. 5A). SE are the most developmentally dynamic of all splicing events, lending credence to the complexity model. Similarly, exon skipping events are more sensitive to RNAi-mediated knockdown of splicing factors in S2 cells (A Brooks, M Duff, G May, L Yang, J Landolin, K Wan, J Sandler, S Celniker, B Graveley, S Brenner, in prep.), suggesting that their trans-mutational target size is larger than that of other splicing classes. Thus the comparatively rapid divergence of exon skipping may reflect a higher complexity of SE regulatory networks.
Figure 5.
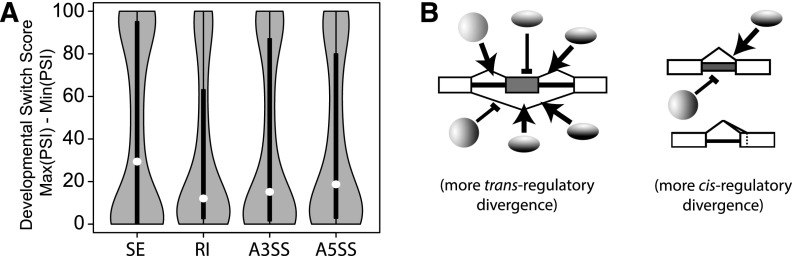
Differences in regulatory network architecture among classes of alternative splicing impact their regulatory divergence. (A) Skipped exons are more dynamically regulated throughout development. Violin plots show the distribution of switch scores (maximum percent inclusion minus minimum percent inclusion) for splicing events from each class of alternative splicing throughout development in D. melanogaster (Graveley et al. 2011). The median switch score (white dots) is highest for SE events. (B) Model of regulatory network differences among splicing classes. Skipped exons have a larger trans-mutational target size compared to other splicing classes and SE regulation diverges more rapidly through changes in trans-acting factors.
The relative contributions of cis- and trans-regulatory differences to splicing divergence are still debated. While large-scale studies have reported different conclusions regarding the role of cis-regulatory changes in SE regulation (Irimia et al. 2009; Li et al. 2010; Lin et al. 2010), divergent skipping of 13 mouse and human exons was recently attributed mostly to cis-regulatory differences (Barbosa-Morais et al. 2012). Unlike the human and mouse comparison, we found that trans-regulatory divergence has contributed substantially to differences in exon skipping among Drosophila. Several studies have shown that cis-regulatory differences in mRNA abundance preferentially accumulate over evolutionary time (Wittkopp et al. 2008; Emerson et al. 2010; Coolon et al. 2014). Thus, one explanation for the larger importance of cis-regulatory divergence observed by Barbosa-Morais and colleagues could be that their study used a much more divergent set of species (mouse and human).
Prior to this study, comparatively little was known regarding regulatory evolution of other types of splicing events. We determined the contributions of cis- and trans-regulatory changes in all major classes of alternative splicing events by analyzing allele-specific splicing patterns in F1 hybrids. Surprisingly, we found that the genetic mechanisms responsible for splicing evolution varied between classes. Although species differences in RI, A3SS, and A5SS can be attributed almost entirely to cis-regulatory sequence differences, cis- and trans-regulatory changes have contributed more equally to divergent SE.
The regulatory evolution of mRNA abundance and alternative splicing appear to be on different trajectories, in both the rate and path of their divergence. Species differences in mRNA abundance are much more common than divergent splicing regulation, with at least a third of the transcriptome showing significant differences in gene expression (Rifkin et al. 2003; Ranz et al. 2004; McManus et al. 2010a; Coolon et al. 2014). In contrast, we observed that roughly one-tenth of the transcriptome exhibits divergent splicing regulation. Multiple studies have shown that trans-regulatory changes contribute greatly to differences in mRNA abundance, both within and between closely related species (Emerson et al. 2010; McManus et al. 2010a; Coolon et al. 2014). In contrast, changes in cis-regulatory sequences play a more prominent role in splicing regulatory evolution, and only SE events exhibited substantial trans-regulatory divergence. Intriguingly, higher complexity of SE regulatory networks would also be expected to increase their susceptibility to trans-regulatory divergence.
We propose a model in which the networks that regulate SE are more complex than those of other splicing classes. This increased complexity leads to more rapid divergence of SE and increased trans-regulatory changes by providing a larger mutational target area (Fig. 5B). Consistent with this model, we found that regulation of SE diverges more rapidly and is more influenced by trans-regulatory divergence than that of other splicing classes. In addition, exon skipping is much less sensitive to splice site strength, and changes in site strength contribute little to divergent splicing regulation. In summary, RI, A5SS, and A3SS are diverging almost entirely through cis-regulatory changes, while trans-regulatory divergence has a greater impact on SE. The differences in regulatory network architecture among classes of alternative splicing affect the evolution of splicing regulation. Because deep coverage is necessary for accurate splicing analysis, our results represent the evolutionary trajectory of events found on genes highly expressed in many tissue types. Future work utilizing richer sequence depth from specific tissues will be necessary to determine the extent to which our results are also applicable to tissue-specific alternative splicing.
Methods
Flies and crosses
Much of the data used in this study was previously reported. All data used in this study were obtained from adult female flies 2- to 10-d post eclosion grown on standard Drosophila media. Specific conditions for the D. melanogaster strain zhr carrying the hybrid rescuing Zhr1 chromosome [full genotype, XYS.YL.Df(1)Zhr]; (Sawamura et al. 1993; Ferree and Barbash 2009) and the Zimbabwean strain z30 (Begun and Aquadro 1993; Wu et al. 1995) were previously reported (Coolon et al. 2012). Conditions for the D. melanogaster genome reference strain 14021-0231.36 were also previously reported (Graveley et al. 2011). Conditions for D. melanogaster 14021-0231.36 × D. sechellia (14021-0428.25) hybrids were previously described (McManus et al. 2010a). The D. simulans tsimbazaza strain (Hollocher et al. 2000) and D. melanogaster zhr × D. simulans tsimbazaza hybrids were grown as described by Coolon and colleagues (Coolon et al. 2012, 2014).
Library preparation and sequencing
Total RNA from each species was prepared by grinding 20 adult female flies in TRIzol (Invitrogen) and treated with DNase I (Ambion DNA-free) to remove DNA contaminants. RNA-seq libraries were prepared as previously described (McManus et al. 2010a). Ten micrograms of total RNA was used to prepare libraries for each pure species and hybrid sample, while 5 μg of each species RNA was mixed together for mixed samples. Poly(A)+ RNA was purified by two incubations with oligo-dT magnetic beads (Invitrogen Dynal), and fragmented using an RNA fragmentation reagent (Ambion). Reverse transcription was performed using random primers and SuperScript II (Invitrogen). Approximately 350 bp fragments of cDNA were purified by electrophoresis on a 2% agarose gel and extracted. Size-selected cDNA fragments were used as input material for library preparation using the Paired-end Genomic DNA library kit (Illumina). Genomic DNA was prepared using the DNeasy Blood and Tissue kit (Qiagen). A total of 10 μg of DNA was used as input material for the Paired-end Genomic DNA library kit (Illumina). Genomic DNA was fragmented using Illumina supplied nebulizers and size-selected as described above. Libraries were subjected to 76 cycles of paired end sequencing on an Illumina GA IIx. Basecalling was performed using Illumina CASSAVA. For total readcounts and depth of coverage, see Supplemental Material. Additional data from prior work was also included in this study and is available under SRA accession numbers SRA052065 (D. melanogaster zhr and z30 gDNA), SRA009364 (D. melanogaster reference strain 5-d adult female; modENCODE), and GEO accession number GSE20421 (D. sechellia, and hybrid mRNA).
Genome resequencing and assembly
Genomic sequence reads from D. sechellia, D. simulans, and D. melanogaster were aligned to the droSec1, droSim1, and dm3 assembly releases, respectively, using BWA (version 0.5.6) (Li and Durbin 2010). Reads were aligned separately using default parameters and merged using the BWA sampe command. The resulting SAM format files were converted to BAM format and SNPs and indels were called using SAMtools (version 0.1.7a; commands view, sort, and pileup) (Li et al. 2009). SNPs and indels were filtered using the SAMtools package command “samtools.pl varFilter” to retain variants with phred quality scores greater than 20 (estimated 1% error). A custom Perl script, snp_adder.pl (Supplemental Material), was used to produce strain-specific genomes. This script modifies reference genome sequences to incorporate the filtered variants. Insertion/deletion positions were recorded and used to produce custom chain files to use with the UCSC liftOver script.
For D. sechellia and D. simulans, gDNA sequence reads were remapped to the strain-specific genomes. Nonmappable read-pairs were assembled into contigs using Velvet (version 1.0.15; parameters: velveth k=35; velvetg –exp_cov auto, -min_contig_lgth 300) (Zerbino and Birney 2008). These contigs were aligned to the strain-specific genomes using BLAT. Contigs whose 5′ and 3′ ends both align to the strain-specific genome were retained and extended 100 bp in each direction. These “extended” contigs span gaps in each organism’s genomic sequence. Extended contigs were combined with the strain-specific genomes to create an intermediate target sequence for gDNA read alignment. Genomic DNA was remapped to this intermediate target genome, and nonmappable read-pairs were assembled into contigs as above. The resulting contigs were combined with extended contigs and aligned to the dm3 reference genome using LASTZ (Harris 2007). Contigs that aligned uniquely to the D. melanogaster reference genome (dm3) were kept as the “extra-genome.” LiftOver chain files were produced from the LASTZ alignment output using the axtChain, chainNet, and netChainSubset utilities from the UCSC Genome Browser (Kent et al. 2003).
Custom Perl scripts were used to create exon junction databases for allele-specific alignment, using gene annotations generated by the modENCODE Consortium (Graveley et al. 2011). Junction windows were chosen to require that each exon is covered by at least 6 nt of a junction read. “Exact” junctions were created to allow alignment to exons shorter than the read length (76 nt). In this case, a junction window would contain a sequence from more than two exons, x1- x2 (short) – x3, while maintaining the length of the junction window. Junction window genome coordinates from D. melanogaster were translated to each of the resequenced genomes using the UCSC liftOver tool. A sequence for each junction window was extracted and joined into “exact” junction databases. Junction databases were filtered to remove junctions lacking defined coordinates in one or more species or strains. In order to identify RNA-seq reads relevant to intron retention, genomic coordinates overlapping the splice site by at least 6 nt were identified. Reads aligning to these regions were taken as evidence of intron retention.
Allele-specific alignment
At some genomic coordinates, gDNA resequencing identified heterozygous sites. If ignored, these sites could introduce error in allele-specific alignment steps. Thus, target genomes for allele-specific alignment were produced by adding heterozygous sites to each strain's genome using snp_adder.pl (Supplemental Material). IUPAC nucleotide codes were used to represent heterozygous sites (e.g., “R” for A/G heterozygote). RNA-seq reads were aligned to genomic and junction coordinates using MOSAIK (version 1.0.1388; parameters: -hs 13 –mm 0 –j –mhp 100 –act 20) (Busby et al. 2011).
For single-species RNA-seq samples, reads were aligned to the corresponding genome and junction sequences. For mixed (e.g., D. melanogaster RNA + D. simulans RNA) and F1 hybrid samples, reads were aligned sequentially to each genome in order to identify allele-specific alignments. The alignment procedure was essentially performed as previously reported (McManus et al. 2010a). Reads were first aligned to genome sequences. Reads that failed to align to genomic loci were then aligned to exon junction sequences. Remaining RNA-seq reads were trimmed 13 nt and realigned for four total cycles (76, 63, 50, and 37 nt). Alignment coordinates were converted to bed format using MOSAIK, with a correction step to convert MOSAIK BED files (1-based) to proper BED format (0-based). Genomic alignment coordinates for each species and strain were then converted to the corresponding locations in the D. melanogaster reference genome using the UCSC liftOver tool and custom chain files. RNA-seq reads mapping to unique genomic coordinates (without mismatches) in a single species were considered allele specific and used in further analyses.
Splicing analysis
Gene annotations were sorted into four alternative splicing event categories (exon skipping, alternative 5′ splice sites, alternative 3′ splice sites, and intron retention). The intersectBed program (Quinlan and Hall 2010) was used to identify genomic reads that crossed splice sites from annotated intron retention events. Custom Perl scripts parsed the junction database alignments to count the RNA-seq reads corresponding to each event. These scripts create tables of junction and genomic hits for each splice event (Supplemental Tables S6–S9). Splicing analysis was performed for all events with a minimum of 20 total RNA-seq reads (junctions for exon skipping and alternative splice sites, junction and genomic reads for intron retention). The 20-read threshold was chosen based on prior work (Pan et al. 2008; Wang et al. 2008). However, the results of our analysis are essentially the same using a lower 10-read threshold (Supplemental Fig. S4). Percent Spliced In (PSI) values were calculated using the following formulas.
Exon skipping
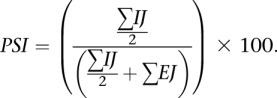 |
Two common exons, “C1” and “C2,” flank an alternative exon, “A.” When “A” is longer than the read length (76), two junctions support exon inclusion, C1–A and A–C2. When A is shorter than the read length, the C1–A–C2 junction can also be identified in RNA-seq data. Together, the C1–A, A–C2, and C1–A–C2 junctions are defined as inclusion junctions (IJ), while C1–C2 are exclusion junctions (EJ).
Alternative splice sites
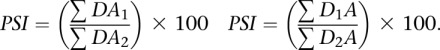 |
Alternative splice sites are defined as sites with either one 5′ donor site and two alternative 3′ acceptor sites (alternative 3′ss), or two alternative 5′ donor sites and one 3′ acceptor site (alternative 5′ss). In both situations, two alternative splice junctions are possible. Alternative 3′ss allow DA1 (donor-acceptor1) and DA2 (donor-acceptor 2), while alternative 5′ss allow D1A and D2A junctions.
Intron retention
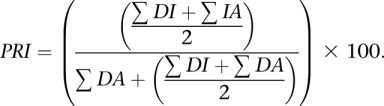 |
A total of 776 retained introns annotated in the modENCODE survey of developmental gene expression (Graveley et al. 2011) were analyzed for regulatory divergence. Intron retention analysis was restricted to introns with single donor and acceptor splice sites. Junction sequences joining the donor and acceptor (DA) supported intron splicing, while sequence reads that aligned across the donor or acceptor sites into the intron (DI and IA) by at least 6 nt suggested intron retention. Percent retained intron (PRI) was calculated. While all of these events had retention frequencies >5% in at least one developmental time point from the modENCODE study, 46 (6%) did not appear to be retained in any of the adult females we surveyed.
Tests of statistical significance were performed using R. Fisher’s exact test was used to compare PSI values for each pairwise comparison of strains and species. Q-values were calculated using the qvalue module in R (Storey and Tibshirani 2003). Q-value cutoffs corresponding to an FDR of 0.05 were applied. In addition, only splicing events for which both samples had ≥20 informative junction reads and PSI differences (ΔPSI) >10% were considered further. Comparisons of allele-specific PSI values from F1 hybrid samples were also performed using Fisher’s exact test to identify cis-acting differences in splicing. The ratio of PSI values between parent alleles (e.g., D. melPSI/D. simPSI) were compared to allele-specific PSI ratios from hybrids using the method of Altman and Bland (2003). The standard error of the difference in parental and allele-specific PSI ratios was calculated and used to calculate Z-scores and P-values. Q-values were further calculated and an FDR cutoff of 0.05 was applied to tests of cis- and trans-acting splicing divergence. Less stringent FDR thresholds of 0.1 and 0.2 were tested and gave highly similar results. Interspecies differences in mRNA abundance were compared as described (McManus et al. 2010a), and divergent expression and splicing were cross-compared using Fisher’s exact test in R.
Validation
Species-specific RT-PCR (McManus et al. 2010b) was used to validate cis- and trans-acting differences in alternative splicing. Seven events from RI and eight events from SE were chosen for validation. Primers were designed such that the 3′ ends of each primer crossed SNPs. Total RNA was reverse transcribed using random primers and SuperScript II reverse transcriptase according to the manufacturer’s specifications (Invitrogen). cDNA was amplified for 30 cycles using species-specific primers and Taq (Invitrogen). PCR products were separated on 2% agarose gels and visualized by ethidium bromide staining. Gel images were processed with ImageJ (Schneider et al. 2012) to quantify products. PSI values were calculated by normalizing brightness by PCR product length. RNA-seq and RT-PCR PSI values were compared for linear correlation using R.
Data access
High-throughput sequencing data have been submitted to the NCBI Sequence Read Archive (SRA; http://www.ncbi.nlm.nih.gov/sra) under accession number SRP023274. Genome sequences are accessible at the McManus (http://www.bio.cmu.edu/labs/mcmanus/), Wittkopp (http://www.umich.edu/∼pwlab/), and Graveley (http://graveleylab.cam.uchc.edu/Graveley/) laboratory websites. Contigs with novel sequences from D. simulans and D. sechellia have been submitted to GenBank (http://www.ncbi.nlm.nih.gov/genbank/) under accession numbers JAQJ00000000 and JAQR00000000, respectively.
Acknowledgments
We are grateful to the University of Connecticut Health Center Genomics Core Facility for providing access to Illumina Sequencers. We also thank Gene Yeo for assistance in retraining MaxEntScan splice site scoring models using D. melanogaster sequences and Kraig Stevenson for bioinformatic assistance. This work was supported by grants from the National Institutes of Health (5R01GM095296) to B.R.G., the National Science Foundation (MCB-1021398) to P.J.W., and the National Institutes of Health (5F32GM089009-02) to J.D.C.
Author contributions: C.J.M., B.R.G., J.D.C., and P.J.W. conceived and designed the experiments. J.D.C. reared, crossed, and collected flies. C.J.M. and J.D.C. prepared mRNA sequencing libraries. C.J.M. prepared gDNA sequencing libraries. C.J.M. and B.R.G. collected high-throughput sequence data. C.J.M. assembled strain- and species-specific genomes, with input from J.D.C. C.J.M. and J.E.-M. identified alternative splicing events. C.J.M. designed and performed all other data analysis, RT-PCR validation and prepared all figures. C.J.M. wrote the manuscript with input from all authors.
Footnotes
[Supplemental material is available for this article.]
Article published online before print. Article, supplemental material, and publication date are at http://www.genome.org/cgi/doi/10.1101/gr.161521.113.
References
- Altman DG, Bland JM 2003. Interaction revisited: the difference between two estimates. BMJ 326: 219. [DOI] [PMC free article] [PubMed] [Google Scholar]
- Baek D, Green P 2005. Sequence conservation, relative isoform frequencies, and nonsense-mediated decay in evolutionarily conserved alternative splicing. Proc Natl Acad Sci 102: 12813–12818 [DOI] [PMC free article] [PubMed] [Google Scholar]
- Barberan-Soler S, Zahler AM 2008. Alternative splicing and the steady-state ratios of mRNA isoforms generated by it are under strong stabilizing selection in Caenorhabditis elegans. Mol Biol Evol 25: 2431–2437 [DOI] [PMC free article] [PubMed] [Google Scholar]
- Barbosa-Morais NL, Irimia M, Pan Q, Xiong HY, Gueroussov S, Lee LJ, Slobodeniuc V, Kutter C, Watt S, Colak R, et al. 2012. The evolutionary landscape of alternative splicing in vertebrate species. Science 338: 1587–1593 [DOI] [PubMed] [Google Scholar]
- Begun DJ, Aquadro CF 1993. African and North American populations of Drosophila melanogaster are very different at the DNA level. Nature 365: 548–550 [DOI] [PubMed] [Google Scholar]
- Blekhman R, Marioni JC, Zumbo P, Stephens M, Gilad Y 2010. Sex-specific and lineage-specific alternative splicing in primates. Genome Res 20: 180–189 [DOI] [PMC free article] [PubMed] [Google Scholar]
- Bradley RK, Merkin J, Lambert NJ, Burge CB 2012. Alternative splicing of RNA triplets is often regulated and accelerates proteome evolution. PLoS Biol 10: e1001229. [DOI] [PMC free article] [PubMed] [Google Scholar]
- Busby MA, Gray JM, Costa AM, Stewart C, Stromberg MP, Barnett D, Chuang JH, Springer M, Marth GT 2011. Expression divergence measured by transcriptome sequencing of four yeast species. BMC Genomics 12: 635. [DOI] [PMC free article] [PubMed] [Google Scholar]
- Busch A, Hertel KJ 2011. Evolution of SR protein and hnRNP splicing regulatory factors. WIREs RNA 3: 1–12 [DOI] [PMC free article] [PubMed] [Google Scholar]
- Calarco JA, Xing Y, Cáceres M, Calarco JP, Xiao X, Pan Q, Lee C, Preuss TM, Blencowe BJ 2007. Global analysis of alternative splicing differences between humans and chimpanzees. Genes Dev 21: 2963–2975 [DOI] [PMC free article] [PubMed] [Google Scholar]
- Celniker SE, Wheeler DA, Kronmiller B, Carlson JW, Halpern A, Patel S, Adams M, Champe M, Dugan SP, Frise E, et al. 2002. Finishing a whole-genome shotgun: Release 3 of the Drosophila melanogaster euchromatic genome sequence. Genome Biol 3: RESEARCH0079.1. [DOI] [PMC free article] [PubMed] [Google Scholar]
- Chasin LA 2007. Searching for splicing motifs. Adv Exp Med Biol 623: 85–106 [DOI] [PubMed] [Google Scholar]
- Clark F, Thanaraj TA 2002. Categorization and characterization of transcript-confirmed constitutively and alternatively spliced introns and exons from human. Hum Mol Genet 11: 451–464 [DOI] [PubMed] [Google Scholar]
- Coolon JD, Stevenson KR, McManus CJ, Graveley BR, Wittkopp PJ 2012. Genomic imprinting absent in Drosophila melanogaster adult females. Cell Rep 2: 69–75 [DOI] [PMC free article] [PubMed] [Google Scholar]
- Coolon JD, McManus CJ, Stevenson KR, Graveley BR, Wittkopp PJ 2014. Tempo and mode of regulatory evolution in Drosophila. Genome Res (this issue). doi: 10.1101/gr.163014.113 [DOI] [PMC free article] [PubMed] [Google Scholar]
- Cutter AD 2008. Divergence times in Caenorhabditis and Drosophila inferred from direct estimates of the neutral mutation rate. Mol Biol Evol 25: 778–786 [DOI] [PubMed] [Google Scholar]
- David JR, Capy P 1988. Genetic variation of Drosophila melanogaster natural populations. Trends Genet 4: 106–111 [DOI] [PubMed] [Google Scholar]
- Degner JF, Marioni JC, Pai AA, Pickrell JK, Nkadori E, Gilad Y, Pritchard JK 2009. Effect of read-mapping biases on detecting allele-specific expression from RNA-sequencing data. Bioinformatics 25: 3207–3212 [DOI] [PMC free article] [PubMed] [Google Scholar]
- Drosophila 12 Genomes Consortium. 2007. Evolution of genes and genomes on the Drosophila phylogeny. Nature 450: 203–218 [DOI] [PubMed] [Google Scholar]
- Emerson JJ, Hsieh LC, Sung HM, Wang TY, Huang CJ, Lu HHS, Lu MYJ, Wu SH, Li WH 2010. Natural selection on cis and trans regulation in yeasts. Genome Res 20: 826–836 [DOI] [PMC free article] [PubMed] [Google Scholar]
- Ferree PM, Barbash DA 2009. Species-specific heterochromatin prevents mitotic chromosome segregation to cause hybrid lethality in Drosophila. PLoS Biol 7: e1000234. [DOI] [PMC free article] [PubMed] [Google Scholar]
- Garrigan D, Kingan SB, Geneva AJ, Andolfatto P, Clark AG, Thornton K, Presgraves DC 2012. Genome sequencing reveals complex speciation in the Drosophila simulans clade. Genome Res 22: 1499–1511 [DOI] [PMC free article] [PubMed] [Google Scholar]
- Graveley BR, Brooks AN, Carlson JW, Duff MO, Landolin JM, Yang L, Artieri CG, van Baren MJ, Boley N, Booth BW, et al. 2011. The developmental transcriptome of Drosophila melanogaster. Nature 471: 473–479 [DOI] [PMC free article] [PubMed] [Google Scholar]
- Graze RM, Novelo LL, Amin V, Fear JM, Casella G, Nuzhdin SV, Mcintyre LM 2012. Allelic imbalance in Drosophila hybrid heads: exons, isoforms, and evolution. Mol Biol Evol 29: 1521–1532 [DOI] [PMC free article] [PubMed] [Google Scholar]
- Grosso AR, Gomes AQ, Barbosa-Morais NL, Caldeira S, Thorne NP, Grech G, Lindern von M, Carmo-Fonseca M 2008. Tissue-specific splicing factor gene expression signatures. 36: Nucleic Acid Res 4823–4832 [DOI] [PMC free article] [PubMed] [Google Scholar]
- Harris R. 2007. “Improved pairwise alignment of genomic DNA.” PhD thesis, The Pennsylvania State University. [Google Scholar]
- Hollocher H, Agopian K, Waterbury J, O’Neill RW, Davis AW 2000. Characterization of defects in adult germline development and oogenesis of sterile and rescued female hybrids in crosses between Drosophila simulans and Drosophila melanogaster. J Exp Zool 288: 205–218 [DOI] [PubMed] [Google Scholar]
- Irimia M, Rukov JL, Roy SW 2009. Evolution of alternative splicing regulation: changes in predicted exonic splicing regulators are not associated with changes in alternative splicing levels in primates. PLoS ONE 4: e5800. [DOI] [PMC free article] [PubMed] [Google Scholar]
- Kent W, Baertsch R, Hinrichs A 2003. Evolution’s cauldron: duplication, deletion, and rearrangement in the mouse and human genomes. 100: Proc Natl Acad Sci 11484–11489 [DOI] [PMC free article] [PubMed] [Google Scholar]
- Koren E, Lev-Maor G, Ast G 2007. The emergence of alternative 3′ and 5′ splice site exons from constitutive exons. PLoS Comput Biol 3: e95. [DOI] [PMC free article] [PubMed] [Google Scholar]
- Lachaise D, Cariou M, David JR, Lemeunier F, Tsacas L, Ashburner M 1988. Historical biogeography of the Drosophila melanogaster species subgroup. Evol Biol 22: 159–225 [Google Scholar]
- Landry CR, Lemos B, Rifkin SA, Dickinson WJ, Hartl DL 2007. Genetic properties influencing the evolvability of gene expression. Science 317: 118–121 [DOI] [PubMed] [Google Scholar]
- Li H, Durbin R 2010. Fast and accurate long-read alignment with Burrows-Wheeler transform. Bioinformatics 26: 589–595 [DOI] [PMC free article] [PubMed] [Google Scholar]
- Li H, Handsaker B, Wysoker A, Fennell T, Ruan J, Homer N, Marth G, Abecasis G, Durbin R 1000 Genome Project Data Processing Subgroup. 2009. The Sequence Alignment/Map format and SAMtools. Bioinformatics 25: 2078–2079 [DOI] [PMC free article] [PubMed] [Google Scholar]
- Li Y, Breitling R, Snoek LB, van der Velde KJ, Swertz MA, Riksen J, Jansen RC, Kammenga JE 2010. Global genetic robustness of the alternative splicing machinery in Caenorhabditis elegans. Genetics 186: 405–410 [DOI] [PMC free article] [PubMed] [Google Scholar]
- Lin L, Shen S, Jiang P, Sato S, Davidson BL, Xing Y 2010. Evolution of alternative splicing in primate brain transcriptomes. Hum Mol Genet 19: 2958–2973 [DOI] [PMC free article] [PubMed] [Google Scholar]
- McManus CJ, Coolon JD, Duff MO, Eipper-Mains J, Graveley BR, Wittkopp PJ 2010a. Regulatory divergence in Drosophila revealed by mRNA-seq. Genome Res 20: 816–825 [DOI] [PMC free article] [PubMed] [Google Scholar]
- McManus CJ, Duff MO, Eipper-Mains J, Graveley BR 2010b. Global analysis of trans-splicing in Drosophila. Proc Natl Acad Sci 107: 12975–12979 [DOI] [PMC free article] [PubMed] [Google Scholar]
- Merkin J, Russell C, Chen P, Burge CB 2012. Evolutionary dynamics of gene and isoform regulation in mammalian tissues. Science 338: 1593–1599 [DOI] [PMC free article] [PubMed] [Google Scholar]
- Mount SM, Burks C, Hertz G, Stormo GD, White O, Fields C 1992. Splicing signals in Drosophila: intron size, information content, and consensus sequences. Nucleic Acids Res 20: 4255–4262 [DOI] [PMC free article] [PubMed] [Google Scholar]
- Nilsen TW, Graveley BR 2010. Expansion of the eukaryotic proteome by alternative splicing. Nature 463: 457–463 [DOI] [PMC free article] [PubMed] [Google Scholar]
- Pan Q, Shai O, Lee LJ, Frey BJ, Blencowe BJ 2008. Deep surveying of alternative splicing complexity in the human transcriptome by high-throughput sequencing. Nat Genet 40: 1413–1415 [DOI] [PubMed] [Google Scholar]
- Quinlan AR, Hall IM 2010. BEDTools: a flexible suite of utilities for comparing genomic features. Bioinformatics 26: 841–842 [DOI] [PMC free article] [PubMed] [Google Scholar]
- Ranz JM, Namgyal K, Gibson G, Hartl DL 2004. Anomalies in the expression profile of interspecific hybrids of Drosophila melanogaster and Drosophila simulans. Genome Res 14: 373–379 [DOI] [PMC free article] [PubMed] [Google Scholar]
- Rifkin SA, Kim J, White KP 2003. Evolution of gene expression in the Drosophila melanogaster subgroup. Nat Genet 33: 138–144 [DOI] [PubMed] [Google Scholar]
- Sakabe N, de Souza S 2007. Sequence features responsible for intron retention in human. BMC Genomics 8: 59. [DOI] [PMC free article] [PubMed] [Google Scholar]
- Sawamura K, Yamamoto MT, Watanabe TK 1993. Hybrid lethal systems in the Drosophila melanogaster species complex. II. The Zygotic hybrid rescue (Zhr) gene of D. melanogaster. Genetics 133: 307–313 [DOI] [PMC free article] [PubMed] [Google Scholar]
- Schneider CA, Rasband WS, Eliceiri KW 2012. NIH Image to ImageJ: 25 years of image analysis. Nat Methods 9: 671–675 [DOI] [PMC free article] [PubMed] [Google Scholar]
- Shepard PJ, Choi EA, Busch A, Hertel KJ 2011. Efficient internal exon recognition depends on near equal contributions from the 3′ and 5′ splice sites. Nucleic Acids Res 39: 8928–8937 [DOI] [PMC free article] [PubMed] [Google Scholar]
- Storey JD, Tibshirani R 2003. Statistical significance for genomewide studies. Proc Natl Acad Sci 100: 9440–9445 [DOI] [PMC free article] [PubMed] [Google Scholar]
- Stevenson KR, Coolon JD, Wittkopp PJ 2013. Sources of bias in measures of allele-specific expression derived from RNA-seq data aligned to a single reference genome. BMC Genomics 14: 536. [DOI] [PMC free article] [PubMed] [Google Scholar]
- Taliaferro JM, Alvarez N, Green RE, Blanchette M, Rio DC 2011. Evolution of a tissue-specific splicing network. Genes Dev 25: 608–620 [DOI] [PMC free article] [PubMed] [Google Scholar]
- Wang Z, Burge CB 2008. Splicing regulation: from a parts list of regulatory elements to an integrated splicing code. RNA 14: 802–813 [DOI] [PMC free article] [PubMed] [Google Scholar]
- Wang ET, Sandberg R, Luo S, Khrebtukova I, Zhang L, Mayr C, Kingsmore SF, Schroth GP, Burge CB 2008. Alternative isoform regulation in human tissue transcriptomes. Nature 456: 470–476 [DOI] [PMC free article] [PubMed] [Google Scholar]
- Wittkopp PJ, Haerum BK, Clark AG 2004. Evolutionary changes in cis and trans gene regulation. Nature 430: 85–88 [DOI] [PubMed] [Google Scholar]
- Wittkopp PJ, Haerum BK, Clark AG 2008. Regulatory changes underlying expression differences within and between Drosophila species. Nat Genet 40: 346–350 [DOI] [PubMed] [Google Scholar]
- Wu CI, Hollocher H, Begun DJ, Aquadro CF, Xu Y, Wu ML 1995. Sexual isolation in Drosophila melanogaster: a possible case of incipient speciation. Proc Natl Acad Sci 92: 2519–2523 [DOI] [PMC free article] [PubMed] [Google Scholar]
- Yeo G, Burge CB 2004. Maximum entropy modeling of short sequence motifs with applications to RNA splicing signals. J Comput Biol 11: 377–394 [DOI] [PubMed] [Google Scholar]
- Yu Y, Maroney P, Denker J, Zhang X, Dybkov O, Luhrmann R, Jankowsky E, Chasin L, Nilsen T 2008. Dynamic regulation of alternative splicing by silencers that modulate 5′ splice site competition. Cell 135: 1224–1236 [DOI] [PMC free article] [PubMed] [Google Scholar]
- Zerbino DR, Birney E 2008. Velvet: algorithms for de novo short read assembly using de Bruijn graphs. Genome Res 18: 821–829 [DOI] [PMC free article] [PubMed] [Google Scholar]