

Abstract
Vertical, transgenerational transmission of genetic material occurs through reproduction of living organisms. In addition to vertical inheritance, horizontal gene transfer between reproductively isolated species has recently been shown to be an important, if not dominant, mechanism in the evolution of prokaryotic genomes. In contrast, only a few horizontal transfer (HT) events have been characterized so far in eukaryotes and mainly concern transposable elements (TEs). Whether these are frequent and have a significant impact on genome evolution remains largely unknown. We performed a computational search for highly conserved LTR retrotransposons among 40 sequenced eukaryotic genomes representing the major plant families. We found that 26 genomes (65%) harbor at least one case of horizontal TE transfer (HTT). These transfers concern species as distantly related as palm and grapevine, tomato and bean, or poplar and peach. In total, we identified 32 cases of HTTs, which could translate into more than 2 million among the 13,551 monocot and dicot genera. Moreover, we show that these TEs have remained functional after their transfer, occasionally causing a transpositional burst. This suggests that plants can frequently exchange genetic material through horizontal transfers and that this mechanism may be important in TE-driven genome evolution.
Transposable elements (TEs) are mobile genomic DNA sequences that are found in almost all living organisms (Finnegan 1985). They so densely populate the genomes of many eukaryotic species that they are often the major components, as in human (>50%) (Prak and Kazazian 2000) or bread wheat (>95%) (Bennetzen 2000). In this regard, TEs have been shown to have a major impact on both structural and functional modifications of genomes (Bennetzen 2000; Feschotte 2008). They are usually classified into two distinct types. Class I elements (retrotransposons) transpose via an RNA intermediate through a copy and paste mechanism, whereas class II elements (transposons) transpose through a cut-and-paste mechanism (Wicker et al. 2007). Both classes comprise various types (orders and superfamilies in Wicker's classification). Although most of these types can be found in all the plant genomes sequenced so far, LTR retrotransposons represent by far the major genomic constituents in the kingdom. In this regard, LTR retrotransposons have been shown to strongly impact genome structure (Piegu et al. 2006), whereas several reports have demonstrated their putative functional impact as epigenetic mediators (Kobayashi et al. 2004).
TEs achieve their transposition cycle within their host and are thus considered to be lineage specific because, like genes, they are inherited vertically from one generation to another. However, unlike genes, they do not encode any information essential for their host, and their insertion into genes can in some cases have a negative effect on fitness. This “selfish” and potentially deleterious nature has raised the question of their persistence in eukaryotic lineages, especially after it was shown that TEs are strictly controlled by several silencing pathways (Slotkin and Martienssen 2007; Rigal and Mathieu 2011) and efficiently eliminated from their host genomes through deletions (Vitte and Panaud 2005). Horizontal transfers could allow TEs to escape this process by transposing into a new “naive” host genome, therefore ensuring their long-term survival. However, although horizontal gene transfers are very common in Bacteria (Rocha 2013), evidence of HTTs in eukaryotes remains scarce, although recent reports suggest their potential impact in genome evolution (Schaack et al. 2010). Three criteria have been defined for the detection of HTTs: patchy distributions of TEs in phylogenies; identification of TEs exhibiting high sequence similarity between distantly related taxa; and phylogenetic incongruence between the host and TEs (Gilbert et al. 2010; Kuraku et al. 2012; Wallau et al. 2012; Walsh et al. 2013). An exhaustive search for HTTs that meet these three criteria in a wide taxonomic range thus requires a comprehensive set of genomic resources. Next-generation sequencing (NGS) has made available full genome sequences for many organisms, enabling genome-wide comparative surveys for a large panel of evolutionary lineages. Using such resources, we surveyed HTTs across the plant kingdom, and we show that they are very frequent and widespread among monocots and dicots.
Results
We conducted an ab initio search for HTTs among 40 angiosperm species belonging to 36 monocot and eudicot genera for which high-quality genome sequences are available (Fig. 1; Supplemental Table 1). We focused on LTR retrotransposons (LTR-RTs), class I TEs constituting the largest portion of the TE repertoire of plant genomes (Wicker et al. 2007). First, we retrieved full-size elements from genome sequences (see Methods). Around 300,000 elements were clustered into distinct families following our recently published method (El Baidouri and Panaud 2013). HTT candidates were detected by applying a 90% identity threshold within either the monocot or dicot classes and an 85% identity threshold between these classes (to take into account their greater divergence time). The former value corresponds to a date of ∼3 My (using an average LTR-RT divergence rate of 1.6 × 10⁻⁸ substitutions/site/year estimated in plants) (Ma and Bennetzen 2004). It is lower than the divergence times between the genera in our data set (5 My for the two Arabidopsis species, >150 My for the monocot-dicot split), ensuring the detection of horizontally, as opposed to vertically, inherited TE sequences. Thirty-two families containing elements from at least two distinct genera were identified (Supplemental Data 1), suggesting at least 32 horizontal transfers, based on their patchy distribution in the plant phylogenetic tree (Table 1; Fig. 1). Among these, BG12 was previously described by our group using a different approach (Roulin et al. 2009).
Figure 1.

Horizontal transposon transfers (HTTs) identified in our survey of 40 fully sequenced plant genomes. The 40 species used in this study together with the color-coded families to which they belong are positioned in the monocot/dicot phylogenetic tree obtained from APG3 (http://www.mobot.org/MOBOT/research/APweb/) (see Supplemental Table 1 for details). Each HTT is represented by a line connecting the species involved (red line, transfer between classes [BC]; green line, transfer between orders [BO]; blue line, transfer between genera [BG]).
Table 1.
Description of HTTs identified in the survey of 40 plant genomes
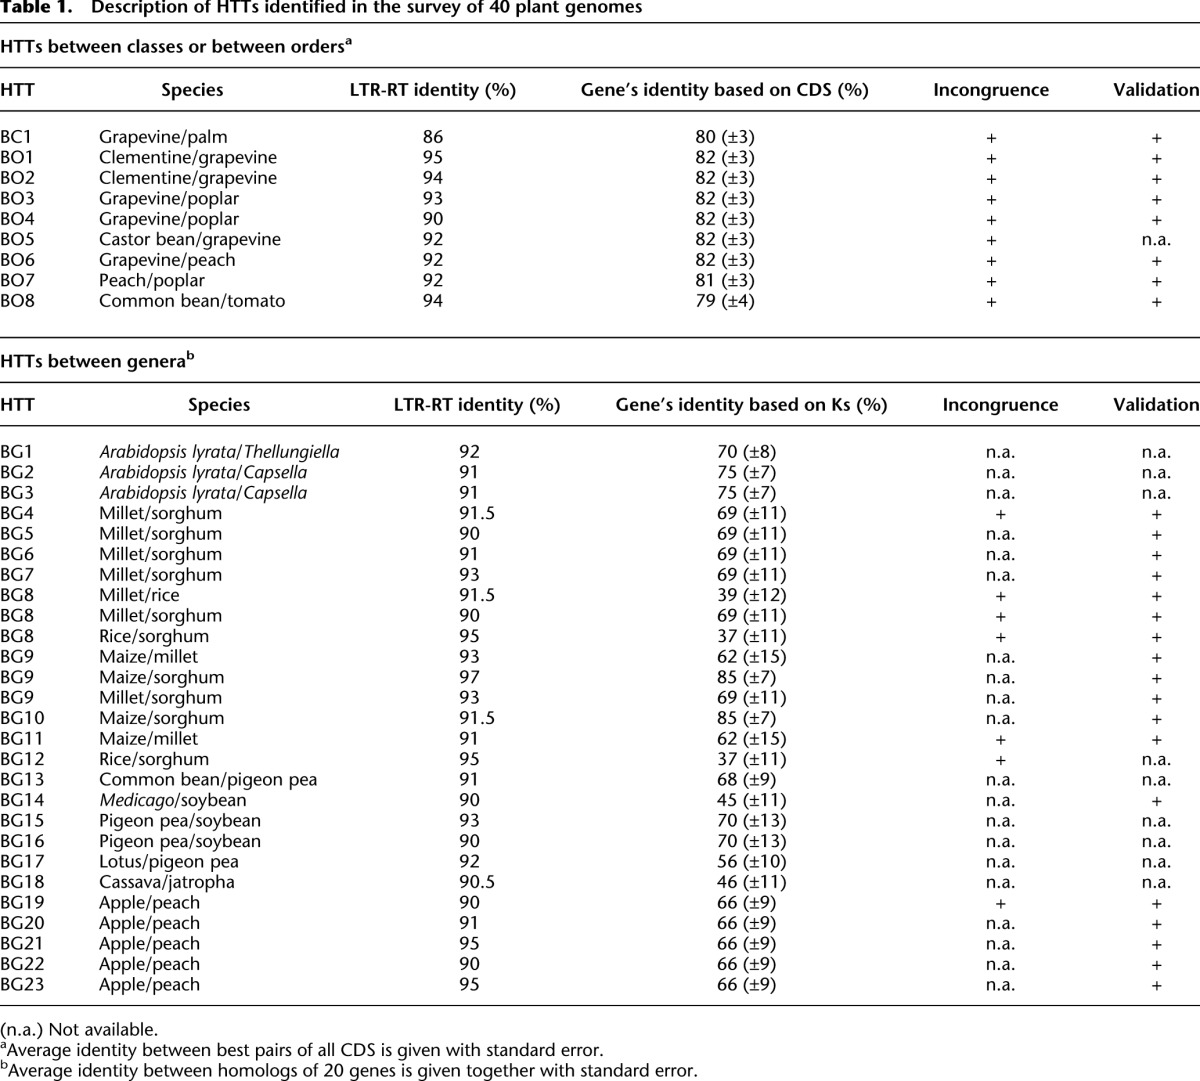
Transfers were confirmed by comparing sequence identity between elements with the average identity of gene sequences between the species. For intra-family transfers, we used the Ks value of a set of 20 highly conserved genes previously used for phylogenetic studies in monocots and dicots (Zhang et al. 2012). TE sequence identity was always higher than the Ks value (Table 1; Supplemental Table 2), thus meeting the high similarity criterion for HTTs. For more distant transfers (inter-order or inter-monocot/dicot), potential saturation of synonymous sites made the use of Ks values inappropriate. Instead, we calculated genome-wide sequence identity between all annotated genes for each group of species involved (see Methods) and compared these values to those of the transferred LTR-RTs (Table 1; Fig. 2). Distributions of pairwise sequence identities between the closest gene homologs were always unimodal (Fig. 2). We concluded that sequence identity at the peak of the distribution should be a good indicator of overall genomic divergence. Peak values were always lower than 90% (our threshold for the detection of LTR-RT HTTs).
Figure 2.

Comparison between the sequence identity of LTR-RTs and the genomic distance between the species involved in BC and BO transfers. In each panel, the top graph represents the sequence identity along the complete length of the LTR-RTs involved in the transfer in both species as indicated, with the red line representing the detection threshold (85% and 90% identity for BC and BO HTTs, respectively). The histogram (in blue) represents the distribution of pairwise gene identity based on CDS comparisons (see Methods). Numbers of CDS pairs analyzed are as indicated (n). Arrows correspond to average sequence identity between the transferred LTR-RTs.
Finally, we checked phylogenetic incongruence for the 32 HTTs. Sequences homologous to horizontally transferred elements were identified in the NCBI nucleotide databases, excluding the species involved in the transfer, and a tree built including these sequences. Fifteen trees showed incongruence (Supplemental Fig. 1). For the remaining 17, BLAST searches showed no homologous sequences from taxonomic groups more closely related than the two species involved in the transfer. The presence in the plant genomes of the elements detected in silico was tested by PCR amplification and sequencing for 22 HTTs. Transfers were confirmed in all cases (Supplemental Fig. 2). Overall, we identified one HTT between a monocot and a dicot species (between palm tree and grapevine, labeled BC), eight between distinct orders within either the dicots or monocots (BO), and 23 between genera of the same family (in both monocots and dicots, BG) (see Fig. 1).
Our approach only allowed detection of HTTs for LTR-RTs. We focused our study on this particular type of TEs because of their prevalence in plant genomes and because they are the most easily characterized and precisely annotated. However, we could not exclude that HTTs may concern other TEs such as transposons. However, the identification of such events at the whole genome scale would require initial genome-wide pairwise comparisons to identify highly identical sequences and characterization of the horizontally transferred DNA identified. For our 40 genomes, this would necessitate 780 comparisons (40 × 39/2), which we estimated would require nearly 2 yr of computation time on a 400-core cluster. We nevertheless performed comparisons a posteriori among species for which we detected HTTs of LTR-RTs (see Methods; Supplemental Table 3). For the most distant pairwise comparisons (the inter-monocot/dicot and the eight inter-order transfers), searches yielded the LTR-RT sequences identified using the initial detection procedure, together with ribosomal and mitochondrial sequences, confirming the first results. The BG transfers involve species from the same family, which are more closely related than those involved in the BC and BO transfers, and full genome comparisons yielded too many hits to be analyzed in extenso. We nevertheless completed such analysis for the BG8 transfer that involves rice and millet. BG8 was chosen because previous studies had identified the transfer of a class II element between these two species (Diao et al. 2006). The whole-genome comparison yielded similar results as the BO and BC transfers, and we could in addition detect the sequence of the previously identified transposon among the many other highly conserved sequences. Moreover, we identified a second transposon that may have been horizontally transferred between the two species (Supplemental Table 3).
The transpositional activity of horizontally transferred LTR-RTs was surveyed by determining their copy numbers in their host genome and tentatively dating their insertion by comparing their LTR sequences (Fig. 3; Supplemental Table 6). Thirty families were repeated with 1–400 complete copies, the remaining two were single copy in both species. All 32 families harbor the LTR-RT gag-pol domains, suggesting that they may be functional (Supplemental Fig. 3). Furthermore, sequence divergence between the two LTRs of each copy was always lower than the average sequence divergence between the elements from the two species (Fig. 3), which strongly suggests that horizontally transferred LTR-RTs have remained transpositionally active, with two cases showing a significant increase in copy number (BG10 and BG11) (Fig. 3).
Figure 3.

Transpositional activity of horizontally transferred LTR-RTs. Concentric circles represent the time scale for insertion dates: from 6 My (center) to present (outer circle). For each HTT, the red line illustrates the estimated date of the transfer (based on percent identity between the LTR-RTs involved in the transfer). For each species, the insertion date of each element (illustrated by the percent identity between both its LTR sequences) is represented as blue circles. Graphs are plotted with R (library plotrix) and edited with Illustrator.
Based on our analysis of 40 plant species, we estimated the total number of LTR-RT horizontal transfers that may have occurred among dicots and monocots within the last 3 million years. The species belong to 36 genera, 18 families, 14 orders, and two classes (monocots and eudicots). Our study therefore consisted of 776 pairwise comparisons: 256 monocot/dicot, 467 inter-order, 12 inter-family, and 41 intra-family (the four intra-genus comparisons in Arabidopsis, Cucumis, Citrus, and Solanum were not taken into account). To test whether this data set was representative, we estimated the total number of these four types of taxonomic comparisons by analyzing 1000 random draws of 36 genera among the 13,551 in monocots and dicots (see Methods; Fig. 4). Only the between-genera comparisons were overrepresented, and we corrected the estimation accordingly. We thus estimate that more than 2 million HTTs may have occurred in monocots and dicots within the last 3 million years (see Methods for a detailed description of the computation).
Figure 4.

Distributions of the four types of comparisons based on the simulation of 1000 random draws of 36 genera. The dotted lines represent the number of each of the comparison types in our sample of 36 genera from which sequenced genomes were analyzed.
Discussion
Our discovery leads to a reconsideration of LTR-RT biology: these TEs have long been considered as genomic components inherited exclusively vertically. They are often compared to retroviruses, which are presumed to have derived from LTR-RTs and acquired an envelope gene, allowing horizontal transmission within or between populations through contamination (and to a lesser extent vertically through sexual reproduction of their host) (Eickbush and Malik 2002). The occurrence of millions of HTTs in flowering plants in a recent past suggests that LTR-RTs may also have a strong propensity to be transmitted between distinct species. The mechanisms of these HTTs are not yet fully understood. We found several cases of multiple HTTs between the same species (e.g., five between sorghum and millet and five between apple and peach) (Table 1; Fig. 1). This suggests either that this mechanism should enable the transfer of several TE families at once, or that these multiple transfers result from prolonged sympatric distributions. The proximity of species, as in parasitism, has been proposed to favor HTTs in both plants and animals (Mower et al. 2004; Gilbert et al. 2010). However, none of the species we analyzed are parasitic, and we can exclude this as the only cause of HTTs in plants. Other studies suggest that some pathogens may act as horizontal transfer vectors (Sun et al. 2013). We show that HTTs are more frequent in closely related taxonomic groups (one inter-monocot/dicot transfer versus 29 intra-family transfers). If the latter hypothesis is true, HTTs may be favored by pathogens with narrower infectious spectra. In any case, because they are widespread in plants, there is a need to understand the vectors of these transfers and the mechanisms involved.
The estimation of the number of HTTs that may have occurred in all monocots and dicots must be taken with caution because it assumes that all plant lineages may be equally subjected to HTT, which cannot be tested without any prior knowledge on the putative mechanisms of the transfers (see above). In addition, one could anticipate that the geographical distributions of monocot and dicot lineages over the last 3 million years, and especially during the last glaciation/deglaciation periods, should have had an impact on HTTs. However, these distributions are not known, and consequently, the sympatric relationships between the species that belong to the 13,551 monocots and dicots genera cannot be established. Nevertheless, our estimation exceeds by several orders of magnitude the number of HTTs documented until now in both plants and animals (Wallau et al. 2012).
The last 20 yr of genomic studies in plants have demonstrated the impact of TEs on the structure, evolution, and function of eukaryotic genomes (Feschotte 2008; Rebollo et al. 2012). The question of their survival and evolutionary success has often been raised, as their putative mutagenic and therefore deleterious nature should theoretically result in elimination. Recent studies have shown that TEs are in fact efficiently silenced by several epigenetic pathways and subsequently quickly eliminated through deletion from their host genomes, providing an explanation for their limited negative biological impact, but certainly not for their long-term survival in most lineages. Our results provide a possible answer to this paradox because we show that transferred elements remain transpositionally active in both species. We propose that HTTs provide an escape route from silencing and elimination and are thus essential for their survival in plants.
Methods
Identification and characterization of HTTs
Genome sequences from 40 angiosperm species were downloaded mainly from Phytozome v9.0 (http://www.phytozome.net/) (the complete list with all sources is given in Supplemental Table 1). Full-size LTR-RT elements were identified in these genomes (by in silico analysis using LTRharvest prediction software, http://www.zbh.uni-hamburg.de/?id=206) (Ellinghaus et al. 2008). Default parameters were used except for the following: -xdrop 37 -motif tgca -motifmis 1 -minlenltr 100 -maxlenltr 3000 -mintsd 2. A total of approximately 300,000 copies were obtained and merged into one multi-FASTA database. To detect HTT candidates, we used a clustering strategy that we described previously for LTR-RT family classification (El Baidouri and Panaud 2013). This method, based on an all-against-all comparison of LTR-RT sequences, was used to retrieve elements sharing high sequence identity (>90% within monocots or dicots and >85% between monocots and dicots because of the greater divergence time between these classes) between different species. As a first step, a nucleotide BLAST (all against all) of these elements was performed using the following parameters: -r 2 (reward for nucleotide match), -e 1e-20 (E-value), -F F (Filter = false), and -m 8 (for tabular output). The second step consisted of clustering sequences (based on the BLAST results) using SiLiX software (http://lbbe.univ-lyon1.fr/SiLiX) (Miele et al. 2001) in order to define highly similar LTR-RT copies. About 124,000 distinct clusters were obtained. The vast majority of these clusters contain several copies of the same LTR-RT family from a single species. This is what is expected in the case of a vertical TE transmission. However, 32 clusters contain LTR-RT elements that share high sequence similarity and belong to at least two different species. All potential candidates were validated by checking that the LTR-RT sequences were located on large contigs and not on isolated, short sequences in genome assemblies, and that high sequence identity was limited to the elements themselves—to eliminate possible contamination or annotation errors. These elements are our HTT candidates. Sequence identity between the elements involved in HTTs was computed after alignment using the SeaView software (Galtier et al. 1996). Phylogenies of the elements were built using the maximum likelihood method.
Estimation of genomic distances
Gene identities were computed following two methods. (1) For BG HTTs, a set of 20 genes (Zhang et al. 2012) was used to determine an average Ks value for each species pair involved in the transfer. Ka/Ks were computed using Ka/Ks calculator software (Table 1; Supplemental Table 2; Zhang et al. 2006). (2) For the BO and BC HTTs between more distantly related species, in which Ks values are subject to caution due to potential saturation of sites, full genome comparisons of the complete gene sets were performed using a BLASTN homology search procedure (Fig. 2). For each pair of species involved in HTT, a nucleotide BLAST was performed (BLAST 2.2.26+) using all coding DNA sequence (CDS) of one species as a query against all CDS of the other species, with the default parameters. Multi-FASTA files of CDS primary transcripts were retrieved from Phytozome v9.0 (http://www.phytozome.net). The best hit for each BLAST was selected and a filter was applied on the percentage of query coverage (>60%). The distribution of the sequence identity of best hits was plotted and genomic distance considered to correspond to the percentage identity at the mode of the distribution.
Phylogenetic incongruences between horizontally transferred LTR-RTs and species trees
For each transferred element, the reverse transcriptase domain was used as a query for a homology search against the NCBI nr nucleotide database using the BLASTN algorithm and excluding the species involved in the transfer. All sequences, including queries, were aligned using Muscle, and a phylogenetic tree was built using a maximum likelihood method and 100 bootstrap replicates. Alignments and phylogenetic analyses were performed using SeaView software on a LINUX platform.
Pairwise full genome comparisons
Validation of selected comparisons was carried out a posteriori by whole-genome comparisons. The genomic sequences of the species implicated in inter-order and inter-class HTTs were split into small fragments of 1 kbp using splitter software from the EMBOSS package (http://emboss.bioinformatics.nl/cgi-bin/emboss/help/splitter). A BLAST2seq search was performed using the sequence fragments of the two species implicated in an HTT event as query and subject. All genomic regions that produced significant BLAST hits (sequence identity >90% and HSP length >200 bp) were retained for further analysis. Nucleotide BLASTN and protein BLASTX searches for highly similar regions were performed against the NCBI nr databases (http://www.ncbi.nlm.nih.gov), and hits are reported in Supplemental Table 3.
Wet-lab validation of HTTs
For 22 HTTs, pairs of PCR primers were defined that should amplify the LTR-RT sequences in both species (Supplemental Tables 4 and 5). PCR products were purified according to the manufacturer's instructions (MP Biomedicals) and sequenced on an Applied Biosystems (Life Technologies) 3130×l sequencer. These sequences were aligned with the original genomic sequences using ClustalW in SeaView (Supplemental Fig. 2; Galtier et al. 1996).
Functional annotation of LTR-RT families involved in HTTs
For each transfer, one element per species was analyzed for the presence of functional domains. Functional domains were defined using the CDD tool for conserved domain annotation at NCBI (http://www.ncbi.nlm.nih.gov/Structure/cdd/wrpsb.cgi).
Estimation of the number of HTTs among monocots and dicots
The complete list of the 13,551 genera of monocots and dicots was built using the information available from The Plant List (http://www.theplantlist.org) (The Angiosperm Phylogeny Group 2009). A complete taxonomic description of these 13,551 genera is available upon request. To establish whether our sample of 40 species is representative of the diversity of these taxa of flowering plants, we carried out simulations of the representativity of randomly drawn sets of species to correct for any bias. We distinguish four types of comparison: inter-monocot-dicot comparison, named BC (between class); between-order (within class, BO); between-family (within order, BF); and between-genera (within family, BG). Our sample of 40 species necessitated (40 × 39)/2 = 780 pairwise comparisons, from which we ignored four that correspond to intra-genus comparisons (melon/cucumber; Arabidopsis thaliana/Arabidopsis lyrata; clementine/orange; and tomato/potato). The remaining 776 comparisons could be classified into 256 BC, 467 BO, 12 BF, and 41 BG comparisons. We randomly drew 1000 samples of 36 genera from the complete list of the 13,551 genera. For each draw, we computed the number of BC, BO, BF, and BG comparisons and plotted their distributions for the 1000 samples (Fig. 4). Values for our sample were compared with this distribution. These values fall within the mode of the distribution for BC and BO. We therefore consider that our sample is not biased for these two types of comparisons, and a direct extrapolation of the total number of HTTs among monocots and dicots can be made (see below). In the case of BG, our sample is clearly biased, because it contains more species of the same family than if randomly drawn, certainly because the first plant genome projects concerned cereal crops (that belong to the Poaceae family). We therefore had to correct our estimation accordingly: The peak of the distribution corresponds to 25 BG comparisons. Our sample contains 41 BG comparisons. We therefore corrected the total number of BG HTTs by multiplying it by a factor of 25/41. The 13,551 genera of monocots and dicots would necessitate 13,551 × 13,550/2 = 91,808,025 comparisons. These can be declined into: 31,288,248 BC; 54,582,625 BO; 2,475,511 BF; and 3,461,641 BG comparisons. We found 1 BC, 8 BO, and 23 BG HTTs. Our estimation for the total number of HTTs among monocots and dicots is 1 × (31,288,248/256) + 8 × (54,582,625/467) + 23 × (25/41) × (3,461,641/41) = 2,241,337 HTTs.
Acknowledgments
This work was supported by the University of Perpignan, CNRS, and IRD; a PhD fellowship from the CNRS and Region Languedoc-Rousillon to M.E.B.; an Agence Nationale de la Recherche grant (AZORIZ) to N.P.; and a Labex grant from the Agropolis Fondation (RETROCROP 1202-041) to M.M. and O.P. We thank N. Billotte, A. D'Hont, E. Guiderdoni, C. Roux, P. This, and J. Wood for providing DNA material; and M.A. Grandbastien and T. Wicker for their useful comments on the manuscript.
Footnotes
[Supplemental material is available for this article.]
Article published online before print. Article, supplemental material, and publication date are at http://www.genome.org/cgi/doi/10.1101/gr.164400.113.
Freely available online through the Genome Research Open Access option.
References
- The Angiosperm Phylogeny Group. 2009. An update of the Angiosperm Phylogeny Group classification for the orders and families of flowering plants: APG III. Bot J Linn Soc 161: 105–121 [Google Scholar]
- Bennetzen JL 2000. Transposable element contributions to plant gene and genome evolution. Plant Mol Biol 42: 251–269 [PubMed] [Google Scholar]
- Diao X, Freeling M, Lisch D 2006. Horizontal transfer of a plant transposon. PLoS Biol 4: e5. [DOI] [PMC free article] [PubMed] [Google Scholar]
- Eickbush TH, Malik HS 2002. Origin and evolution of retrotransposons. In Mobile DNA II (ed. Craig NL, et al.), pp. 1111–1144. ASM Press, Washington DC [Google Scholar]
- El Baidouri M, Panaud O 2013. Comparative genomic paleontology across plant kingdom reveals the dynamics of TE-driven genome evolution. Genome Biol Evol 5: 954–965 [DOI] [PMC free article] [PubMed] [Google Scholar]
- Ellinghaus D, Kurtz S, Willhoeft U 2008. LTRharvest, an efficient and flexible software for de novo detection of LTR retrotransposons. BMC Bioinformatics 9: 18. [DOI] [PMC free article] [PubMed] [Google Scholar]
- Feschotte C 2008. Transposable elements and the evolution of regulatory networks. Nat Rev Genet 9: 397–405 [DOI] [PMC free article] [PubMed] [Google Scholar]
- Finnegan DJ 1985. Transposable elements in eukaryotes. Int Rev Cytol 93: 281–326 [DOI] [PubMed] [Google Scholar]
- Galtier N, Gouy M, Gautier C 1996. SEAVIEW and PHYLO_WIN: two graphic tools for sequence alignment and molecular phylogeny. Comput Appl Biosci 12: 543–548 [DOI] [PubMed] [Google Scholar]
- Gilbert C, Schaack S, Pace JK, Brindley PJ, Feschotte C 2010. A role for host-parasite interactions in the horizontal transfer of transposons across phyla. Nature 464: 1347–1350 [DOI] [PMC free article] [PubMed] [Google Scholar]
- Kobayashi S, Goto-Yamamoto N, Hirochika H 2004. Retrotransposon-induced mutations in grape skin color. Science 304: 982. [DOI] [PubMed] [Google Scholar]
- Kuraku S, Qiu H, Meyer A 2012. Horizontal transfers of Tc1 elements between teleost fishes and their vertebrate parasites, lampreys. Genome Biol Evol 4: 929–936 [DOI] [PMC free article] [PubMed] [Google Scholar]
- Ma J, Bennetzen JL 2004. Rapid recent growth and divergence of rice nuclear genomes. Proc Natl Acad Sci 101: 12404–12410 [DOI] [PMC free article] [PubMed] [Google Scholar]
- Miele V, Penel S, Duret L 2001. Ultra-fast sequence clustering from similarity networks with SiLiX. BMC Bioinformatics 12: 116. [DOI] [PMC free article] [PubMed] [Google Scholar]
- Mower JP, Stefanović S, Young GJ, Palmer JD 2004. Plant genetics: gene transfer from parasitic to host plants. Nature 432: 165–166 [DOI] [PubMed] [Google Scholar]
- Piegu B, Guyot R, Picault N, Roulin A, Sanyal A, Kim H, Collura K, Brar DS, Jackson S, Wing RA, et al. 2006. Doubling genome size without polyploidization: dynamics of retrotransposition-driven genomic expansions in Oryza australiensis, a wild relative of rice. Genome Res 16: 1262–1269 [DOI] [PMC free article] [PubMed] [Google Scholar]
- Prak ET, Kazazian HH Jr 2000. Mobile elements and the human genome. Nat Rev Genet 1: 134–144 [DOI] [PubMed] [Google Scholar]
- Rebollo R, Romanish MT, Mager DL 2012. Transposable elements: an abundant and natural source of regulatory sequences for host genes. Annu Rev Genet 46: 21–42 [DOI] [PubMed] [Google Scholar]
- Rigal M, Mathieu O 2011. A “mille-feuille” of silencing: epigenetic control of transposable elements. Biochim Biophys Acta 1809: 452–458 [DOI] [PubMed] [Google Scholar]
- Rocha EPC 2013. With a little help from prokaryotes. Science 8: 1154–1155 [DOI] [PubMed] [Google Scholar]
- Roulin A, Piegu B, Fortune PM, Sabot F, D'Hont A, Manicacci D, Panaud O 2009. Whole genome surveys of rice, maize and sorghum reveal multiple horizontal transfers of the LTR-retrotransposon Route66 in Poaceae. BMC Evol Biol 9: 58. [DOI] [PMC free article] [PubMed] [Google Scholar]
- Schaack S, Gilbert C, Feschotte C 2010. Promiscuous DNA: horizontal transfer of transposable elements and why it matters for eukaryotic evolution. Trends Ecol Evol 25: 537–546 [DOI] [PMC free article] [PubMed] [Google Scholar]
- Slotkin RK, Martienssen R 2007. Transposable elements and the epigenetic regulation of the genome. Nat Rev Genet 8: 272–285 [DOI] [PubMed] [Google Scholar]
- Sun BF, Xiao JH, He S, Liu L, Murphy RW, Huang DW 2013. Multiple interkingdom horizontal gene transfers in Pyrenophora and closely related species and their contributions to phytopathogenic lifestyles. PLoS ONE 8: e60029. [DOI] [PMC free article] [PubMed] [Google Scholar]
- Vitte C, Panaud O 2005. LTR retrotransposons and flowering plant genome size: emergence of the increase/decrease model. Cytogenet Genome Res 110: 91–107 [DOI] [PubMed] [Google Scholar]
- Wallau GL, Ortiz MF, Loreto EL 2012. Horizontal transposon transfer in eukarya: detection, bias, and perspectives. Genome Biol Evol 4: 689–699 [DOI] [PMC free article] [PubMed] [Google Scholar]
- Walsh AM, Kortschak RD, Gardner MG, Bertozzi T, Adelson DL 2013. Widespread horizontal transfer of retrotransposons. Proc Natl Acad Sci 110: 1012–1016 [DOI] [PMC free article] [PubMed] [Google Scholar]
- Wicker T, Sabot F, Hua-Van A, Bennetzen JL, Capy P, Chalhoub B, Flavell A, Leroy P, Morgante M, Panaud O, et al. 2007. A unified classification system for eukaryotic transposable elements. Nat Rev Genet 8: 973–982 [DOI] [PubMed] [Google Scholar]
- Zhang Z, Li J, Zhao XQ, Wang J, Wong GKS, Yu J 2006. KaKs_Calculator: calculating Ka and Ks through model selection and model averaging. Genomics Proteomics Bioinformatics 4: 259–263 [DOI] [PMC free article] [PubMed] [Google Scholar]
- Zhang N, Zeng L, Shan H, Ma H 2012. Highly conserved low-copy nuclear genes as effective markers for phylogenetic analyses in angiosperms. New Phytol 195: 923–937 [DOI] [PubMed] [Google Scholar]