Abstract
We describe a novel two-photon fluorescence microscopy system capable of producing high quality SHG images in thick turbid media by using an innovative detection system. This novel detection system is capable of detecting photons from a very large surface area. This system has proven effective in providing images of thick turbid samples, both biological and artificial. Due to its transmission detection geometry, the system is particularly suitable for detecting second harmonic generated signals (SHG) which are generally forward directed. In this paper we present comparative data acquired simultaneously on the same sample with the forward and epi-detection schemes.
Keywords: second harmonic generation (SHG), two-photon microscopy, deep tissue imaging
1. Introduction
Second harmonic generation (SHG) is an extremely useful optical tool for biological and medical imaging and diagnostics (Campagnola et al., 2011). The physical process of SHG does not involve absorption to generate contrast, as is the case of multi-photon fluorescence microscopy, but arises from the electronic polarizability of specific endogenous structures lacking center of symmetry, thus not requiring staining of the sample. SHG can also be induced with near IR fundamental lasers frequencies, which allows for an increase in imaging depth in biological tissue. Unlike fluorescence, which produces an isotropic emission, SHG is a coherent process in which the scattered beam produces a directed radiation whose directionality is strongly correlated to the arrangement of the harmonophores inside the scattering volume (Mertz et al., 2001). This feature makes it suitable, for instance, for measurement of electric phenomena occurring at the membrane of excitable cells (Dombeck et al., 2005). The low signal generated by the variation in action potential is masked by the shot noise in the case of one-photon excitation, while the SHG signal, being circumscribed at the specifically oriented molecules in the membrane can be separated from the background (Dombeck et al., 2005).
Due to its unique properties, SHG has established itself as a powerful imaging technique, both ex vivo and in vivo, and it has been successfully used in the imaging of diseases of connective tissue (Campagnola et al., 2011). Collagen, the most abundant component of the extra-cellular matrix (ECM), generates a very strong second harmonic signal. Many diseases, such as ovarian (Nadiarnykh et al., 2010) and breast cancer (Ajeti et al., 2011) are characterized by a remodeling of the ECM, and by imaging the collagen fibrils morphology and reassembly, the stage and malignancy of the disease can be inferred. In the disease tissue the arrangement of the fibers changes the ratio between the forward and backward scattered signal. An accurate measurement of these quantities can provide important information of the invasiveness of the disease in the tissue (Nadiarnykh et al., 2010; Ajeti et al., 2011)
Myosin is another abundant harmonophore in biological tissue. Currently, the diagnosis of many muscular disorders (MD) is commonly performed with magnetic resonance imaging (MRI) or quantitative computer tomography (Preedy et al., 2002), which is non-invasive, but can only provide approximate quantitative information on the state of the tissue. The abundance of myosin, a very strong harmonophore, in biological tissue, makes SHG imaging an ideal candidate for imaging thick muscle sections with high contrast and resolution (Plotnikov et al., 2008). Furthermore, monitoring the sarcomere striation pattern and its length can give important information on the progression of muscular disease. SHG is also useful in lung structural imaging (Abraham et al., 2011), in monitoring the remolding of ECM which occurs in the cases of emphysema and lung cancer.
Due to its non-invasiveness and optical sectioning capability, Second Harmonic Generation Microscopy (SHGM) is rapidly expanding as a successful biological imaging and medical diagnostic tool. As with any other imaging system, the main requirements are resolution, non-invasiveness and depth of penetration. The conventional non-linear microscopes on the market suffer from two main limitations: they are incapable of imaging past 500 microns in turbid samples and function in the epi-fluorescence configuration, while SHG photons tend to propagate in the forward direction due to phase constrains of the coherent process (Bianchini et al., 2008). To obviate this problem (Plotnikov et al., 2001; Moreaux et al., 2000), a collection objective with high NA was added to the conventional microscope set-up to harvest SHG photons scattered in the forward direction, while the epi-objective would collect the backscattered fraction.
The system presented in this paper is designed with characteristics that make it intrinsically optimal for SHGM. It is also capable of imaging in turbid samples up to the depth of a few mm (Crosignani et al., 2011) and it is designed in the transmission geometry to collect photons by a photomultiplier tube (PMT) with large area photocathode directly from a wide area of the sample surface. As shown the system is effective in both harvesting of fluorescence photons (isotropic) and capturing SHG photons.
2. Materials and Methods
2.1 Samples of cells embedded in collagen matrix
Type I collagen was purchased from BD Biosciences (Franklin Lakes, NJ), with original concentration of 3.75mg/ml. Collagen was diluted with 10X PBS with phenol red and water to final concentration of 1X PBS and 2mg/ml collagen solution. NaOH was added to neutralize collagen solution before mixing with cells. MDA-MB-231cells expressing paxillin-GFP grown in serum free DMEM were mixed with 2mg/ml collagen solution, with the final concentration of 5 × 10⁴ cells/ml. Collagen/cell mixture was polymerized at 20°C for 1 hr and then at 37°C for 20 min. Full medium was applied after polymerization. Measurements were performed 2 to 4 days after cells were cultured in the collagen matrix.
2.2 Silicone tissue phantoms with urea crystals
Silicone tissue phantoms (scattering coefficient μs’=1.13 mm−1 at 800nm wavelength) were prepared according to (Ayers et al., 2008). Urea crystals were obtained by putting a droplet of urea solution on a silicone slide surface and the solvent (water) was subsequently evaporated to form crystals. The crystals were then sandwiched between two slices of scattering silicone resin.
2.3. Muscle
Mouse muscle fibers from the medial thigh muscle of C57/B6 mice were imaged. After euthanasia by CO2 inhalation (Approved Animal Protocol 2012-3060), the skin was removed and the muscle excised and imaged. All animal housing and procedures were approved by the Institutional Animal Use and Care Committee of the University of California Irvine.
2.4 Imaging system
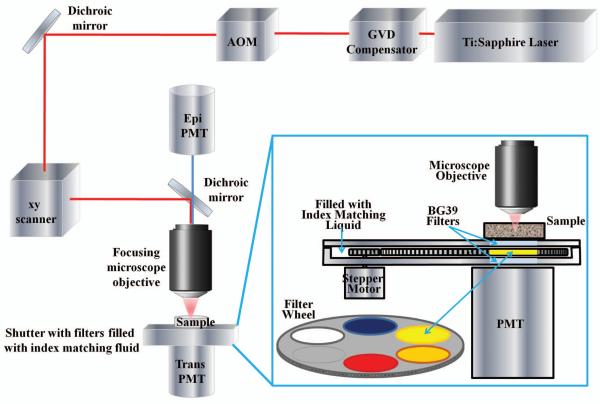
The imaging system described here is based on a custom made upright two photon excitation microscope with a specifically designed emission detection to maximize light collection in the transmission side of the microscope. The principles of operation of this microscope were previously described (Crosignani et al., 2011). Here we describe the modified system for SHG detection, shown schematically in Figure 1.
Figure 1.
Schematic diagram of the experimental system. Tunable Ti:Sa laser generates 140 fs NIR light pulses; GVD compensator is used to maximize signal from the sample; acousto-optic modulator (AOM) is used to adjust excitation beam power. The excitation beam is passed through the x-y scanner coupled to the microscope objective and focused inside the sample. The sample is directly placed on the detection module: enlargement shows details of the module construction. Additional detector (epi-PMT) is used to compare the imaging performance of two detection schemes.
A tunable short pulsed Ti:Sa laser (Mai Tai, Spectra Physics, Irvine, CA) was used for two-photon fluorescence excitation. The laser was coupled to a group velocity dispersion compensator (DeepSee, Spectra Physics, Irvine, CA) to achieve maximum fluorescence excitation efficiency in the sample. The acousto-optic modulator (AOM, MT 110-B50A1, AA Opto-Electronics, Orsay, France) was used to adjust the power of the excitation beam. The beam was then directed to a x-y galvanometric scanner (ISS, Inc., Champaign, IL) coupled with an Olympus BX illumination module equipped with long working distance objectives (LCPlanFl 20x/0.4 and LUMPlanFl 40x/0.80 W, Olympus, Tokyo, Japan). The sample was directly placed on the detection module operating in transmission configuration (described below). The detection module is attached to a motorized x-y-z stage for positioning of the specimen and focusing.
The detector used in the transmission configuration is the key feature of this imaging system which allows us to image in turbid samples up to the depth of a few millimeters (Crosignani et al., 2011). This system has also been proven to be efficient in the detection of SHG photons, due to their intrinsic forward propagation, as will be shown below. The detector described here was further modified by adding a filter wheel to separate the emission photons by wavelength. The detector comprises of a large photocathode area head-on PMT (R7600P-300, Hamamatsu, Japan), coupled to the shutter. The PMT operates in photon counting mode. The shutter is custom made of a sealed aluminum casing that houses the filter wheel rotated by the stepper motor. The optical path between the sample and the PMT window is completely index matched with an index matching liquid to minimize losses of fluorescence and SHG photons due to multiple reflections at the boundaries. This detection scheme allows for the efficient collection of emission photons directly from the wide surface area of the sample, which makes it highly sensitive to very low signal levels.
The system is also equipped with a second PMT (H7422P-40, Hamamatsu, Japan) that works in the epi-fluorescence configuration to compare the results between the conventional 2-photon fluorescence microscope configuration and the system here presented.
Data acquisition is performed using the SimFCS software developed at LFD, commercially available as Globals for Images (www.lfd.uci.edu). Depending on the signal quality, the images (256 × 256 pixels) are averaged over 10-20 frames. The pixel dwell time is 32 μsec.
Because the intensity of ballistic photons that induce the signal at the focal point decreases exponentially with depth, the excitation laser power was increased with depth to maintain the signal level.
3. Results
To ensure that the differences in image intensities acquired by epi- and trans-PMT are due to the emission photons collection schemes rather than to differences in the PMTs sensitivity, we have measured signal intensities from a thin film of yellow-green fluorescence beads (Invitrogen, Carlsbad, CA) placed on the surface of a glass slide. The signals measured by both epi- and trans- PMT were about the same intensity, which implies that the two PMTs have a similar sensitivity to the isotropic fluorescence signal from the thin fluorescent layer on the transparent sample.
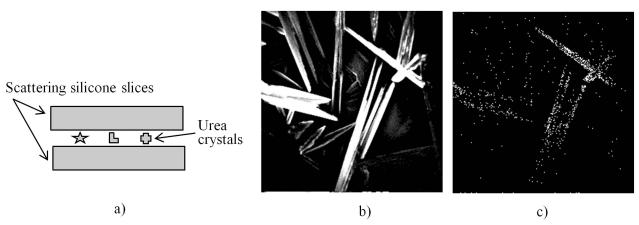
Urea crystals are known to give a very strong second harmonic signal (Romani et al., 1996). SHG signal is intrinsically forward directed and thus the transmission setup employed in our imaging system is particularly suitable for its detection. Figure 2 shows SHG images of urea crystals sandwiched between two scattering silicone slices each 2 mm thick. Using the same laser power, the intensity of the images acquired by the trans-PMT is higher than the ones acquired by the epi-PMT. The ratio of image intensities was calculated to be 785:1. The SHG signal can also be detected by the epi-PMT because the SHG photons are redirected by multiple scattering to the epi-detector. Since, the scattering is preferentially forward directed (Zipfel et al., 2003), the SHG detection efficiency of the trans-PMT is much higher.
Figure 2.
SHG images of urea crystals between two 2 mm thick scattering silicone slices. Imaging setup (a). Image acquired by the trans-PMT (b). Image acquired by the epi-PMT (c). Excitation wavelength 800 nm, field of view 200 × 200 microns.
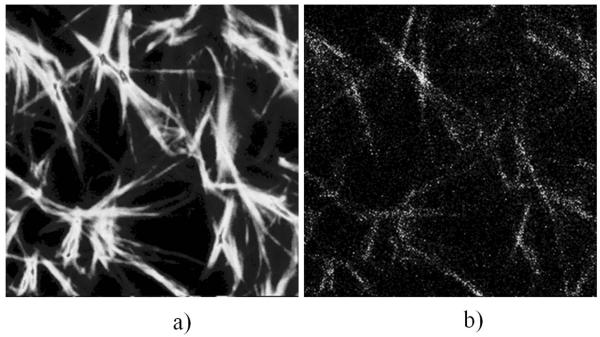
Collagen, due to its non-centrosymmetric structure, gives SHG signal, and since it’s highly abundant in biological tissues, its detection is very relevant in medicine and biology (Nadiarnykh et al., 2010; Ajeti et al., 2011). Figure 3 shows SHG images of collagen fibers in collagen matrix prepared as described in the experimental section. These images were acquired simultaneously by the trans- and epi-PMT to compare the sensitivity to SHG signals of the two detection schemes. While the trans-PMT detected SHG signal from the collagen fibers which is generated at a very low excitation laser output power (3mW), the epi-PMT was not able to acquire any images at this low power level. Moreover, the laser output power had to be increased to about 100 mW to acquire reasonable quality SHG images of collagen fibers with the epi-PMT. Figures 3a and 3b shows the images of collagen fibers acquired by the trans- and epi-PMT respectively at the same excitation laser power. The ratio of intensities for these images was measured to be ~300:1. This ratio depends on imaging depth and increases for images acquired at deeper layers.
Figure 3.
SHG images of collagen fibers imaged by the trans-PMT (a) and epi-PMT (b). Images are acquired at excitation laser output power 100 mW, excitation wavelength 800 nm, field of view 50 × 50 microns, depth 20μm.
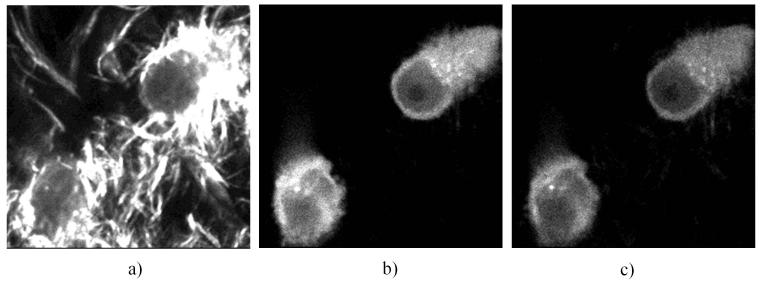
Figure 4 shows the images of the collagen matrix embedded with MDA-MB-231 cells expressing paxillin-GFP. These images were acquired at 700 μm depth and at the same excitation laser power level. Figure 4a shows the image of collagen fibers and the fluorescent cells acquired by the trans- PMT without an emission wavelengths separation filter. The SHG signal of the collagen fiber is markedly strong and masks the fluorescent signal from the cells. In order to enhance the fluorescent cells with the trans-PMT we used a long pass filter (LP 455) which blocked the SHG signal at 400 nm (Fig. 4b). Figure 4c shows the fluorescence image of the cell acquired by the epi-PMT. While the isotropic fluorescence signal emitted by the cells is comparable on both detectors (Fig. 4b and 4c) the SHG signal from the fibers could be detected with the trans-PMT but not by the epi-PMT when using the same laser power level.
Figure 4.
Fluorescence and SHG images of the collagen matrix embedded with MDA-MB-231 cells expressing paxillin-GFP, acquired by the trans-PMT without emission wavelength separation filter (a) and with a long-pass filter (b); image acquired by the epi-PMT (c). Excitation wavelength 800 nm, field of view 50 × 50 microns.
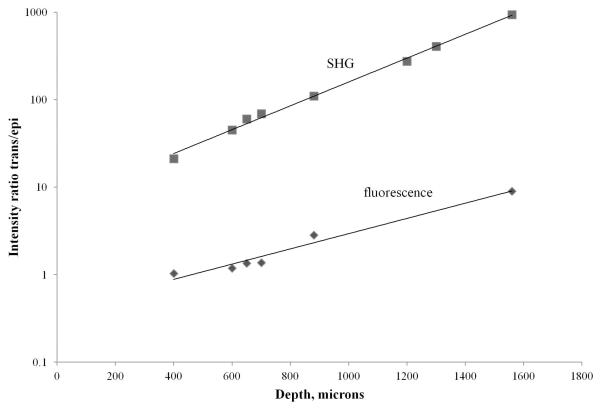
We have measured the intensity of the SHG signal from the collagen fibers and the intensity of the isotropic fluorescence of the paxillin-GFP cells acquired by the trans-PMT and by the epi-PMT at various depths and calculated the intensity ratio. Figure 5 shows the plot of the intensity ratio as a function of imaging depth. As it is shown, the signal ratio for both SHG (top curve) and fluorescence (bottom curve) increases with imaging depth.
Figure 5.
Plot of the intensities ratio for SHG and fluorescence images acquired by the trans-PMT and epi-PMT as a function of imaging depth. The images were acquired from a collagen matrix embedded with MDA-MB-231cells expressing paxillin-GFP. The collagen matrix was extracted from the well and placed in a standard 35 mm Petri-dish with a glass window. The thickness of the sample was about 4 mm.
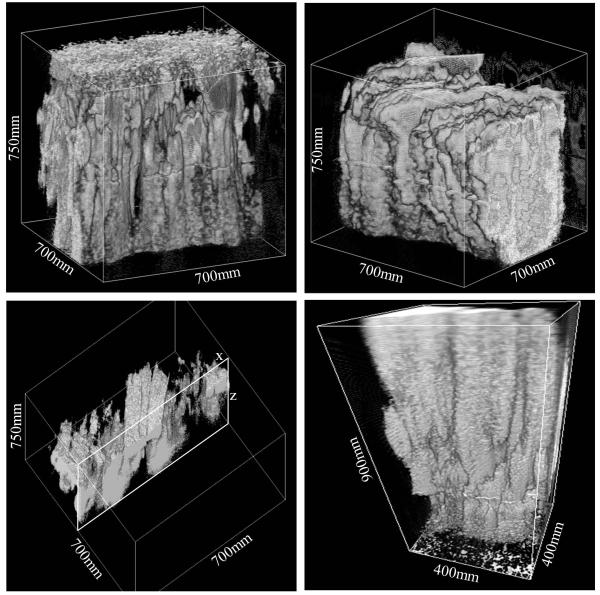
As an example of SHG in biological tissue, we have imaged the medial thigh muscle of a mouse obtained from the upper region of the leg. The muscle, roughly 3-4mm thick, was placed on a glass bottom MatTek petri dish and immersed in PBS. Subsequently a cover slip was placed on top of the specimen. We used a LUMPlanFl 40x/0.80 W water objective to image the muscle fibers. The acquired z-stack images of the muscle were taken at 3μm step up to 900μm depth. Multiple z-stack images were acquired at field of view ranging from 400-700μm. All images and 3D reconstructions were obtained using the SimFCS software developed at LFD. Figure 6 shows the 3D reconstruction of the SHG images of the muscle fibers acquired up to the depth of 900 μm, which is very high considering the scattering of the medium.
Figure 6.
3D reconstruction of the SHG images of a mouse medial thigh muscles. The representative images were obtained using an automated routine acquiring z-stack at 3μm step and depths ranging from 750-900 μm. These images show muscle fibers oriented in a vertical direction and cross linked (the bottom-left image shows the xz-slice of the sample). The figure taken at 400 μm field of view (bottom-right) also shows striations going across individual fibers.
4. Discussion
As mentioned above, SHG signals propagate mainly in the same direction of the excitation light. Our detection system is built in the transmission configuration, so that the excitation comes from the objective on the top of the sample and the emission is collected from the opposite side of the sample. Because emission photons are collected by the detector practically at any entrance angle the effective numerical aperture (NA=n sin90°, where we assume that n=1.33 is the index of refraction of water) in the forward direction is above 1. This explains our system’s superior detection capability of a forward directed signal, such as SHG, in comparison with the epifluorescence detection scheme. As a consequence, the traditional epi-fluorescence configuration requires much more excitation power to yield the same intensity SHG images.
A sample emitting both fluorescence and SHG photons will give comparable fluorescent images on both PMTs, since fluorescence is isotropic, but much poorer SHG images will be detected on the epi-PMT, because SHG photons preferably propagate toward the trans- PMT. Fluorescence photons, which propagate isotropically, will be detected by the epi-PMT more efficiently than SHG photons. However, as it was shown in our previous publication (Crosignani et al., 2011), when compared to the traditional epi-detection scheme, the trans-detector described here has an advantage in the collection of scattered emission photons from the wide sample area at almost any entrance angle. This feature greatly increases the efficiency of photon collection so that fluorescence images detected by the trans-PMT appear brighter than those acquired by the epi-PMT, and this difference increases noticeably with imaging depth (Fig. 5).
Traditionally, in order to more efficiently acquire SHG images conventional microscopes needed to be equipped with an additional objective on the other side of the sample to collect the SHG photons (Plotnikov et al., 2001; Moreaux et al., 2000). However, a microscope objective can only collect photons from the relatively small area of the sample (Crosignani et al., 2011), while our detection system is designed for the purpose of collecting photons from a large surface area of the sample, which makes it highly efficient when imaging turbid media, such as biological tissues. In the case of SHG imaging of biological tissues, where generated photons are inevitably scattered by the media, and yet they propagate in the direction of the excitation light (the scattering is essentially forward directed for about 1 mm in these samples), our detection method is very efficient in collecting these photons and producing high quality images, while in the reflection geometry we can barely detect the signal.
5. Conclusions
We have built a system that is highly efficient for the acquisition of SHG signals. Traditional microscopes require much higher excitation power levels to match the image intensity acquired by the PMT in the transmission configuration. Here we have shown that in both scattering silicone samples containing urea crystals and collagen matrices with and without cells we can successfully image with superior image quality when compared to the traditional microscope configuration. Many clinical cases, such as cancer and muscle diseases, are associated with changes in structures that emit SHG signal (e.g. collagen and myosin). In the future, our system could prove very valuable for diagnostics and medical imaging. Moreover, the lower excitation laser power required for data acquisition minimizes photo-damage.
Acknowledgements
Research reported in this publication was supported by National Institutes of Health under award number P50 GM076516, by the National Center for Research Resources under award number 5P41RR003155-27 and the National Institute of General Medical Sciences under award number 8 P41 GM103540-27 and by a grant from the W.M. Keck Foundation KF50242.
Footnotes
Disclaimer The content is solely the responsibility of the authors and does not necessarily represent the official views of the National Institutes of Health.
References
- Abraham T, Wadsworth S, Carthy JM, Pechkovski DV, McManus B. Minimally invasive imaging method based on second harmonic generation and multiphoton excitation fluorescence in translational respiratory research. Respirology. 2011;16:22–33. doi: 10.1111/j.1440-1843.2010.01898.x. [DOI] [PubMed] [Google Scholar]
- Ajeti V, Nadiarnykh O, Ponik SM, Keely PJ, Eliceiri KW, Campagnola PJ. Structural changes in mixed Col I/Col V collagen gels probed by SHG microscopy: implications for probing stromal alterations in human breast cancer. Biomed Opt Express. 2011;2(8):2307–2316. doi: 10.1364/BOE.2.002307. [DOI] [PMC free article] [PubMed] [Google Scholar]
- Ayers F, Grant A, Kuo D, Cuccia DJ, Durkin AJ. Fabrication and characterization of silicone-based tissue phantoms with tunable optical properties in the visible and near infrared. Proc. SPIE. 2008;6870:687007-1–9. [Google Scholar]
- Bianchini P, Diaspro A. Three-dimensional (3D) backward and forward second harmonic generation (SHG) microscopy of biological tissues. J Biophoton. 2008;1(6):443–450. doi: 10.1002/jbio.200810060. [DOI] [PubMed] [Google Scholar]
- Campagnola PJ, Dong C. Second harmonic generation microscopy: principles and applications to disease diagnosis. Laser Photon Rev. 2011;5(1):13–26. [Google Scholar]
- Crosignani V, Dvornikov AS, Gratton E. Enhancement of imaging depth in turbid media using a wide area detector. J Biophoton. 2011;4(9):592–599. doi: 10.1002/jbio.201100001. [DOI] [PMC free article] [PubMed] [Google Scholar]
- Dombeck DA, Sacconi L, Blanchard-Desce M, Webb WW. Optical Recording of Fast Neuronal Membrane Potential Transients in Acute Mammalian Brain Slices by Second-Harmonic Generation Microscopy. J Neurophysiol. 2005;94:3628–3636. doi: 10.1152/jn.00416.2005. [DOI] [PubMed] [Google Scholar]
- Mertz J, Moreaux L. Second-harminc generation by focused excitation of inhomogeneously distributed scatterers. Opt Commun. 2001;196:325–330. [Google Scholar]
- Moreaux L, Sandre O, Blanchard-Desce M, Mertz J. Membrane imaging by simultaneous second-harmonic generation and two-photon microscopy. Opt Lett. 2000;25(5):320–322. doi: 10.1364/ol.25.000320. [DOI] [PubMed] [Google Scholar]
- Nadiarnykh O, LaComb RB, Brewer MA, Campagnola PJ. Alterations of the extracellular matrix in ovarian cancer studied by Second Harmonic Generation imaging microscopy. BMC Cancer. 2010;10:94. doi: 10.1186/1471-2407-10-94. [DOI] [PMC free article] [PubMed] [Google Scholar]
- Plotnikov SV, Kenny AM, Walsh SJ, Zubrowski B, Joseph C, Scranton VL, Kuchel GA, Dauser D, Xu M, Pilbeam CC, Adams DJ, Dougherty RP, Campagnola PJ, Mohler WA. Measurement of muscle disease by quantitative second-harmonic generation imaging. J Biomed Opt. 2008;13(4):044018. doi: 10.1117/1.2967536. [DOI] [PubMed] [Google Scholar]
- Preedy V, Peters T. Skeletal Muscle: Pathology, Diagnosis and Management of Disease. Cambridge University Press; UK: 2002. [Google Scholar]
- Romani S, Razzetti C, Zha M, Paorici C. Evaluation of the effective second harmonic generation coefficient of monomethyl urea single crystals. Phys Stat Sol b. 1996;197:271–276. [Google Scholar]
- Zipfel WR, Williams RM, Watt WW. Non-linear magic: multiphoton microscopy in the biosciences. Nat Biotechnol. 2003;21(11):1369–1377. doi: 10.1038/nbt899. [DOI] [PubMed] [Google Scholar]


