

Abstract
The diffusion decision model (Ratcliff, 1978) was used to examine discrimination for a range of perceptual tasks: numerosity discrimination, number discrimination, brightness discrimination, motion discrimination, speed discrimination, and length discrimination. The model produces a measure of the quality of the information that drives decision processes, a measure termed “drift rate” in the model. As drift rate varies across experimental conditions that differ in difficulty, a psychometric function that plots drift rate against difficulty can be constructed. Psychometric functions for the tasks in this article usually plot accuracy against difficulty, but for some levels of difficulty, accuracy can be at ceiling. The diffusion model extends the range of difficulty that can be evaluated because drift rates depend on response times (RTs) as well as accuracy and when RTs decrease across conditions that are all at ceiling in accuracy, then drift rates will distinguish among the conditions. Signal detection theory assumes that the variable driving performance is the z-transform of the accuracy value and somewhat surprisingly, this closely matches drift rate extracted from the diffusion model when accuracy is not at ceiling, but not sometimes when accuracy is high. Even though the functions are similar in the middle of the range, the interpretations of the variability in the models (e.g., perceptual variability, decision process variability) are incompatible.
In recent research, sequential sampling models have come to provide good accounts of the processes involved in making simple decisions (e.g., Pleskac & Busemeyer, 2010; Ratcliff; 1978; Ratcliff & McKoon, 2008; Ratcliff & Starns, 2009; Roe, Busemeyer, & Townsend, 2001; Usher & McClelland, 2001; Wagenmakers, 2009). They show how response times (RTs) and accuracy jointly arise from the components of processing that underlie performance. One of these components, the decision variable, is the quality of the information from a stimulus upon which a decision is based.
Traditionally, psychometric functions that measure the effect of an independent variable on performance have been constructed from accuracy measures. Psychometric functions have been important in sensory domains such as audition and vision. In these domains, thresholds are sometimes measured to serve as an index of declines in performance from, for example, age or disease. In such applications, the precise shape of a psychometric function can have strong implications for theoretical interpretations of decrements in performance.
In early research, accuracy was represented as the area under a normal distribution above some criterion, and so the psychometric function was a cumulative normal distribution (e.g., Woodworth, 1938). If the internal representation of the stimulus is normally distributed and if the SD is constant, then changes in stimulus strength will correspond to movement of the normal distribution along the independent variable, as in signal detection theory (SDT). If accuracy values are transformed to z-scores, then the psychometric function of z-transformed accuracy is a straight line. Other functions have been proposed, for example, the logistic and Weibull (Macmillan & Creelman, 1991). But what is really needed is a model of stimulus processing that will produce values of the variable driving the decision process and hence the psychometric function. Examples of such models are Nosofsky, Little, Donkin, and Fific (2011), Nosofsky and Palmeri (1997), Ratcliff (1981), Smith and Ratcliff (2009), andWhite et al. (2011).
In this article, a range of perceptual and cognitive paradigms is used to provide a collection of empirical psychometric functions. The tasks are two-choice tasks in which conditions move from easy for one of the choices to difficult for both choices to easy for the other choice. For each task, I compare psychometric functions based on accuracy and z-transforms of accuracy to psychometric functions based on the decision variable of a sequential sampling model. I argue that it is only by use of a model that maps accuracy and RTs jointly to underlying components of processing that a complete picture of the information that drives decisions, and how that information is affected by experimental variables, can be obtained. I stress a crucial difference between SDT and sequential sampling models: in the former, information from a stimulus representation is mapped directly to responses, whereas in the latter, decision processes intervene between the information and responses. This difference means that psychometric functions based on the decision variable can have different shapes than psychometric functions based on accuracy or z-transforms of it. Note that strictly speaking, a psychometric function relates a stimulus magnitude to an observed dependent measure such as accuracy (Link, 1992, p. 40), but here I use the term more loosely to include drift rate functions and transformed accuracy functions. Drift rate functions can be seen as transformations of three dependent variables, accuracy, the distributions of RTs for correct responses, and the distributions of RTs for errors.
The model that I used was the diffusion model for simple two-choice decisions, developed in Ratcliff (1978) and summarized by Ratcliff and McKoon (2008). In this model, the value of the decision variable (drift rate) for a stimulus drives a gradual accumulation of noisy evidence toward one or the other of two criteria, one criterion for each of the two choices. A response is executed when the accumulation reaches one of the criteria. The time taken for a decision is the time taken by this process plus the time taken by nondecision processes, which include the processes of stimulus encoding and response execution. The model separates the contributions to performance of these components of processing-- drift rates, decision criteria, and nondecision processes.
The diffusion model is a proposal about the cognitive and neural processes involved in human decision making. It and variants of it have helped to understand the neural bases of decision making in studies of animal neuroscience (e.g., Gold & Shadlen, 2001; Hanes & Schall, 1996; Schall et al., 2011; Ratcliff, Cherian, & Segraves, 2003; Wong & Wang, 2006) and the neural correlates of decision making in studies of human neuroscience (e.g., Heekeren et al., 2004; Philiastides et al., 2006), including the time course of decision processes and the brain areas involved in them. For these and all other applications, the model can be accepted as successful only if it is falsifiable; Ratcliff (2002) and Ratcliff and Starns (in press) have demonstrated that it is.
The diffusion model can also be used as a measurement tool (e.g., van der Maas et al., 2011; Tuerlinckx & De Boeck, 2005), for example, to measure differences among individuals in components of processing. The individual difference variables that have been examined include age (elderly, college-age, children; e.g., Ratcliff et al., 2001, 2003, 2004, 2010; Ratcliff, Love, Thompson, & Opfer, 2012; Spaniol, Madden, & Voss, 2006), ADHD (Huang-Pollack et al., in press; Mulder et al., 2010), dyslexia (Zeguers et al., 2011), sleep-deprivation (Ratcliff & Van Dongen, 2009), hypoglycemia (Geddes et al., 2010), alcohol (van Ravenzwaaij, Dutilh, & Wagenmakers, 2012), depression (White et al., 2009; 2010a), and anxiety (White et al., 2009; 2010b). The studies of the effects of age on cognition have been particularly noteworthy. The model has provided an explanation of RTs and accuracy that solves the puzzle that RTs often show a deficit in performance for older adults relative to young adults (generalized slowing, Ratcliff, Spieler, & McKoon, 2000) whereas accuracy shows no deficit. The diffusion model resolves this by showing that older adults are slower than young adults because they value accuracy over speed more than young adults do. They set more conservative decision criteria and their nondecision processes are longer (e.g., Starns & Ratcliff, 2010, 2012) but the quality of the information upon which their decisions are based (drift rates) does not differ.
For the experiments described below, the model was used as a measurement tool in a different way. From a theoretical perspective, drift rates provide a meeting point between decision processes and the perceptual or cognitive encoding processes that produce the information needed for decisions and transform it into a representation on which decisions are based. Thus mapping out the effects on drift rate of an independent variable across a range of values provides a compelling target for models of perceptual or cognitive processing. Such models should produce values of drift rate that, when translated through the diffusion model, lead to an accurate account of RTs and accuracy. In the experiments below, the ranges of the independent variables were wider than is usually considered in order to examine drift rates for accuracy values from floor to ceiling. One salient finding was that drift rates can continue to change across conditions for which accuracy is at ceiling. In this way, drift rates provide more information about performance than does accuracy alone or z-transforms of accuracy.
In the diffusion model, psychometric functions of drift rates replace the three functions that would otherwise be required to describe performance, one for accuracy (or the z-transform of accuracy) and one each for RTs for the two choices (including correct responses and errors). A sigmoid is the usual shape for response proportion functions for the two-choice tasks used in the experiments described here. For example, in a task for which subjects are asked to decide whether an array of pixels is “bright” or “dark,” the proportion of “bright” responses is near 1 for 100% white pixels, stays near 1 as the proportion is reduced to about 75%, drops to near 0 when the proportion is 25% white pixels, then stays there until the proportion is zero. The functions for RT are inverse V-shaped: RTs are short for very bright and very dark stimuli (for both correct and error responses) and increase to a maximum for stimuli in the middle of the range. In the paradigms presented in this article, the psychometric functions of drift rates sometimes followed the functions of accuracy and z-transforms of accuracy and sometimes not. When drift rates changed across conditions for which accuracy was at ceiling, it was because RTs changed across those conditions.
It should be noted that the use of a sequential sampling model to describe the quality of the information produced by perceptual or cognitive processes is not new. In 1992, Link reviewed the uses of psychometric functions of accuracy and RTs from the 1800’s through the early 1900’s. To produce psychometric functions of a decision variable that reflected both accuracy and RTs, he applied a random walk sequential sampling model (a random walk approaches a diffusion process in the limit as step sizes become small, Smith, 1990) to data sets for several tasks. He found that his equivalent of boundary settings multiplied by the decision variable in his model was an approximately straight line (see also Link, 1975, 1978; Link & Heath, 1975). His model has not been developed to the point of predicting the shapes or locations of RT distributions and it usually does not account for RTs for errors. Nevertheless, it is the precursor to diffusion models and there are more similarities between his model and current models than there are differences (Ratcliff, 1978). The research presented here can be viewed as continuing and extending his work to RT distributions and correct and error RTs to a range of currently popular experimental paradigms.
There have been two previous studies (Ratcliff, Van Zandt, & McKoon, 1999; Ratcliff & Rouder, 1998) that used the two-choice diffusion model (Ratcliff, 1978) to produce psychometric functions of drift rates. In those studies, there was feedback on each trial to indicate to the subjects whether their response was correct or incorrect. The feedback for a given stimulus was probabilistic-- sometimes feedback said one choice was correct and sometimes the other was correct. The studies found that the drift rate for a stimulus value tracked the probability of “correct” feedback for that stimulus. In the tasks reported below, in all except two experiments, feedback was not probabilistic so that the drift rate function was not a joint function of the stimulus variable and feedback probability.
Below, the diffusion model is first described in detail and then it is applied to the data from 11 experiments that were chosen to cover a variety of two-choice tasks and a variety of independent variables. To anticipate, the model fit the data well. This means that the psychometric functions of drift rate that it produced are valid and so can be used as targets for perceptual or cognitive encoding models. Further, the shapes of drift rate functions and the shapes of z-transform functions were sometimes the same and sometimes different. The plots of z-transformed accuracy values generally followed the drift rate functions closely in the middle of the range of independent variables, when accuracy was less than .9. However, in some tasks, there were differences in the extremes where accuracy was high. Models of the processes that encode information from perceptual or cognitive stimuli are designed to explain performance not just in the middle range of performance but also at the extremes. In fact, it may be that the best discrimination between one model and another comes at the extremes. This suggests that a clear picture of the information that should be produced by perceptual or cognitive processes requires a model that incorporates explanations of both accuracy and RT.
The Diffusion Model
In this article, the diffusion model is applied to two-choice tasks. (For diffusion models for single-choice and multi-choice tasks, see Ratcliff and Van Dongen, 2011, and Ratcliff and Starns, 2009). Figure 1 illustrates the decision process: Evidence is accumulated from a starting point z toward one of two criteria, or boundaries, a and 0. A response is initiated when a boundary is reached. RTs and accuracy are naturally integrated by the model: RTs are determined by the time it takes for accumulated evidence to reach one of the boundaries plus nondecision time, and which boundary is reached determines which response is given.
Figure 1.

An illustration of the diffusion model. The top panel shows three simulated paths with drift rate v, starting point z, boundary separation a, and nondecision time Ter, which has range st.
The values of drift rate produced by perceptual or cognitive processes must be divided at a point that reflects indifference between the two possible choices. At this point, drift rate is zero. For example, in a numerosity discrimination task with arrays of asterisks, which numbers of asterisks should get “large” responses and which should get “small” can be manipulated. For arrays that vary from 1 to 100 asterisks, it could be that numbers below 25 are to be considered by a subject as “small” and numbers 25 and above “large.” For a subject to be accurate, the zero point of drift rate would have to be around 25; numbers below 25 would have negative drift rates and numbers 25 and above would have positive drift rates. If this were altered so that numbers below 75 were considered “small” and numbers 75 and above “large,” then for a subject to be accurate, the zero point of drift would have to be around 75. The zero point is called the “drift criterion” (Ratcliff, 1985; Ratcliff & McKoon, 2008) and it is assumed to be under the control of the subject. Within-trial variability (noise) in the accumulation process results in items with the same mean value of drift rate terminating at different times (producing RT distributions) and sometimes at the wrong boundary (producing errors).
In most contexts, the model has successfully fit data with drift rate and boundaries constant from the starting point of the accumulation process to the boundaries. However, there have been a few instances in which it was necessary that drift rate or boundaries change over the course of accumulation (e.g., Ratcliff & Frank, 2012; Ratcliff & Smith, 2010; White et al., 2011). Also, even when the model fits data well with constant drift rate and boundaries, there may actually be an increase in drift rate over a small range at the beginning of the accumulation process. Ratcliff (2002) simulated data in which drift rate was ramped up over a few 10’s of milliseconds to a constant level. The model with fixed drift rate approximated the ramped model. So, in the majority of applications, using the model with fixed drift rates is appropriate.
The values of drift rate, the boundaries, and the nondecision parameter all vary from trial to trial. This assumption is required if participants cannot accurately set the same values from trial to trial (e.g., Laming, 1968; Ratcliff, 1978). Across-trial variability in drift rate is assumed to be normally distributed with SD η, across-trial variability in the starting point (equivalent to across-trial variability in the boundary positions) is assumed to be uniformly distributed with range sz, and across-trial variability in the nondecision component is assumed to be uniformly distributed with range st. These distributional assumptions are the ones usually made, but they are not critical: if predictions are generated from the model with alternative assumptions (e.g., beta-distributed starting point, normally-distributed nondecision time, or uniformly-distributed drift rates), fitting the model with the usual assumptions to the predictions does not significantly change the estimates of drift rate, nondecision time, or boundary separation as long as they are within their usual ranges (Ratcliff, 2013).
The time taken by nondecision processes can, and often does, vary from one task to another for the same stimuli. For example, nondecision time for an array of asterisks might be 200 ms shorter for a simple RT task (“press a key as soon as an array appears on the screen”) than a two-choice numerosity task (“decide whether the number of asterisks is large or small”). This difference can be attributed to the processes that encode the stimuli and transform them to a decision variable. When perceptual or cognitive processes transform the multidimensional features of a stimulus onto a single value to drive the accumulation of evidence, the transformation and the value produced by it may be different for different tasks. For a simple RT task, any stimulus representation might be sufficient for a decision, but for a numerosity task, the dimension would have to be numerosity or something that correlates with numerosity. The number of possible dimensions on which decisions can depend can be extremely large. For instance, for strings of letters, the task could be to decide whether it is a word, whether it has been presented earlier in an experiment, decide whether its letters are red or green, whether they are in one font or another, and so on.
The boundaries that determine when the amount of accumulated information is sufficient to reach a decision are under the control of the individual doing a task. The boundaries can be set far apart, making the probability of a correct response as high as possible, or they can be set close together, making responses faster. Differences in the settings among individuals, and among individuals from different populations, are frequently observed, as are differences that result from instructions to respond as quickly as possible or as accurately as possible. The starting point of the diffusion process is often estimated to be midway between the two boundaries, but if the proportions of the two responses are manipulated, it moves towards the more probable boundary (Leite & Ratcliff, 2011; Mulder et al., 2010; Ratcliff, 1985; Ratcliff & McKoon, 2008; Ratcliff & Smith, 2004; Ratcliff et al., 1999; Wagenmakers et al., 2008).
For the experiments presented in this article, only drift rates were allowed to vary across conditions that differed in difficulty. For all of the experiments except Experiments 3, 4, and 7, the cutoff between the two choices divided them such that each choice was correct on half the trials, which meant that the starting point of the accumulation of evidence was roughly halfway between the two boundaries. For Experiments 3, 4, and 7, the cutoff between the two choices divided them unequally; the probabilities with which the two choices were correct were .25 and .75. This meant that the starting point was closer to the boundary for the more likely choice (as has occurred in previous studies, e.g., Leite & Ratcliff, 2011; Ratcliff, 1985; Ratcliff et al., 1999; Wagenmakers et al., 2008).
To fit the model to the data from an experiment (Ratcliff & Tuerlinckx, 2002), the values of all of the components of processing identified by the model are estimated simultaneously from the data (the starting point (z), the distance between the criteria (a), the nondecision component (Ter), the variability parameters (η, sz, and st), and a mean value of drift rate for each condition in the experiment. The method uses quantiles of the RT distributions for correct and error responses for each condition of an experiment (the .1, .3, .5, .7, and .9 quantiles are usually used). The diffusion model predicts the cumulative probability of a response at each RT quantile. Subtracting the cumulative probabilities for each successive quantile from the next higher quantile gives the proportion of responses between adjacent quantiles. For error RTs, if there were less than 6 responses, a single probability mass was used. For the chi-square computation, these are the expected values, to be compared to the observed proportions of responses between the quantiles (i.e., the proportions between .1, .3, .5, .7, and .9 are each .2, and the proportions below .1 and above .9 are both .1) multiplied by the number of observations. Summing over (Observed-Expected)2/Expected for correct and error responses for each condition gives a single chi-square value that is minimized with a general SIMPLEX minimization routine. The parameter values for the model are adjusted by SIMPLEX until the minimum chi-square value is obtained (Ratcliff & Tuerlinckx, 2002). These chi-square values also provide an index of goodness-of-fit.
For all of the experiments reported here, the model was fit to the data for each individual subject and the values were averaged across subjects, except for Experiment 9 (there were few items per condition and so the data were averaged across subjects and the model fit to the average data). In a number of studies, we have found that the average of the parameters for fits to single subjects is quite similar to fits to the average data (Ratcliff, Thapar, & McKoon, 2001, 2003, 2004).
Other Fitting Methods
To fit the diffusion model to data, there are several published packages and methods. Two earlier packages are the fast-dm package of Voss and Voss (2007) and DMAT Vandekerckhove and Tuerlinckx (2008). With large numbers of observations per subject, as in the experiments presented here, they each produce relatively unbiased estimates of the primary model parameters (boundary separation, nondecision time, and drift rates) with SDs in model parameters that are quite low relative to the SE of the individual differences. The DMAT program is a little more limited when the number of observations is small because it will not use error RTs if the number of observations is less than 11 (DMAT uses the same quantile based method as the chi-square method used here). There are also new Bayesian approaches to fitting the diffusion model (Vandekerckhove, Tuerlinckx, & Lee, 2011) including a published fitting package by Wiecki, Sofer, and Frank (2013). The latter package also includes hierarchical fitting. There are some drawbacks of the Bayesian methods including sometimes long fitting times (over a week for fitting many subjects with many observations per subject) and sometimes numerical instability. But these are issues are being solved and the tools available for fitting the diffusion model are quite comprehensive and sophisticated. In comparisons between these methods, parameter values recovered from the different packages for larger numbers of observation match each other as well as the chi-square method used here and conclusions drawn from the different methods are the same.
Estimating Psychometric Functions when Accuracy is at Ceiling
The diffusion model offers the innovation that psychometric functions of drift rate can be estimated for conditions in which accuracy is at ceiling (e.g., Ratcliff, 2008). When accuracy is at ceiling across some, but not all the conditions of an experiment, the other conditions provide the error responses that are necessary for the model to estimate the across-trial variability in drift rate and starting point. With the constraints from the other conditions, the values of drift rates in the conditions for which accuracy is high are mainly determined by the RTs in those conditions. For some of the experiments below, drift rate functions were approximately linear across the whole range of difficulty. For others, they were approximately linear in the middle of the range but slightly flattened at the ends, and for still others, the functions were nonlinear across most or all of the range.
Experimental Methods
The experiments tested numerosity discrimination, number discrimination, brightness discrimination, motion discrimination, speed discrimination, and line-length discrimination. For each experiment, conditions ranged from easy to difficult, with some conditions designed to be at floor in accuracy and some designed to be at ceiling. For each experiment, the diffusion model fit the data well, which means that the psychometric drift rate functions constructed from the data are interpretable.
In the Results section for each experiment, accuracy, RTs, and drift rate functions are discussed. After all the experiments, there is a section that discusses the other parameters of the model and then a section that compares the drift rate functions for each experiment to z-transformed accuracy functions. The differences between the drift rate and z-transform functions emphasize the need for a sequential-sampling type of model that can produce a decision variable that is defined by RTs as well as accuracy.
Except for Experiment 11, the subjects were undergraduates from the Ohio State University or Northwestern University who received course credit for their participation. In some experiments, they were tested for one session of about 50 min. In other experiments, they were tested for more than one session, and these sessions were also about 50 min. For Experiment 11, the analyses are based on data from an experiment conducted by Grinband, Hirsh, and Ferrera (2006).
For all the experiments except Experiment 10, subjects were instructed to respond as quickly and accurately as possible. For all the experiments, the stimuli were displayed on the screen of a PC and responses were collected from the PC’s keyboard.
Table 1 and the figures for each experiment show the averages across subjects of the best-fitting values of the model parameters (except for Experiment 9 where the values are those obtained from averaging the RT and accuracy data before fitting the model).
Table 1.
Diffusion model parameters for the different experiments
| Experiment | a | z | Ter | η | sz | st | χ2 | df |
|---|---|---|---|---|---|---|---|---|
| 1 | 0.130 | 0.058 | 0.366 | 0.114 | 0.069 | 0.174 | 206.7 | 233 |
| 2 | 0.134 | 0.062 | 0.344 | 0.185 | 0.095 | 0.190 | 335.9 | 233 |
| 3 | 0.137 | 0.042 | 0.335 | 0.139 | 0.064 | 0.122 | 256.9 | 233 |
| 4 | 0.138 | 0.094 | 0.341 | 0.160 | 0.055 | 0.115 | 304.6 | 233 |
| 5 (50 cutoff) | 0.114 | 0.060 | 0.351 | 0.086 | 0.076 | 0.177 | 188.0 | 193 |
| 5 (20 cutoff) | 0.118 | 0.063 | 0.347 | 0.117 | 0.092 | 0.154 | 173.2 | 193 |
| 6 | 0.142 | 0.068 | 0.333 | 0.243 | 0.077 | 0.163 | 259.6 | 193 |
| 7 | 0.149 | 0.049 | 0.330 | 0.162 | 0.081 | 0.119 | 246.4 | 193 |
| 8 | 0.116 | 0.063 | 0.357 | 0.110 | 0.025 | 0.084 | 948.5 | 474 |
| 9 | 0.123 | 0.063 | 0.482 | 0.099 | 0.028 | 0.207 | - | 393 |
| 10 | 0.150 | 0.077 | 0.313 | 0.158 | 0.031 | 0.121 | 341.9 | 173 |
| 11 (short cutoff) | 0.261 | 0.130 | 0.417 | 0.122 | 0.054 | 0.179 | 142.7 | 142 |
| 11 (long cutoff) | 0.238 | 0.116 | 0.446 | 0.104 | 0.034 | 0.206 | 165.4 | 142 |
Note: The length experiment had speed and accuracy blocks of trials. Only boundary separation (and starting point) differed in fitting the speed and accuracy blocks of trials. Boundary separation for the speed blocks was 0.082. a=boundary separation, z=starting point, Ter=nondecision component of response time, η =standard deviation in drift across trials, sz=range of the distribution of starting point (z), st = range of the distribution of nondecision times, and χ2 is the chi-square goodness of fit measure
Numerosity Discrimination: Experiments 1, 2, 3, and 4
For these experiments, subjects were asked to determine whether an array of asterisks was “large” or “small.” This simple task has been used to investigate differences in the component processes of decision making among diverse populations, including elderly adults, children, hypoglycemic adults, and sleep-deprived adults (Geddes et al., 2010; Ratcliff, et al., 2012; Ratcliff, Thapar & McKoon, 2001, 2006, 2010; Ratcliff & Van Dongen, 2009). It is especially useful for these purposes because it makes no demands on memory.
This task has also been used to investigate the representations and processes involved in knowledge of numeracy. Nonsymbolic tasks such as the asterisk task have often been compared to symbolic tasks (e.g., “is 2 greater than 5?”), with the goals of determining whether there are correlations between performance on the two kinds of tasks and whether they might rely on the same cognitive number system. The results have been mixed, with significantly positive correlations only for some tasks in some studies (Gilmore, Attridge, & Inglis, 2011; Holloway & Ansari, 2009; Price, Palmer, Battista, & Ansari, 2012; Sasanguie, Defever, Van den Bussche, & Reynvoet, 2011; Maloney, Risko, Preston, Ansari, Fugelsang, 2010; Halberda et al., 2012; Halberda, Mazzocco, & Feigenson, 2008). Analyses of individual differences using correlations have been based on accuracy and RTs separately (sometimes with IQ or achievement scores), but not with a model that relates them to each other and to underlying processes.
Method
For the four experiments, on each trial, an array of asterisks was displayed on the PC screen, with the number of asterisks ranging from 2 to 98 in steps of 2. The positions to be filled with asterisks were chosen randomly from 100 positions laid out in a 10×10 array. Subjects indicated whether the number of asterisks was “large” or “small” by hitting one of two keyboard keys. Experiment 1 used a large/small cutoff of 50, Experiment 2 used probabilistic feedback (e.g., Ratcliff et al., 2001), Experiment 3 placed the large/small cutoff at 24 and Experiment 4 placed it at 74. In Experiments 3 and 4, more small and large stimuli (respectively) were added to equate the proportion of large and small responses.
Results
RTs greater than 2500 ms and less than 250 ms were eliminated from analyses, 0.9%, 2.2%, 0.7%, and 1.4% of the data for the four experiments respectively.
For Experiment 1, the proportions of “large” responses and the mean RTs as a function of number of asterisks are shown in Figure 2. The data for Experiment 2 were similar. For Experiments 3 and 4, the data were also similar except that the transition point between “large” and “small” responses was moved downward (toward 24) for Experiment 3 and upward (toward 74) for Experiment 4.
Figure 2.

Plots of response proportions and mean RTs as a function of number of asterisks for Experiment 1 (top panels), brightness for Experiments 6 (middle panels), and dot separation for Experiment 10 (bottom panels, plots show both the speed and accuracy instruction conditions).
There were clear ceiling effects in Experiment 1 (Figure 2, top left panel) with the overall function appearing S-shaped. For the seven conditions with the lowest numbers of asterisks, the proportions of “large” responses (errors) were about the same, less than about .1 (and less than about .05 for the most extreme conditions). Likewise, for the eight conditions with the highest numbers, the proportions of “large” responses were about the same, greater than about .9 (and greater than .95 for the most extreme conditions). However, RTs changed across these conditions: RTs decreased, by about 75 ms, from the less extreme conditions to the more extreme (Figure 2, top right panel). The data for Experiment 2 showed a similar pattern.
For Experiments 3 and 4, ceiling effects extended over more conditions than for Experiments 1 and 2. With the cutoff at 24, accuracy was at ceiling (above .95) for all numbers of asterisks above 38 and with the cutoff at 74, it was at ceiling (above .95) for all numbers less than 54. However, compared to Experiments 1 and 2, the extreme conditions were further away from the cutoff. As a result, RTs changed little across the ceiling conditions, by less than 27 ms with the cutoff at 24 and less than 28 ms with the cutoff at 74.
For Experiment 1, the model fit the data well. Figure 3, left-hand panels, shows quantile probability plots. The x-axis represents the proportion of responses that were “small” (top panel) or “large” (bottom panel). The x’s are the data and the o’s and the lines between them are the predictions from the model. The plots show the .1, .3, .5, .7, and .9 quantiles of the RT distributions stacked vertically for each of the conditions of the experiment, except the 8 – 10 conditions for which there were no responses for some subjects and therefore mean RTs across subjects could not be computed. The plots show how the shapes of the RT distributions change: As difficulty increases, the distances between the slower quantiles increase more than the distances between the faster quantiles. The model captured this change in shape well (apart from a slight miss in the .1 quantile for the “small” responses). The model fit the data equally well for Experiments 2, 3, and 4.
Figure 3.

Quantile probability plots for Experiments 1 and 6 (numerosity and brightness discrimination, respectively). The x’s represent the experimental data and the o’s joined by lines are the model predictions. The conditions are shown on the x axis in terms of proportions of responses. Proportions on the right are for correct responses and proportions on the left for error responses (some of the error quantiles are missing because some of the subjects had zero responses for those conditions). The RT quantiles are, in order from bottom to top, the .1, .3, .5, .7, and .9 quantiles.
The values of the diffusion model parameters that best fit the data, averaged over subjects, are shown in Table 1 for all the parameters except drift rate and in Figure 4A for drift rate. Table 1 also shows chi-square values that demonstrate that the model fit the data well. In the paragraphs that follow, results for the starting point of the accumulation of evidence and drift rates are discussed. The other parameters are discussed at the end of all the experiments.
Figure 4.

Panel A: Drift rates as a function of number of asterisks for Experiments 1–4, the four numerosity discrimination experiments. The vertical lines show where the cutoffs for “large” and “small” stimuli should intersect with zero drift rate. For all four experiments, the drift rates were near zero at this point. The bottom right inset is an example of a stimulus.
Panel B: Drift rates as a function of number for Experiment 5. The vertical lines show where the cutoffs between “large” and “small” numbers should intersect with zero drift rate and the drift rates were near zero at this point.
Panel C: Drift rates as a function of the proportions of white pixels in Experiments 6 and 7 (brightness discrimination). The bottom right inset show an example stimulus. The vertical lines show where the cutoffs between “bright” and “dark” stimuli should intersect with zero drift rate and the drift rates were near zero at this point.
Panel D. Drift rates as a function of motion coherence (the proportion of dots moving coherently) and speed in Experiment 8 (direction discrimination).
Panel E: Drift rates as a function of speed and coherence for Experiment 9. The vertical line shows where the cutoff and zero drift rate intersect.
Panel F: Drift rate as a function of dot separation in Experiment 10. The bottom right inset shows examples of stimuli. The vertical lines show where the cutoffs between “large” and “small” dot separation should intersect with zero drift rate and the drift rates were near zero at this point.
The starting point, z, shifted in response to the different probabilities of “large” versus “small” responses (such shifts are typical; Leite & Ratcliff, 2011; Ratcliff, 1985; Ratcliff et al., 1999). It was 0.063 (z/a=0.47) when the cutoff between “large” and “small” was 50 (Experiments 1 and 2), 0.042 (z/a=0.31) when the cutoff was 25 (Experiment 3), and 0.094 (z/a=0.68) when the cutoff was 75 (Experiment 4).
Figure 4A shows how drift rates varied with number of asterisks (i.e., the figure shows psychometric functions based on drift rates). For Experiments 1 (accurate feedback) and 2 (probabilistic feedback), numbers of asterisks larger than about 50 have positive drift rates and numbers smaller than about 50 have negative drift rates. The functions are approximately linear across the whole range of conditions. They do not level off as the functions based on accuracy do, that is, they do not show the ceiling effects that accuracy does. The function for Experiment 2 is less steep than the function for Experiment 1; thus probabilistic feedback reduced the slope of the drift rate function but did not change the shape of the function.
For Experiments 3 and 4, the zero point of drift (the drift criterion) was shifted to match the cutoff between “small” and “large.” For the conditions for which accuracy was .95 or better, drift rates almost tripled, reflecting changes in RTs across the conditions. The drift rate functions are approximately linear except for some flattening at the most extreme ends. For Experiment 3, the flattening begins around 60 asterisks, and for Experiment 4 it begins around 40 asterisks.
The important finding from these studies is that application of the diffusion model transformed a complicated pattern of data into a much simpler one. The complicated pattern was that psychometric functions based on accuracy were highly nonlinear; that there was a large number of conditions for which accuracy at ceiling, and that RTs changed across the ceiling conditions (although not as much as for conditions with lower accuracy). The psychometric functions based on drift rate were simpler, approximately linear, except for the more extreme conditions for Experiments 3 and 4. In other words, drift rates show changes in performance for which accuracy did not. Thus, for all but extreme stimuli, a model of numerosity processing needs only to produce an approximately linear function of stimulus difficulty. Given such a function, the diffusion model handles the mechanisms that produce the probabilities of “large” and “small” responses and their RTs. (The finding that drift rates do not change across the most extreme conditions suggests that the system that encodes numerosity sees these conditions as quite similar to each other and quite dissimilar from conditions near the cutoff.)
Number Discrimination: Experiment 5
The stimuli in this experiment were all the numbers between 1 and 99 except either 50 or 20. For each test item, a subject’s task was to respond according to whether the number was above or below a cutoff number, which was either 50 or 20.
For Experiments 1 – 4, the stimuli were nonsymbolic and the model fit the data well. The question for Experiment 5 was whether the model gives an equally good account for symbolic stimuli. If so, then differences among individuals can be investigated in terms of correlations between their drift rates for symbolic and nonsymbolic information. As mentioned above, previous investigations have treated accuracy and RTs separately.
Method
The stimuli were two digit numbers and in Experiment 5, subjects were instructed to respond large if the number was greater than 50 and small otherwise. In Experiment 6, the large/small cutoff was 20 and there were equal numbers of stimuli greater and less than 20.
Results
RTs greater than 1500 and less than 250 ms were eliminated, about 2.1% of the data.
Accuracy was at or close to ceiling for most of the conditions of the experiment. Only 2 out of 20 conditions had accuracy values less than .88 when the criterion was 50, and only one condition out of 20 had an accuracy value less than .88 when the criterion was 20. Across conditions that were at ceiling, RTs for correct responses declined by about 100 ms from the cutoff to the extremes for both the 20 and 50 cutoffs.
The diffusion model was fit to the two cutoff conditions separately and it fit the data well (Table 1), just as well as for the data of Experiments 1–4. Figure 4B shows the psychometric functions for drift rates. For both cutoffs, the functions are approximately bilinear. In accord with the difference between the cutoffs, subjects moved their drift criterion (the zero point of drift) to lie between 49 and 51 when the cutoff was 50 and between 19 and 21 when the cutoff was 20 (the vertical lines in Figure 4B).
This experiment demonstrates how switching from a psychometric function based on accuracy to a psychometric function based on drift rates can substantially change the demands made on a model of perceptual or cognitive processes. The accuracy function would indicate that there is no change at all (or very little) in the representation of number that determines responses across conditions with ceiling accuracy. For example, for the cutoff at 50, the representation could be the same (or very close to the same) for 99 asterisks as for 69 asterisks. In contrast, the drift rate function is approximately linear above the cutoff and below the cutoff.
Brightness Discrimination: Experiments 6 and 7
In these experiments, subjects judged whether there were more white pixels (“bright”) or more black pixels (“dark”) in a square array of pixels. This task has been important in the development and testing of the diffusion model because it provides data for which accuracy and RT vary over a wide range, from ceiling to floor (Ratcliff & Rouder, 1998; 2000; Ratcliff, 2002).
This task has also been important in comparisons of cognitive processing between elderly and young adults (e.g., Ratcliff, Thapar, & McKoon, 2003), showing that drift rates for older adults do not differ from those for young adults. This finding is one of a number of findings with the diffusion model that show that slower RTs for older than young adults are often not due to deficiencies in the information that drives decision processes.
Method
The stimuli for Experiments 6 and 7 were 64 × 64 squares of black and white pixels on a 320 × 200 gray background, with the brightness of a square manipulated by varying the proportion of pixels that was white from .025 to .975 in steps of .05. The cutoff between bright and dark was .5 for Experiment 6 and .25 for Experiment 7 (there were three times more dark than bright stimuli to equate the proportions of the two responses).
Results
RTs greater than 2500 and less than 250 ms were eliminated, for Experiment 6, 1.7% of the data and for Experiment 7, 0.7% of the data.
For Experiment 6 (cutoff at .5), Figure 2 shows the proportions of “bright” responses for each of the 20 conditions on the left of the figure and RTs on the right. For the conditions with fewer than .225 white pixels and more than .825 white pixels, accuracy was at ceiling, between .927 and .936. For these conditions, RTs changed by less than 15 ms. Between .225 and .825, RTs changed by up to 150 ms.
For Experiment 7 (cutoff at .25), for the conditions with fewer than .075 white pixels and more than .375, accuracy was at ceiling, greater than .95. For more than .525 white pixels, accuracy was greater than .994 and in this range, in contrast to Experiments 3 and 4, mean RTs varied relatively little (between 442 and 417 ms).
The model again fit the data well, as shown in the right-hand panels of Figure 3. Because there were three times more dark stimuli than bright stimuli, the best-fitting value of the starting point was closer to the “dark” boundary than the “bright” boundary, with z/a=0.33 (see Table 1). With the cutoff at .5 white pixels, the starting point was approximately midway between the two boundaries, z/a=0.48.
Drift rates are plotted as a function of the proportion of white pixels in Figure 4C. For Experiment 6 (cutoff at .5 white pixels), the function is approximately linear in the middle of the range (between .25 and .75 white pixels) but it levels off somewhat in the right tail (above .75). The function for Experiment 7 (cutoff at .25) is similar: it is roughly linear around the .25 cutoff, but above .5-.6, it flattens out.
For Experiments 1, 2, and 5, the cutoff between the two responses was in the middle of the range of stimuli and the drift rate functions showed approximately linear functions over the whole range, in contrast to the accuracy functions. For Experiment 6, the cutoff was also in the middle but the finding was different: the drift rate function showed ceiling effects, although still for fewer conditions than accuracy.
For Experiments 3, 4, and 7, the cutoffs were not midway between the extremes. For Experiments 3 and 7, the numbers of conditions above the cutoff were extended substantially, and for Experiment 4, the number below the cutoff was extended substantially. Extending the range had the same effect for all three experiments: drift rate functions showed ceiling effects over a larger range of conditions than when the cutoff was in the middle of the range. However, in all three cases, the range of ceiling effects for accuracy was larger than the range for drift rates.
Motion Discrimination: Experiment 8
Motion discrimination tasks (Ball & Sekuler, 1982; Britten, Shadlen, Newsome, & Movshon, 1992) are currently popular in neuroscience studies of decision making because both humans and monkeys can perform the tasks. In monkey studies, the tasks allow examination of transduction from brain areas corresponding to motion detection to areas involved in decision making. In human studies, the tasks have been used extensively to investigate decision making, and they have been used in neuroimaging studies to relate features of the motion system to neurophysiology.
In the task typically used, which is the one used for Experiment 8, a stimulus is composed of a set of dots displayed in a circular window. On each trial, some proportion of the dots move in the same direction (either to the left or to the right) and the others switch into random positions. A subject’s task is to decide whether the dots that move are moving left or right. The smaller the proportion moving in the same direction, the more difficult the discrimination between left-and right-moving. In Experiment 8, there were two independent variables: the proportion of dots that moved in the same direction (termed “coherence”) and the speed with which they moved.
For this experiment, as for all the other experiments in this article, the form of the psychometric function that relates drift rate to difficulty was determined by fitting the diffusion model to the data. In contrast, when Palmer, Huk, and Shadlen (2005) analyzed data from a motion-discrimination task like the task used for Experiment 8, they examined a model in which drift rate was a power function of motion coherence. Across a number of experiments, the exponent in the power function was not significantly different from 1. They made this assumption, as well as the assumption that there is no across-trial variability in components of processing, because these assumptions constrained their version of the diffusion model to produce a simple relationship between accuracy and mean RT. However, with these simplifying assumptions, as they discuss, their model cannot account for the relative speeds of correct and error responses or for any biases toward one or the other response choice (as in Experiments 3, 4, and 7). Also, it has not been shown that their model accounts for the shapes of RT distributions though it would probably perform adequately.
Method
This experiment was similar to Experiment 1 in Ratcliff & McKoon (2008). A number of dots were placed in a circular window on a video display and from frame to frame, some proportion moved coherently, that is, by the same number of pixels to the left or right. The other dots moved randomly. The probability of dots moving coherently was .05, .10, .15, .25, .50, or .90. There were also four levels of speed: The coherently moving dots moved by 1 pixel from frame to frame, 2 pixels, 3 pixels, or 4 pixels.
Results
RTs shorter than 300 ms and longer than 1500 ms were eliminated; this removed less than 0.4% of the data.
For the highest levels of coherence (.25, .50, and .90) at the three fastest speeds, accuracy was at ceiling. Collapsing over the three speeds and the direction of movement, the probabilities of correct responses for these three levels of coherence were .94, .99, and .99. In contrast, there was no ceiling effect for RTs: collapsing over the three speeds and direction, RTs for correct responses declined from 524 ms to 470 ms to 442 ms.
Accuracy moved off ceiling for the three lowest levels of coherence (.05, .10, and .15) for all four speeds. It also moved off ceiling for all the levels of coherence at the fastest speed. Collapsing over speed and direction, accuracy for the .05, .10, and .15 levels was .66, .80, and .86, respectively, and RTs were 632 ms, 606 ms, and 566 ms. For .25, .50, .90 coherence for the fastest speed, accuracy was .89, .96, and .98, and mean RT was 574, 507, and 473 ms, respectively.
Figure 4D shows drift rates as a function of the proportion of dots moving to the right. On the left hand side of the x axis, the conditions, from left to right, are the coherence values for left moving dots, .90, .50, .25, .15, .10, and .05. On the right hand side, again moving from left to right, are the coherence values for right-moving dots, .05, .10, .15, .25, .50, and .90. The figure shows four functions, one for each of the levels of speed. The absolute values of drift rates are somewhat lower for the fastest speed, but there is little difference between the other three speeds.
The drift rate functions are S-shaped. They are approximately linear only for the three most difficult conditions. The S-shape derives from differences in drift rates that are smaller between the easiest conditions (the farthest left and the farthest right) than between the most difficult conditions (the middle conditions). Collapsing over speed and direction, drift rates were .07, .14, .20, .29, .46, and .60, for the .05, .10, .15, .20, .25, .50, and .90, respectively. For all three of the easiest coherence conditions (.25, .5, and .9), averaging over the four stimulus speeds, accuracy was at ceiling (greater than .94) yet drift rates doubled.
Once again, the psychometric functions constructed by application of the diffusion model provide a quite different target for models of perceptual or cognitive processes than do the functions based on accuracy. However, in contrast to Experiments 1–7, the drift rate functions are S-shaped; they do not have an approximately linear shape in the middle of the stimulus range that Experiments 1–7 do.
As noted above, in the application of Palmer et al’s (2005) version of the diffusion model to their data, coherence and drift rate were found to be linearly related. The S-shape in Figure 4D has drift rates decelerating with increasing coherence especially in the extreme conditions (see also Ratcliff & McKoon, 2008, Figure 11).
Speed Discrimination: Experiment 9
Experiment 9 used stimuli similar to those used in Experiment 8 but the task was changed-- instead of deciding whether the direction of motion was to the left or right, subjects decided whether the motion was fast or slow. Even though the stimuli were similar, the change in task changed the patterns of the data and the psychometric functions of accuracy and drift rates.
The changes in the data point to an issue raised in the introduction: perceptual or cognitive processes need to produce a representation of a stimulus that is appropriate for the task at hand. For a dot-motion stimulus, speed might be the relevant dimension, or direction, or density, or any of a number of other dimensions (or combinations of them). Sometimes, the relevant dimension might be independent of other dimensions and sometimes not, that is, the dimensions might be “separable” or “integral” (c.f., Garner, 1974; Nosofsky, 1987). The example here shows what happens in the motion task when speed as opposed to coherence in Experiment 7 is the dimension upon which the discrimination is made.
In piloting the experiment, two things became obvious. First, when coherence was very low, motion was judged to be fast because the random flicker of the stimuli over frames was interpreted as rapid random motion. For this reason, only higher coherence values were used (.25, .5, .75, and 1.0). Second, with the coherent dots sometimes moving left and sometimes right, subjects reported that they sometimes by mistake responded according to the direction of the movement, not the speed, so the paradigm was changed such that the direction was vertically downward for all stimuli.
Method
The stimuli were the same as for Experiment 8 but there were 10 levels of speed, from 1 to 10 pixels per frame (the four slower speeds were equivalent to the speeds in Experiment 8). “Slow” was considered the correct response for speeds 1 to 5 and “fast” for the others.
Results
Items with RTs less than 300 ms or greater than 2500 ms were eliminated, about 3.6% of the data. Because there were relatively few observations per condition (28), accuracy and RTs were averaged over subjects before fitting the diffusion model to the data. Accuracy was above 90% correct for 20 out of the 40 experimental conditions.
Just as for all the preceding experiments, the drift rate functions give a different and simpler target for modeling than the accuracy functions. Figure 4E shows drift rates as a function of speed and coherence. Overall, averaging over coherence, the speed function is S-shaped, with an approximately linear portion in the middle of the range. For the fastest-moving stimuli, 8, 9, and 10 pixels per frame, drift rates differed little as a function of coherence (the four drift rate functions converge in the top right hand corner of Figure 4E). But for all the slower speeds, from 1 pixel per frame to 7 pixels per frame, the increase in drift rates was large (middle and bottom left of the functions in Figure 4E). For example, at 1 pixel per frame (the left hand column of points), drift rate for the highest coherence condition was about double that for the lowest coherence condition. This is likely a consequence of random motion of the low coherence stimuli appearing to be fast motion. It also suggests that speed and coherence are not completely separable (Garner, 1974) when judging speed.
The psychometric function for drift rates when the decision was based on speed (Experiment 9) is somewhat different than when the decision was based on direction (Experiment 8). Both are S-shaped, but the function for speed asymptotes at the extremes whereas the function for direction does not. Manipulating speed modulated direction judgments only for slow stimuli (Experiment 8), but manipulating coherence modulated speed judgments for all except the highest speeds (Experiment 9). The finding that speed and coherence have different effects is not surprising, but it does make concrete the fact that different independent variables may have quite different effects on performance. In other words, perceptual or cognitive processes must transform the stimuli into different representations for the two tasks.
Dot Separation: Experiment 10
The data for this experiment come from Ratcliff et al. (2001; Experiment 2). The task required subjects to decide whether the distance between two dots was “large” or “small,” and subjects were instructed to respond as quickly as possible for some blocks of trials and as accurately as possible for other blocks. The drift rates reported by Ratcliff et al. were averaged over groups of eight conditions each. Here, to give a more complete picture of the results, the data are averaged over groups of only two conditions each. In Ratcliff et al.’s experiment, there were elderly adults and college-age adults. Here, I analyze the data only for the college-age adults.
The dot separation task has been important in comparisons of cognitive processing between young and older adults where it has been used to show that drift rates can be as large for older as younger adults. It has also been used with rhesus monkeys: Ratcliff, Cherian, and Segraves (2003) used the task to trace out and model the time course of neural firing rates with single-cell recordings and to map the firing rates onto the time course of behavioral responses.
Results
RTs greater than 3000 ms and less than 280 ms were excluded from the analysis (less than 4% of the data). Two-thirds of the excluded data came from responses shorter than 280 ms for the speed instruction condition for 5 of the 17 subjects.
Figure 2 shows accuracy and mean RTs for the 16 conditions with accuracy instructions and the 16 with speed instructions. Accuracy was at or near ceiling (over .94 correct) for distances 24 through 32 and for distances 1 through 6. The asymptote was somewhat higher with accuracy instructions than with speed instructions. Across the ceiling conditions, there were small decreases in mean RTs of about 15 ms with speed instructions and larger changes with accuracy instructions of over 48 ms.
The psychometric function for accuracy is S-shaped (Figure 2) while the drift rate function (Figure 4F) is roughly linear in the middle of the range of conditions, bending over very slightly in the extremes. Again, consideration of drift rates instead of accuracy leads to a different target for perceptual or cognitive processes.
Line Length: Experiment 11
Grinband et al. (2006) conducted an fMRI experiment in which lines of 16 different lengths were presented to subjects for “long” versus “short” judgments. The cutoff between long and short was manipulated such that on some trials, the correct response for lengths 1 through 4 was “short” and the correct response for lengths 6 through 16 was “large.” On the other trials, the correct response for lengths 1 through 11 was “short” and the correct response for lengths 13 through 16 was “long.” On each trial, the cutoff for that trial was cued by a circle, red for the shorter cutoff and green for the longer one.
Grinband et al. (2006) used the cutoff manipulation and fMRI signals to separate brain areas that were and were not affected by the cutoff manipulation. They found that the brain areas that were affected were decision-related areas and the brain areas that were not were mainly areas that responded to stimulus information.
The behavioral data showed a shift in the accuracy psychometric function such that when the cutoff was at 5, subjects mainly responded “long” for stimuli between 6 and 11, and when the cutoff was at 12, subjects mainly responded “short.” In the diffusion model, this corresponds to moving the drift criterion that separates positive from negative drift rates so that the zero point of drift is at 5 for the small cutoff and 12 for the large one (Leite & Ratcliff, 2011; Ratcliff, 1985).
Method
On each trial, there was a fixation point, then a red or green circle, and then the line about which a decision was to be made. The line remained on the screen until a response was made.
Results
For 16 out of 30 conditions, accuracy was at ceiling, with the probability correct .94 or greater. Mean RTs changed from 795 ms at the easiest condition to 1505 ms at the most difficult condition. Mean RT also changed by more than 300 ms over conditions in which accuracy was over .94 (see Figure 5). The vertical lines are the dividing points, 5 and 12, between “large” and “small.” With the cutoff at 5, the functions are shifted to the left relative to the functions with the cutoff at 12.
Figure 5.
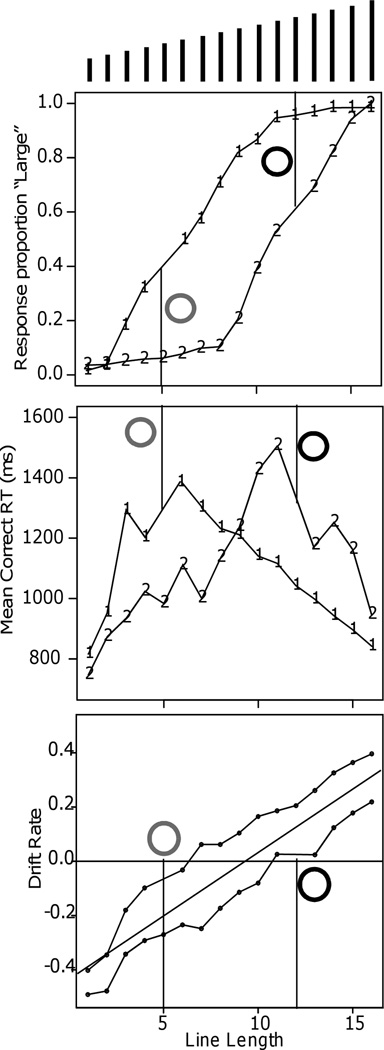
Response proportion, correct mean RT, and drift rates for the line length discrimination experiment (Experiment 11) ofGrinband et al. (2006). The grey and black circles represent the cues for the criterion manipulation (red and green in the experiment) and the vertical lines show the cutoffs for those cues. The lines at the top of the plot represent the stimuli.
The model was fit to the data for the two cutoffs separately because the duration of the cue was long enough that subjects could change settings of decision process parameters according to whether the cutoff was 5 or 12. However, it turned out that boundary separation, nondecision time, and starting point did not differ significantly between the cutoffs and so the parameters in Table 1 are averages of the two.
Drift rate varied approximately linearly as a function of line length (Figure 5) but the function was shifted between the two cutoff conditions. When the cutoff was 5, stimuli above length 5 had positive drift rates (toward the “long” boundary) and stimuli below 5 had negative drift rates. When the cutoff was 12, drift rates were positive above length 12 and negative below. Thus the cues resulted in subjects moving their drift criterion between the two cutoffs. These functions for drift rates contrast sharply with the nonlinear accuracy functions.
Experiments 8 and 9 illustrated how drift rates are not a function of stimulus properties alone but instead functions of the interaction between them and task requirements. Experiment 11 provides another such illustration, with different (quantitative) representations needed for the long and short cutoffs.
The Other Parameters of the Diffusion Model
In the main, the parameters of the model other than drift rate differed little from one experiment to another. Also, except for Experiment 11, the values of the parameters (Table 1) are all in the ranges that have been found in other studies with college students as subjects. In other studies, values of drift rate, boundary separation, and nondecision time show consistent individual differences across subjects (as do drift rates) when the subjects participate in several experiments (e.g., Ratcliff, Thapar, & McKoon, 2010, 2011; Ratcliff, Thompson, & McKoon, submitted).
Boundary separation
Except for Experiment 11, the average distances between the boundaries were between 0.114 and 0.150. The averages for Experiments 1–4 (numerosity) and 6 and 7 (brightness) were about the same and slightly larger than the averages for Experiments 5 (number), 8 (motion), and 9 (speed), which were all about the same.
For Experiment 11, the distances between the boundaries were larger than for the other experiments. The red and green circles cued the cutoff between “long” lines and “short” lines on a trial-by-trial basis, so subjects had to adjust their cutoff trial by trial. In addition, the delays between stimuli could be as long as 4 s (because of the fMRI requirements). Either of these factors could have induced subjects to set wider boundaries.
Starting point
For the experiments for which the difficulty dimension was divided into approximately equal halves (all except Experiments 3, 4, and 7), the starting point was about halfway between the two boundaries. For Experiments 3, 4, and 7, the proportions of the two types of stimuli were not equal and, accordingly, the starting points shifted toward the boundaries that represented the more likely type of stimulus (cf., Leite & Ratcliff, 2011; Ratcliff, 1985).
Nondecision times
Nondecision times were remarkably similar across most of the experiments. The exceptions were Experiments 9 (dot movement speed), and 11 (line length). For these experiments, nondecision times were longer than for the other experiments, suggesting that the processes that produce representations and turn them into drift rates are slower for these tasks.
Differences in nondecision times among tasks are not unusual, as noted in the introduction. Ratcliff et al. (2006, 2010) found systematic differences in nondecision time when the same subjects were tested on several tasks. For recognition memory and lexical decision, nondecision times were 50–150 ms longer than for numerosity judgments. This suggests that the processes that construct decision-related representations of information from memory (episodic or semantic) take more time than the processes that construct decision-related representations for simple perceptual dimensions. However, for most of the tasks examined in the experiments reported here, nondecision times were quite similar.
Across-trial variability parameters
The across-trial variability parameters have much higher SDs in their estimates than drift rates, boundary separation, and nondecision time (Ratcliff & Tuerlinckx, 2002). No systematic differences were found across the experiments and all the values were in the ranges that have been found in other experiments.
Comparisons Between SDT and Diffusion-Model Psychometric Functions
The simplest SDT model for psychometric functions assumes that stimulus evidence is normally distributed and that changing the strength value of a stimulus moves the normal distribution along the strength axis (e.g., Macmillan & Creelman, 1991). If this model is correct, then the psychometric function of accuracy plotted against stimulus values is a straight line. In this section, I compare psychometric functions of accuracy, z-transformed accuracy, and drift rates.
For the first comparison, I generated predictions for accuracy from the diffusion model as a function of drift rate for three values of boundary separation and two values of across-trial variability in drift rate (Figure 6). The values of boundary separation spanned those that are typical for fits of the model to individual subjects’ data for tasks like the ones presented here. Across-trial variability in drift rate was either 0 or 0.12; the latter is typical of the values in Table 1. Figures 6 shows the resulting plots of drift rates against z-transformed accuracy.
Figure 6.

Plots of z-transformed accuracy and accuracy against drift rate. Across trial variability in starting point was 0.04 and the other parameters are shown in the figure (nondecision time and across trial variability in nondecision time do not affect accuracy predictions). Boundary separation, a, is presented in the box in each panel.
The questions are whether and how drift rates add information to what would be obtained with accuracy or z-transformed accuracy. For accuracy, it is clear that they do: accuracy flattens across drift rates, giving the S-shaped functions in the examples in Figure 2.
In more detail, when there is no across-trial variability in drift or starting point and the starting point is midway between the two boundaries, accuracy as a function of drift rate turns out to be a logistic function (e.g., substitute z=a/2 in Equation A8, Ratcliff, 1978). The logistic function is very similar to the cumulative normal distribution and because it has a closed form, it has been used in SDT as an alternative (e.g., DeCarlo, 1998; Ogilvie & Creelman, 1968).
For z-transformed accuracy, the shape of the function depends on the amount of across-trial variability in drift rate. With across-trial variability near zero and the separation of the boundaries large, the function is S-shaped. However, when the across-trial variability in drift rate is 0.12, the functions are close to linear, suggesting in this case that drift rates would not add information beyond that of z-transforms. For example, if drift rate were linear with stimulus value, then the z-transform of accuracy would be linear with stimulus value if the across-trial variability in drift rate was not near zero. However, in practice, differences in z-transforms, unlike drift rates, cannot be estimated when accuracy is at ceiling.
I also compared z-transforms with drift rates for Experiments 1 – 11. For each experiment, I computed the z-transforms of accuracy for each subject in the experiment and then averaged these values (except for Experiment 9 where the group data were used). These z-transforms and drift rates are plotted in Figures 7 and 8 against the independent variables for each experiment. I also computed the z-transforms of the accuracy values for the data averaged over subjects, but these tracked the z-transforms for the individual subjects so only the latter are shown in the figures. For both ways of computing the z-transforms, I used the standard correction that a probability of 0 or 1 was replaced by 0.5/N or 1–0.5/N, respectively.
Figure 7.

Plots of drift rate and the z-transform of accuracy against the independent variable for Experiments 1 – 5.
Figure 8.

Plots of drift rate and the z-transform of accuracy against the independent variable for Experiments 6 – 11. For the speed discrimination experiment, only the highest and lowest functions are shown to reduce clutter. The two intermediate accuracy functions show the same deviation between drift rate and z-transformed accuracy functions as for the lower accuracy functions.
Across the 11 experiments, the drift rate and z-transformed accuracy functions are sometimes quite similar and sometimes quite different. For numerosity discrimination, in Experiment 1, the drift rate function is approximately linear over almost the whole the range whereas the z-transformed accuracy function levels off in the tails. For Experiment 2, the two match well because accuracy does not reach ceiling - the highest accuracy values are .91. For Experiments 3 and 4, there are substantial misses between the two functions with z-transformed accuracy leveling off much earlier than drift rates because RT decreased even as accuracy asymptoted. Misses in the tails of the functions also occur for number discrimination (Experiment 5) for the cutoff at 20 with the drift rate function increasing for numbers greater than 20 while the z-transformed accuracy function is almost constant. There are smaller misses in the tails for motion discrimination, speed discrimination, and dot separation (Experiments 8, 9, and 10).
In contrast, for brightness discrimination (Experiments 6 and 7) and number discrimination (Experiment 5) with the cutoff at 50, accuracy and RT asymptote in the same range and drift rate tracks z-transformed accuracy values. The result from number discrimination is surprising because the high ceiling levels of accuracy in many of the conditions were accompanied by decreases in RT. In Experiment 1, 3, and 4, similar results produced a change in drift rate functions as stimuli became easier while the z-transformed accuracy values did not change.
Finally, for the line length experiment, the drift rate functions are approximately linear while the z-transformed accuracy functions diverge at intermediate values of line length and then converge at the extremes. This may be because the experiment has the lowest number of observations per subject per condition and so the divergence between the functions may reflect ceiling effects.
To summarize across the 11 experiments, the plots of z-transformed accuracy values generally follow the drift rate functions closely in the middle of the range of the independent variables, when accuracy is less than .9. However, most models of the processes that encode information from perceptual or cognitive stimuli are designed to explain performance not just in the middle range of performance but also at the extremes. In fact, it may be that the best discrimination between one model and another comes at the extremes.
One consequence of these findings for SDT should be highlighted. In the default SDT analysis, the accuracy psychometric function is the cumulative normal distribution. With this model, the z-transform of accuracy as a function of the independent variable should be a linear function. In some cases, the functions were roughly linear, but in others they deviated from linearity (Figures 7 and 8).
General Discussion
The diffusion model, like other sequential sampling models, provides a meeting ground between, on the one side, the processes that produce a representation of a stimulus and transform it into a representation that is decision-related, and, on the other side, the decision process that makes use of that representation. Any stimulus has a number of dimensions on which a decision could be made, for example, dot direction in Experiment 8 and dot speed in Experiment 9. The dimensions must be collapsed onto a single decision variable (sometimes the variables are separable so one can be discounted, other times they are not, e.g., Garner, 1974). In the case of the diffusion model, this variable is drift rate.
In SDT and most accuracy-based modeling applications, RTs are not considered. It might be thought that if SDT could give an adequate account of accuracy, then a simple decision model could be tagged on to the end of it to account for RTs (e.g., a transformation of perceptual strength to latency, see discussion in Ratcliff et al., 1999, p. 275). However, given the variety and complexity of relations between accuracy and RTs that are observed empirically, even models that could perfectly predict accuracy would almost certainly be invalidated by RT data. One example of complexity is provided by experiments in which subjects are given instructions to respond as quickly as possible on some trials and as carefully as possible on others (e.g., Ratcliff, Thapar, & McKoon, 2001, 2003, 2004, 2006; Ratcliff & Smith, 2004; Ratcliff & Rouder, 1998; Thapar Ratcliff & McKoon, 2003). Despite the changes that this manipulation produces in accuracy and RTs, drift rates remain approximately the same.
When drift rates and z-transformed accuracy values are plotted against independent variables, they have about the same shape when accuracy is not at ceiling. Given this, it might be thought that the theoretical interpretations of the two are compatible, but this is not the case. In SDT, all variability in processing comes from across-trial variability in the representations of stimuli produced by perceptual or cognitive processes. In the diffusion model, variability is broken down into across-trial variability in the representations (i.e., in drift rate), across-trial variability in the starting point, and within-trial variability in the decision process. Because the diffusion model has multiple sources of variability, across-trial variability in drift rate is not the same as across-trial variability in a SDT representation (Ratcliff, 1978).
Psychometric functions for Experiments 1 – 11
If the diffusion model is to provide a meeting ground between perceptual or cognitive processes and the decisions made on the basis of the stimulus representations produced by those processes, then the model must give a good account of accuracy and RT data, qualitatively and quantitatively.
For all of the experiments, the diffusion model fit the data well. For Experiments 1 and 7, Figure 3 illustrates the match between RTs and accuracy from the data and RTs and accuracy generated from the best-fitting values of the parameters of the model. For these and the other experiments, the fit between the model was good across all the conditions. Chi-square values (Table 1) were all between the number of degrees of freedom and three times that number, the same range as has been observed in other applications of the model. Although there were significant values for some subjects, the chi-square test is conservative and very small differences between data and model can give large contributions to chi-square values (e.g., Ratcliff, Thapar, Gomez, & McKoon, 2004).
For all of the experiments, accuracy showed ceiling effects that extended across several levels of stimulus difficulty. In some but not all of the experiments, RTs continued to decrease across these levels. These decreases in RTs were responsible for increases in drift rates when both accuracy and z-transformed accuracy functions asymptoted. For some of the experiments, the drift rate function was approximately linear across most of levels of the independent variables. For others, there was flattening of the function for the very easiest conditions. Phenomenologically, as stimuli become more and more extreme, they begin to look quite similar to each other and quite different from stimuli near the cutoff between the two responses.
The finding that z-transformed accuracy functions follow the shapes of drift rate functions closely in some of the experiments but not others is an important one. At this point, there is no theoretical basis that I know of to understand when there will be differences between the two and when not, and there do not seem to be any generalizations that can be drawn from the experiments presented here. This indicates that generalizations and empirical relationships between drift rate and z-transform functions need to be investigated on a case-by-case basis.
The drift rate criterion
At the beginning of an experiment, subjects decide, probably implicitly, where the split should be between stimuli for which they make one response and stimuli for which they make the other response. In the diffusion model, this is the drift rate criterion; it sets the zero point above which drift rate is positive and below which it is negative. This is exactly analogous to the criterion in SDT. Subjects can change the drift criterion quickly, between trials, as evidenced in Experiment 11 where the cutoff between the stimuli for one response and the stimuli for the other changed on a trial-by-trial basis.
For all the experiments described in this article, subjects set the drift rate criterion on the basis of verbal instructions, and they did so immediately at the beginning of an experiment. For example, when subjects were told to call anything over 24 asterisks “large” and anything below or equal to 24 “small,” they were able to respond correctly even on the first few trials. This suggests that a large component of criterion placement was prior experience. There have been investigations of how criteria are learned over the course of an experiment through feedback (e.g., McKinley & Nosofsky, 1995; Turner, Van Zandt, & Brown, 2011). However, how criteria are set by verbal instructions and experience is an open question.
Investigation into how criteria are set is further complicated by considering relations between human and animal performance. In animal studies of perceptual decision making, months of training are often required before testing can begin, which can mean that a tight connection is established between stimulus and response. However, humans demonstrate a high degree of flexibility, with verbal instructions calibrating performance. They can perform any one of a number of different discrimination tasks based on a single stimulus. In general, this process of calibrating and focusing on the decision variable has rarely been studied experimentally.
A broader point is that the range of values on some dimensions is quite large. For example, the human visual and auditory systems have dynamic ranges that can discriminate stimuli in the range of at least 109 in luminance for vision and power for sound. For any particular task, only parts of the range may be used: Discriminating between two visual stimuli in moonlight is at a different part of the luminance scale than discriminating between two stimuli in bright sunlight. The human processing system can discriminate quite small differences in these wide ranges of scales. Gallistel (2011) has discussed this issue and described the notion of autoscaling. The idea is that the processing system (the measurement instrument in Gallistel’s discussion) has a limited dynamic range, but that the range and the degree of sensitivity is adjusted to the stimulus range. In other words, a difference of 10 asterisks between two arrays of asterisks is moderately discriminable in the middle of a 1–100 scale, but not in the middle of a 1–1000 scale.
Independent variables and drift rate
Although the diffusion model provides estimates of drift rate as a function of independent variables that are manipulated in an experiment, it cannot be assumed that the independent variables are actually responsible for changing difficulty and hence changing drift rates. For example, in brightness discrimination with arrays of black and white pixels, it might be that luminance is the variable determining drift rate, that the proportion of black to white pixels is the determining variable, or that the density of local areas of black and white pixels is the determining variable. These different dimensions are all correlated when all that is manipulated is the proportion of black to white pixels, as was done in Experiments 6 and 7.
It also cannot be assumed that, whatever the dimension controlling drift rates, there is a single, simple processing stream that maps directly from the representation produced by perceptual or cognitive processes to the variable on which the decision is based. This might suggest that the time taken for nondecision processes is independent of task. However, as noted in the introduction, this does not occur. Encoding processes need to transform stimulus information into different representations for different tasks, and there is no reason to think that these transformations will take the same amounts of time.
To reiterate what was said in the Introduction, nondecision time can be around 200 ms shorter when all that is required is a key press as soon as a stimulus appears than when a two-choice decision is required (e.g., Ratcliff & Van Dongen, 2011, supplementary Table S4). In terms of the diffusion model, this means that the information produced by the perceptual processes that translate stimulus information into a decision variable may need to be different for different tasks.
Studies by Philiastides et al. (2006; also Ratcliff, Philiastides, & Sajda, 2009) take this argument a step further. They examined two tasks that used the same stimuli, faces and cars. For one task, subjects decided if a stimulus was a face or a car. For the other task, the stimuli were colored red or green and subjects decided if the stimulus was red or green. For face/car discrimination, Philiastides et al. observed two EEG components, one earlier than the other by over 130 ms. For red/green discrimination, the late component disappeared. They interpreted these data as showing similar representations of perceptual information for the two tasks but different representations of decision-related information.
Integrated models and functional forms
One way to approach differences in the representations produced by perceptual and cognitive processes for different tasks is to develop models that integrate encoding and decision processes. One aid in developing such models is to derive functional relationships between model components and independent variables. For example, Ratcliff (1978) showed how several independent variables affected RT and accuracy and drift rate in recognition memory and discussed how the drift rate might provide a meeting point with memory models. For a two-choice perceptual task, perceptual processes transform the features of a stimulus that are relevant to the decision onto a unidimensional variable and the value of this variable would then drive the decision process (e.g., Ashby, 2000).
There have been several successful efforts to do this, such that the models do more than produce a simple drift rate function for only one independent variable. Nosofsky et al. (2011; see also Nosofsky & Palmeri, 1997) spelled out the processes that could generate a measure of the similarity of one stimulus to another in a short-term memory task, with this measure driving a sequential-sampling accumulator model. The model produced an impressive account of RT and accuracy data from a large number of conditions with only a few parameters. In a model proposed by Ratcliff (1981), perceptual processes transform strings of letters into distributed representations. The representation of each letter in the string overlaps with the representations of letters that are nearby in the string and the amount of overlap between a study string and a test string drives a diffusion decision process. This model accounted for the relative difficulty of stimulus conditions and RT and accuracy values. Smith and Ratcliff (2009) developed a model to explain the effects of stimulus contrast, masking, and attention on perception, which when coupled with a diffusion decision process, produced a successful explanation of RTs and accuracy.White et al. (2011) successfully explained data from perceptual conflict tasks with a model that computed a shrinking spotlight over a distributed representation of stimuli combined with a diffusion decision process.
Conclusion
In all of the 11 experiments above, I examined the mapping between perceptual or cognitive processes and the decision variable that drives a diffusion decision process. In some cases, the mapping was approximately linear across the whole range of stimulus difficulty and in some it flattened out at the extremes. For all 11 experiments, the psychometric function plotting drift rates was crucially different than the functions of accuracy and RTs. The shapes of z-transformed accuracy functions matched the shapes of drift rate functions well in the middles of the ranges of independent variables but sometimes not in the tails. In terms of the data, a miss between drift rates and z-transformed accuracy was signaled by a continuing decrease in RT, as the stimulus became easier, after accuracy had asymptoted.
The challenge implicit in this research is threefold. First, models like those described in the previous section, are needed that can map from a stimulus to a representation of the stimulus to a decision variable (such as the examples reviewed in the previous section). Second, such a model must account for the effects of a large enough number of independent variables so that a comprehensive picture of processing can be observed (e.g., Nosofsky et al., 2011; Smith & Ratcliff, 2009). Third, such a model must be able to map from multi-dimensional stimuli to a single-dimensional decision variable in different ways for different tasks. The diffusion model and other sequential-sampling models provide a test of models like these-- whether the encodings of stimuli that they produce can feed through the decision model to give correct predictions for performance.
Supplementary Material
Acknowledgements
This article was supported by grant NIA R01-AG041176 and AFOSR grant FA9550-11-1-0130. I thank Vince Fererra for use of his data in Experiment 11.
References
- Ashby FG. A stochastic version of general recognition theory. Journal of Mathematical Psychology. 2000;44:310–329. doi: 10.1006/jmps.1998.1249. [DOI] [PubMed] [Google Scholar]
- Ball K, Sekuler R. A specific and enduring improvement in visual motion discrimination. Science. 1982;218:697–698. doi: 10.1126/science.7134968. [DOI] [PubMed] [Google Scholar]
- Britten KH, Shadlen MN, Newsome WT, Movshon JA. The analysis of visual motion: A comparison of neuronal and psychophysical performance. Journal of Neuroscience. 1992;12:4745–4765. doi: 10.1523/JNEUROSCI.12-12-04745.1992. [DOI] [PMC free article] [PubMed] [Google Scholar]
- DeCarlo LT. Signal detection theory and generalized linear models. Psychological Methods. 1998;3:186–205. [Google Scholar]
- Espinoza-Varas B, Watson C. Effects of decision criterion on response latencies of binary decisions. Perception and Psychophysics. 1994;55:190–203. doi: 10.3758/bf03211666. [DOI] [PubMed] [Google Scholar]
- Gallistel CR. Mental magnitudes. In: Dehaene S, Brannon E, editors. Space, Time, and Number in the Brain. Elsevier; 2011. pp. 3–12. [Google Scholar]
- Garner WR. The processing of information and structure. Potomac, MD: Lawrence Erlbaum Associates; 1974. [Google Scholar]
- Geddes J, Ratcliff R, Allerhand M, Childers R, Wright RJ, Frier BM, Deary IJ. Modeling the effects of hypoglycemia on a two-choice task in adult humans. Neuropsychology. 2010;24:652–660. doi: 10.1037/a0020074. [DOI] [PubMed] [Google Scholar]
- Gilmore C, Attridge N, Inglis M. Measuring the approximate number system. Quarterly Journal Of Experimental Psychology. 2011;64:2099–2109. doi: 10.1080/17470218.2011.574710. [DOI] [PubMed] [Google Scholar]
- Gold JI, Shadlen MN. Neural computations that underlie decisions about sensory stimuli. Trends in Cognitive Science. 2001;5:10–16. doi: 10.1016/s1364-6613(00)01567-9. [DOI] [PubMed] [Google Scholar]
- Grinband J, Hirsch J, Ferrera VP. A neural representation of categorization uncertainty in the human brain. Neuron. 2006;49:757–763. doi: 10.1016/j.neuron.2006.01.032. [DOI] [PubMed] [Google Scholar]
- Halberda J, Ly R, Wilmer JB, Naiman DQ, Germine L. Number sense across the lifespan as revealed by a massive Internet-based sample. Proceedings Of The National Academy Of Sciences Of The United States Of America. 2012;109:11116–11120. doi: 10.1073/pnas.1200196109. [DOI] [PMC free article] [PubMed] [Google Scholar]
- Halberda J, Mazzocco MMM, Feigenson L. Individual differences in nonverbal number acuity predict maths achievement. Nature. 2008;455:665–668. doi: 10.1038/nature07246. [DOI] [PubMed] [Google Scholar]
- Hanes DP, Schall JD. Neural control of voluntary movement initiation. Science. 1996;274:427–430. doi: 10.1126/science.274.5286.427. [DOI] [PubMed] [Google Scholar]
- Heekeren HR, Marrett S, Bandettini PA, Ungerleider LG. A general mechanism for perceptual decision-making in the human brain. Nature. 2004;431:859–862. doi: 10.1038/nature02966. [DOI] [PubMed] [Google Scholar]
- Holloway ID, Ansari D. Mapping numerical magnitudes onto symbols: The numerical distance effect and individual differences in children’s mathematics achievement. Journal of Experimental Child Psychology. 2009;103:17–29. doi: 10.1016/j.jecp.2008.04.001. [DOI] [PubMed] [Google Scholar]
- Huang-Pollock CL, Karalunas SL, Tam H, Moore AN. Vigilance deficits in ADHD: A meta-analysis of CPT performance. Journal of Abnormal Psychology. doi: 10.1037/a0027205. (in press). [DOI] [PMC free article] [PubMed] [Google Scholar]
- Laming DRJ. Information theory of choice reaction time. New York: Wiley; 1968. [Google Scholar]
- Leite FP, Ratcliff R. What cognitive processes drive response biases? A diffusion model analysis. Judgment and Decision Making. 2011;6:651–687. [Google Scholar]
- Link SW. The relative judgement theory of two choice response time. Journal of Mathematical Psychology. 1975;12:114–135. [Google Scholar]
- Link Stephen W. The relative judgment theory of the psychometric function. In: Requin J, editor. Attention and Performance VII. Hillsdale, NJ; Lawrence Erlbaum Associates; 1978. pp. 619–630. [Google Scholar]
- Link SW. The wave theory of difference and similarity. Hillsdale, NJ: Lawrence Erlbaum Associates; 1992. [Google Scholar]
- Link SW, Heath RA. A sequential theory of psychological discrimination. Psychometrika. 1975;40:77–105. [Google Scholar]
- Maloney E, Risko E, Preston F, Ansari D, Fugelsang J. Challenging the reliability and validity of cognitive measures: the case of the numerical distance effect. Acta Psychologica. 2010;134:154–161. doi: 10.1016/j.actpsy.2010.01.006. [DOI] [PubMed] [Google Scholar]
- Macmillan NA, Creelman CD. Detection theory: A user’s guide. Cambridge: Cambridge University Press; 1991. [Google Scholar]
- McKinley SC, Nosofsky RM. Investigations of exemplar and decision bound models in large, ill-defined category structures. Journal of Experimental Psychology: Human Perception & Performance. 1995;21:128–148. doi: 10.1037//0096-1523.21.1.128. [DOI] [PubMed] [Google Scholar]
- Mulder MJ, Bos D, Weusten JMH, van Belle J, van Dijk SC, Simen P, van Engeland H, Durson S. Basic impairments in regulating the speed-accuracy tradeoff predict symptoms of attention-deficit/hyperactivity disorder. Biological Psychiatry. 2010;68:1114–1119. doi: 10.1016/j.biopsych.2010.07.031. [DOI] [PubMed] [Google Scholar]
- Nosofsky RM. Attention and learning processes in the identification and categorization of integral stimuli. Journal of Experimental Psychology: Learning, Memory, and Cognition. 1987;13:87–109. doi: 10.1037//0278-7393.13.1.87. [DOI] [PubMed] [Google Scholar]
- Nosofsky RM, Palmeri TJ. An exemplar based random walk model of speeded classification. Psychological Review. 1997;104:266–300. doi: 10.1037/0033-295x.104.2.266. [DOI] [PubMed] [Google Scholar]
- Nosofsky RM, Little DR, Donkin C, Fific M. Short-term memory scanning viewed as exemplar-based categorization. Psychological Review. 2011;118:280–315. doi: 10.1037/a0022494. [DOI] [PMC free article] [PubMed] [Google Scholar]
- Ogilvie JC, Creelman CD. Maximum likelihood estimation of receiver operating characteristic curve parameters. Journal of Mathematical Psychology. 1968;5:377–391. [Google Scholar]
- Palmer J, Huk AC, Shadlen MN. The effect of stimulus strength on the speed and accuracy of a perceptual decision. Journal of Vision. 2005;5:376–404. doi: 10.1167/5.5.1. [DOI] [PubMed] [Google Scholar]
- Philiastides MG, Ratcliff R, Sajda P. Neural Representation of Task Difficulty and Decision-Making During Perceptual Categorization: A Timing Diagram. Journal of Neuroscience. 2006;26:8965–8975. doi: 10.1523/JNEUROSCI.1655-06.2006. [DOI] [PMC free article] [PubMed] [Google Scholar]
- Pleskac TJ, Busemeyer JR. Two-stage dynamic signal detection: A theory of choice, decision time, and confidence. Psychological Review. 2010;117:864–901. doi: 10.1037/a0019737. [DOI] [PubMed] [Google Scholar]
- Price G, Palmer D, Battista C, Ansari D. Nonsymbolic numerical magnitude comparison: reliability and validity of different task variants and outcome measures, and their relationship to arithmetic achievement in adults. Acta Psychologica. 2012;140:50–57. doi: 10.1016/j.actpsy.2012.02.008. [DOI] [PubMed] [Google Scholar]
- Ratcliff R. A theory of memory retrieval. Psychological Review. 1978;85:59–108. [Google Scholar]
- Ratcliff R. A theory of order relations in perceptual matching. Psychological Review. 1981;88:552–572. [Google Scholar]
- Ratcliff R. Theoretical interpretations of speed and accuracy of positive and negative responses. Psychological Review. 1985;92:212–225. [PubMed] [Google Scholar]
- Ratcliff R. A diffusion model account of reaction time and accuracy in a two choice brightness discrimination task: Fitting real data and failing to fit fake but plausible data. Psychonomic Bulletin and Review. 2002;9:278–291. doi: 10.3758/bf03196283. [DOI] [PubMed] [Google Scholar]
- Ratcliff R. Modeling aging effects on two-choice tasks: response signal and response time data. Psychology and Aging. 2008;23:900–916. doi: 10.1037/a0013930. [DOI] [PMC free article] [PubMed] [Google Scholar]
- Ratcliff R. Parameter variability and distributional assumptions in the diffusion model. Psychological Review. 2013;120:281–292. doi: 10.1037/a0030775. [DOI] [PMC free article] [PubMed] [Google Scholar]
- Ratcliff R, Cherian A, Segraves M. A comparison of macaque behavior and superior colliculus neuronal activity to predictions from models of simple two-choice decisions. Journal of Neurophysiology. 2003;90:1392–1407. doi: 10.1152/jn.01049.2002. [DOI] [PubMed] [Google Scholar]
- Ratcliff R, Frank M. Reinforcement-based decision making in corticostriatal circuits: mutual constraints by neurocomputational and diffusion models. Neural Computation. 2012;24:1186–1229. doi: 10.1162/NECO_a_00270. [DOI] [PubMed] [Google Scholar]
- Ratcliff R, Love J, Thompson CA, Opfer J. Children are not like older adults: A diffusion model analysis of developmental changes in speeded responses. Child Development. 2012;83:367–381. doi: 10.1111/j.1467-8624.2011.01683.x. [DOI] [PMC free article] [PubMed] [Google Scholar]
- Ratcliff R, McKoon G. The diffusion decision model: Theory and data for two-choice decision tasks. Neural Computation. 2008;20:873–922. doi: 10.1162/neco.2008.12-06-420. [DOI] [PMC free article] [PubMed] [Google Scholar]
- Ratcliff R, Philiastides MG, Sajda P. Quality of evidence for perceptual decision making is indexed by trial-to-trial variability of the EEG. Proceedings of the National Academy of Sciences. 2009;106:6539–6544. doi: 10.1073/pnas.0812589106. [DOI] [PMC free article] [PubMed] [Google Scholar]
- Ratcliff R, Rouder JN. Modeling Response Times for Two-Choice Decisions. Psychological Science. 1998;9:347–356. [Google Scholar]
- Ratcliff R, Rouder JN. A diffusion model account of masking in two-choice letter identification. Journal of Experimental Psychology: Human Perception and Performance. 2000;26:127–140. doi: 10.1037//0096-1523.26.1.127. [DOI] [PubMed] [Google Scholar]
- Ratcliff R, Smith PL. A comparison of sequential sampling models for two-choice reaction time. Psychological Review. 2004;111:333–367. doi: 10.1037/0033-295X.111.2.333. [DOI] [PMC free article] [PubMed] [Google Scholar]
- Ratcliff R, Smith PL. Perceptual discrimination in static and dynamic noise: the temporal relation between perceptual encoding and decision making. Journal of Experimental Psychology: General. 2010;139:70–94. doi: 10.1037/a0018128. [DOI] [PMC free article] [PubMed] [Google Scholar]
- Ratcliff R, Spieler D, McKoon G. Explicitly modeling the effects of aging on response time. Psychonomic Bulletin and Review. 2000;7:1–25. doi: 10.3758/bf03210723. [DOI] [PubMed] [Google Scholar]
- Ratcliff R, Starns JJ. Modeling confidence and response time in recognition memory. Psychological Review. 2009;116:59–83. doi: 10.1037/a0014086. [DOI] [PMC free article] [PubMed] [Google Scholar]
- Ratcliff R, Starns JJ. Modeling multichoice decisions, response times, and confidence judgments. Psychological Review. doi: 10.1037/a0033152. (in press). [DOI] [PMC free article] [PubMed] [Google Scholar]
- Ratcliff R, Thapar A, Gomez P, McKoon G. A diffusion model analysis of the effects of aging in the lexical-decision task. Psychology and Aging. 2004;19:278–289. doi: 10.1037/0882-7974.19.2.278. [DOI] [PMC free article] [PubMed] [Google Scholar]
- Ratcliff R, Thapar A, McKoon G. The effects of aging on reaction time in a signal detection task. Psychology and Aging. 2001;16:323–341. [PubMed] [Google Scholar]
- Ratcliff R, Thapar A, McKoon G. A diffusion model analysis of the effects of aging on brightness discrimination. Perception and Psychophysics. 2003;65:523–535. doi: 10.3758/bf03194580. [DOI] [PMC free article] [PubMed] [Google Scholar]
- Ratcliff R, Thapar A, McKoon G. A diffusion model analysis of the effects of aging on recognition memory. Journal of Memory and Language. 2004;50:408–424. [Google Scholar]
- Ratcliff R, Thapar A, McKoon G. Aging and individual differences in rapid two-choice decisions. Psychonomic Bulletin and Review. 2006;13:626–635. doi: 10.3758/bf03193973. [DOI] [PMC free article] [PubMed] [Google Scholar]
- Ratcliff R, Thapar A, McKoon G. Individual differences, aging, and IQ in two-choice tasks. Cognitive Psychology. 2010;60:127–157. doi: 10.1016/j.cogpsych.2009.09.001. [DOI] [PMC free article] [PubMed] [Google Scholar]
- Ratcliff R, Thapar A, McKoon G. Effects of aging and IQ on item and associative memory. Journal of Experimental Psychology: General. 2011;140:46–487. doi: 10.1037/a0023810. [DOI] [PMC free article] [PubMed] [Google Scholar]
- Ratcliff R, Thompson CA, McKoon G. A diffusion model analysis of three numeracy tasks. (submitted). [Google Scholar]
- Ratcliff R, Tuerlinckx F. Estimating the parameters of the diffusion model: Approaches to dealing with contaminant reaction times and parameter variability. Psychonomic Bulletin and Review. 2002;9:438–481. doi: 10.3758/bf03196302. [DOI] [PMC free article] [PubMed] [Google Scholar]
- Ratcliff R, Van Dongen HPA. Sleep deprivation affects multiple distinct cognitive processes. Psychonomic Bulletin and Review. 2009;16:742–751. doi: 10.3758/PBR.16.4.742. [DOI] [PMC free article] [PubMed] [Google Scholar]
- Ratcliff R, Van Dongen HPA. A diffusion model for one-choice reaction time tasks and the cognitive effects of sleep deprivation. Proceedings of the National Academy of Sciences. 2011;108:11285–11290. doi: 10.1073/pnas.1100483108. [DOI] [PMC free article] [PubMed] [Google Scholar]
- Ratcliff R, Van Zandt T, McKoon G. Connectionist and diffusion models of reaction time. Psychological Review. 1999;106:261–300. doi: 10.1037/0033-295x.106.2.261. [DOI] [PubMed] [Google Scholar]
- Roe RM, Busemeyer JR, Townsend JT. Multialternative decision field theory: A dynamic connectionist model of decision-making. Psychological Review. 2001;108:370–392. doi: 10.1037/0033-295x.108.2.370. [DOI] [PubMed] [Google Scholar]
- Sasanguie D, Defever E, Van den Bussche E, Reynvoet B. The reliability of and the relation between non-symbolic numerical distance effects in comparison, same-different judgments and priming. Acta Psychologica. 2011;136:73–80. doi: 10.1016/j.actpsy.2010.10.004. [DOI] [PubMed] [Google Scholar]
- Schall JD, Purcell BA, Heitz RP, Logan GD, Palmeri TJ. Neural mechanisms of saccade target selection: gated accumulator model of the visual-motor cascade. European Journal of Neuroscience. 2011;33:1991–2002. doi: 10.1111/j.1460-9568.2011.07715.x. [DOI] [PMC free article] [PubMed] [Google Scholar]
- Smith PL. A Note on the distribution of response times for a random walk with Gaussian increments. Journal of Mathematical Psychology. 1990;34:445–459. [Google Scholar]
- Smith PL, Ratcliff R. An integrated theory of attention and decision making in visual signal detection. Psychological Review. 2009;116:283–317. doi: 10.1037/a0015156. [DOI] [PubMed] [Google Scholar]
- Spaniol J, Madden DJ, Voss A. A diffusion model analysis of adult age differences in episodic and semantic long-term memory retrieval. Journal of Experimental Psychology: Learning, Memory, and Cognition. 2006;32:101–117. doi: 10.1037/0278-7393.32.1.101. [DOI] [PMC free article] [PubMed] [Google Scholar]
- Starns JJ, Ratcliff R. The effects of aging on the speed-accuracy compromise: Boundary optimality in the diffusion model. Psychology and Aging. 2010;5:377–390. doi: 10.1037/a0018022. [DOI] [PMC free article] [PubMed] [Google Scholar]
- Starns JJ, Ratcliff R. Age-related differences in diffusion model boundary optimality with both trial-limited and time-limited tasks. Psychonomic Bulletin and Review. 2012;19:139–145. doi: 10.3758/s13423-011-0189-3. [DOI] [PubMed] [Google Scholar]
- Thapar A, Ratcliff R, McKoon G. A diffusion model analysis of the effects of aging on letter discrimination. Psychology and Aging. 2003;18:415–429. doi: 10.1037/0882-7974.18.3.415. [DOI] [PMC free article] [PubMed] [Google Scholar]
- Tuerlinckx F, De Boeck P. Two interpretations of the discrimination parameter. Psychometrika. 2005;70:629–650. [Google Scholar]
- Turner BM, Van Zandt T, Brown S. A dynamic, stimulus-driven model of signal detection. Psychological Review. 2011;118:583–613. doi: 10.1037/a0025191. [DOI] [PubMed] [Google Scholar]
- Usher M, McClelland JL. The time course of perceptual choice: The leaky, competing accumulator model. Psychological Review. 2001;108:550–592. doi: 10.1037/0033-295x.108.3.550. [DOI] [PubMed] [Google Scholar]
- Vandekerckhove J, Tuerlinckx F. Diffusion model analysis with MATLAB: A DMAT primer. Behavior Research Methods. 2008;40:61–72. doi: 10.3758/brm.40.1.61. [DOI] [PubMed] [Google Scholar]
- Vandekerckhove J, Tuerlinckx F, Lee MD. Hierarchical diffusion models for two-choice response times. Psychological Methods. 2011;16:44–62. doi: 10.1037/a0021765. [DOI] [PubMed] [Google Scholar]
- van der Maas HLJ, Molenaar D, Maris G, Kievit RA, Borsboom D. Cognitive psychology meets psychometric theory. Psychological Review. 2011;118:339–356. doi: 10.1037/a0022749. [DOI] [PubMed] [Google Scholar]
- van Ravenzwaaij D, Dutilh G, Wagenmakers E. A diffusion model decomposition of the effects of alcohol on perceptual decision making. Psychopharmacology. 2012;219:1017–1025. doi: 10.1007/s00213-011-2435-9. [DOI] [PMC free article] [PubMed] [Google Scholar]
- Voss A, Voss J. Fast-dm: A free program for efficient diffusion model analysis. Behavior Research Methods. 2007;39:767–775. doi: 10.3758/bf03192967. [DOI] [PubMed] [Google Scholar]
- Wagenmakers E-J. Methodological and empirical developments for the Ratcliff diffusion model of response times and accuracy. European Journal of Cognitive Psychology. 2009;21:641–671. [Google Scholar]
- Wagenmakers E-J, Ratcliff R, Gomez P, McKoon G. A diffusion model account of criterion shifts in the lexical decision task. Journal of Memory and Language. 2008;58:140–159. doi: 10.1016/j.jml.2007.04.006. [DOI] [PMC free article] [PubMed] [Google Scholar]
- White C, Ratcliff R, Vasey M, McKoon G. Dysphoria and memory for emotional material: A diffusion model analysis. Cognition and Emotion. 2009;23:181–205. doi: 10.1080/02699930801976770. [DOI] [PMC free article] [PubMed] [Google Scholar]
- White CN, Ratcliff R, Vasey MW, McKoon G. Using diffusion models to understand clinical disorders. Journal of Mathematical Psychology. 2010a;54:39–52. doi: 10.1016/j.jmp.2010.01.004. [DOI] [PMC free article] [PubMed] [Google Scholar]
- White CN, Ratcliff R, Vasey MW, McKoon G. Anxiety enhances threat processing without competition among multiple inputs: A diffusion model analysis. Emotion. 2010b;10:662–677. doi: 10.1037/a0019474. [DOI] [PubMed] [Google Scholar]
- White CN, Ratcliff R, Starns JJ. Diffusion models of the flanker task: Discrete versus gradual attentional selection. Cognitive Psychology. 2011;63:210–238. doi: 10.1016/j.cogpsych.2011.08.001. [DOI] [PMC free article] [PubMed] [Google Scholar]
- Wiecki TV, Sofer I, Frank MJ. HDDM: Hierarchical Bayesian estimation of the Drift-Diffusion Model in Python. Frontiers in Neuroinformatics. 2013;7 doi: 10.3389/fninf.2013.00014. [DOI] [PMC free article] [PubMed] [Google Scholar]
- Wong K-F, Wang X-J. A recurrent network mechanism for time integration in perceptual decisions. Journal of Neuroscience. 2006;26:1314–1328. doi: 10.1523/JNEUROSCI.3733-05.2006. [DOI] [PMC free article] [PubMed] [Google Scholar]
- Woodworth RS. Experimental Psychology. New York: Henry Holt & Company; 1938. [Google Scholar]
- Zeguers MHT, Snellings P, Tijms J, Weeda WD, Tamboer P, Bexkens A, Huizenga HM. Specifying Theories of Developmental Dyslexia: A Diffusion Model Analysis of Word Recognition. Developmental Science. 2011;14:1340–1354. doi: 10.1111/j.1467-7687.2011.01091.x. [DOI] [PubMed] [Google Scholar]
Associated Data
This section collects any data citations, data availability statements, or supplementary materials included in this article.