Abstract
Kramers developed the theory on how chemical reaction rates are influenced by the viscosity of the medium1,2. At the viscosity of water, the kinetics of unimolecular reactions are described by diffusion of a Brownian particle over a free-energy barrier separating reactants and products. For reactions in solution this famous theory extended Eyring's transition state theory, and is widely applied in physics, chemistry, and biology, including reactions as complex as protein folding3,4. Because the diffusion coefficient of Kramers theory is determined by the dynamics in the sparsely-populated region of the barrier top, its properties have not been directly measured for any molecular system. Here we show that the Kramers diffusion coefficient and free energy barrier can be characterized by measuring the temperature- and viscosity-dependence of the transition path time for protein folding. The transition path is the small fraction of an equilibrium trajectory for a single molecule when the free-energy barrier separating two states is actually crossed (Fig. 1a). Its duration, the transition path time, can now be determined from photon trajectories for single protein molecules undergoing folding/unfolding transitions5. Our finding of a long transition path time with an unusually small solvent viscosity-dependence suggests that internal friction as well as solvent friction determine the Kramers diffusion coefficient for α-helical proteins, as opposed to a breakdown of his theory that occurs for many small-molecule reactions2. It is noteworthy that the new and fundamental information concerning Kramers theory and the dynamics of barrier crossings obtained here come from experiments on a protein rather than a much simpler chemical or physical system.
The molecule studied in this work is the all-α-helical 73 residue, designed protein, α3D (Fig. 1b, Extended Data Fig. 1). In single-molecule experiments6, as well as in all-atom molecular dynamics simulations7, α3D is a two-state protein (Fig. 1a) at neutral pH (Extended Data Figs. 3,4), i.e. only two states are observable at equilibrium and at all times in kinetic experiments. In the single molecule studies reported here we use the maximum likelihood method of Gopich and Szabo8 in a photon-by-photon analysis of the fluorescence trajectories to obtain both the average transition path time (tTP) and, from the mean residence time in the unfolded state, the folding time (tf) (the reciprocal of the folding rate coefficient)6,9,10. The basic idea of their method is to determine the most likely parameters of an assumed model that are most consistent with a collection of photon trajectories for which the color and interval between each photon are known. For diffusive barrier crossings the times, tf and tTP, are given by the following two equations,
Figure 1.
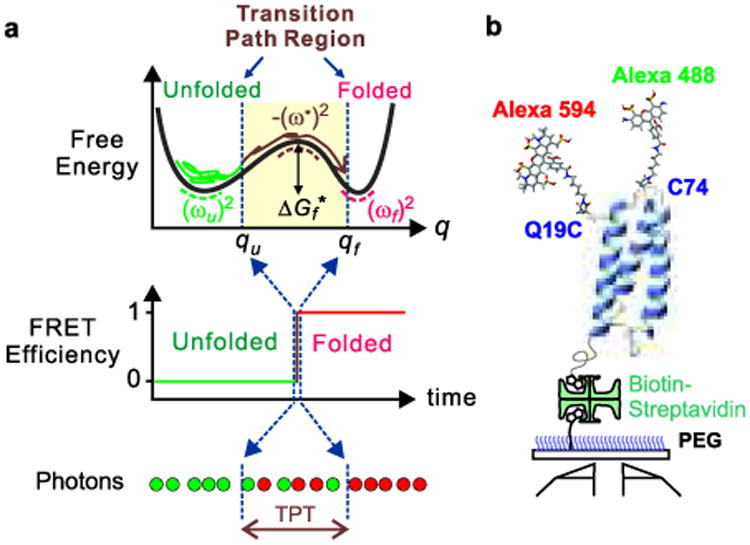
Schematics of α3D structure and a one-dimensional free energy surface for a two-state protein. a, Free energy as a function of reaction coordinate (q), a segment of a FRET efficiency trajectory, and a segment of a photon trajectory (red: acceptor; green: donor) indicating the transition path time (TPT) in the idealized case where there is no noise in the FRET efficiency in either the unfolded or folded states because they are exactly 0 and 1, respectively. In the folding reaction, the vast majority of the time is spent exploring the configurations of the unfolded well (called the waiting or residence time) with numerous unsuccessful attempts at crossing the free energy barrier to the folded state. The diagram indicates that the “jump” in the FRET efficiency corresponds to the transition path. The brown trajectory on a transition path is one that leaves the unfolded well, crosses the position qu on the reaction coordinate, and reaches qf on the other side of the barrier without re-crossing qu. b, Dye-labeled α3D molecules are immobilized on a polyethylene glycol-coated glass surface via a biotin-streptavidin-biotin linkage.
Extended Data Figure 1.

Amino acid sequences of polypeptides containing protein α3D. Dyes were attached to the cysteine residues (red) and a biotin molecule was attached to the lysine residue (blue) in the AviTag sequence.
Extended Data Figure 3.
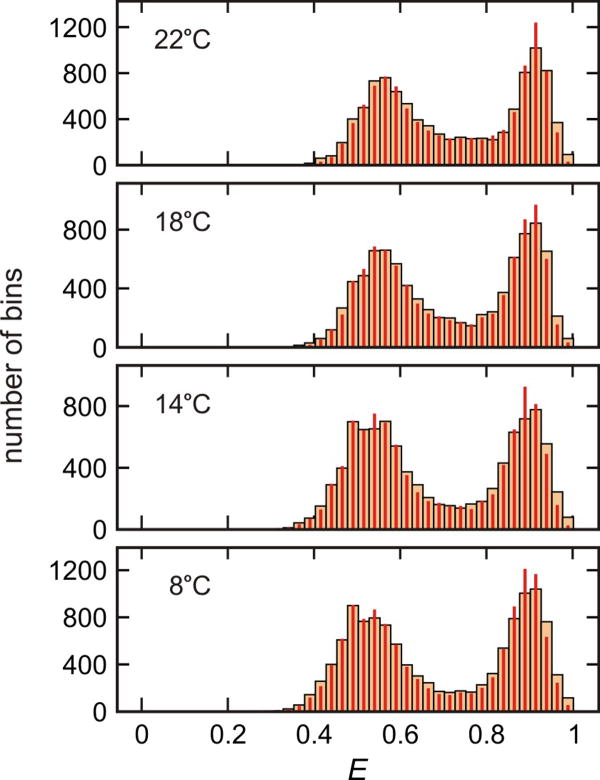
FRET efficiency histograms of α3D in 2.25 M GdmCl solution at different temperatures. The FRET efficiency histograms were constructed from 1 ms bins in the trajectories with the mean photon count rate > 40 ms-1. Wide and narrow bars are the experimental histograms and the histograms constructed from recolored photon trajectories using the parameters obtained from the maximum likelihood method with the two-state model (Extended Data Table 1), respectively. The agreement between the two histograms validates the description of α3D as a two-state folder8. The similar ratio of the integral of the folded (high FRET) and the unfolded (low FRET) distributions indicates that the equilibrium constant is unchanged over the temperature range of the measurement, as shown more precisely in the maximum likelihood analysis. At high temperature and low pH, where the 11 glutamates and 1 aspartate are protonated, more than two states are observed36,37.
Extended Data Figure 4.

Donor–acceptor cross-correlation functions at different temperatures. Black solid lines are exponential functions that best fit the data. The fitting parameters are listed in Extended Data Table 1.
| (1) |
| (2) |
where D* is the diffusion coefficient at the free energy barrier top, (ω*)2 and (ωu)2 are the curvatures of the free energy surface at the barrier top and the unfolded well, respectively, and ΔGf* is the free energy barrier height (Fig. 1b). β = 1/kBT, where kB is the Boltzmann constant, T is the absolute temperature, and γ is Euler’s constant (= 0.577…). Equation (1) is from Kramers1 and equation (2) from Szabo9,11, which makes the same assumptions and approximations as Kramers concerning the underlying physics. (The major difference between Kramers and transition state theory is that the pre-exponential factor of the latter does not contain a diffusion coefficient, and is simply 2π/ωu1.) D* (= kBT/ζ*, the Einstein relation) is determined by the friction, ζ*, that damps the motion across the barrier top, which in the simplest case is due entirely to solvent viscosity. Two critical assumptions in these equations are that a one-dimensional free energy surface is sufficient to accurately describe the dynamics and that the dynamics are Brownian. That a one-dimensional free-energy surface is adequate has been validated for protein folding by lattice simulations12, off-lattice simulations13,14, and by the agreement of experiment and predictions of theoretical models3,4.
An important property of equation (2) for the following development is that the transition path time is predicted to be insensitive to the barrier height, in contrast to the folding time, which is greatly affected by a small change of the barrier height that may be caused by viscogens and/or chemical denaturants even when the equilibrium population is unchanged15. This insensitivity of the transition path time to barrier height has very recently been observed in our single molecule fluorescence experiments for two proteins with folding times that differ by ∼104 -fold5. Consequently, the properties of the transition path time are expected to be determined by D*(ω*)2.
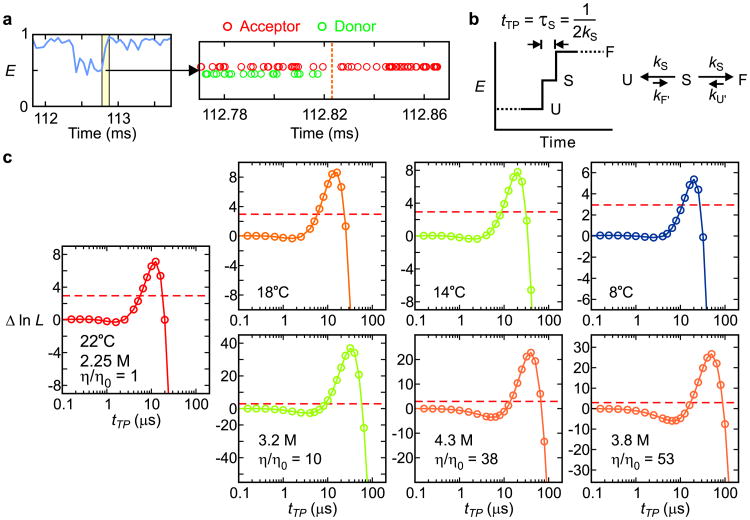
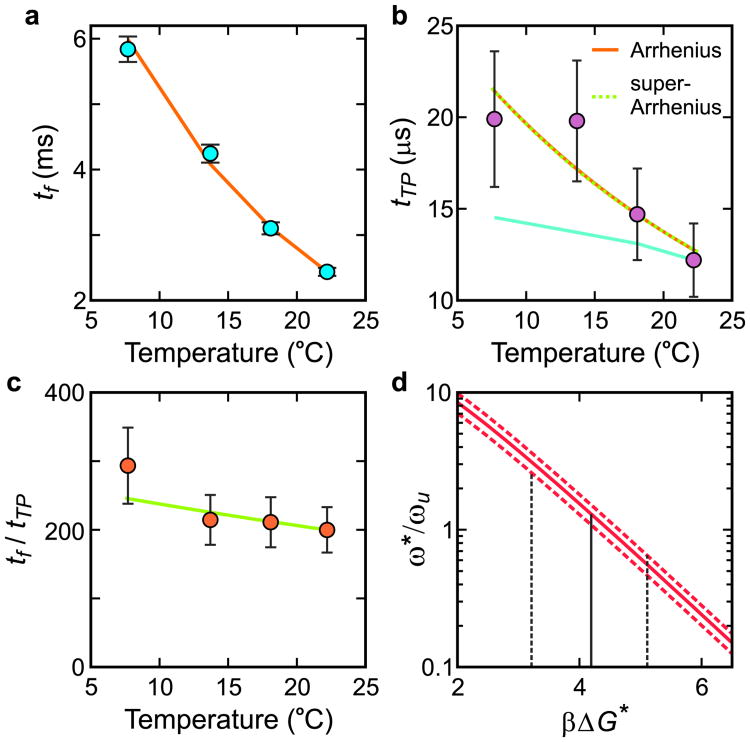
Figure 2 shows how the transition path times are determined using the Gopich-Szabo maximum likelihood method (see also Methods); Figures 3 and 4 show how the transition path and folding times depend on temperature and viscosity. One immediate result from these experiments is that the height of the free energy barrier can be simply obtained from the ratio of the folding time to the transition path time, tf/tTP (equations (1) and (2)), if ω*/ωu is known. (Although energy barrier heights for reactions are routinely determined from the temperature dependence of the rate, albeit most often without consideration of the temperature-dependence of the pre-exponential factor (equation (1)), the free energy barrier height is much more difficult to determine). ω*/ωu cannot be obtained from our experiments. We therefore use the value of 1.3 calculated from the potential of mean force in all-atom molecular dynamics simulations by Shaw and coworkers7 for α3D, which together with our measurements of tf/tTP yields a ΔGf* of 4.2 ± 1.0 kBT at 22°C (Fig. 3d and Methods). With a barrier height of 4.2 kBT, the pre-exponential factor (equation (1)) is ∼ 40 μs, significantly larger than previous estimates of ∼ 1 μs16. However, the larger pre-exponential factor is consistent with the longer transition path time of 10-20 μs for this protein compared with our previously-measured transition path times for an all- β (2 μs) and an α/β (< 10 μs) protein5.
Figure 2.
Determination of transition path times. a, A FRET efficiency trajectory (50 μs bin time) with photon trajectory of the yellow segment. b, Schematic of a FRET efficiency trajectory using a one-step model to describe the transition path from unfolded (U) to folded (F) states for a two-state protein. The average transition-path time, tTP, is equal to the lifetime of a virtual intermediate state S (τS = (2kS)-1). c, The difference of the log likelihood, Δln L = ln L(tTP) − ln L(0), plotted as a function of tTP for folding and unfolding transitions at different temperatures (upper row, 2.25 M guanidinium hydrochloride, GdmCl) and at different solvent viscosities at 22°C (lower row). L(0) is the likelihood for a two-state model with instantaneous folding and unfolding transitions. Therefore, Δln L quantifies how much better or worse the one-step model with a finite transition path time in (b) describes the photon trajectory than a two-state model with an instantaneous transition (Extended Data Fig. 2b). The maximum values of Δln L of all data are much greater than the 95% confidence limit (horizontal dashed line at Δln L = 3), which indicates that the transition-path times determined by the maximum of Δln L (Extended Data Table 1 and 2) are highly statistically significant. The number of transitions analyzed were 522 (22°C), 355 (18°C), 265 (14°C), 284 (8°C), 699 (η/η0 = 10), 541 (η/η0 = 38), and 423 (η/η0 = 53).
Figure 3.
Temperature dependence of folding and transition path times at 2.25 M GdmCl. a, Folding time. The points are the data, and the solid curve is the fit with an Arrhenius law. b, Transition path time. The points are the data, and the orange solid and green dashed curves are the fits with an Arrhenius and a super Arrrhenius law (see text), which are indistinguishable over this small temperature range. The cyan line is the predicted transition path time scaled to the transition path time at 22°C using equation (2) if the solvent were the only source of friction affecting the diffusion coefficient, D*. c, Ratio of folding to transition path times vs temperature. The points are the data and the solid curve is the temperature dependence with ΔG * = 4.2 kBT at 22°C obtained in (d). d, Determining βΔGf* at 22°C. The value of ω*/ωu is evaluated for the measured tf/tTP, 200 (continuous red curve), including its error, i.e. 233 (upper red dashed curve), and 167 (lower red dashed curve). The most probable value of ω*/ωu obtained from the MD simulations7 is 1.3, corresponding to βΔGf* = 4.2. (See Methods)
Figure 4.
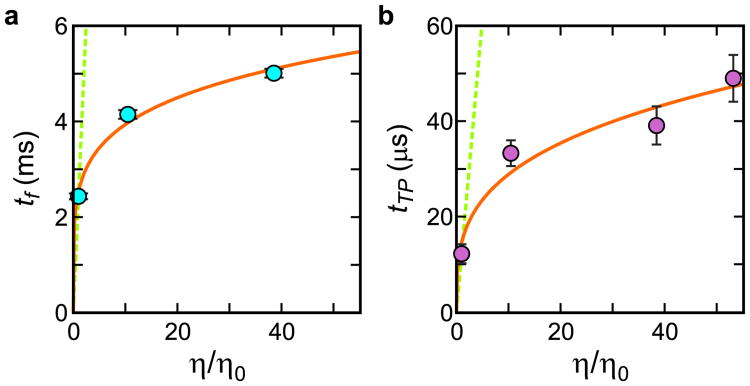
Viscosity dependence of folding and transition path times. The solid curve is a fit to the power-law function A(η/η0)α, with A = 2.5 ± 0.1 ms and α = 0.19 ± 0.01 for the folding time (a) and A = 15 ± 2 μs and α = 0.30 ± 0.03 for the transition path time (b). The green dashed lines show the dependence expected when the folding or transition path times are linearly proportional to the solvent viscosity (see Extended Data Fig. 5 and 6 and Extended Data Table 2)
For very low free-energy barriers (≲ 2 kBT), heights have previously been estimated from ensemble kinetic experiments by Gruebele and coworkers. In this case there is a significant population of partially folded molecules at the barrier top. ΔGf* was then obtained from an approximate relation: tf/tm = exp(βΔGf*), where tm is a relaxation time corresponding to a “molecular phase”, interpreted as resulting from a change in population at the barrier top produced by a temperature-jump17. Barrier heights have also been estimated from single-molecule force experiments18, and, for very low barriers, from calorimetric measurements of the excess heat capacity19. One caveat to our measurements is that FRET measures the transition path time for compaction of the polypeptide chain, which would underestimate the transition path time if collapse and folding are not simultaneous. For example, a twice-longer transition path time that could result from additional time for side-chain annealing within a compact structure would lower the barrier by only 0.7 kBT.
Since the transition path time is insensitive to the barrier height, the more interesting result is that our measurements characterize D*(ω*)2, the pre-logarithmic factor in equation (2). The temperature-dependent data suggest that the variation of the transition path time results from variation of D* and not from ω*. First, within the errors of our experiment, the small variation of the ratio tf/tTP, which does not depend on D*, is consistent with both a constant ΔGf* and ω*/ωu over this temperature range (Fig. 3c). Furthermore, the equilibrium constant does not change with temperature (Extended Data Fig. 3 and Extended Data Table 1), suggesting that the curvatures in neither the unfolded, (ωu)2, nor folded, (ωf)2, wells have changed. The invariance of the free energy surface in this temperature range is not surprising, since the protein unfolds at both lower (cold denaturation) and higher temperatures.
Extended Data Table 1.
Temperature dependence of the kinetic parameters obtained from the two-state maximum likelihood analysis, the relaxation rate obtained from the donor-acceptor cross-correlation analysis, and the transition path times.
| Temprature (°C) | 22.2 | 18.1 | 13.7 | 7.7 |
|
| ||||
| Viscosity (η/η0) | 1 | 1.07 | 1.12 | 1.19 |
|
| ||||
| EF | 0.91 (0.0005) | 0.90 (0.0006) | 0.89 (0.0006) | 0.89 (0.0006) |
| EU | 0.55 (0.0007) | 0.54 (0.0008) | 0.52 (0.0008) | 0.52 (0.0008) |
| k (ms-1) | 0.85 (0.02) | 0.66 (0.02) | 0.52 (0.01) | 0.37 (0.01) |
| pF | 0.48 (0.008) | 0.49 (0.009) | 0.46 (0.010) | 0.47 (0.010) |
|
| ||||
| Donor-acceptor cross correlation, k (ms-1) | 0.92 (0.04) | 0.64 (0.02) | 0.47 (0.02) | 0.34 (0.01) |
|
| ||||
| Transition path time (μs) | 12.2 (2.0) | 14.7 (2.5) | 19.8 (3.3) | 19.9 (3.7) |
Errors are standard deviations obtained from the diagonal elements of the covariance matrix calculated from the likelihood function. [GdmCl] = 2.25 M.
In the simplest case, when all of the friction (ζ*) opposing the motion over the barrier top is due to the solvent viscosity, η, 1/D* ∝ η. However, we find a much smaller viscosity dependence, i.e. 1/D*; ∝ ηα, with an α of only 0.3 (Fig. 4b). One might interpret this result as a breakdown of Kramers theory in which the Brownian assumption fails and causes a reduced viscosity dependence2. However, given the extremely weak viscosity dependence, the more likely possibility is that there is an additional source of friction from intra-molecular interactions20-22. This so-called internal friction has been previously used to explain the decreased viscosity dependence observed for the relaxation rate of a protein conformational change23 and the folding time of an α-helical protein under conditions where the viscogen does not perturb the equilibrium constant, and therefore is presumed not to alter the free energy surface15. A clear example of internal friction influencing protein dynamics can be found in the studies of Schuler and coworkers on the reconfiguration time of unfolded proteins and intrinsically disordered proteins, where the viscosity dependence is reduced as the polypeptide becomes more compact at the lower denaturant concentrations and increased intra-molecular interactions slow the motion of the chain24.
Additional evidence for internal friction comes from the much greater temperature dependence of the transition path time than predicted by the temperature dependence of the solvent viscosity (in the absence of added viscogen) (Fig. 3b). Using the Arrhenius law, the activation energy for D* is 11 (± 4) kBT. However, for protein folding Bryngelson and Wolynes25 showed that D* should exhibit super-Arrhenius behavior, i.e. D* ∝ exp[−(ΔE/kBT)2], which fits the data equally well (Fig. 3b), where ΔE2 is the local mean-squared fluctuation in energy and is a measure of the underlying “landscape roughness.” With this temperature dependence ΔE = 2.3 (± 0.4) kBT. Interestingly, our predicted transition path time at 370 K, the temperature of the molecular dynamics simulations7, is 1.7 μs using the Arrhenius law and 2.3 μs using the super-Arrhenius equation. Both are in excellent agreement with the observed value of 0.9 μs in the MD simulations. The agreement is even better if a viscosity correction were applied to the MD value5, because the TIP3P water used in the simulations is 3-fold less viscous than real water.
Assuming that the total friction is a simple sum of the internal friction and the friction from the solvent (ζ = ζsolvent + ζinternal) and that the internal friction is independent of solvent composition and viscosity20,23, one might have expected that the transition path time would be linear in viscosity with a non-zero intercept (Fig. 4b), as found for the myoglobin relaxation23 and atomistic folding simulations where the friction of the implicit solvent was varied26. However, at the highest concentrations of viscogen (Table S2), the solvent is largely non-aqueous (at η/η0 = 53 the solvent is only ∼7% water by weight), and our assumptions of solvent-independent internal friction, two stateness, and unchanged curvatures of the free energy surface may no longer hold.
An obviously important remaining issue is the detailed structural origin of internal friction in protein folding. What are the dominant contributions of these microscopic dynamics that give rise to internal friction and thereby slow the diffusive motion along the reaction coordinate? For dynamics involving buried residues and therefore presumably less influenced by solvent viscosity, what is the relative importance, for example, of making and breaking inter-residue contacts compared to dihedral angle flips23? How much of the internal friction results from the increased frustration caused by local non-native contacts that is more likely for a designed protein such as α3D than a naturally occurring protein27? Do non-Markovian effects contribute to the reduced viscosity dependence20,21? Why is much larger apparent internal friction observed in folding all α-helical proteins15,28,29 compared to all-β or α/β proteins (see review by Hagen30)? The answers to these fundamental questions about protein folding dynamics will require transition path time measurements on proteins of different sequences and folds in combination with further investigations by theory and simulations.
Methods
Materials
The preparation and purification of dye-labeled α3D has been described previously6.
Single molecule spectroscopy
Single molecule FRET experiments were performed using a confocal microscope system (MicroTime200, Picoquant). The CW mode of a dual mode (CW/pulsed) 485 nm diode laser (LDH-D-C-485, PicoQuant) was used to excite donor dyes through an oil-immersion objective (PlanApo, NA 1.4, ×100, Olympus). Donor and acceptor fluorescence was collected by the same objective, split into two channels, and focused through optical filters (ET525/50m for the donor and E600LP for the acceptor, Chroma Technology) onto photon-counting avalanche photodiodes (SPCM-AQR-15, PerkinElmer Optoelectronics). Additional details for the optical setup and single molecule experiments can be found elsewhere9,31.
Protein molecules were immobilized on a biotin-embedded, polyethyleneglycol-coated glass coverslip (Bio_01, Microsurfaces Inc.) via a biotin (surface)-streptavidin-biotin (protein) linkage. To reduce dye bleaching and blinking, 1 – 2 mM of l-ascorbic acid (A92902, Sigma) and methyl viologen (856117, Sigma) were added to the 50 mM Hepes buffer (pH 7.6) solution32 for the temperature-dependence experiment. For the experiments in 50% and >50% glycerol, higher concentrations of 10 mM and 40 mM ascorbic acid/methyl viologen were used, respectively, to increase the bimolecular rates that reduce blinking and bleaching.
To collect a large number of trajectories, we used an automated data collection scheme as described in ref. 5.
Temperature control and measurement
Temperature was controlled by flowing dry nitrogen cooled by liquid nitrogen into a chamber surrounding the microscope objective and sample with a fixed flow rate. The temperature was varied by changing the flow rate and was measured at the confocal spot using the fluorescence lifetime of rhodamine B33, excited by a 485 nm laser in the pulsed mode, using the calibration equation:
with T in °C.
Measurement of relative viscosities
The relative viscosities (η/η0) of the solutions were obtained from the absolute temperature (T in K) and the translational diffusion times (τ) using the relationship η ∝ τT. The translational diffusion times were measured by fluorescence correlation spectroscopy (FCS) experiments on an Alexa Fluor 488- and Alexa Fluor 594-labeled rigid rod molecule, 20-residue poly-proline, as described previously5.
Calculation of donor and acceptor cross-correlation
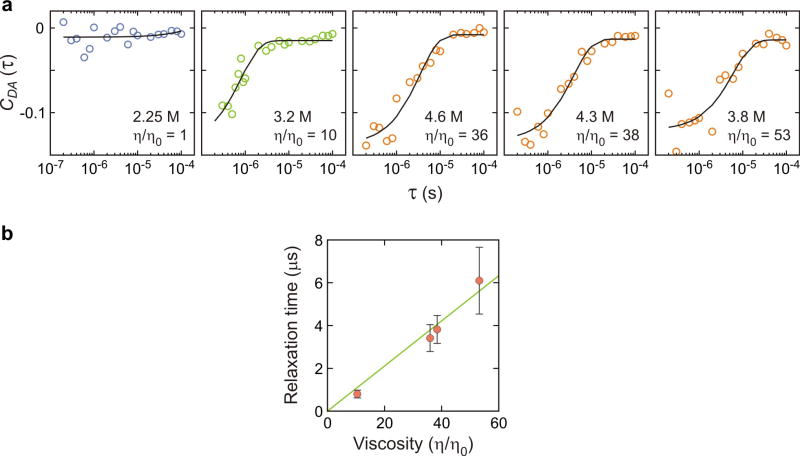
To further test the assumption of a two-state model in our data analysis using the maximum likelihood method (see below), we calculated the donor-acceptor cross-correlation function, as CDA(τ) = -A exp(kτ), as shown in Extended Data Fig. 4 and compared its decay rate with the sum of the rate coefficients determined by the maximum likelihood method (Extended Data Table 1). To obtain the timescale of the unfolded state dynamics at high viscosity, the donor-acceptor cross-correlation function was calculated (Extended Data Fig. 6) for the photon trajectories in the unfolded segments that were extracted using Viterbi algorithm6,34,35.
Extended Data Figure 6.
Donor–acceptor cross-correlation of the segments of the fluorescence trajectories corresponding to the unfolded state24. a, Black solid lines are exponential functions that best fit the data. The fitting parameters are listed in Extended Data Table 2. b, The unfolded state dynamics are slowed approximately linearly by the solvent viscosity as previously observed at high denaturant concentrations24. The relaxation time at η/η0 = 1 (aqueous solution) is too fast to be measured by this method.
Calculation of likelihood functions
To determine parameters for the two-state kinetics, we used the Gopich-Szabo maximum likelihood method and analyzed the photon trajectories without time binning. This method yields the most likely parameters of an assumed model that can reproduce the observed photon trajectories. The likelihood function for the jth photon trajectory is8.
| (S1) |
where Nj is the number of photons in a trajectory, ci is the color of the ith photon (donor or acceptor), and τi is a time interval between the ith and (i-1)th photons (Extended Data Fig. 2a). The photon color matrix F depends on the color of a photon as F(acceptor) = E and F(donor) = I − E, where E is a diagonal matrix with elements that are FRET efficiencies of the individual states. I is the identity matrix, peq is a vector consisting of the equilibrium population of each state, and 1T is a row vector with elements of 1. The calculation of likelihood values was performed using the diagonalization of the matrix exponential in equation (S1) as described in ref.8. Practically, the log likelihood function was calculated and the total log likelihood function of all trajectories was calculated by summing individual log likelihood functions as . For a two-state system, there are four independent parameters - the apparent FRET efficiencies and the rate coefficients of the folded and unfolded states (EF, EU, kF, kU). In analyzing the data, instead of varying the two rate coefficients, it is more convenient to vary the sum of the rate coefficients (k = kF + kU) and the fractional population of folded molecules (pF = kF/[kF + kU]). For the two-state kinetic model (Extended Data Fig. 2b), the rate matrix is given by
Extended Data Figure 2.
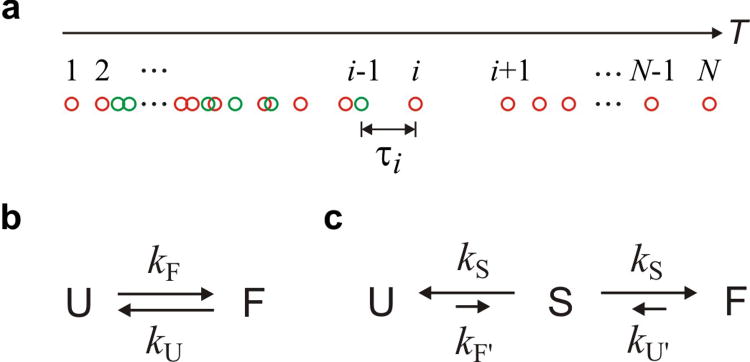
Photon trajectory and kinetics models. a, The definition of photon indices and time interval of a photon trajectory with a folding transition. Photon trajectories were analyzed using (b) the two-state model to determine kinetics parameters or (c) the three-state model to determine the average transition path times (tTP = 1/2kS).
| (S2) |
The 4 parameters (EF, EU, kF, kU) can be obtained by maximizing the log likelihood ln L.
In the measurement of the average transition-path time, tTP, molecules were illuminated at 10 – 15 times higher laser intensity (20 – 30 kW/cm2) than the intensity used for the determination of two-state kinetics parameters above to collect photons at high photon count rates of 550 – 710 ms-1. This high photon count rate permitted clear resolution of transitions by collecting photons in 50-100 μs bins. The photon trajectory in the short segment near the transition (∼ 1 ms) was then analyzed using the likelihood function. We adopted a three state model with a virtual intermediate (“step”) state S in addition to the folded (F) and unfolded (U) states, which is the simplest discrete representation of how the FRET efficiency changes along the transition path. In this model, the FRET efficiency of S is midway between the folded and unfolded states (ES = (EF + EU)/2) and the lifetime of S (τS) corresponds to the average transition-path time, tTP. The rate matrix of this kinetics scheme (Extended Data Fig. 2c) is
| (S3) |
F′ and U′ are used for the folded and unfolded states to distinguish these from those in the two state model with an instantaneous transition. In this analysis tTP = τS = 1/2kS, and tTP is the same for folding and unfolding transitions, which is also the case for the real transition path in Fig. 1(b) regardless of the relative stability of the folded and unfolded states as long as qu and qf are the same for the two paths. The likelihood function of this model for the jth photon trajectory with a single transition is 5
| (S4) |
where vini and vfin are state vectors at the beginning and the end of the trajectory. For the case of a folding transition in Extended Data Fig. 2a, vini = (0 0 1)T and vfin = (1 0 0)T. In the analysis, the folded and unfolded segments were assigned using the Viterbi algorithm34,35, adapted for photon trajectories6, and kF and kU were obtained from the low intensity measurements (Extended Data Table 1). When there are multiple transitions in a trajectory, each pair of segments with a single folding or unfolding transition was analyzed separately. In the calculation of the likelihood function in equation (S4) for these segments, we reduced the rate coefficients by a factor of 1000 to effectively eliminate the possibility of multiple transitions that are not resolvable, i.e. kU′ (= kU/1000) and kF′ (= kF/1000). This treatment is valid since we use the difference of the log likelihood values (Δln L) in this paper.
The reader is referred to previous publications for an in-depth understanding of the Gopich-Szabo maximum likelihood method8 and its experimental application to a two-state protein system6 and for the transition path analysis5.
Determination of the free energy barrier height
The free energy barrier height at 22°C was determined (in Fig. 3d) using the ratio of the folding time to the transition path time tf/tTP, and the ratio of the curvatures at the barrier top and the bottom of the unfolded state (ω*/ωu)2. The value of ω*/ωu was evaluated for the measured tf/tTP, 200 (continuous red curve), including its error, i.e. 233 (upper red dashed curve), and 167 (lower red dashed curve). The most probable value of ω*/ωu obtained from the MD simulations7 is 1.3, the average of 0.94 (using the fraction of native contacts as the reaction coordinate (R. B. Best., G. Hummer, and W.A. Eaton, under review by Proc. Natl. Acd. Sci. USA) and 1.6 (using an optimized reaction coordinate7), corresponding to βΔGf * = 4.2. Assuming an uncertainty of a factor of 2 for ω*/ωu, the possible range of βΔGf * becomes 3.2 to 5.1 for ω*/ωu between 0.65 and 2.6. Using the reported times from the MD simulations of tf = 27 ± 8 μs, and tTP = 0.9 ± 0.2 μs, and ω*/ωu = 1.6 from the one-dimensional free energy surface constructed with an optimized reaction coordinate, the ratio of equations (1) and (2) yields a barrier height of 1.7 ± 0.6 kBT, which is close to the 2.1 kBT (no error reported) barrier height for this surface7. Using the fraction of native contacts as the reaction coordinate for all 3 quantities, the corresponding times are tf= 26.4 ± 8.8 μs, tTP = 0.83 ± 0.17 μs (boundaries for the transition path are the two well minima), and ω*/ωu = 0.94 ± 0.18, the calculated barrier height is 2.5 ± 0.6 kBT, compared to the barrier height of 2.4 ± 0.3 kBT (R.B. Best, unpublished results).
Extended Data Figure 5.
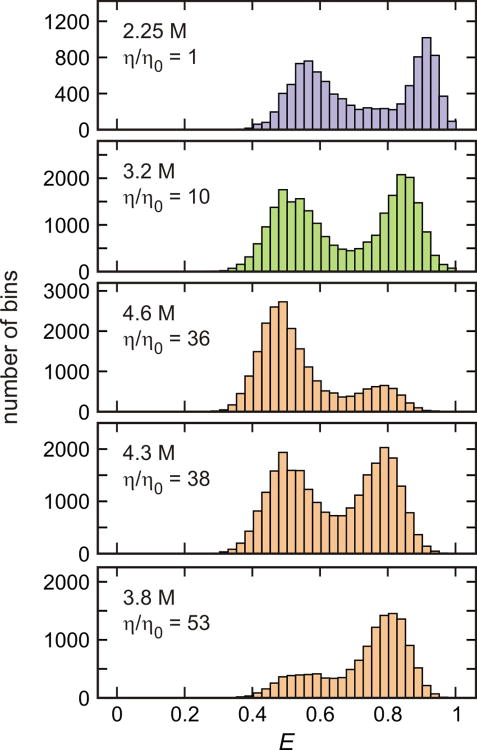
FRET efficiency histograms of α3D at various solvent viscosities. The FRET efficiency histograms were constructed from 1 ms bins in the trajectories with the mean photon count rate > 50 ms-1 for 2.25 M and 3.2 M GdmCl and from 2 ms bins in the trajectories with the mean photon count rate > 30 ms-1 for 4.6 M, 4.3 M, and 3.8 M GdmCl concentrations. At the relative viscosity (η/η0) 1, 10, and 38, the higher concentration of GdmCl was used to counteract the stabilization of proteins by glycerol to maintain the ratio of folded to unfolded molecules as close to unity as practically possible. The similar ratio of the integral of the folded (high FRET) and the unfolded (low FRET) distributions indicates that the equilibrium constant is unchanged at these conditions, as shown more precisely in the maximum likelihood analysis.
Extended Data Table 2.
Viscosity dependence of the kinetic parameters obtained from the two-state maximum likelihood analysis, the transition path time, and the correlation time of the unfolded state dynamics obtained from the donor-acceptor cross-correlation at 22°C.
| Gdmcl (M) | 2.25 | 3.2 | 4.6 | 4.3 | 3.8 |
|
| |||||
| Glycerol (%) | 0 | 50 | 55 | 58 | 61 |
|
| |||||
| Viscosity (η/η0) | 1 | 10 | 36 | 38 | 53 |
|
| |||||
| EF | 0.91 (0.0005) | 0.84 (0.0004) | 0.79 (0.0007) | 0.79 (0.0004) | 0.81 (0.0005) |
| EU | 0.55 (0.0007) | 0.50 (0.0005) | 0.47 (0.0004) | 0.49 (0.0005) | 0.52 (0.0011) |
| k (ms-1) | 0.85 (0.02) | 0.48 (0.01) | 0.46 (0.01) | 0.40 (0.01) | 0.56 (0.01) |
| pF | 0.48 (0.008) | 0.50 (0.006) | 0.23 (0.004) | 0.50 (0.005) | 0.72 (0.005) |
|
| |||||
| Transition path time (μs) | 12.2 (2.0) | 33.3 (2.7) | NA | 39.1 (4.0) | 49.0 (4.9) |
|
| |||||
| Donor-acceptor cross correlation time in the unfolded state, 1/k (μs) | NA | 0.80 (0.18) | 3.4 (0.6) | 3.8 (0.7) | 6.1 (1.6) |
Errors are standard deviations obtained from the diagonal elements of the covariance matrix calculated from the likelihood function.
Acknowledgments
We are particularly indebted to John M. Louis for the preparation, dye labeling, and purification of the protein used in this work, with technical assistance from Annie Aniana. We also thank Robert Best, Gerhard Hummer, and Attila Szabo for helpful discussions and comments on the manuscript, and D.E. Shaw Research for providing access to their MD trajectories for the calculations by Robert Best. This work was supported by the Intramural Research Program of the NIDDK, NIH.
Footnotes
Author Contributions: H.S.C and W.A.E designed the research and wrote the manuscript; H.S.C collected and analyzed the experimental data.
Author Information: Reprints and permissions information is available at www.nature.com/reprints.
The authors declare no competing financial interests.
References
- 1.Kramers HA. Brownian motion in a field of force and the diffusion model of chemical reactions. Physica. 1940;VII:284–304. [Google Scholar]
- 2.Hänggi P, Talkner P, Borkovec M. Reaction rate theory; fifty years after Kramers. Rev Mod Phys. 1990;62:251–341. [Google Scholar]
- 3.Oliveberg M, Wolynes PG. The experimental survey of protein-folding energy landscapes. Quart Rev Biophys. 2005;38:245–288. doi: 10.1017/S0033583506004185. [DOI] [PubMed] [Google Scholar]
- 4.Kubelka J, Henry ER, Cellmer T, Hofrichter J, Eaton WA. Chemical, physical, and theoretical kinetics of an ultrafast folding protein. Proc Natl Acad Sci USA. 2008;105:18655–18662. doi: 10.1073/pnas.0808600105. [DOI] [PMC free article] [PubMed] [Google Scholar]
- 5.Chung HS, McHale K, Louis JM, Eaton WA. Single-molecule fluorescence experiments determine protein folding transition path times. Science. 2012;335:981–984. doi: 10.1126/science.1215768. [DOI] [PMC free article] [PubMed] [Google Scholar]
- 6.Chung HS, Gopich IV, McHale K, Cellmer T, Louis JM, Eaton WA. Extracting rate coefficients from single-molecule photon trajectories and FRET efficiency histograms for a fast-folding protein. J Phys Chem A. 2011;115:3642–3656. doi: 10.1021/jp1009669. [DOI] [PMC free article] [PubMed] [Google Scholar]
- 7.Lindorff-Larsen K, Piana S, Dror RO, Shaw DE. How fast-folding proteins fold. Science. 2011;334:517–520. doi: 10.1126/science.1208351. [DOI] [PubMed] [Google Scholar]
- 8.Gopich IV, Szabo A. Decoding the pattern of photon colors in single-molecule FRET. J Phys Chem B. 2009;113:10965–10973. doi: 10.1021/jp903671p. [DOI] [PMC free article] [PubMed] [Google Scholar]
- 9.Chung HS, Louis JM, Eaton WA. Experimental determination of upper bound for transition path times in protein folding from single-molecule photon-by-photon trajectories. Proc Natl Acad Sci USA. 2009;106:11837–11844. doi: 10.1073/pnas.0901178106. [DOI] [PMC free article] [PubMed] [Google Scholar]
- 10.Chung HS, C T, L JM, Eaton WA. Measuring ultrafast protein folding rates from photon-by-photon analysis of single molecule fluorescence trajectories. Chem Phys. 2013 doi: 10.1016/j.chemphys.2012.08.005. in press. [DOI] [PMC free article] [PubMed] [Google Scholar]
- 11.Hummer G. From transition paths to transition states and rate coefficients. J Chem Phys. 2004;120:516–523. doi: 10.1063/1.1630572. [DOI] [PubMed] [Google Scholar]
- 12.Socci ND, Onuchic JN, Wolynes PG. Diffusive dynamics of the reaction coordinate for protein folding funnels. J Chem Phys. 1996;104:5860–5868. [Google Scholar]
- 13.Klimov DK, Thirumalai D. Viscosity dependence of the folding rates of proteins. Phys Rev Lett. 1997;79:317–320. [Google Scholar]
- 14.Best RB, Hummer G. Reaction coordinates and rates from transition paths. Proc Natl Acad Sci USA. 2005;102:6732–6737. doi: 10.1073/pnas.0408098102. [DOI] [PMC free article] [PubMed] [Google Scholar]
- 15.Cellmer T, Henry ER, Hofrichter J, Eaton WA. Measuring internal friction of an ultrafast-folding protein. Proc Natl Acad Sci USA. 2008;105:18320–18325. doi: 10.1073/pnas.0806154105. [DOI] [PMC free article] [PubMed] [Google Scholar]
- 16.Kubelka J, Hofrichter J, Eaton WA. The protein folding ‘speed limit’. Curr Opin Struct Biol. 2004;14:76–88. doi: 10.1016/j.sbi.2004.01.013. [DOI] [PubMed] [Google Scholar]
- 17.Yang WY, Gruebele M. Folding at the speed limit. Nature. 2003;423:193–197. doi: 10.1038/nature01609. [DOI] [PubMed] [Google Scholar]
- 18.Hummer G, Szabo A. Free energy surfaces from single-molecule force spectroscopy. Acc Chem Res. 2005;38:504–513. doi: 10.1021/ar040148d. [DOI] [PubMed] [Google Scholar]
- 19.Godoy-Ruiz R, Henry ER, Kubelka J, Hofrichter J, Munoz V, Sanchez-Ruiz JM, Eaton WA. Estimating free-energy barrier heights for an ultrafast folding protein from calorimetric and kinetic data. J Phys Chem B. 2008;112:5938–5949. doi: 10.1021/jp0757715. [DOI] [PubMed] [Google Scholar]
- 20.Portman JJ, Takada S, Wolynes PG. Microscopic theory of protein folding rates. II. Local reaction coordinates and chain dynamics. J Chem Phys. 2001;114:5082–5096. [Google Scholar]
- 21.Makarov DE. Interplay of non-Markov and internal friction effects in the barrier crossing kinetics of biopolymers: Insights from an analytically solvable model. J Chem Phys. 2013;138:014102. doi: 10.1063/1.4773283. [DOI] [PubMed] [Google Scholar]
- 22.Schulz JCF, Schmidt L, Best RB, Dzubiella J, Netz RR. Peptide chain dynamics in light and heavy water: zooming in on internal friction. J Amer Chem Soc. 2012;134:6273–6279. doi: 10.1021/ja211494h. [DOI] [PubMed] [Google Scholar]
- 23.Ansari A, Jones CM, Henry ER, Hofrichter J, Eaton WA. The role of solvent viscosity in the dynamics of protein conformational changes. Science. 1992;256:1796–1798. doi: 10.1126/science.1615323. [DOI] [PubMed] [Google Scholar]
- 24.Soranno A, Buchli B, Nettels D, Cheng RR, Muller-Spath S, Pfeil SH, Hoffmann A, Lipman EA, Makarov DE, Schuler B. Quantifying internal friction in unfolded and intrinsically disordered proteins with single-molecule spectroscopy. Proc Natl Acad Sci. 2012;109:17800–17806. doi: 10.1073/pnas.1117368109. [DOI] [PMC free article] [PubMed] [Google Scholar]
- 25.Bryngelson JD, Wolynes PG. Intermediates and barrier crossing in a random energy-model (with applications to protein folding) J Phys Chem. 1989;93:6902–6915. [Google Scholar]
- 26.Zagrovic B, Pande V. Solvent viscosity dependence of the folding rate of a small protein: Distributed computing study. J Comp Chem. 2003;24:1432–1436. doi: 10.1002/jcc.10297. [DOI] [PubMed] [Google Scholar]
- 27.Sutto L, Latzer J, Hegler JA, Ferreiro DU, Wolynes PG. Consequences of localized frustration for the folding mechanism of the IM7 protein. Proc Natl Acad Sci USA. 2007;104:19825–19830. doi: 10.1073/pnas.0709922104. [DOI] [PMC free article] [PubMed] [Google Scholar]
- 28.Jas GS, Eaton WA, Hofrichter J. Effect of viscosity on the kinetics of alpha-helix and beta-hairpin formation. J Phys Chem B. 2001;105:261–272. [Google Scholar]
- 29.Wensley BG, Batey S, Bone FAC, Chan ZM, Tumelty NR, Steward A, Kwa LG, Borgia A, Clarke J. Experimental evidence for a frustrated energy landscape in a three-helix-bundle protein family. Nature. 2010;463:685–688. doi: 10.1038/nature08743. [DOI] [PMC free article] [PubMed] [Google Scholar]
- 30.Hagen SJ. Solvent viscosity and friction in protein folding dynamics. Curr Prot Pept Sci. 2010;11:385–395. doi: 10.2174/138920310791330596. [DOI] [PubMed] [Google Scholar]
- 31.Merchant KA, Best RB, Louis JM, Gopich IV, Eaton WA. Characterizing the unfolded states of proteins using single-molecule FRET spectroscopy and molecular simulations. Proc Natl Acad Sci USA. 2007;104:1528–1533. doi: 10.1073/pnas.0607097104. [DOI] [PMC free article] [PubMed] [Google Scholar]
- 32.Vogelsang J, Kasper R, Steinhauer C, Person B, Heilemann M, Sauer M, Tinnefeld P. A reducing and oxidizing system minimizes photobleaching and blinking of fluorescent dyes. Angew Chem. 2008;47:5465–5469. doi: 10.1002/anie.200801518. [DOI] [PubMed] [Google Scholar]
- 33.Benninger RKP, Koc Y, Hofmann O, Requejo-Isidro J, Neil MAA, French PMW, deMello AJ. Quantitative 3D mapping of fluidic temperatures within microchannel networks using fluorescence lifetime imaging. Anal Chem. 2006;78:2272–2278. doi: 10.1021/ac051990f. [DOI] [PubMed] [Google Scholar]
- 34.Viterbi AJ. Error bounds for convolution codes and an asymptotically optimum decoding algorithm. IEEE Trans Information Theory. 1967;13:260–269. [Google Scholar]
- 35.Rabiner LR. A tutorial on hidden Markov models and selected applications in speech. Proc IEEE. 1989;77:257–286. [Google Scholar]
- 36.Zhu Y, Alonso DOV, Maki K, Huang CY, Lahr SJ, Daggett V, Roder H, DeGrado WF, Gai F. Ultrafast folding of α3D: A de novo designed three-helix bundle protein. Proc Natl Acad Sci USA. 2003;100:15486–15491. doi: 10.1073/pnas.2136623100. [DOI] [PMC free article] [PubMed] [Google Scholar]
- 37.Liu F, Dumont C, Zhu YJ, DeGrado WF, Gai F, Gruebele M. A one-dimensional free energy surface does not account for two-probe folding kinetics of protein alpha D-3. J Chem Phys. 2009;130:061101. doi: 10.1063/1.3077008. [DOI] [PMC free article] [PubMed] [Google Scholar]


