

Abstract
Aim:
To investigate the role of reactive oxygen species (ROS) in oridonin-induced apoptosis and autophagy in HeLa cells.
Methods:
The cell viability was measured using MTT assay. Morphological changes of apoptosis and autophagy were examined using Hoechst 33258 staining and monodansylcadaverine (MDC) staining, respectively. The mitochondrial membrane potential (ΔΨm) was measured using fluorescent dye rhodamine 123. DCF-induced fluorescence was used to measure the intracellular ROS level. Protein expression was examined using Western blot.
Results:
Treatment of HeLa cells with oridonin (20–160 μmol/L) inhibited the cell growth in time- and concentration-dependent manners. The cells treated with oridonin (80 μmol/L) for 24 h displayed marked DNA fragmentation and MDC-positive autophagosomes. In the presence of the specific autophagy inhibitor 3-MA (2 mmol/L), the oridonin-induced apoptosis was significantly enhanced. Treatment of HeLa cells with oridonin (20–120 μmol/L) induced intracellular ROS generation in a concentration-dependent manner. In the presence of the ROS scavenger NAC (5 mmol/L), the oridinin-induced ROS generation was markedly reduced. NAC (5 mmol/L) or non-thiol antioxidant catalase (1000 U/mL) significantly reduced the oridonin-induced inhibition of cell growth and apoptosis. Furthermore, oridonin significantly reduced ΔΨm, which was blocked by NAC. Oridonin markedly increased Bax expression in mitochondria, and decreased Bcl-2 expression in both the cytosol and mitochondria. Oridonin also markedly increased the phosphorylation of Bcl-2 in the cytosol. All the effects were blocked by NAC. Oridonin increased the levels of caspase-3 and caspase-8, and decreased the expression of pro-caspase 3 and pro-caspase 9, which were blocked by NAC.
Conclusion:
ROS plays a critical role in oridonin-induced apoptosis and autophagy.
Keywords: oridonin, reactive oxygen species, apoptosis, autophagy, Bax, Bcl-2, caspase 3, caspase 8, HeLa cell
Introduction
Programmed cell death (PCD), an essential mechanism for development, tissue turnover and host defense in multicellular organisms, exists in two major forms: apoptotic and autophagic cell death1. Apoptosis, or type I PCD, is a genetically controlled cell suicide process that plays an important role in maintaining cell homeostasis of higher organisms2. Defective apoptosis results in a variety of diseases, such as autoimmunity, neurodegenerative disorders and many types of cancer3. Autophagy is also a crucial cellular homeostatic mechanism whereby eukaryotic cells degrade unnecessary proteins and prepare cytoplasmic organelles for their removal or turnover4. Although excessive autophagy can mediate cell death (type II PCD) under certain conditions, autophagy is largely considered to be a survival mechanism that is triggered by starvation or hormonal stimulation5, 6. The relationship between apoptosis and autophagy is complex and varies with both the cell type and the category of the stimulus7, 8. Mounting evidence suggests that there is a mechanistic overlap between apoptosis and autophagy9, 10. Thus, researchers have become increasingly interested in understanding the co-regulated factors of these two processes.
ROS are ions or small molecules that include singlet oxygen molecules, free radicals and peroxides, which are formed as byproducts of the normal cellular metabolism of oxygen11. Organisms have developed antioxidant systems that include antioxidant enzymes such as superoxide dismutase (SOD) and antioxidant molecules such as glutathione (GSH) to balance these species12. However, oxidative stress, a condition characterized by the dramatic increase in ROS levels and the disruption of the antioxidant balance, results in oxidative damage to cellular structures, signal transduction changes and cell death13. In addition, many studies have reported that ROS induce apoptosis in various cancer cells14, 15, 16. The mitochondrial membrane potential and the expression of Bcl-2 family proteins, which have been closely linked to mitochondrial-mediated apoptosis, were also reported to be affected by ROS17. Recent reports have also demonstrated that ROS participate in the regulation of autophagy in certain circumstances18, 19. Therefore, we are interested in the role of ROS in both apoptosis and autophagy.
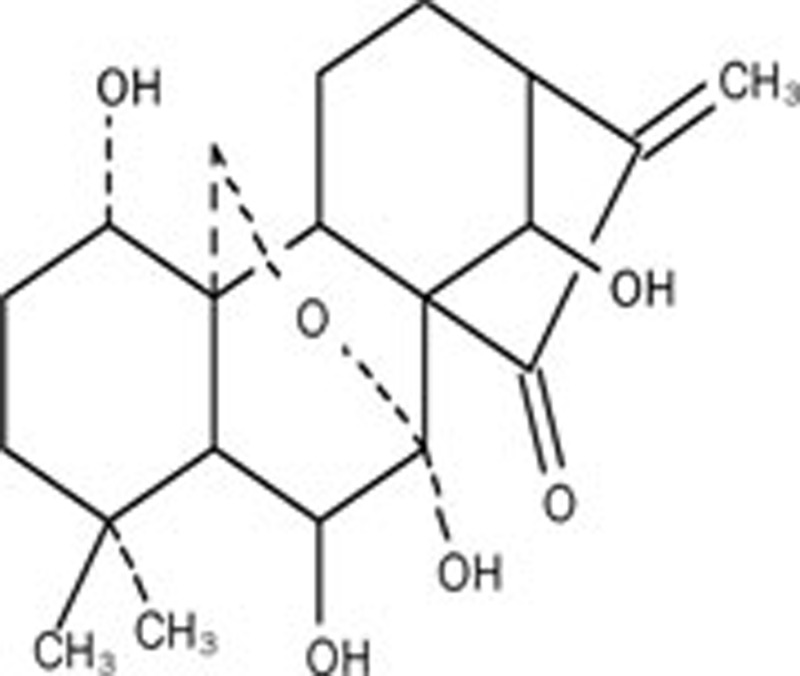
Oridonin, an active diterpenoid isolated from Rabdosia rubescens, was found to present various pharmacological and physiological outcomes, including anti-bacterial, anti-inflammation and anti-tumor effects20, 21. Our previous studies showed that both apoptosis and autophagy were induced by oridonin in HeLa cells, and autophagy antagonized apoptosis by activating the PKC signaling pathway22. We also found that oridonin could induce ROS to mediate apoptosis in murine fibrosarcoma L929 cells and human hepatoma HepG2 cells23, 24. Hence, in this study, we investigated the possible regulatory mechanisms of ROS in oridonin-induced apoptosis and autophagy in HeLa cells.
Materials and methods
Materials
Oridonin was obtained from the Kunming Institute of Botany, The Chinese Academy of Sciences (Kunming, China). The purity of oridonin was confirmed by HPLC and determined to be 99.4%. Oridonin was dissolved in dimethyl sulfoxide (DMSO) to make a stock solution. The DMSO concentration was kept below 0.1% in cell culture and did not induce any detectable effect on cell growth or cell death.
Fetal bovine serum (FBS) was obtained from TBD Biotechnology Development (Tianjin, China). 3-(4,5-Dimethylthiazol-2-yl)-2,5-diphenyltetrazolium bromide (MTT), Hoechst 33258, Annexin V-FITC, propidium iodide (PI), monodansylcadaverine (MDC), 3-methyladenine (3-MA), N-acetyl-cysteine (NAC), 2′,7′-dichlorofluorescein diacetate (DCF-DA), catalase (CAT) and rhodamine-123 were purchased from Sigma Chemical (St Louis, MO, USA). Polyclonal antibodies to Bax, Bcl-2, phosphor-Bcl-2, caspase-3, caspase-8, caspase-9, LC3, Beclin 1, β-actin, and horseradish peroxidase-conjugated secondary antibodies were obtained from Santa Cruz Biotechnology (Santa Cruz, CA, USA).
Cell culture
The human cervical carcinoma HeLa cell line was obtained from American Type Culture Collection (ATCC, Manassas, VA, USA). The cells were cultured in RPMI-1640 medium (GIBCO, Gaithersburg, MD, USA) supplemented with 10% fetal bovine serum (FBS), 0.03% L-glutamine (GIBIO, Grand Island, NY, USA), 100 U/mL penicillin and 100 μg/mL streptomycin and maintained at 37 oC with 5% CO2 in a humidified atmosphere.
Cell growth inhibition assay
The inhibition of cell growth was measured by MTT assay as described previously25. The cells were dispensed in 96-well flat bottom microtiter plates (NUNC, Roskilde, Denmark) at a density of 1.5×10⁴ cells per well. After 24 h of incubation, they were treated with various concentrations of oridonin or 5 mmol/L NAC 1 h prior to 80 μmol/L oridonin for the indicated time periods. Next, MTT (5 mg/L) was added to each well for 3 h, and the resulting crystals were dissolved in DMSO. Optical density was measured by MTT assay using a plate microreader (TECAN SPECTRA, Wetzlar, Germany). The percentage of cell growth inhibition was calculated as follows:
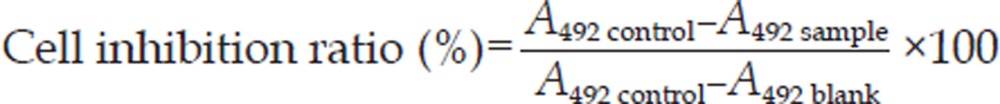 |
Observation of nuclear damage by Hoechst 33258 staining
HeLa cells (5×10⁵/well) were cultured in 6-well culture plates. After 24 h of incubation, the cells were treated with or without 80 μmol/L oridonin for 24 h. The cells were then incubated with 5 mmol/L Hoechst 33258 at 37 °C for 30 min, and the nuclear changes of fluorescence were observed by OLYMPUS IX70 reverse fluorescence microscopy (Olympus, Tokyo, Japan) at excitation wavelength 350 nm with emission filter 460 nm26.
Analysis of autophagy and apoptosis by flow cytometry
HeLa cells were dispensed in 25 mL culture bottles at a density of 1×10⁶ per bottle. After 24 h of incubation, they were treated with or without 3-MA and NAC at the given concentrations 1 h prior to the administration of oridonin for 24 h. The cells were harvested by trypsin and rinsed with PBS. To measure autophagy, monodansylcadaverine (MDC) was used as a marker for autophagic vacuoles27; collected cells were suspended with 0.05 mmol/L MDC at 37 °C for 60 min. Staining with Annexin V/PI was used to measure apoptosis. The cells were fixed with 100 μL binding buffer and treated with 2 μL Annexin V-FITC solution (20 mg/L) at 4 °C for 20 min; they were then added 1 mL PI solution (50 mg/L) for 5 min. For measuring apoptosis with PI staining, the collected cells were fixed with 500 μL PBS and 10 mL 70% ethanol at 4 °C for 18 h, and then after being washed twice with PBS, the cells were suspended with 1 mL PI solution (PI 50 mg/L and RNase A 1 g/L)26. Next, the samples were analyzed using a FACScan flow cytometer (Becton Dickinson, Franklin Lakes, NJ, USA).
Flow cytometric analysis of intracellular ROS production
HeLa cells were dispensed in 25 mL culture bottles at a density of 1×10⁶ per bottle. After 24 h of incubation, they were treated with various concentrations of oridonin or 3-MA and NAC at the given concentrations 1 h prior to 80 μmol/L oridonin for the indicated time periods. The cells were incubated with 10 μmol/L DCF-DA at 37 °C for 15 min to assess ROS-mediated oxidation of DCF-DA to the fluorescent compound DCF. Next, the cells were harvested and the pellets were suspended in 1 mL PBS. Samples were analyzed at an excitation wavelength of 480 nm and an emission wavelength of 525 nm using a FACScan flow cytometer (Becton Dickinson, Franklin Lakes, NJ, USA)28.
Observation of morphologic changes
HeLa cells (5×10⁵/well) were seeded into 6-well culture plates. After 24 h of incubation, the cells were treated with or without 5 mmol/L NAC 1 h prior to the administration of 80 μmol/L oridonin for 24 h of incubation. The cellular morphology was observed by a phase-contrast microscope (Leica, Nussloch, Germany).
Flow cytometric analysis of ΔΨm
HeLa cells were dispensed into 25 mL culture bottles at a density of 1×10⁶ per bottle. After 24 h of incubation, the cells were treated with or without 5 mmol/L NAC 1 h prior to the administration of 80 μmol/L oridonin for a 24-h incubation. The cells were harvested by trypsin and rinsed with PBS. For measuring ΔΨm, a cationic fluorescent dye rhodamine 123 was used as previously described29. The collected cells were stained with 1 μg/mL rhodamine 123 and incubated at 37 °C for 15 min. The samples were analyzed using a FACScan flow cytometer (Becton Dickinson, Franklin Lakes, NJ, USA).
Isolation of cytosolic and mitochondrial fractions
The cell groups were harvested by trypsin, and the cell pellets were resuspended in ice-cold homogenizing buffer, (250 mmol/L sucrose, 20 mmol/L HEPES, 10 mmol/L KCl, 1 mmol/L EDTA, 1 mmol/L EGTA, 1.5 mmol/L MgCl2, 1 mmol/L DTT, 1 mmol/L PMSF, 1 μg/mL aprotinin, and 1 μg/mL leupeptin). After homogenization (40 strokes), the homogenates were centrifuged at 42 00×g at 4 °C for 30 min. The supernatant was used as the cytosolic fraction, and the pellet was resolved in lysis buffer as the mitochondrial fraction17.
Western blot analysis
HeLa cells (2×10⁶) were preincubated with or without specific inhibitors before treatment with 80 μmol/L oridonin. After 24 h, both adherent and floating cells were collected and frozen at -80 oC. Western blot analysis was carried out as follows. The cell pellets were resuspended in lysis buffer containing 50 mmol/L Hepes (pH 7.4), 1% Triton-X 100, 2 mmol/L sodium orthovanadate, 100 mmol/L sodium fluoride (NaF), 1 mmol/L edetic acid, 1 mmol/L egtazic acid (EGTA), 1 mmol/L phenylmethyl-sulfonylfluoride (PMSF), 0.1 g/L aprotinin, and 0.01 g/L leupeptin and lysed at 4 oC for 1 h. Then the cells were spun in a centrifuge at 12 000×g for 10 min, and the protein content of the supernatant was determined by Bio-Rad protein assay reagent (Bio-Rad, Hercules, CA, USA). The proteins were separated by 12% SDS polyacrylamide gel electrophoresis and blotted onto nitrocellulose membrane. The membranes were soaked in 5% skimmed milk and incubated with primary polyclonal antibodies overnight. The proteins were visualized by an anti-rabbit IgG conjugated with peroxidase and diamino-benzidine (DAB)30. Protein levels were quantified by densitometry (Fluochim v2.0 Alpha; Alpha Innotech, San Leandro, CA, USA). The relative density was calculated as follows:
 |
Observation of autophagy by monodansylcadaverine (MDC) staining
HeLa cells (5×10⁵/well) were cultured in 6-well culture plates. After 24 h of incubation, the cells were treated with or without 5 mmol/L NAC 1 h prior to the administration of 80 μmol/L oridonin for 24 h. Next, the cells were incubated with 0.05 mmol/L MDC at 37 °C for 1 h, and the change in fluorescence was observed by OLYMPUS IX70 reverse fluorescence microscopy (Olympus, Tokyo, Japan) at an excitation wave length 380 nm with an emission filter of 525 nm.
Statistical analysis
All results and data were confirmed in at least three separate experiments. Data are expressed as mean±SD. Statistical comparisons were made by one-way ANOVA. P<0.05 was considered significant.
Results
Oridonin induced apoptosis and autophagy in HeLa cells
Oridonin inhibited HeLa cell growth in a time- and concentration-dependent manner. Concentrations of oridonin ranging from 10 to 160 μmol/L all exerted cytotoxic effects on HeLa cell growth and treatment with 80 μmol/L oridonin for 24 h resulted in almost 50% inhibition (Figure 1A). To determine whether apoptosis was induced by oridonin, the morphological changes were observed by Hoechst 33258 staining. Oridonin treated cells showed marked fragmented DNA in their nuclei, whereas the nuclei were round and homogeneously stained in the control group (Figure 1B). We also examined the effect of oridonin on autophagy by detecting MDC (a fluorescent dye of autophagosome) labeled cells. Analysis of flow cytometry data showed that the percentage of MDC-positive cells after oridonin treatment was 23.38% at 24 h and was considerably higher than that in the control group (Figure 1C). To further investigate the relationship of apoptosis and autophagy in oridonin-treated HeLa cells, 3-MA (a specific autophagy inhibitor) was introduced. Treatment with 3-MA prior to the addition of oridonin led to a markedly increased cell growth inhibition ratio and apoptotic ratio compared with the group treated with oridonin alone (Figure 1D and 1E). These results indicated that oridonin induced both apoptosis and autophagy in HeLa cells and that the inhibition of autophagy contributed to the up-regulation of apoptosis.
Figure 1.

Oridonin induced apoptosis and autophagy in HeLa cells. (A) The cells were treated with various doses of oridonin for 12, 24, or 36 h. The cell growth inhibition ratio was measured by MTT assay. n=3. Mean±SD. bP<0.05, cP<0.01 vs control group. (B) The cells were treated with 80 μmol/L oridonin for 24 h and the changes in cellular morphology were observed by fluorescence microscopy with Hoechst 33258 staining (×400 magnification, Bar=10 μm). (C) The ratio of MDC-positive cells was measured by flow cytometric analysis after the cells were incubated with 80 μmol/L oridonin for 24 h. The FACScan histograms are shown. (D–E) The cells were treated with 80 μmol/L oridonin for 24 h in the presence or absence of 2 mmol/L 3-MA, the cell growth inhibition ratio (D) was measured by MTT assay, and the apoptotic cells were measured by flow cytometry analysis that detected Annexin V/PI staining. The apoptotic ratio (E) represents the addition of the proportion of Annexin V positive cells and the proportion of PI-positive cells. n=3. Mean±SD. eP<0.05, fP<0.01 vs oridonin group. Con: control, Ori: oridonin.
Oridonin dose-dependently induced intracellular ROS generation in HeLa cells
To investigate whether ROS were triggered by oridonin in HeLa cells, DCF-DA, a specific ROS-detecting fluorescent dye, was used to examine the intracellular ROS level. The exposure of HeLa cells to various doses of oridonin for 24 h led to a sharp increase in DCF fluorescence compared with the control group (Figure 2). Furthermore, the ratio of DCF-positive cells was increased from 3.73% in untreated cells to 3.81%, 7.50%, 23.07%, or 41.93% in cells treated with oridonin doses of 20, 40, 80, and 120 μmol/L, respectively. When pretreated with the ROS scavenger NAC, the corresponding ratio of DCF-positive cells was markedly reduced, from 23.07% to 7.96%, compared with the group treated with 80 μmol/L oridonin alone (Figure 2). These data suggested that ROS in HeLa cells were induced by oridonin in a dose-dependent manner.
Figure 2.

ROS production was induced by oridonin and could be inhibited by NAC in HeLa cells. The cells were treated with various doses of oridonin or coincubated with 5 mmol/L NAC and 80 μmol/L oridonin for 24 h. The DCF-positive cells were measured by flow cytometry. The corresponding linear diagram of the FACScan histograms is expressed at the base. n=3. Mean±SD. cP<0.01 vs 80 μmol/L oridonin group.
ROS mediated oridonin-induced apoptosis in HeLa cells
To evaluate the role of ROS in oridonin-induced apoptosis, we pretreated HeLa cells with NAC before oridonin administration. Oridonin treatment induced canonical apoptotic changes including membrane blebbing and granular apoptotic bodies. In contrast, these apoptotic morphologic alterations were almost completely suppressed by pretreatment with NAC (Figure 3A). The MTT assay also demonstrated that NAC treatment significantly reduced the cell growth inhibition ratio from 33.1% for oridonin alone to 5.8% in the presence of NAC (Figure 3B). Flow cytometry analysis revealed that NAC reduced the apoptotic ratio compared with oridonin treatment alone (Figure 3C). Like NAC, treatment with an additional non-thiol antioxidant catalase (CAT), which catalyzes the conversion of hydrogen peroxide to water and oxygen, also reduced the oridonin-induced cell growth inhibition and apoptosis (Figure 3B and 3C). Together, these results demonstrated that ROS played an important role in oridonin-induced apoptosis in HeLa cells.
Figure 3.

Effect of ROS on oridonin-induced apoptosis in HeLa cells. The cells were treated with 80 μmol/L oridonin for 24 h in the presence or absence of 5 mmol/L NAC or 1000 U/mL CAT. (A) The cellular morphologic changes were observed by phase contrast microscopy (×200 magnification, Bar=20 μm). The cell growth inhibitory ratio was measured by MTT assay (B), and the apoptotic ratio was measured by flow cytometric analysis stained with PI (C). n=3. Mean±SD. cP<0.01 vs oridonin group.
Inhibition of ROS rescued the loss of ΔΨm in oridonin-treated HeLa cells
Because there is a relationship between ROS generation and the disruption of the mitochondrial membrane potential, we examined whether ROS are involved in the regulation of ΔΨm in HeLa cells. The loss of the ΔΨm was reflected by a decrease in the intensity of rhodamine 123 fluorescent staining, which was used to detect the integrity of mitochondrial membrane. Oridonin treatment alone reduced the ratio of rhodamine-positive cells from 95.72% in the control group to 77.87%. However, this decrease was reversed by NAC pretreatment which increased that ratio to 94.93% when co-incubated with oridonin (Figure 4). These findings revealed that ROS contributed to the oridonin-induced dissipation in ΔΨm in HeLa cells.
Figure 4.

Significant reduction in mitochondrial transmembrane potential (ΔΨm) was induced by oridonin and could be rescued by NAC in HeLa cells. The cells were treated with 80 μmol/L oridonin for 24 h in the presence or absence of 5 mmol/L NAC and then were loaded with the membrane-sensitive probe rhodamine 123. The rhodamine retention was measured by flow cytometry. The corresponding linear diagram of the FACScan histograms is expressed at the base. n=3. Mean±SD. bP<0.05 vs oridonin group.
ROS was involved in oridonin-induced Bax translocation and Bcl-2 degradation in HeLa cells
Because the results above indicated that ROS influenced the mitochondrial membrane potential, the expression of Bax and Bcl-2, which are Bcl-2 family members modulating mitochondrial-mediated apoptotic pathway, were examined using Western blot analysis. As shown in Figure 5, the expression level of Bax in the cytosol was only slightly upregulated in response to oridonin treatment, but oridonin caused a sharp increase in Bax expression in the mitochondria. This suggests that oridonin induced the translocation of Bax from the cytosol to the mitochondria in these conditions. The results also showed that oridonin attenuated the expression of Bcl-2 in both the cytosol and the mitochondria but induced the phosphorylation of Bcl-2. In the presence of NAC, oridonin-induced Bax translocation and Bcl-2 degradation were both reversed, and the expression of all proteins returned to untreated levels (Figure 5). Therefore, ROS participated in the regulation of mitochondrial-mediated apoptosis in oridonin-treated HeLa cells.
Figure 5.

Effects of NAC on oridonin-induced Bax translocation and Bcl-2 degradation. The cells were treated with 80 μmol/L oridonin for 24 h in the presence or absence of 5 mmol/L NAC. The expression levels of Bax, p-Bcl-2, Bcl-2 both in the cytosol and the mitochondria, and the total protein expressions of Bax and Bcl-2 in the cells were detected by Western blot analysis. The corresponding histograms quantified by densitometry were expressed at bottom. n=3. Mean±SD. bP<0.05, cP<0.01 vs control group; eP<0.05, fP<0.01 vs oridonin group. These experiments were performed at least three times, and β-actin was used as a loading control.
ROS participated in oridonin-activated caspase-3, caspase-8, and caspase-9 process in HeLa cells
It is well known that the caspase protein family plays a critical role in the apoptotic process. To further elucidate the importance of ROS in apoptosis, we examined the expression of caspase-3, caspase-8, and caspase-9 by Western blot analysis. As shown in Figure 6, the cleavage of procaspase-3 and procaspase-8, as well as the decrease in procaspase-9, was observed in oridonin-treated cells. The activation of this process was inhibited by NAC administration. These results further confirmed the critical role of ROS in apoptosis in this system.
Figure 6.

Effects of NAC on oridonin-induced activations of caspase-3, caspase-8, and caspase-9. The cells were treated with 80 μmol/L oridonin for 24 h in the presence or absence of 5 mmol/L NAC, and the expression levels of procaspase-3, caspase-3, procaspase-8, caspase-8, procaspase-9 were detected by Western blot analysis. The corresponding histograms were quantified by densitometry and were expressed at the bottom. n=3. Mean±SD. bP<0.05, cP<0.01 vs control group; eP<0.05, fP<0.01 vs oridonin group. Each experiment was performed at least three times, and β-actin was used as a loading control.
ROS regulated oridonin-induced autophagy in HeLa cells
Because oridonin may induce autophagy and apoptosis, we examined the effect of ROS on oridonin-induced autophagy. Oridonin treatment led to a marked increase in the number of MDC-labeled fluorescent particles in the cells, which further confirmed that oridonin could induce autophagy in HeLa cells. However, when NAC was applied, the number of MDC-labeled fluorescent particles was completely suppressed (Figure 7A). Quantitative analysis by flow cytometry also showed that the percentage of MDC-positive cells by oridonin treatment was reduced by NAC or CAT treatment from 23.38% to 5.18% and 9.31%, respectively (Figure 7B). We further examined the effect of NAC on oridonin-induced autophagy through detection of the autophagic markers Beclin 1 and MAP-LC3. As expected, oridonin treatment alone enhanced both the expression level of Beclin 1 and the conversion of LC3-I to LC3-II, but these enhancements were reversed by NAC pretreatment. NAC alone had no effect on the expressions of these two marker proteins (Figure 7C). Next, the influence of autophagy inhibitor 3-MA on oridonin-induced ROS generation was evaluated. The percentage of DCF-positive cells declined from 26.22% in the oridonin-treated cells to 14.05% in 3-MA and oridonin-treated cells (Figure 7D). Together, these results indicated that ROS was also involved in regulating oridonin-induced autophagy in HeLa cells.
Figure 7.

Effect of ROS on oridonin-induced autophagy in HeLa cells. (A–C) The cells were treated with 80 μmol/L oridonin for 24 h in the presence or absence of 5 mmol/L NAC or 1000 U/mL CAT. (A) The changes in cellular morphology were observed by fluorescence microscopy with MDC staining (×400 magnification, Bar=10 μm). (B) The autophagic ratio was measured by flow cytometric analysis. n=3. Mean±SD. fP<0.01 vs oridonin group. (C) The protein levels of Beclin 1 and MAP-LC3 were detected by Western blot analysis, and the corresponding histograms quantified by densitometry were expressed at the bottom. n=3. Mean±SD. bP<0.05, cP<0.01 vs control group; eP<0.05, fP<0.01 vs oridonin group. Each experiment was performed at least three times, and β-actin was used as a loading control. (D) The cells were treated with 80 μmol/L oridonin for 24 h in the presence or absence of 2 mmol/L 3-MA and the DCF-positive cells was measured by flow cytometric analysis. n=3. Mean±SD. eP<0.05 vs oridonin group.
Oridonin induced persistent ROS generation in HeLa cells
The data above revealed that ROS generation was the crucial event to mediate oridonin-induced apoptosis and autophagy. To further confirm this finding, we measured intracellular ROS levels for various time periods by using DCF-DA. Significant levels of ROS were generated within 1 h after oridonin treatment, and the level of ROS continued to increase for 24 h (Figure 8). The ratio of DCF-positive cells increased from 4.36% in untreated cells to 22.57%, 27.19%, 27.69%, 36.62%, and 36.34% in 1, 3, 6, 12, and 24 h-treated cells, respectively (Figure 8). This demonstrated that ROS generation was the first event stimulated by oridonin and acted as the main factor mediating oridonin-induced apoptosis and autophagy.
Figure 8.

Persistent ROS generation was induced by oridonin in HeLa cells. The cells were treated with 80 μmol/L oridonin for 1, 3, 6, 12, and 24 h, and the DCF-positive cells were measured by flow cytometric analysis. The corresponding linear diagram of the FACScan histograms was expressed at the bottom. n=3. Mean±SD. cP<0.01 vs control group.
Discussion
Apoptosis and autophagy have previously been correlated both positively and negatively depending on the “molecular switches” connecting them7, 8. In previous studies, we demonstrated that autophagy and apoptosis were both induced in oridonin-treated HeLa cells and that autophagy was a protective mechanism against apoptosis in this circumstance22. Here, we further confirmed these results through flow cytometric analysis and observation of changes in morphology. It is well established that autophagy may promote survival in many contexts, including nutrient deprivation, endoplasmic reticulum stress, and microbial infection7. Under these conditions, autophagy played a cytoprotective role in response to oridonin-induced cellular stress; apoptosis was up-regulated by the inhibition of autophagy. These results were consistent with the data of Kaushik and colleagues19. In addition, it has been postulated that oxidative stress can result in autophagy, apoptosis, or necrosis, depending on its severity31. Our work investigated the possible role of ROS in regulating oridonin-induced apoptosis and autophagy in HeLa cells.
ROS are essential intermediates in many intracellular signal pathways that lead to cell death13. ROS generation has been reported to be associated with a variety of stimuli such as tumor necrosis factor (TNF), endoplasmic reticulum stress (ER stress), starvation, and certain compounds32. The results in this study revealed that ROS generation was induced by oridonin in a dose-dependent manner in HeLa cells. Also we found that ROS production could be significantly scavenged by NAC. These data suggest a possible role for ROS in oridonin-induced cellular events.
There is evidence that apoptosis can be induced by ROS. It has been shown that ROS generation, which regulated p53 activation, mediated oridonin-induced apoptosis in HepG2 cells24. Conjugation with polyethylene glycol (PEG) could effectively reduce the polyamidoamine-induced cell apoptosis by limiting the production of ROS33. Consistent with these studies, our results demonstrated that the inhibition of ROS generation by NAC led to significant decrease in oridonin-induced cytotoxicity and apoptosis. As a potent inducer of apoptosis, the pathways of ROS in regulating apoptosis were investigated. Mitochondria are particularly vulnerable to oxidative stress and are major sources of intracellular ROS34. Many reports have documented that ROS participate in the apoptotic process by disrupting the ability to induce the mitochondrial membrane potential (MMP)17, 33. In addition, other studies have shown that several Bcl-2 family proteins, especially the pro-apoptotic protein Bax and the anti-apoptotic protein Bcl-2, are recognized as major players in mitochondrial-mediated apoptosis by regulating MMP23, 35. The ratio of Bax/Bcl-2 is critical for the induction of apoptosis35. In this study, we demonstrated that the suppression of ROS reversed oridonin-induced loss of ΔΨm, Bax translocation and Bcl-2 degradation; this indicates that an increased Bax/Bcl-2 ratio may be important for inducing the MMP in the ROS-mediated and oridonin-induced apoptosis. Moreover, ROS were also found to regulate caspase-dependent apoptosis, as demonstrated by the ability of ROS to induce caspase-8, caspase-9, and eventually caspase-3 activation. This conclusion was supported by the observation that caspase-dependent spontaneous apoptosis was inhibited by NAC in vitro in cultured human primary B lymphocytes36. Together, these results suggest that ROS played a role in inducing apoptosis in oridonin-treated HeLa cells.
Autophagy is a well-conserved lysosomal degradation pathway that has become an attractive area of study in recent years4. ROS have been reported to be involved in autophagy by regulating the activity of the redox sensitive cysteine protease HsAtg4A, which belongs to the Atg4 family37. Here, we found that the oridonin-induced autophagosome accumulation, the increased expression of Beclin 1 and the conversion of LC3-I to LC3-II were all inhibited by NAC, suggesting that ROS contributed to autophagy in this system. Subsequent results revealing reduced levels of ROS by the autophagy inhibitor 3-MA further confirmed this.
These findings revealed that ROS mediated the oridonin-induced apoptosis and autophagy, whereas autophagy antagonized apoptosis in this circumstance. We hypothesized that the generation of ROS was first induced by oridonin and that this was the fundamental signal molecule in oridonin-induced cellular events. In agreement with our hypothesis, our results indicate that ROS production was triggered rapidly and robustly 1 h after administration of oridonin and increased persistently.
Therefore, we hypothesized a possible mechanism for the oridonin-induced production of ROS in the cells. It is well established that mitochondria are particularly vulnerable to oxidative stress and are major sources of intracellular ROS34. In our study, the expression of ΔΨm and some critical mitochondrial proteins were altered; thus, we presumed that oridonin induced the generation of ROS in mitochondria. We proposed that oridonin may induce a state of cellular oxidative stress by altering the redox state of glutathione or the activity of superoxide dismutase. These changes could lead to a mitochondrial permeability change either directly or indirectly, which in turn could cause the generation of ROS. Further studies will be required to confirm this.
In summary, we have demonstrated that ROS signal for the initiation of mitochondrial- and caspase-dependent apoptosis as well as autophagy in oridonin-treated HeLa cells. Our results provide new insight into the role of ROS in signaling apoptosis and autophagy. Future investigations characterizing additional signaling pathways mediated by ROS in both apoptosis and autophagy are still needed.
Author contribution
Ya-hong ZHANG performed the experiments, analyzed data and wrote the manuscript. Takashi IKEJIMA and Ying-liang WU designed the study and revised the manuscript. Shin-ichi TASHIRO and Satoshi ONODERA provided the reagents.
Acknowledgments
This work was supported by China Postdoctoral Science Foundation Funded Project (No 20100470995) and Intramural Research Fund of He-nan University (No 2009YBZR029).
References
- Lockshin RA, Zakeri Z. Apoptosis, autophagy, and more. Int J Biochem Cell Biol. 2004;36:2405–19. doi: 10.1016/j.biocel.2004.04.011. [DOI] [PubMed] [Google Scholar]
- Gerl R, Vaux DL. Apoptosis in the development and treatment of cancer. Carcinogenesis. 2005;26:263–70. doi: 10.1093/carcin/bgh283. [DOI] [PubMed] [Google Scholar]
- Hengartner MO. The biochemistry of apoptosis. Nature. 2000;407:770–6. doi: 10.1038/35037710. [DOI] [PubMed] [Google Scholar]
- Levine B. Autophagy and cancer. Nature. 2007;446:745–7. doi: 10.1038/446745a. [DOI] [PubMed] [Google Scholar]
- Kanzawa T, Kondo Y, Ito H, Kondo S, Germano I. Induction of autophagic cell death in malignant glioma cells by arsenic trioxide. Cancer Res. 2003;63:2103–8. [PubMed] [Google Scholar]
- Kuma A, Hatano M, Matsui M, Yamamoto A, Nakaya H, Yoshimori T. The role of autophagy during the early neonatal starvation period. Nature. 2004;432:1032–6. doi: 10.1038/nature03029. [DOI] [PubMed] [Google Scholar]
- Mizushima N, Levine B, Cuervo AM, Klionsky DJ. Autophagy fights disease through cellular self-digestion. Nature. 2008;451:1069–75. doi: 10.1038/nature06639. [DOI] [PMC free article] [PubMed] [Google Scholar]
- Cui Q, Tashiro SI, Onodera S, Minami M, Ikejima T. Autophagy preceded apoptosis in oridonin-treated human breast cancer MCF-7 cells. Biol Pharm Bull. 2007;30:859–64. doi: 10.1248/bpb.30.859. [DOI] [PubMed] [Google Scholar]
- Pattingre S, Tassa A, Qu XP, Garuti R, Liang XH, Mizushima N. Bcl-2 antiapoptotic proteins inhibit Beclin 1-dependent autophagy. Cell. 2005;122:927–39. doi: 10.1016/j.cell.2005.07.002. [DOI] [PubMed] [Google Scholar]
- Wang ZH, Xu L, Duan ZL, Zeng LQ, Yan NH, Peng ZL. Beclin 1-mediated macroautophagy involves regulation of caspase-9 expression in cervical cancer HeLa cells. Gynecol Oncol. 2007;107:107–13. doi: 10.1016/j.ygyno.2007.05.034. [DOI] [PubMed] [Google Scholar]
- Crack PJ, Taylor JM. Reactive oxygen species and the modulation of stroke. Free Radic Biol Med. 2005;38:1433–44. doi: 10.1016/j.freeradbiomed.2005.01.019. [DOI] [PubMed] [Google Scholar]
- Klamt F, Dal-Pizzol F, Conte da Frota MLJR, Walz R, Andrades ME, da Silva EG, et al. Imbalance of antioxidant defense in mice lacking cellular prion protein. Free Radic Biol Med. 2001;30:1137–44. doi: 10.1016/s0891-5849(01)00512-3. [DOI] [PubMed] [Google Scholar]
- Ermak G, Davies KJ. Calcium and oxidative stress: from cell signaling to cell death. Mol Immunol. 2002;38:713–21. doi: 10.1016/s0161-5890(01)00108-0. [DOI] [PubMed] [Google Scholar]
- Simbula G, Columbano A, Ledda-Columbano GM, Sanna L, Deidda M, Diana A, et al. Increased ROS generation and p53 activation in alpha-lipoic acid-induced apoptosis of hepatoma cells. Apoptosis. 2007;12:113–23. doi: 10.1007/s10495-006-0487-9. [DOI] [PubMed] [Google Scholar]
- Reinecke F, Levanets O, Olivier Y, Louw R, Semete B, Grobler A, et al. Metallothionein isoform 2A expression is inducible and protects against ROS-mediated cell death in rotenone-treated HeLa cells. Biochem J. 2006;395:405–15. doi: 10.1042/BJ20051253. [DOI] [PMC free article] [PubMed] [Google Scholar]
- Kang YH, Lee E, Choi MK, Ku JL, Kim SH, Park YG, et al. Role of reactive oxygen species in the induction of apoptosis by alpha-tocopheryl succinate. Int J Cancer. 2004;112:385–92. doi: 10.1002/ijc.20424. [DOI] [PubMed] [Google Scholar]
- Yang J, Wu JN, Tashiro S, Onodera S, Ikejima T. Critical roles of reactive oxygen species in mitochondrial permeability transition in mediating evodiamine-induced human melanoma A375-S2 cell apoptosis. Free Radic Res. 2007;41:1099–108. doi: 10.1080/10715760701499356. [DOI] [PubMed] [Google Scholar]
- Kiffin R, Bandyopadhyay U, Cuervo AM. Oxidative stress and autophagy. Antioxid Redox Signal. 2006;8:152–62. doi: 10.1089/ars.2006.8.152. [DOI] [PubMed] [Google Scholar]
- Kaushik S, Cuervo AM. Autophagy as a cell-repair mechanism: activation of chaperone-mediated autophagy during oxidative stress. Mol Aspects Med. 2006;27:444–54. doi: 10.1016/j.mam.2006.08.007. [DOI] [PMC free article] [PubMed] [Google Scholar]
- Osawa K, Yasuda H, Maruyama T, Morita H, Takeya K. Antibacteria trichorabdal diterpenes from Rabdosia trichocarpa. Phytochemistry. 1994;36:1287–91. doi: 10.1016/s0031-9422(00)89653-3. [DOI] [PubMed] [Google Scholar]
- Han QB, Li ML, Li SH, Mou YK, Lin ZW, Sun HD. Ent-kaurane diterpenoids from Isodon rubescens var lushanensis. Chem Pharm Bull. 2003;51:790–3. doi: 10.1248/cpb.51.790. [DOI] [PubMed] [Google Scholar]
- Zhang YH, Wu YL, Tashiro S, Onodera S, Ikejima T. Involvment of PKC signal pathway in oridonin-induced autophagy in HeLa cells: a protective mechanism against apoptosis. Biochem Biophys Res Commun. 2009;378:273–8. doi: 10.1016/j.bbrc.2008.11.038. [DOI] [PubMed] [Google Scholar]
- Wu JN, Huang J, Yang J, Tashiro S, Onodera S, Ikejima T. Caspase inhibition augmented oridonin-induced cell death in murine fibrosarcoma L929 by enhancing reactive oxygen species generation. J Pharmacol Sci. 2008;108:32–9. doi: 10.1254/jphs.fp0072079. [DOI] [PubMed] [Google Scholar]
- Huang J, Wu JN, Tashiro S, Onodera S, Ikejima T. Reactive oxygen species mediate oridonin-induced HepG2 apoptosis through p53, MAPK, and mitochondrial signaling pathways. J Pharmacol Sci. 2008;107:370–9. doi: 10.1254/jphs.08044fp. [DOI] [PubMed] [Google Scholar]
- Jarrett SG, Albon J, Boulton M. The contribution of DNA repair and antioxidants in determining cell type-specific resistance to oxidative stress. Free Radic Res. 2006;40:1155–65. doi: 10.1080/10715760600876613. [DOI] [PubMed] [Google Scholar]
- Li LH, Wu LJ, Zhou B, Wu Z, Tashiro S, Onodera S, et al. Silymarin prevents UV irradiation-induced A375-S2 cell apoptosis. Biol Pharm Bull. 2004;27:1031–6. doi: 10.1248/bpb.27.1031. [DOI] [PubMed] [Google Scholar]
- Biederbick A, Kern HF, Elsasser HP. Monodansylcadaverine (MDC) is a specific in vivo marker for autophagic vacuoles. Eur J Cell Biol. 1995;66:3–14. [PubMed] [Google Scholar]
- Yang ML, Huang TS, Lee Y, Lu FJ. Free radical scavenging properties of sulfinpyrazone. Free Radic Res. 2002;36:685–93. doi: 10.1080/1071576029009137. [DOI] [PubMed] [Google Scholar]
- Venkataraman S, Wagner BA, Jiang X, Wang HP, Schafer FQ, Ritchie JM, et al. Overexpression of manganese superoxide dismutase promotes the survival of prostate cancer cells exposed to hyperthermia. Free Radic Res. 2004;38:1119–32. doi: 10.1080/10715760400010470. [DOI] [PubMed] [Google Scholar]
- Zhang YH, Wu YL, Cheng Y, Zhao ZK, Tashiro S, Onodera S, et al. Fas-mediated autophagy requires JNK activation in HeLa cells. Biochem Biophys Res Commun. 2008;377:1205–10. doi: 10.1016/j.bbrc.2008.10.151. [DOI] [PubMed] [Google Scholar]
- Lemasters JJ, Nieminen AL, Qian T, Trost LC, Elmore SP, Nishimura Y, et al. The mitochondrial permeability transition in cell death: a common mechanism in necrosis, apoptosis and autophagy. Biochim Biophys Acta. 1998;1366:177–96. doi: 10.1016/s0005-2728(98)00112-1. [DOI] [PubMed] [Google Scholar]
- Liu ZH, Lenardo MJ. Reactive oxygen species regulate autophagy through redox-sensitive proteases. Dev Cell. 2007;12:484–5. doi: 10.1016/j.devcel.2007.03.016. [DOI] [PubMed] [Google Scholar]
- Wang W, Xiong W, Wan J, Sun X, Xu H, Yang X. The decrease of PAMAM dendrimer-induced cytotoxicity by PEGylation via attenuation of oxidative stress. Nanotechnology. 2009;20:105103. doi: 10.1088/0957-4484/20/10/105103. [DOI] [PubMed] [Google Scholar]
- Gao J, Zhu ZR, Ding HQ, Qian Z, Zhu L, Ke Y. Vulnerability of neurons with mitochondrial dysfunction to oxidative stress is associated with down-regulation of thioredoxin. Neurochem Int. 2007;50:379–85. doi: 10.1016/j.neuint.2006.09.007. [DOI] [PubMed] [Google Scholar]
- Tsujimoto Y. Role of Bcl-2 family proteins in apoptosis: apoptosomes and mitochondrial. Genes Cell. 1998;3:697–707. doi: 10.1046/j.1365-2443.1998.00223.x. [DOI] [PubMed] [Google Scholar]
- Rosati E, Sabatini R, Ayroldi E, Tabilio A, Bartoli A, Bruscoli S, et al. Apoptosis of human primary B lymphocytes is inhibited by N-acetyl-L-cysteine. J Leukoc Biol. 2004;76:152–61. doi: 10.1189/jlb.0403148. [DOI] [PubMed] [Google Scholar]
- Scherz-Shouval R, Shvets E, Fass E, Shorer H, Gil L, Elazar Z. Reactive oxygen species are essential for autophagy and specifically regulate the activity of Atg4. EMBO J. 2007;26:1749–60. doi: 10.1038/sj.emboj.7601623. [DOI] [PMC free article] [PubMed] [Google Scholar]