Abstract
Quantitative PET imaging relies on accurate attenuation correction. Recently, there has been growing interest in combining state-of-the-art PET systems with MR imaging in a sequential or fully integrated setup. As CT becomes unavailable for these systems, an alternative approach to the CT-based reconstruction of attenuation coefficients (μ values) at 511 keV must be found. Deriving μ values directly from MR images is difficult because MR signals are related to the proton density and relaxation properties of tissue. Therefore, most research groups focus on segmentation or atlas registration techniques. Although studies have shown that these methods provide viable solutions in particular applications, some major drawbacks limit their use in whole-body PET/MR. Previously, we used an annulus-shaped PET transmission source inside the field of view of a PET scanner to measure attenuation coefficients at 511 keV. In this work, we describe the use of this method in studies of patients with the sequential time-of-flight (TOF) PET/MR scanner installed at the Icahn School of Medicine at Mount Sinai, New York, NY.
Methods
Five human PET/MR and CT datasets were acquired. The transmission-based attenuation correction method was compared with conventional CT-based attenuation correction and the 3-segment, MR-based attenuation correction available on the TOF PET/MR imaging scanner.
Results
The transmission-based method overcame most problems related to the MR-based technique, such as truncation artifacts of the arms, segmentation artifacts in the lungs, and imaging of cortical bone. Additionally, the TOF capabilities of the PET detectors allowed the simultaneous acquisition of transmission and emission data. Compared with the MR-based approach, the transmission-based method provided average improvements in PET quantification of 6.4%, 2.4%, and 18.7% in volumes of interest inside the lung, soft tissue, and bone tissue, respectively.
Conclusion
In conclusion, a transmission-based technique with an annulus-shaped transmission source will be more accurate than a conventional MR-based technique for measuring attenuation coefficients at 511 keV in future whole-body PET/MR studies.
Keywords: MR/PET, attenuation correction, transmission, TOF
Hybrid imaging is a powerful tool for improving diagnostic accuracy through a combination of functional information and anatomic information. For the last decade, PET in combination with CT has been the method of choice for hybrid imaging in clinical practice. Recently, there has been growing interest in combining PET and MR imaging. There are several advantages of MR imaging over CT. MR imaging exhibits excellent soft-tissue contrast, which is advantageous for imaging of the brain, parenchymal abdominal organs, and the musculoskeletal system. MR imaging can provide complementary functional information through the use of techniques such as MR spectroscopy, diffusion-weighted imaging, or functional MR imaging. Finally, MR imaging does not impose additional radiation exposure on patients; this property is especially desirable for pediatric patients.
Recent developments in detector technology have allowed PET and MR imaging to be combined into integrated systems (1). Currently, 2 whole-body systems are commercially available: a sequential PET/MR system (Ingenuity TF scanner; Philips) (2) and a simultaneous PET/MR system (Biograph mMR; Siemens Healthcare) (3). For PET image quality in PET/MR to be comparable to that in PET/CT, one of the difficulties that needs to be addressed is the correction of PET images for photon attenuation (4,5). When γ photons travel through matter, they may be scattered or absorbed by an atom. PET images that are not corrected for attenuation do not accurately represent the distribution of the radioactive tracer inside the body.
Correcting for attenuation requires knowledge about the attenuation coefficients of different tissues in the body. These attenuation coefficients are stored in a 3-dimensional image called the attenuation map. The probability of photon attenuation depends on the electron density of the tissues, and the attenuation map therefore can be easily derived from images acquired with an imaging modality based on the measurement of photon transmission, such as CT. In current PET/CT systems, attenuation correction is typically done by bilinear scaling of CT Hounsfield units (6). Contrary to CT signal intensity, MR signal intensity is correlated with the proton density and relaxation properties of tissue. As a consequence, the attenuation map cannot be derived directly from MR images.
Several approaches have been proposed to overcome this issue (5,7). One method uses a common transmission-based template, which is adapted to the individual anatomy by MR imaging (8). Other approaches use segmentation techniques to classify the pixels of the MR image into different tissue types (9–12). For each tissue, a known attenuation coefficient is used. However, in conventional MR imaging sequences, air, bone, and lung tissues do not produce any signals, and their densities are completely different. With special MR sequences, tissue classification can be improved to distinguish cortical bone and lung tissue from air as well as adipose tissue from soft tissue (13–16). A third approach makes use of atlas registration and pattern recognition to derive a pseudo-CT image, which is then converted to an attenuation map at the appropriate energy level (10,17).
Although these methods provide viable solutions for most clinical applications, some limitations remain for whole-body PET/MR. Segmentation techniques based on standard MR sequences may fail to detect cortical bone. Because of a low signal in the lungs, segmentation artifacts are also likely to occur there. Furthermore, methods that use predefined attenuation coefficients ignore the inter- and intrapatient variability of attenuation coefficients, which may be significant (18). Atlas registration or template-based methods may fail in the presence of anatomic abnormalities. Another limitation of MR-based attenuation correction methods is truncation due to the smaller field of view (FOV) of MR scanners (19). Finally, the patient bed and radiofrequency coils are not visible on MR images. Although template-based approaches can deal with the patient bed and fixed coils, special considerations must be taken into account when flexible coils are used because their positions are not known before scanning (20,21).
It is clear that MR-based attenuation correction is difficult. However, other methods can be used to obtain an attenuation map. In stand-alone PET, a transmission source was used to acquire an attenuation map (22). The first PET systems used an orbiting pin source or a ring source of a long-lived positron emitter, which was mechanically moved into the FOV (23–25). In that method, photons were collected in the coincidence mode. Later, continuously rotating rod sources were used, and positron emitters were replaced by single-photon–emitting sources such as 137Cs, with an energy of 662 keV (26–28). The use of higher-energy sources improved tissue penetration, and single-photon methods allowed higher collection rates and therefore shorter scan times. Depending on the configuration of the source and type, the transmission data could be acquired before (preinjection), during (simultaneous), or after (postinjection) the emission scan. Simultaneous acquisition of emission and transmission data is desirable because it reduces acquisition time and improves spatial registration between the attenuation map and the PET image. Apart from transmission-based methods, several authors have also proposed deriving the attenuation map from emission projections by simultaneous reconstruction of the activity distribution and the attenuation map (29,30).
Recently, we proposed a transmission-based method that uses an annulus-shaped source covering the whole FOV of the scanner (31). The source contains a positron-emitting isotope. Emission and transmission data are acquired simultaneously, and a time-of-flight (TOF)–based classification method is used to separate transmission data from emission data. This method allows the measurement of photon attenuation at 511 keV and overcomes the aforementioned problems related to MR-based techniques. So far, we have demonstrated the feasibility of this approach with Monte Carlo simulation studies. In this work, we describe the first studies of patients with our method. The study protocol included simultaneous transmission and emission scans, an emission-only scan, MR imaging, and CT scans. The effects of the various attenuation maps on the reconstructed PET images were also evaluated.
MATERIALS AND METHODS
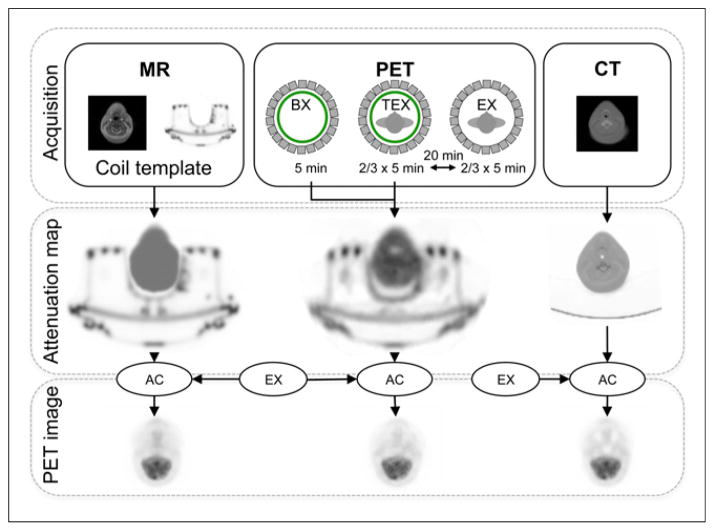
Here we describe the PET/MR and CT acquisition protocols; the derivation of the transmission-based, MR imaging–based, and CT-based attenuation maps; and the reconstruction of the PET images. An overview of the complete work flow per patient is shown in Figure 1.
FIGURE 1.
Acquisition and image-processing work flow. (Top) PET/MR and CT acquisitions. (Middle) Derivation of CT-based, MR-based, and transmission-based attenuation maps. (Bottom) Reconstruction of PET images with CT-based, MR-based, and transmission-based attenuation maps for attenuation correction (AC). BX = blank reference scan; EX = emission scan; TEX = simultaneous transmission–emission scan.
PET/MR and CT Data Acquisition
Five patients with risk factors for the development of atherosclerotic plaques in the aorta (as determined by chest/whole-body scans) and carotid arteries (as determined by head/neck scans) were investigated with the Philips Ingenuity TF sequential PET/MR scanner installed at the Icahn School of Medicine at Mount Sinai, New York, NY. The system combines state-of-the-art TOF PET technology (500- to 600-ps TOF resolution) with the high soft-tissue contrast of a clinical 3.0-T MR imaging system. Each patient was examined with the same PET/MR and CT protocols. All acquisition protocols were approved by the Icahn School of Medicine at Mount Sinai Institutional Review Board, and all subjects signed written informed consent forms.
First, the MR imaging data were acquired. A conventional T1-weighted image with a FOV of 57 cm was obtained for the purpose of attenuation correction (20). The MR image was reconstructed to a 320 × 320 × 90 voxel matrix, with 1.88 × 1.88 × 6.00 mm voxel dimensions. The PET protocol included 3 types of scans: a blank reference scan, a simultaneous transmission–emission scan, and an emission scan. An annulus-shaped source was placed inside the FOV of the PET scanner, and a 5-min blank scan was acquired. Next, the patient was asked to get onto the table, which was moved inside the PET scanner. A simultaneous transmission/emission scan of 5 min per bed position was obtained. Finally, the transmission source was removed, and the PET scan was repeated, but with only emission data being measured. Each patient received an 18F-FDG injection of 370 to 550 MBq 80–90 min before scanning. An overview of the acquired bed positions and injected activities for all patients is shown in Table 1. Additionally, for each patient, a whole-body CT scan was acquired on a Philips Brilliance iCT scanner with the following parameters: 140 kVp, 79 mAs, 0.9-mm slice thickness, in-plane resolution of 0.45 mm, and reconstructed FOV of 40 cm.
TABLE 1.
| Patient | Weight (kg) | Activity (MBq) | Bed positions |
|---|---|---|---|
| 1 | 92 | 363 | 3 (neck, torso) |
| 2 | 129.3 | 407 | 3 (neck, torso) |
| 3 | 73.5 | 498 | 3 (neck, torso) |
| 4 | 65 | 364 | 2 (torso) |
| 5 | 84 | 555 | 2 (neck, upper torso) |
At 80 min before PET/MR acquisition.
During PET/MR acquisition.
PET/MR and CT Coregistration
The coregistrations of the CT images with the PET/MR images were performed automatically by rigid registration in a Philips DICOM viewer. For this purpose, normalized mutual information was used. Manual fine adjustments were performed by visual inspection with the patient’s spine as an anatomic landmark (because it is least susceptible to breathing artifacts). Visual inspection was performed to check for gross misalignments in the lungs, heart, rib cage, and head/neck anatomic structures. We found the spatial error to be less than 4 mm, which is acceptable considering the resolution of the PET scanner.
Construction of Transmission Source
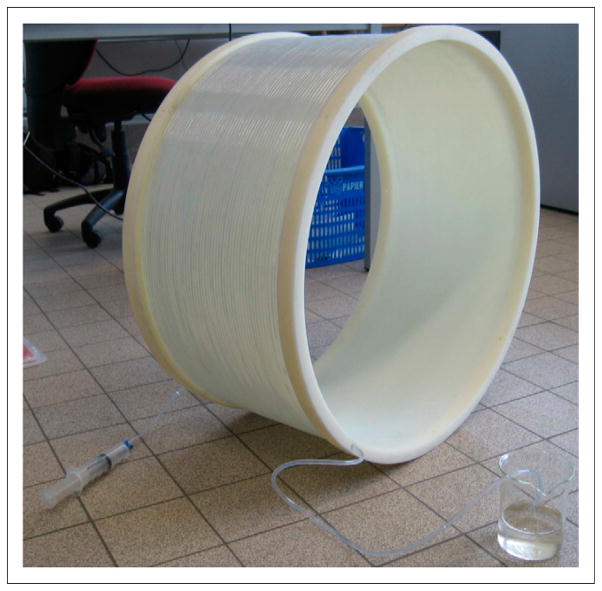
The annulus-shaped transmission source used to acquire the transmission scans described earlier was constructed with a polymethyl methacrylate hollow cylinder and an air tube. The cylinder acted as a support and had an inner diameter of 66 cm and a thickness of 1 cm. The tube was 103.7 m long and was wrapped around the surface of the cylinder (Fig. 2). The tube had an inner diameter of 4 mm and an outer diameter of 6 mm. The total volume of the source was 1.3 L. To fill the tube, we placed one end in a beaker containing an 18F-FDG solution while creating negative pressure at the other end using a syringe. The filling process took 5 min. The transmission source had an activity ranging from 51.8 to 53.7 MBq at the time of acquisition.
FIGURE 2.
Annulus-shaped transmission source.
Derivation of Attenuation Maps
The attenuation maps were derived with 3 modalities. All attenuation maps were resampled to a 176 × 176 × 40 voxel matrix with a 4-mm isotropic voxel dimension; this matrix was the same as that used for the reconstruction of the PET images.
CT-Based Attenuation Map
CT images are related to electron density and therefore can be easily converted into an attenuation map at 511 keV. In this work, CT-based attenuation coefficients (μ values) were obtained from CT Hounsfield units by use of a bilinear scaling function as reported previously (6). The CT-based attenuation map was used as a reference for comparison with the MR- and transmission-based attenuation maps.
MR-Based Attenuation Map
The MR-based attenuation map was obtained by use of the software available on the scanner (11,21,32). The process consists of MR acquisition, segmentation, μ-value assignment, and inclusion of the patient bed and fixed radiofrequency coils with templates. The segmentation algorithm attempts to distinguish air and 2 types of tissue: lung tissue and soft tissue. Special care was taken in segmenting the lungs: a deformable-shape model was derived from manual segmentation of 20 high-resolution CT datasets (32).
Transmission-Based Attenuation Map
Given a blank reference scan and a simultaneous transmission–emission scan, the attenuation map can be reconstructed. The transmission data are extracted from the simultaneous transmission–emission scan dataset by use of the TOF information. For each event, the source location (xs, ys, zs) of the positron emission is estimated from the TOF difference of the 2 photons in coincidence:
| Eq. 1 |
In Equation 1, c is the speed of light, (x1, y1, z1) and (x2, y2, z2) are the coordinates of the detection points of the event, and di is the distance between the detection points. If the source position (xs, ys, zs) falls outside a cylinder with a radius of 28.5 cm, then the event is classified as transmission. In this work, a 25-cm radius (representing the size of a patient) was assumed. After extraction, the estimated transmission list mode data (TX) are used to reconstruct the attenuation map with an iterative gradient descent algorithm (31):
| Eq. 2 |
In Equation 2, e is the list mode event index; ie is the line of response (LOR) or crystal pair index of list mode event e; SF(e) is the scatter correction factor, derived from the energies of the photons (see additional information provided later in the article); RF(ie) is the random correction factor for LOR ie, derived from the delayed sinogram; cej is the probability that an event e generated in voxel j is detected along LOR ie; and α is a relaxation parameter. The correction factor β ensures count rate consistency between the blank and transmission scans. It is calculated from the count rate of LORs through areas in which attenuation is negligible. represents the current estimate of the attenuation factor on LOR i and can be calculated as follows:
| Eq. 3 |
with lij the intersection length of LOR i with voxel j and the current estimate of the attenuation coefficient of voxel j. The scatter correction function suppresses events in which the energies of the detected photons (ε1,ε2) are low compared with a given energy threshold εt. Therefore, an arctangent function is used:
| Eq. 4 |
The parameter γ in Equation 4 allows the regulation of the shape of the scaling function. It is not the same as the γ defined in Equation 1. In our work, we assume that the energy distributions of the true blank and true transmission events are identical. Because SF(e) depends only on energy, it can be easily shown that the relationship ai between the true blank and true transmission events on a particular LOR i still holds when the events are weighted with the factor SF(e).
The reconstruction algorithm works as follows. First, the transmission data are backprojected into image space (= Tj). Second, the blank data are backprojected with a current estimate of the attenuation . Finally, a voxel-by-voxel error ratio of both backprojections is calculated and used to update the attenuation coefficients.
Because of the limited TOF resolution of the PET scanner (600 ps), the measured source position (xs, ys, zs) might fall outside the cylinder radius of 28.5 cm; hence, not all transmission data will be separated from emission data. In addition, emission events originating at locations close to the radius (28.5 cm) could be misclassified. We previously evaluated these classification errors using the transmission rejection rate (TRR) and the emission contamination rate (ECR) (31). In our work, the exact amounts of true transmission events and true emission events are unknown. However, the TRR and ECR can still be estimated by applying the TOF separation method to the blank reference scan (BX), emission scan (EX), and simultaneous transmission–emission scan (TX) data:
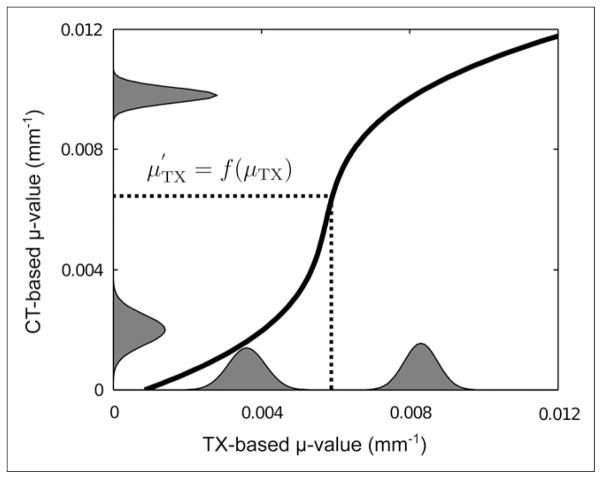
Although PET image–degrading effects such as scatter and randoms are reduced by use of such corrections, the method does not yield exact absolute values for the attenuation coefficients at 511 keV. Therefore, the attenuation coefficients in the transmission-based map were rescaled by use of a histogram matching technique. For this purpose, mean CT-and transmission-based μ values and the intrapatient variability for the lungs and soft tissue were derived from the histograms of the attenuation maps for all 5 patients by use of a peak detection algorithm. Given the peak values for both types of tissues in each patient, the SD was derived by locally fitting a gaussian distribution to the histograms. Subsequently, the peak values and SDs were averaged over all patients. A histogram model was defined for each modality as the sum of 2 gaussian distributions. Because the numbers of lung and soft-tissue voxels were unknown, the mixture weights of the 2 gaussian distributions were set to 0.5. Finally, the cumulative distribution functions CDFTX and CDFCT were calculated from the 2 mixture models. The transmission-based μ values were rescaled as follows (Fig. 3):
| Eq. 5 |
FIGURE 3.
Scaling function (curved black line). Histogram model of CT- and transmission (TX)-based attenuation coefficients is also shown.
Truncated Transmission- and MR-Based Attenuation Maps
The discrepancy between the FOVs of the PET/MR and CT scanners may affect the reconstructed PET images (19,33). So that quantitative comparisons with the CT-based attenuation map could be made, truncated attenuation maps were derived from the transmission- and MR-based maps. All voxels outside the FOV of the CT scanner in both transmission- and MR-based attenuation maps were set to 0. Additionally, we decided to remove the patient bed from these attenuation maps because the CT data were acquired on a different bed. For the remainder of this work, we refer to the truncated maps as the truncated transmission (TXtr) and truncated MR (MRtr)-based maps. An overview of the reconstructed attenuation maps is shown in Table 2.
TABLE 2.
Reconstructed Transmission-, MR-, and CT-Based Attenuation Maps
| Attenuation map | FOV | Patient bed |
|---|---|---|
| CT | CT | No |
| Transmission | PET | Yes |
| TXtr | CT | No |
| MR | MR | Yes |
| MRtr | CT | No |
Reconstruction of PET Images
For each patient, the PET data from the emission scan were reconstructed with 5 different attenuation maps (Table 2). For this purpose, 50 iterations of a standard iterative maximum-likelihood algorithm were applied. Attenuation correction was performed in the forward projection. Random coincidences were estimated by use of the delayed window method with standard settings of the scanner. Scatter correction was not implemented. The PET images were reconstructed by use of a 176 × 176 × 40 voxel matrix with a 4-mm isotropic voxel dimension.
Evaluation of Images
To evaluate the effects of the various attenuation maps on the reconstructed PET images, we used a similarity measure to compare the PET images. The normalized root-mean-square deviation (NRMSD) was chosen for this purpose because this metric requires the 2 images to have intensity values in the same range:
| Eq. 6 |
with
| Eq. 7 |
The similarity was then given by the following equation:
| Eq. 8 |
For a quantitative impression, PET images obtained by MRtr, TXtr, and CT-based attenuation correction were compared by measuring the mean percentage difference in the reconstructed PET 18F-FDG uptake in 3 relevant tissue types (lungs, bone, and soft tissue). For this purpose, 20 volumes of interest of 8 cm3 were defined in each region. Special care was taken in selecting the volumes of interest to avoid coregistration errors caused by misalignment of the PET/MR and CT data.
RESULTS
Derivation of Attenuation Maps
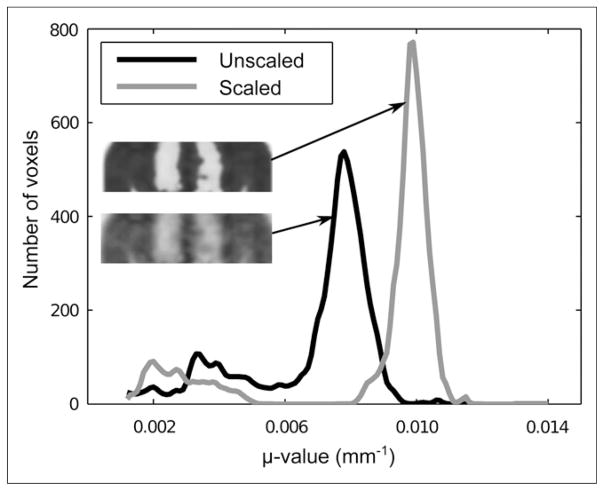
An overview of the TRR and ECR measures for all patients is shown in Table 3. The mean μ values and the mean intrapatient variations for the lungs and soft tissue in the gaussian mixture models are shown in Table 4. The effect of the scaling method is shown in Figure 4, which displays the histograms of the unscaled and scaled transmission-based attenuation maps for 1 patient.
TABLE 3.
TRR and ECR for 5 Patients
| Patient | TRR (%) | ECR (%) |
|---|---|---|
| 1 | 8.70 | 0.23 |
| 2 | 9.20 | 0.58 |
| 3 | 9.26 | 0.31 |
| 4 | 9.25 | 0.44 |
| 5 | 9.25 | 0.46 |
Rates were averaged over all bed positions.
TABLE 4.
Reconstructed μ Values in Lungs and Soft Tissue for Attenuation Maps for All Patients
| Modality | μ Value (mm−1)
|
|||
|---|---|---|---|---|
| Lungs
|
Soft tissue
|
|||
| Mean | SD | Mean | SD | |
| CT | 0.0018 | 0.00052 | 0.0098 | 0.00023 |
|
| ||||
| Transmission, unscaled | 0.0036 | 0.00051 | 0.0083 | 0.00043 |
|
| ||||
| Transmission, scaled | 0.0019 | 0.00044 | 0.0098 | 0.00024 |
|
| ||||
| MR | 0.0022 | 0.0096 | ||
Predefined μ values assigned in MR-based method are also shown.
FIGURE 4.
Unscaled and scaled transmission-based attenuation map and μ-value distribution, determined by use of histogram matching with predefined distributions for lung and soft-tissue μ values in both transmission-based and CT-based attenuation maps for 1 patient.
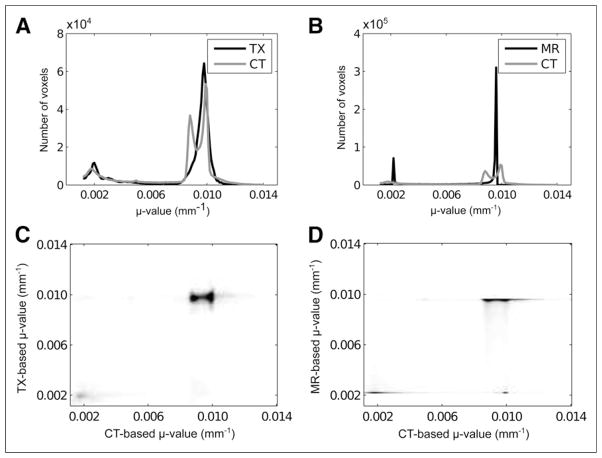
Joint histograms were derived by voxel-wise comparisons of the TXtr and CT-based maps (Fig. 5C) and of the MRtr and CT-based maps (Fig. 5D) from all patient data combined. Figures 5A and 5B show the histograms of the reconstructed TXtr and MRtr-based maps, respectively. In both joint histograms and individual histograms, voxels in which the CT-based attenuation coefficient was less than (0.5 × 10⁻⁴ mm−1) were excluded. Finally, Figure 6 shows slices of the transmission- and MR-based attenuation maps for 3 patients.
FIGURE 5.
Individual histograms (A and B) and joint histograms (C and D) of CT-based vs. TXtr (TX) maps (A and C) and CT-based vs. MRtr (MR) maps (B and D). Both joint histograms and individual histograms were obtained from all patient data combined.
FIGURE 6.
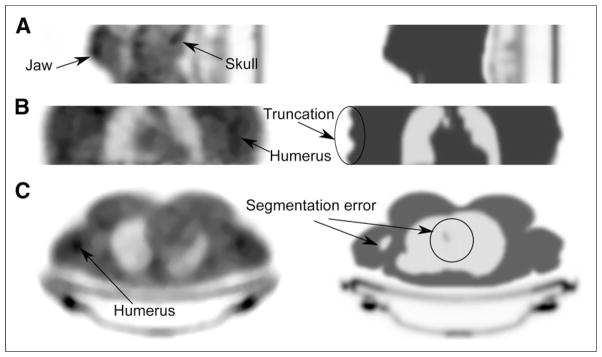
Visual comparison of transmission-based (left) and MR-based (right) attenuation maps for 3 patients. (A) Central sagittal slice from lower head/jaw shows better recovery of jaw and skull with transmission-based method. (B) In coronal slice of torso, transmission-based attenuation map shows only part of humerus, whereas MR-based attenuation map clearly shows truncation artifacts in arms. (C) In transverse slice of torso, MR-based method shows segmentation error in lungs and right humerus.
Reconstruction of PET Images
An overview of the similarity between PET images, obtained by CT-, TXtr-, and MRtr-based attenuation correction, is shown in Table 5. Table 5 also shows the similarity between PET images obtained by non-truncated transmission- and MR-based attenuation correction. Additionally, for both transmission imaging and MR imaging, the similarity between PET images reconstructed with the truncated and nontruncated attenuation maps is shown.
TABLE 5.
Similarity Data
| PET image x | PET image y | Similarity (%) |
|---|---|---|
| TXtr-based AC* | CT-based AC | 93.01 |
| MRtr-based AC* | CT-based AC | 90.43 |
| TXtr-based AC* | MRtr AC | 92.23 |
| Transmission-based AC† | MR-based AC | 82.86 |
| Transmission-based AC† | TXtr AC | 78.78 |
| MR-based AC† | MRtr AC | 87.13 |
Mean normalized percentage similarity between reconstructed PET images for 5 patients when 3 truncated attenuation maps (CT, TXtr, and MRtr) were used.
Mean normalized percentage similarity between PET images obtained by transmission- and MR-based attenuation correction and between PET images reconstructed with nontruncated (transmission and MR) and truncated (TXtr and MRtr) attenuation maps.
AC = attenuation correction.
Similarities were measured over all patient data combined.
Next, we evaluated the similarity between the PET image obtained by CT-based attenuation correction and the PET images reconstructed with the TXtr and MRtr maps for attenuation correction. The scatter plot in Figure 7A provides an indication of the correlation between the reconstructed emission values obtained with CT-based attenuation correction and those obtained with TXtr- or MRtr-based attenuation correction. Figure 7B shows the mean percentage difference between the PET image obtained by TXtr- or MRtr-based attenuation correction and the PET image obtained by CT-based attenuation correction in terms of volumes of interest in the lungs, soft tissue, and bone.
FIGURE 7.
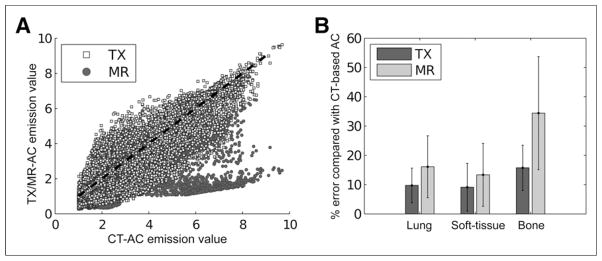
(A) Scatter plot of PET image obtained by CT-based attenuation correction vs. PET image obtained by TXtr (TX)- or MRtr-based (MR) attenuation correction. (B) Absolute mean percentage differences in reconstructed emission values of PET image obtained by TXtr- or MRtr-based attenuation correction vs. PET image obtained by CT-based attenuation correction. AC = attenuation correction.
DISCUSSION
The results of the present study demonstrated that the proposed method can be used to derive attenuation coefficients at 511 keV in a sequential TOF PET/MR imaging system. The similarity measurements shown in Table 5 and the mean percentage differences shown in Figure 7B indicated that TXtr-based attenuation correction out-performed MRtr-based attenuation correction, compared with CT, for all tissue types. In bone tissue, 18.7% less error was reported with TXtr attenuation correction than with MRtr-based attenuation correction, whereas 6.2% less error and 2.4% less error were obtained in soft tissue and the lungs, respectively (Fig. 7B). The absolute percentage differences between the PET image obtained by TXtr-based attenuation correction and the PET image obtained by CT-based attenuation correction in regions of normal tracer uptake were in the same range as the errors reported previously (10).
Figure 6C shows severe segmentation errors of lung tissue in the areas close to the heart as well as a misclassification of the right humerus in the MR-based attenuation map for patient 4. Segmentation errors decrease the correlation of reconstructed emission values with CT-based attenuation correction emission values, as shown in the scatter plot (Fig. 7A). These errors do not occur with the transmission-based technique. Additionally, bone structures such as the skull, humerus, and jaw bone could be discriminated on the transmission-based attenuation maps (Fig. 6).
The presence of MR coils during a PET acquisition can cause significant quantifications errors. Although attenuation coefficients of fixed coils can be included in the attenuation map by use of a template derived from a transmission or CT scan, difficulties in working with flexible coils remain. The transmission-based technique described in this work can measure the attenuation coefficients for any object inside the FOV, even flexible coils. The same is true for metallic implants, which can cause streak artifacts in CT-based attenuation maps.
In clinical practice, patients’ bodies usually extend beyond the FOV of the MR imaging scanner, causing truncation artifacts in MR-based attenuation maps (Fig. 6B) and an underestimation of reconstructed PET tracer uptake. This scenario causes significant image bias near the arms. These issues do not occur with the transmission-based technique. As shown in Table 5, the significant error between transmission-based attenuation and TXtr attenuation correction indicated the significant effect of truncation of the FOV on reconstructed PET images. Additionally, because the FOV of the CT acquisitions was smaller than the FOV of the MR images, a significant error between PET images obtained by MRtr-based attenuation correction and PET images obtained by MR-based attenuation correction was reported.
Table 4 shows an underestimation of the attenuation coefficient of soft tissue and an overestimation of that of lung tissue for the transmission-based attenuation correction compared with the pre-defined values used for the MR-based attenuation correction as well as the mean μ values in the bilinear scaled CT-based attenuation maps. The underestimation was probably caused by scatter and misclassified emission data contaminating the extracted transmission data. It is not clear which effect caused the overestimation of the attenuation coefficient of lung tissue. The overestimation may have been due to inaccuracies in the global count rate correction method used in Equation 2. As explained previously (31), the correction factor is derived from the count rate on LORs that fall outside an FOV defined by the radius τ2 (which in this work was set to 30 cm). These LORs are selected because the correction method was designed for count rate mismatches between the transmission scan and the blank scan. count rates are typically higher during simultaneous transmission and emission scans, causing more dead-time effects and leading to a loss of counts relative to those for the blank scan. However, the count rate decreases for LORs that pass through the patient and experience high attenuation. Therefore, the correction factor might be overestimated for these LORs. Because most of these LORs pass through the lungs, the multiplication by β in Equation 2 could cause an overestimation of the attenuation coefficient of lung tissue.
These issues are addressed by applying the scaling method (Fig. 3), which ensures that the mean transmission-based lung and soft-tissue μ values are translated into the mean attenuation coefficients derived from the CT database composed of 5 patients. Additionally, the scaling process reduces noise and improves contrast between different types of tissues (Fig. 4). A major limitation of the scaling method is that only 5 patients were used in the present study. More appropriate models could be derived from a larger database.
The distribution of the CT-based attenuation coefficients shown in Figures 5A and 5B clearly indicated 2 peaks in the soft-tissue region. Although the difference between the attenuation coefficients of adipose tissue and soft tissue is small, classifying adipose tissue improves the accuracy of attenuation correction (12,16). The distinction between fat and soft tissue is not as clear with the transmission-based method (Fig. 5A).
The TRR and ECR reported in Table 3 indicated that the amount of misclassification during the extraction of transmission data was limited. However, a slightly higher ECR for a larger patient (patient 2) explained a local underestimation of the attenuation coefficients in regions close to the transmission source (shoulders and arms) relative to those for the other, smaller patients. This effect will be more noticeable when the diameter of the source is reduced to fit the bore of a fully integrated PET/MR system. These issues can be addressed by use of more complex algorithms that allow the simultaneous reconstruction of emission and transmission data. Another approach is to consider alternative geometries for the transmission source, such as multiple line sources or partial rings.
The annulus-shaped transmission source increases the radiation exposure of the patient. In stand-alone PET, a source strength ranging from 370 to 740 MBq is typically used for transmission scanning in the coincidence mode, with acquisition times on the order of 5–10 min. The dose from a CT scan in PET/CT was shown to be significantly higher than that from a germanium-based PET transmission scan (34). In that same study, the much larger effect of the internal radiation dose caused by the intravenous injection of 370 MBq of 18F-FDG was also shown. In the proposed method, the total amount of activity inside the source (51.8–53.7 MBq) is much lower than that in the one bed position of a 68Ge transmission scan, and the patient receives the dose only when positioned inside the FOV of the PET scanner. The radiation dose is therefore expected to be of no concern.
CONCLUSION
In this work, we demonstrated that an annulus-shaped transmission source can be used to estimate the attenuation map at 511 keV in a sequential TOF PET/MR imaging system. Our results showed the advantages of our method over the MR imaging–based 2-tissue segmentation method available on the system. Average improvements in PET quantification of 6.4%, 2.4%, and 18.7% were obtained for lung tissue, soft tissue, and bone tissue, respectively. Additionally, the transmission and emission data could be acquired simultaneously, potentially excluding any PET or MR imaging acquisition time for the purpose of attenuation correction.
Acknowledgments
We thank Prof. Dr. Roel Van Holen for scientific discussions about the article.
Footnotes
DISCLOSURE
This research was funded by a PhD grant from the Institute for the Promotion of Innovation through Science and Technology in Flanders, Belgium, and EU FP7 project SUBLIMA (grant agreement 241711). Partial support was provided by NIH/HNLBI grant R01 HL071021 to Zahi A. Fayad. No other potential conflict of interest relevant to this article was reported.
References
- 1.Delso G, Ziegler S. PET/MRI system design. Eur J Nucl Med Mol Imaging. 2009;36:S86–S92. doi: 10.1007/s00259-008-1008-6. [DOI] [PubMed] [Google Scholar]
- 2.Kalemis A, Delattre BM, Heinzer S. Sequential whole-body PET/MR scanner: concept, clinical use, and optimisation after two years in the clinic—the manufacturer’s perspective. MAGMA. 2013;26:5–23. doi: 10.1007/s10334-012-0330-y. [DOI] [PubMed] [Google Scholar]
- 3.Delso G, Fürst S, Jakoby B, et al. Performance measurements of the Siemens mMR integrated whole-body PET/MR scanner. J Nucl Med. 2011;52:1914–1922. doi: 10.2967/jnumed.111.092726. [DOI] [PubMed] [Google Scholar]
- 4.Hofmann M, Pichler B, Schölkopf B, Beyer T. Towards quantitative PET/MRI: a review of MR-based attenuation correction techniques. Eur J Nucl Med Mol Imaging. 2009;36:S93–S104. doi: 10.1007/s00259-008-1007-7. [DOI] [PubMed] [Google Scholar]
- 5.Keereman V, Mollet P, Berker Y, Schulz V, Vandenberghe S. Challenges and current methods for attenuation correction in PET/MR. MAGMA. 2013;26:81–98. doi: 10.1007/s10334-012-0334-7. [DOI] [PubMed] [Google Scholar]
- 6.Burger C, Goerres G, Schoenes S, Buck A, Lonn AHR, Schulthess GKV. PET attenuation coefficients from CT images: experimental evaluation of the transformation of CT into PET 511-keV attenuation coefficients. Eur J Nucl Med Mol Imaging. 2002;29:922–927. doi: 10.1007/s00259-002-0796-3. [DOI] [PubMed] [Google Scholar]
- 7.Wagenknecht G, Kaiser HJ, Mottaghy FM, Herzog H. MRI for attenuation correction in PET: methods and challenges. MAGMA. 2013;26:99–113. doi: 10.1007/s10334-012-0353-4. [DOI] [PMC free article] [PubMed] [Google Scholar]
- 8.Kops ER, Herzog H. Alternative methods for attenuation correction for PET images in MR-PET scanners. IEEE Nucl Sci Symp Conf Rec. 2007;6:4327–4330. [Google Scholar]
- 9.Steinberg J, Jia G, Sammet S, Zhang J, Hall N, Knopp MV. Three-region MRI-based whole-body attenuation correction for automated PET reconstruction. Nucl Med Biol. 2010;37:227–235. doi: 10.1016/j.nucmedbio.2009.11.002. [DOI] [PubMed] [Google Scholar]
- 10.Hofmann M, Bezrukov I, Mantlik F, et al. MRI-based attenuation correction for whole-body PET/MRI: quantitative evaluation of segmentation- and atlas-based methods. J Nucl Med. 2011;52:1392–1399. doi: 10.2967/jnumed.110.078949. [DOI] [PubMed] [Google Scholar]
- 11.Schulz V, Torres-Espallardo I, Renisch S, et al. Automatic, three-segment, MR-based attenuation correction for whole-body PET/MR data. Eur J Nucl Med Mol Imaging. 2011;38:138–152. doi: 10.1007/s00259-010-1603-1. [DOI] [PubMed] [Google Scholar]
- 12.Martinez-Möller A, Souvatzoglou M, Delso G, et al. Tissue classification as a potential approach for attenuation correction in whole-body PET/MRI: evaluation with PET/CT data. J Nucl Med. 2009;50:520–526. doi: 10.2967/jnumed.108.054726. [DOI] [PubMed] [Google Scholar]
- 13.Keereman V, Fierens Y, Broux T, De Deene Y, Lonneux M, Vandenberghe S. MRI-based attenuation correction for PET/MRI using ultrashort echo time sequences. J Nucl Med. 2010;51:812–818. doi: 10.2967/jnumed.109.065425. [DOI] [PubMed] [Google Scholar]
- 14.Catana C, van der Kouwe A, Benner T, et al. Toward implementing an MRI-based PET attenuation-correction method for neurologic studies on the MR-PET brain prototype. J Nucl Med. 2010;51:1431–1438. doi: 10.2967/jnumed.109.069112. [DOI] [PMC free article] [PubMed] [Google Scholar]
- 15.Johansson A, Karlsson M, Nyholm T. CT substitute derived from MRI sequences with ultrashort echo time. Med Phys. 2011;38:2708–2714. doi: 10.1118/1.3578928. [DOI] [PubMed] [Google Scholar]
- 16.Berker Y, Franke J, Salomon A, et al. MRI-based attenuation correction for hybrid PET/MRI systems: a 4-class tissue segmentation technique using a combined ultrashort-echo-time/Dixon MRI sequence. J Nucl Med. 2012;53:796–804. doi: 10.2967/jnumed.111.092577. [DOI] [PubMed] [Google Scholar]
- 17.Hofmann M, Steinke F, Scheel V, et al. MRI-based attenuation correction for PET/MRI: a novel approach combining pattern recognition and atlas registration. J Nucl Med. 2008;49:1875–1883. doi: 10.2967/jnumed.107.049353. [DOI] [PubMed] [Google Scholar]
- 18.Keereman V, D’Asseler Y, Van Holen R, Mollet P, Vandenberghe S. The effect of interpatient attenuation coefficient variability on segmented attenuation correction for PET [abstract] J Nucl Med. 2010;51:1378. [Google Scholar]
- 19.Delso G, Martinez-Möller A, Bundschuh RA, Nekolla SG, Ziegler SI. The effect of limited MR field of view in MR/PET attenuation correction. Med Phys. 2010;37:2804–2812. doi: 10.1118/1.3431576. [DOI] [PubMed] [Google Scholar]
- 20.Zhang B, Pal D, Hu Z, et al. Attenuation correction for MR table and coils for a sequential PET/MR system. IEEE Nucl Sci Symp Conf Rec. 2009;8:3303–3306. [Google Scholar]
- 21.Hu Z, Ojha N, Renisch S, et al. MR-based attenuation correction for a whole-body sequential PET/MR system. IEEE Nucl Sci Symp Conf Rec. 2009;8:3508–3512. [Google Scholar]
- 22.Kuhl DE, Hale J, Eaton WL. Transmission scanning: a useful adjunct to conventional emission scanning for accurately keying isotope deposition to radiographic anatomy. Radiology. 1966;87:278–284. doi: 10.1148/87.2.278. [DOI] [PubMed] [Google Scholar]
- 23.Phelps ME, Hoffman EJ, Mullani NA, Ter-Pogossian MM, et al. Application of annihilation coincidence detection to transaxial reconstruction tomography. J Nucl Med. 1975;16:210–224. [PubMed] [Google Scholar]
- 24.Huesman R, Derenzo S, Cahoon J, et al. Orbiting transmission source for positron tomography. IEEE Trans Nucl Sci. 1988;35:735–739. [Google Scholar]
- 25.Daube-Witherspoon M, Carson RE, Green MV. Post-injection transmission attenuation measurements for PET. IEEE Trans Nucl Sci. 1988;35:757–761. [Google Scholar]
- 26.Karp JS, Muehllehner G, Qu H, Yan XH. Singles transmission in volume-imaging PET with a 137Cs source. Phys Med Biol. 1995;40:929–944. doi: 10.1088/0031-9155/40/5/014. [DOI] [PubMed] [Google Scholar]
- 27.deKemp RA, Nahmias C. Attenuation correction in PET using single photon transmission measurement. Med Phys. 1994;21:771–778. doi: 10.1118/1.597394. [DOI] [PubMed] [Google Scholar]
- 28.Muehllehner G, Gualtieri E, Karp JS, Smith RJ. Attenuation (correction in PET using Cs-137 singles transmission and iterative reconstruction. In: Bergmann H, Kohn H, Sinzinger H, editors. Radioactive Isotopes in Clinical Medicine and Research XXIII. Basel, Switzerland: Birkhauser Verlag; 1999. pp. 285–290. [Google Scholar]
- 29.Nuyts J, Dupont P, Stroobants S, Benninck R, Mortelmans L, Suetens P. Simultaneous maximum a posteriori reconstruction of attenuation and activity distributions from emission sinograms. IEEE Trans Med Imaging. 1999;18:393–403. doi: 10.1109/42.774167. [DOI] [PubMed] [Google Scholar]
- 30.Salomon A, Goedicke A, Schweizer B, Aach T, Schulz V. Simultaneous reconstruction of activity and attenuation for PET/MR. IEEE Trans Med Imaging. 2011;30:804–813. doi: 10.1109/TMI.2010.2095464. [DOI] [PubMed] [Google Scholar]
- 31.Mollet P, Keereman V, Clementel E, Vandenberghe S. Simultaneous MR-compatible emission and transmission imaging for PET using time-of-flight information. IEEE Trans Med Imaging. 2012;31:1734–1742. doi: 10.1109/TMI.2012.2198831. [DOI] [PubMed] [Google Scholar]
- 32.Hu Z, Renisch S, Schweizer B, et al. Philips Ingenuity TF PET/MR Attenuation Correction. Eindhoven, The Netherlands: Philips Heathcare; 2011. [Google Scholar]
- 33.Beyer T, Bockisch A, Kühl H, Martinez MJ. Whole-body 18F-FDG PET/CT in the presence of truncation artifacts. J Nucl Med. 2006;47:91–99. [PubMed] [Google Scholar]
- 34.Wu TH, Huang YH, Lee JJ, et al. Radiation exposure during transmission measurements: comparison between CT- and germanium-based techniques with a current PET scanner. Eur J Nucl Med Mol Imaging. 2004;31:38–43. doi: 10.1007/s00259-003-1327-6. [DOI] [PubMed] [Google Scholar]


