

Abstract
Uridine5′-diphosphate-glucuronosyltransferase (UGT)1A1 is a major phase II metabolism enzyme responsible for glucuronidation of drugs and endogenous compounds. The purpose of this study was to determine the expression level of UGT1A1 in human liver microsomes and human cell lines by using an isotope-free LC-MS/MS method. A Waters Ultra performance liquid chromatography (UPLC) system coupled with an API 5500Qtrap mass spectrometer was used for the analysis. Two signature peptides (Pep-1, and Pep-2) were employed to quantify UGT1A1 by multiple reaction monitoring (MRM) method. Standard addition method was used to validate the assay to account for the matrix effect. 17β-Estradiol was used as the marker substrate to determine UGT1A1 activities. The validated method has a linear range of 200–0.0195 nM for both signature peptides. The precision, accuracy, and matrix effect were in acceptable ranges. UGT1A1 expression levels were then determined using 8 individual human liver microsomes, a pooled human liver microsomes, three UGT1A1 genotyped human liver microsomes, and four cell lines (Caco-2, MCF-7, Hela, and HepG2). The correlations study showed that the UGT1A1 protein levels were strongly correlated with its glucuronidation activities in human liver microsomes (R2 =0.85) and in microsomes prepared from cell lines (R2 =0.95). The current isotope-labeled peptides were not necessary as the designated standard for LC-MS/MS quantitation of proteins. The isotope label-free absolute quantification method used here had good accuracy, sensitivity, linear range, and reproducibility, and were used successfully for the accurate determination of UGT1A1 from tissues and cell lines.
Keywords: UGT1A1, absolute quantification, LC-MS/MS, microsomes, glucuronidation
1. Introduction
Glucuronidation is a major phase II metabolic pathways [1], and a large numbers of endogenous compounds (e.g., bilirubin, bile acid), carcinogens (e.g., 2-amino-9H-pyrido[2,3-b]indole, a carcinogen derived from tobacco smoking), drugs (e.g., SN-38 and raloxifene), and micronutrients (e.g., genistein, resveratrol) are converted to glucuronide metabolites, which are then eliminated via bile or through urine [1]. Glucuronides generated in the intestine are also effluxed back into lumen, resulting in fast elimination and/or low bioavailability of the substrate [2]. The enzyme that catalyzes glucuronidation is called UDP-glucuronosyltransferases (UGTs). In humans, UGTs are classified into four families: UGT1, UGT2, UGT3, and UGT8, and the UGT1A subfamily (e.g. UGT1A1) is responsible for glucuronidation of many phenolics [3, 4].
UGT1A1, which is abundantly expressed in human liver and many other organs, is one of the major isoforms in the UGT1A family [1]. UGT1A1 is especially important for drug metabolism and drug safety because it is involved in the metabolism of many drugs and important endogenous substances such as bilirubin. For example, raltegravir, an antiretroviral drug, is mainly metabolized by glucuronidation via UGT1A1 [5]. In addition, UGT1A1 was also involved in inactivation anticancer drug, and the silence of UGT1A1 decreased the levels of cellular inactivation of the anticancer agent SN-38 and potentially influence its clinical response [6, 7]. The importance of UGT1A1 is also signified by the number of publications devoted or related to it. In PubMed database, use of the keyword “UGT1A1” generated a total of 1288 hits at the end of 2012, more than twice the next popular one, UGT1A9, which generated less than 500 hits.
Because of its importance, FDA, in its most recent Guidance to Industry with regard to the drug-drug interaction studies (http://www.fda.gov/downloads/Drugs/GuidanceComplianceRegulatoryInformation/Guidances/ucm292362.pdf), singles out UGT1A1 as the highest priority UGT isoform that needs to be investigated for potential drug-drug interactions, whereas other UGT isoforms were only classified as probably candidates. Hence, study of UGT1A1 also holds unusual importance among the UGT isoforms for drug development.
During the drug development process, microsomes from various tissues (e.g., liver and intestine), overexpressed insect Sf9 cells, and cell line culture models are commonly used to study the in vitro glucuronidation [4, 8–11]. It is currently not possible to normalize the expression levels of UGT1A1 in different model system because the antibody available for UGT1A1 does not always have high fidelity, and certainly not highly accurate for quantitative determination. Hence, the variabilities in UGT1A1 levels between different subjects, different tissue preparations, and cell lines are not carefully calibrated, leading to variable and perhaps inconsistent results across research groups or even in the same laboratory. The latter is because a protein’s expression level in the same cell line can vary over time and a microsome preparation is only able to yield moderate percentages of total enzymes present in the tissue.
Traditionally, biomolecular methods, such as Western blotting, enzyme-linked immunosorbent assays (ELISAs) and reverse-transcriptase polymerase chain reactions (RT-PCR) were used to monitor the expression of proteins. However, the lack of highly specific antibodies and limitation of Western blotting could only result in semi-quantification of UGT1A1. Recently, liquid chromatography/tandem mass spectrometry (LC/MS/MS)-based methods for quantification of UGT1A1 have been developed. For example, Fallon et al. reported a LC-MS method to absolutely quantify the expression of UGT1A1 from human liver microsomes in 2008 [12]. Later on, several LC-MS methods were develop to quantify UGT1A1 from different tissues using stable isotope-labeled peptides as the standards [13–15]. The published data showed that these methods were accurate and reproducible. However, isotope-labeled peptides are more expensive, less environmental friendly and not easily accessible. In addition, the method developed has not quantified UGT1A1 in different cell lines that are commonly used in preclinical research. The latter is important since the amounts of UGT1A1 expressed by these cell lines may be very different.
The aim of this paper was to develop an isotope-free LC-MS method to quantify UHT1A1 from a bank of human liver microsomes and then adapted this protocol for quantifying UGT1A1 from various commonly used cell lines. The correlation between the UGT1A1 expression and its glucuronidation activity was also determined. These studies also allowed us to determine the turnover number of UGT1A1, which has never been determined in the literature.
2. Experimental
2.1. Chemicals and reagents
Acetonitrile, formic acid, and water (LC-MS grade) were purchased from EMD (Gibbstown NJ). Ammonium bicarbonate, dithiothreitol, iodoacetamide, ammonium hydroxide, 17β-estradiol, 17β-estradiol-glucuronide, and TPCK (L-1-tosylamido-2-phenylethyl chloromethyl ketone)-treated trypsin from bovine pancreas (g10000 BAEE units/mg protein) were purchased from Sigma-Aldrich Co. (St. Louis, MO). Solid-phase extraction (SPE) cartridges (C18 100 mg, 1 ml) were purchased from VWR (Houston TX). Synthesized signature peptide-1 (DGAFYTLK, Pep-1, purity > 95%) and signature peptide-2 (TYPVPFQR, Pep-2, purity > 95%)) were purchased from Thermo Scientific (Rockford, IL). Recombinant UGT1A1 Supersomes™, pooled human liver microsome (pHLM from 50 donors), and 3 UGT1A1 genotyped human liver microsome [i.e., UGT1A1*1*1 (wild type), UGT1A1*1*28 (allelic variant), and UGT1A1*28*28 (allelic variant)] were purchased from BD Biosciences (Woburn, MA). A human liver microsome library of individual donors (n=8, designated as HLM-1, HLM-2, HLM-8, 20 mg/ml) were purchased from Xenotech (Lenexa, KS). Rat liver microsome (RLMs) for normalizing total protein content of samples, were isolated from male and female Sprague-Dawley rats. Caco-2 TC7, MCF-7, HeLa, and HepG2 cells were obtained from various reputable sources. Other chemicals were used as received.
2.2. Instruments and conditions
UGT1A1 quantitation was conducted using a triple quadruple mass spectrometer (5500 QTrap, AB Sciex, Foster City, CA) coupled to a Waters Acquity UPLC system (Waters, Milford, MA, USA). The LC column used for peptide separation and elution of human liver microsome samples and cell microsome samples was either a 1.7 μm C18 column (2.1 × 50 mm) or a 1.7 μm C118 column (2.1 × 100 mm) (Acquity, BEH C18, CA), depending on the need for chromatographic separation. Sample volume of 10 μl was injected to the column. Flow rate was 0.45 ml/min. Sample rack and column temperatures were maintained at 10°C and 45°C, respectively. Mobile phase A was high purity HPLC-grade water with 0.1% v/v formic acid, whereas mobile phase B was 100% acetonitrile with 0.1% v/v formic acid. A linear gradient was used to achieve the chromatographic separation, starting from 5% B and progressing to 25% B over a period of 5 min for human liver microsome samples. To separate the signature peptides from more complex cellular samples, a longer C-18 column (2.1 × 100 mm, Acquity, BEH C18, CA) was used, and the gradient program was adjusted to 5%–20% B from 0–7 min, 20%–95% B from 7–8 min, 95%–95% B from 8–8.5 min, 95%–5% B from 8.5–8.6 min, and 5% B from 8.6–10 min.
The mass spectrometer analysis was performed on an API 5500 Qtrap triple quadrupole mass spectrometer equipped with a TurboIonSpray™. Quantification was performed in positive ion multiple reaction monitoring (MRM) mode. Data were processed using Analyst 1.5.3 software package (AB SCIEX). Measured peptide concentrations were converted to protein levels (pmol/mg microsomal protein). The precursor-to-product transition for the UGT1A1 prototypic peptide represents the doubly charged parent ion 2H+ (m/z 457.9, Pep-1) to the single-charge product ions with m/z 617.4, 524.5, and 2H+ (m/z 504, Pep-2) to the single-charge product ions with m/z 547.5, 743.7, respectively. The instrument settings of the 5500 QTRAP LC-MS/MS for UGT1A1 multiple reaction monitoring (MRM) were the following: ion spray voltage, 5.5kV; temperature, 650°C; declustering potential (DP), 50 V; collision energy (CE), 28 V; collision cell exit potential (CXP), 13 V. Compound-dependent parameters were listed in Table 1.
Table 1.
Inter-day precision analysis for absolute quantification of the human UGT1A1 protein in eight individual HLMs, pHLM and pooled intestinal microsomes (pHIM), three UGT1A1 genotyped HLM, and recombination UGT1A1 Supersomes™. Samples were obtained from three independent digestions.
| Samples | UGT1A1 (pmol/mg protein) | ||||
|---|---|---|---|---|---|
| Peptide 1 | Peptide 2 | ||||
| MRM1 | MRM2 | MRM1 | MRM2 | ||
| HLM 4260 | Average | 28.6 | 27.8 | 17.7 | 21.2 |
| % C.V. | 9.3 | 25.2 | 23.9 | 28.0 | |
| HLM 436 | Average | 15.5 | 15.5 | 10.3 | 12.1 |
| % C.V. | 12.1 | 22.2 | 22.6 | 26.0 | |
| HLM 442 | Average | 5.7 | 5.0 | 3.9 | 4.0 |
| % C.V. | 18.4 | 24.9 | 16.0 | 39.5 | |
| HLM 452 | Average | 10.2 | 10.3 | 8.9 | 10.2 |
| % C.V. | 17.3 | 15.0 | 18.1 | 22.6 | |
| HLM 456 | Average | 2.1 | 3.2 | 2.2 | 2.1 |
| % C.V. | 24.9 | 10.6 | 17.0 | 35.2 | |
| HLM 728 | Average | 8.2 | 8.6 | 6.8 | 8.4 |
| % C.V. | 10.7 | 26.2 | 22.7 | 30.1 | |
| HLM 743 | Average | 17.8 | 18.2 | 13.6 | 16.1 |
| % C.V. | 16.5 | 16.7 | 30.7 | 34.1 | |
| HLM 751 | Average | 22.1 | 24.6 | 16.8 | 18.4 |
| % C.V. | 16.2 | 24.6 | 31.8 | 35.5 | |
| HIM | Average | 4.2 | 5.7 | 3.1 | 3.1 |
| % C.V. | 23.7 | 13.4 | 25.5 | 36.8 | |
| pHLM | Average | 7.6 | 9.0 | 4.6 | 6.2 |
| % C.V. | 10.8 | 15.0 | 32.6 | 40.5 | |
| UGT1A1*1*1 | Average | 19.2 | 20.7 | 7.7 | 8.6 |
| % C.V. | 21.6 | 19.5 | 7.2 | 4.0 | |
| UGT1A1*1*28 | Average | 5.6 | 6.9 | 3.0 | 3.3 |
| % C.V. | 6.5 | 8.1 | 24.9 | 41.4 | |
| UGT1A1*28*28 | Average | 4.5 | 5.8 | 1.9 | 2.8 |
| % C.V. | 21.5 | 29.7 | 48.1 | 73.7 | |
| Supersomes™ | Average | 165.1 | 167.0 | 125.5 | 140.9 |
| % C.V. | 10.2 | 11.8 | 34.5 | 35.5 | |
2.3 Selection of signature peptides for UGT1A1 quantitation
Two peptides, (D70GAFYTLK77) and (T78YPVPFQR85), previously used as signature peptides to quantify UGT1A1 [12], were selected as the signature peptides by the software MRMPilot (AB Sciex, Foster City, CA, USA) for quantitative analysis of human UGT1A1. For each peptide, two MRM transitions were selected for use in quantification (Figure 1).
Fig. 1.

(A) MS/MS spectra of m/z 457.9, +2-charged DGAFYTLK and m/z 504.4, +2-charged TYPVPFQR obtained from ESI-MS in positive ionization mode. Arrows indicate optimum product ions for use in MRM transitions. (B) The table shows the MRM transitions (Q1/Q3 settings) selected for the tryptic peptides.
2.4 Cell culture
Cell lines MCF-7, Hela, HepG2 were previously stored in the lab, and Caco-2 TC7 were originally a kind gift of Prof. Monique Rousset of INSERMU178 (Villejuif, France). Cells were routinely maintained in Dulbecco’s modified Eagle’s medium (DMEM) containing 10% fetal bovine serum (HyClone, Logan, UT, USA), 1% nonessential amino acids, 1% L-glutamine (Sigma-Aldrich), and 1% antibiotics (penicillin/streptomycin). The cells were cultured in humidified air with 5% CO2 in 145 mm dishes for preparation of microsomes. The culture medium was routinely replaced with the fresh medium every other day. Most cells were used after they were grown for 2–4 days, but Caco-2 cells were grown for 6 to 12 days before they were used for the preparation of microsomes.
2.5 Preparation of microsomes from cultured cells
Microsomes were prepared as described previously [5] with minor modifications. Briefly, cells (approximately 2× 10⁸ cells) were collected from the 145 mm dishes homogenized with a glass/Teflon homogenizer in microsomal homogenization buffer (0.25 M K2HPO4, 0.15 M KCl, 10 mM EDTA, and 0.25 mM phenylmethylsulfonyl fluoride) and were centrifuged at 9000g for 20 minutes at 4°C. The supernatant was centrifuged at 100,000× g for 60 minutes at 4°C, and the pellet was re-suspended in microsome dilution buffer (0.1 M KH2PO4, 20% glycerol, 10 mM EDTA, 0.1 mM DTT, and 0.25 mM phenylmethylsulfonyl fluoride). The protein concentration was spectrophotometrically determined at 570 nm using the Bicinchoninic acid colorimetric assay (Pierce, Rockford, IL).
2.6 Protein digestion and sample preparation
Aliquots of 50–200 μg of microsomal protein from HLMs, Supersomes™ or cells were digested as previously reported with some modifications [12]. Samples in 50 mM ammonium bicarbonate digestion buffer (50 μl) were denatured and reduced by heating at 95°C for 10 min in the presence of 5 mM of dithiothreitol (spiked, final concentration). This was followed by alkylation with 10 mM of iodoacetamide (spiked, final concentration) for 20 min in the dark. The mixtures were then digested with trypsin in a final volume of 100 μl at 37°C for 4 h (except in study of incubation time, where incubation period was varied). The optimal ratio of trypsin and protein was 1:50. The reaction was quenched by acidification with formic acid to a final concentration of 0.2% formic acid. Following centrifugation at 1000 g for 10 min, the supernatants were evaporated under nitrogen. An aliquot of 0.9 ml of 50 mM ammonium bicarbonate was then added in preparation for clean-up by solid phase extraction (SPE). SPE cartridges (Sep-Pak C18, Waters, Milford, MA) were conditioned with methanol and distilled water. Samples were loaded and the cartridges were washed with 1 ml of 50 mM ammonium bicarbonate. Samples were then eluted with 40% acetonitrile in water (1 ml). The eluate was evaporated to dryness under nitrogen at room temperature, and samples were reconstituted with 200 μl (5:95) of acetonitrile/25 mM formic acid at pH3 for injection.
2.7 Enzymatic activities of expressed UGT1A1, human liver microsomes, and microsomes prepared from various cells
The activity study was performed according to previously reported procedure [16]. All experiments were performed in triplicates. Briefly, the procedures were as follows: (1) mix microsomes/Supersomes™ (final concentration ≈ in range of 0.0053~0.053 mg protein per ml as optimum for the reaction), magnesium chloride (0.88 mM), saccharolactone (4.4 mM), alamethicin (0.022 mg/ml), different concentrations of substrates in a 50 mM potassium phosphate buffer (pH 7.4), and UDPGA (3.5 mM, add last) to a final volume of 680 μl; (2) separate the 680 μl mixture to three equal portions with the volume of 200 μl, and incubate all three portions at 37°C simultaneously for a predetermined period of time (10 to 60 min); and (3) stop the reaction by the addition of 100 μl of 94% acetonitrile/6% glacial acetic acid containing 90 µM acetophenone as the internal standard. The reaction mixture was centrifuged at 15,000 rpm for 15 min and the supernatant was directly subjected to UPLC for analysis. 17β-Estradiol was selected as the marker substrate of UGT1A1 to determine the activity of UGT1A1, according to the previously published studies from this and other laboratories [15, 16].
2.8 Correlation analysis
The protein levels of UGT1A1 were quantified in a bank of HLMs (n=12) including three UGT1A1-genotyped HLMs (i.e., UGT1A1*1*1, UGT1A1*1*28 and UGT1A1*28*28) (Xenotech, Lenexa, KS; BD Biosciences, Woburn, MA) and human cell microsomal samples (Caco-2, Hela, MCF-7, and HepG2). Correlations between protein levels of UGT1A1 determined using LC-MS/MS and their respective glucuronidation activities were performed using Pearson’s correlation coefficients.
2.9 Turnover of a typical substrate by UGT1A1
In general, the turnover numbers of UGT by microsomes or in cells were calculated as nanomoles of glucuronide(s) formed per reaction time per microsomal protein amount (or nmol/min/mg protein), as the actual concentration of the enzyme is unusually unknown. Since the absolute amount of UGT1A1 were quantified in human UGT1A1 Supersomes™ and tissue-derived cell lines using our LC-MS/MS method, we were able to obtain the turnover values of glucuronide(s) formation of a probe substrate (i.e., 17β-estradiol) for UGT1A1 in molars of UGT1A1 in cells. 2.10
2.10 Method validation
2.10.1 Calibration curve
Calibration curves were prepared in the same way as described in the sample preparation section by using rat liver microsome as matrix. Briefly, prior to the digestion, the synthesized peptides were carefully added to the rat liver microsome. Tris buffer at pH 7.4 was added to the samples to maintain the volumes. Calibration curves were constructed using peak area of each MRM selected. Least-squares linear regression method (1/×2 weight) was used to determine the slope, intercept and correlation coefficient of linear regression equation. The lower limit of detection (LLOD) was defined based on a signal-to-noise ratio of 10:1. UGT1A1, in units of pmol/mg (microsomal) protein, were extrapolated from the curves for unknown samples.
2.10.2 Matrix effects
Matrix effects were determined by comparing the peak areas of blank rat liver microsome extracts spikes with analytes with those of the standard solutions dried and reconstituted with a mobile phase. These evaluations were performed according to the recommended validation procedures reported by Matuszewski et al. [17].
2.10.3 External standard addition
External standard addition method was used to validate this quantitative method, which is based on the addition of known amounts of peptide standard to sample matrices. Four selected samples including pHLM, HLM442, HLM742, and HLM 751 were spiked equal amount of 3 series of standard working solution (3.125 nM, 1.56 nM, 0.78 nM) of label-free peptide 1 and 2 respectively. The UGT1A1 protein content was analyzed and was plotted against concentration of standard working solution accordingly. The accuracy of the standard addition was calculated by the following equation.
Whereas CM is the measured concentration after spike the additional standard, CT is the theoretical concentration, which is equal to the sum of the measured concentration before spike in the sample and the spiked standard concentration.
2.11 Reproducibility
For intra-day precision study, two batches of pHLM, UGT1A1 Supersomes™ and 3 individual human liver microsomes were analyzed on the same day. For inter-day precision study, pHLM, HIM, a bank of HLM, UGT1A1 Supersomes™ and three UGT1A1 genotyped human liver microsome were analyzed with each calibration standard curve. The %CV was determined with these above samples on the same day or on three different days, respectively. The samples were from three independent digestions.
3. Results
3.1 Optimization of UPLC conditions
UPLC programs with a run-time of 5min for human liver microsome samples and 10 min for cellular microsome samples were established by adopting C18 analytical columns with the same small particles (1.7 μm) but different column length (Fig. 2). This method provided a high signal to noise ratio, better separation, and good retention of relatively hydrophilic signature peptides. The lower limit of quantification (LLOQ) of the calibration curves was set to 0.0195 nM for both signature peptide-1 (Pep-1) and signature peptide-2 (Pep-2).
Fig. 2.

MRM chromatograms of tryptic peptides derived from human UGT1A1 supersome™ showing chromatograms of two tryptic peptides were detected by four MRM transitions, eluting at 2.5 min (A, for microsome sample) and 4.9 min (B, for cell samples).
3.2 Optimization of protocol for sample preparation
To establish a short, reliable and efficient sample preparation protocol, the length of protein denaturation by heat (10 to 60 min), the requirement of urea, duration of tryptic digestion (2 to 24 h), the amount of trypsin used (1:20–1:100) were optimized for recombinant UGT1A1. Fig 3A showed that substantial trypsin-mediated hydrolysis occurred even after 2 h. However, full digestion had quickly reached the maximum at 4 h. Based on these findings, the sample preparation protocol was established as: 95°C denaturing for 10 min, no urea, and trypsin digestion time of 4 h.
Fig. 3.

Optimization of sample preparation. (A) Time course study of trypsin digestion: the peak area for the peptides with m/z 457.9 and 504.4 are plotted against the reaction time. (B) Matrix effect was investigated by comparing the peak area and slope of calibration curves between two different sets of calibration curves. The absence or presence of matrix effect on the quantification was assessed. Dots denote four continuous diluted calibrants in 0.1% formic acid; Circles denote four continuous diluted calibrants digested with 200 μg rat liver microsomes (RLM).
3.3 Matrix effect
Since the selected amino acid sequence was confirmed to be unique for human UGT1A1 protein by searching against the non-redundant human protein sequences database using protein BLAST (National Center of Biotechnology Information, National Institutes of Health), rat liver microsomes (RLMs) were used as matrix. Even though human liver microsomes matrix were found to be cleaner than rat liver microsomes matrix, our results showed that there are no obvious matrix suppression by comparing the peak area and slope of calibration curves between two different sets of calibration curves with or without adding RLMs (Fig. 3B).
In most of the current protein quantification method, isotope-labeled peptides were used to eliminate the matrix effect. An alternative to isotope-labeled peptides is the use of the standard addition method to determine the matrix effect. The method of standard addition is widely used in instrumental analysis to determine concentration of an analyte (usually a small molecule) in an unknown sample by comparison to a set of samples of known concentration, similar to using a calibration curve. In this study, four samples including pHLM, HLM442, HLM742, and HLM 751 were randomly selected as test samples to evaluate the accuracy and matrix effect. Certain amount of external standard peptides were carefully added to these above samples, the total concentration of UGT1A1 in the samples were determined which was compared with theoretical concentration of UGT1A1. The results showed that accuracies of these determinations were in acceptable ranges (Fig. 4A), suggesting that the matrix effect could be accounted for.
Fig. 4.

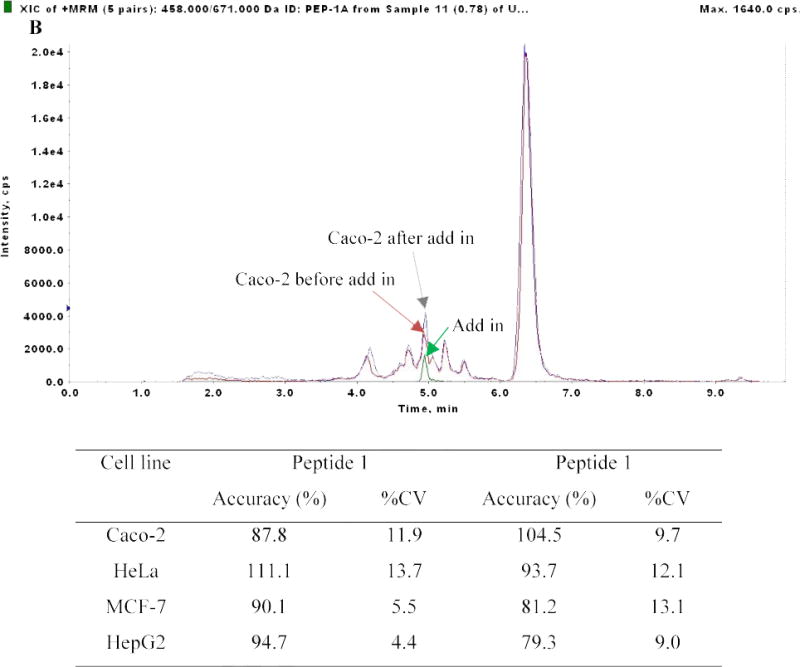

Validation for LC-MS/MS quantification of UGT1A1 protein using standard addition method. (A) Shown were overlaps of three MRM chromatograms of a (digested) individual HLM, standard calibrant (12.5 nM), and the digested HLM spiked with the calibrant (12.5nM). The accuracy and coefficient of variation (CV%) of pHLM, HLM 442, HLM 743, and HLM751 were analyzed and shown in table. (B) The standard addition method was also performed for validation of UGT1A1 quantification in cell microsomal fraction. Three overlapped MRM chromatograms are from digested Caco-2 cell microsomes, standard calibrant (0.78 nM), and digested Caco-2 cell microsomes spiked with calibrant (0.78 nM). The table shows value of accuracy and CV for Caco-2, Hela, MCF-7, and HepG2 cells. The data represents the mean± SD (n=3). (C) Plots of standard addition curve for digested cell microsomal protein derived from Caco-2, HeLa, MCF-7 and HepG2 cell. The standard addition experiment was conducted by spiking digested 50 μg cell microsomal protein with a dilution series of calibrants 0.78 nM, 1.56 nM, 3.125 nM and 6.25 nM (Curve for Hela and MCF-7). The regression equantions and R2 values were presented in the inset.
The external standard addition method was also used for validation of UGT1A1 quantification in cell microsomal fraction. The standard addition experiment was conducted by spiking digested 50 μg cellular microsomal protein with a dilution series of calibrants 0.78 nM, 1.56 nM, 3.125 nM and 6.25 nM. Fig. 4B showed three overlapped MRM chromatograms from digested Caco-2 cell microsomes, standard calibrant (0.78 nM), and digested Caco-2 cell microsomes spiked with calibrant (0.78 nM). Plots of standard addition curve were performed with digested cell microsomal protein derived from Caco-2, Hela, MCF-7 and HepG2 cell (Fig. 4C). The r2 values are all higher than 0.99, validating this approach (of external standard addition). The accuracy and CV for Caco-2, Hela, MCF-7, and HepG2 cells also were in the acceptance range (<15%).
3.4 Reproducibility
Intra-day and inter-day precision were determined by measuring six replicates of QC samples, which were prepared according to the calibration curve at three different concentrations in rat liver microsomes. The amount of UGT1A1 and variability were shown in Table 1 and 2. Amounts of UGT1A1 in Supersomes™ purchased from BD-Biosciences ranged from 125–167 pmol/mg, and averaged about 150 pmol/mg, which was consistent with those reported earlier [12]. These results demonstrated that the intra-day assay variation precision and accuracy values were in the acceptable range (<15%).
Table 2.
Intra-day precision analysis for absolute quantification of human UGT1A1. Two batches of pooled, individual HLMs and UGT1A1 Supersomes™ were used in the determinations (n=3).
| UGT1A1 (pmol/mg Protein) | ||||||
|---|---|---|---|---|---|---|
| Peptide 1 | Peptide 2 | |||||
| MRM1 | MRM2 | MRM1 | MRM2 | |||
| Batch 1 | pHLM | Average | 9.9 | 12.2 | 11.0 | 13.5 |
| % C.V. | 1.5 | 1.0 | 1.0 | 0.4 | ||
| Supersome™ | Average | 179.0 | 180.2 | 175.6 | 198.6 | |
| % C.V. | 3.4 | 1.6 | 1.0 | 2.0 | ||
| HLM 442 | Average | 5.6 | 8.1 | 8.6 | 9.9 | |
| % C.V. | 5.0 | 2.2 | 1.2 | 2.6 | ||
| HLM 743 | Average | 18.4 | 20.5 | 22.5 | 26.2 | |
| % C.V. | 3.7 | 4.2 | 3.3 | 5.4 | ||
| HLM 751 | Average | 18.4 | 20.8 | 20.1 | 23.9 | |
| % C.V. | 2.7 | 0.8 | 1.5 | 2.0 | ||
| Batch 2 | pHLM | Average | 8.6 | 9.0 | 3.1 | 5.1 |
| % C.V. | 4.4 | 2.0 | 3.3 | 3.8 | ||
| Supersome™ | Average | 170.0 | 176.6 | 100.4 | 111.4 | |
| % C.V. | 3.4 | 1.6 | 1.0 | 2.0 | ||
| HLM442 | Average | 4.6 | 4.8 | 1.6 | 3.1 | |
| % C.V. | 5.8 | 3.6 | 3.9 | 4.8 | ||
| HLM 743 | Average | 16.8 | 17.2 | 9.7 | 12.2 | |
| % C.V. | 3.9 | 5.0 | 4.5 | 6.6 | ||
| HLM 751 | Average | 17.5 | 18.0 | 8.6 | 11.3 | |
| % C.V. | 2.7 | 0.9 | 2.1 | 2.4 | ||
3.5 Quantification of UGT1A1 protein in human tissue microsomes
The UGT1A1 was quantified in a bank of human liver microsomes and pooled intestinal microsomes (pHIM) using synthetic signature peptides as the calibration standards. The results showed that in 8 individual HLMs, the protein levels of UGT1A1 ranged from 2.4 to 23.8 pmol/mg microsomal (Fig. 5A), which is comparable to the values (6.5–44.6) reported by other authors who used the same peptide fragments [14, 15]. The UGT1A1 protein level of pHLM and pHIM was found to be was 7.6 and 4.2 pmol/mg protein by using pep-1; or 4.6 and 3.1 pmol/mg protein by using pep-2. Concentrations determined using signature pep-1 were somewhat higher than signature pep-2, and the latter also showed higher variability. Human liver microsomes isolated from donors with allelic variants of UGT1A1 were also quantified. UGT1A1 (*28*28) is a functional UGT promoter polymorphism associated with Gilbert’s disease. The mutation results in lowered UGT1A1 expression. Relative UGT1A1 protein expression levels resulting from the allele combinations are: *1*1>*1* 28>*28*28. Our protein quantitation results showed similar trend (20.0 pmol/mg protein > 6.23 pmol/mg protein > 5.2 pmol/mg protein). The amount of UGT1A1 in pHLM and pHIM were lower than the reported values [14], perhaps due to the fact that these microsomes have been stored used for more than 6 month and defrosted for use previously. In fact, the UGT1A1 level in pHLM were also much lower than the average 8 human liver microsomes (13.8 pmol/mg) or UGT1A1*1*1 (19.1 pmol/mg).
Fig. 5.
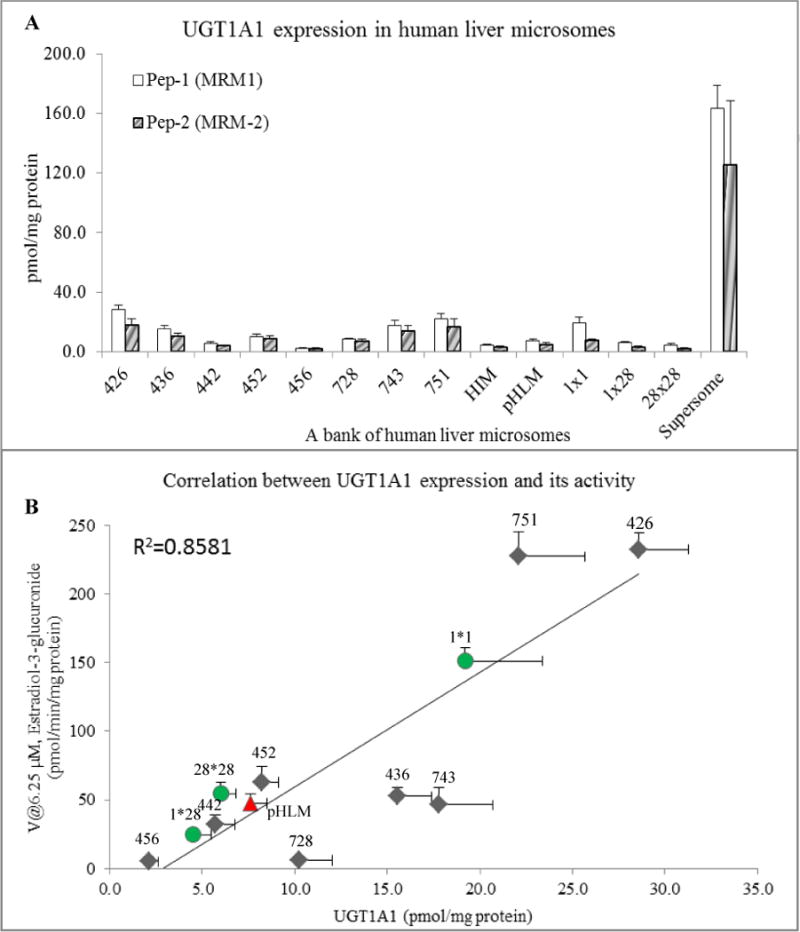
(A) Comparison of human UGT1A1 protein level measured by LC-MS/MS in digested different human tissue micrsomal samples. Peptide concentrations were converted to pmol UGT1A1 protein /mg microsomal protein. The Blank bars and solid bars denote the protein level of UGT1A1 obtained in the present study were determined using two MRM transitions respectively. Data are presented as mean± SD (n=3). (B) Correlation between the protein levels of UGT1A1 and 17β-estradiol glucuronidation. The eight individual human liver microsomes (HLMs) were indicated in rhombus. Pooled liver microsomes (pHLM) and UGT1A1 genotyped HLMs were indicated in triangle and circles, respectively. R2 values are Pearson’s correlation coefficient.
3.6 Quantification of UGT1A1 in various cells
The UGT1A1 protein levels in HeLa, MCF-7, HepG-2, and Caco-2 cells were also determined. As shown in Fig. 5, the UGT1A1 protein levels in the Caco-2 cells were 2.58 ± 0.24 pmol/mg protein when using pep-1 or 1.32 ± 0.18 pmol/mg protein when using pep-2. The UGT1A1protein levels in the MCF-7 and HepG2 were less than that in the Caco-2 cells, but were quite similar between the two cell types (pep-1, 1.37 ± 0.28 pmol/mg protein, 1.31 ± 0.12 pmol/mg protein respectively; pep-2, 1.05 ± 0.29 pmol/mg protein and 0.77 ± 0.08 pmol/mg protein respectively). The UGT1A1 protein level in HeLa cells was the lowest at 0.16 ± 0.01 pmol/mg when using pep-1 protein or at 0.08 ± 0.01 pmol/mg protein when using pep-2.
3.7 Correlation between UGT1A1 levels and glucuronidation activities
The glucuronidation activities of these analytes were also determined. 17β-Estradiol, which is a probe substrate of UGT1A1, was used as a marker compound to determine the glucuronidation activity. Correlation analysis was performed between glucuronidation activities and levels of UGT1A1 measured by LC-MS/MS (Fig. 4B and Fig. 5B). The activities of 17β-estradiol-glucuronidation correlated strongly with the UGT1A1 level. For the HLMs, the correlation R2 was 0.85 and for cell line, the correlation R2 was 0.95.
3.8 Turnover number
A few papers have reported a correlation between activities and protein levels, but none has calculated a turnover number for UGT1A1. Therefore, the turnover number of 17β-estradiol glucuronide metabolites formation was calculated based on the above results. The turnover of 17β-estradiol (at 10 μM) were about 2.04 ± 0.25 and 2.15 ± 0.31 nmol · min−1· nmol−1, or about 2 molecules of 17β-estradiol by 1 molecular of UGT1A1 per min, when using human UGT1A1 Supersomes™ and Caco-2 microsomal protein, respectively (Table 3). Since the maximal rates of metabolism of 17β-estradiol by UGT1A1 was approximately 5 times higher than the rates of metabolism at 10 μM [18], the maximal turnover number is likely to be 10 molecules per minute per UGT1A1. In contrast, phase II metabolism of 17β-estradiol by CYP3A4 to 2-OH-17β-estradiol appears to proceed at a rate of 1 molecules of 17β-estradiol per CYP3A4 [19].
Table 3.
Metabolism of 17β-estradiol to 17β-estradiol-3-glucuronide using UGT1A1-containing microsomal preparations from various cells.
| Microsomes | Turnover values (nmol· min−1· nmol−1 UGT1A1) |
|---|---|
| Supersomes | 2.04 ± 0.25 |
| Caco-2 | 2.15 ± 0.31 |
| HeLa | 3.41 ± 0.40 |
| MCF-7 | 2.50 ± 0.28 |
| HepG2 | 2.86 ± 0.33 |
4. Discussion
We have demonstrated for the first time that absolute quantitation of protein achieved by using label-free signature peptides combined with an external standard addition will provide results that are equally reliable as the isotope labeled peptide method [15]. We have also determined and reported the first turnover number of UGT1A1 against its prototypical substrate, 17β-estradiol. This approach of determining the turnover number of a particular substrate by a UGT isoform could further accelerate our understanding of the glucuronidation process, especially how it could be coupled to a CYP-mediated hydroxylation process.
To our knowledge, this is first demonstration of the turnover value of UGT1A1 against a prototypical substrate 17β-estradiol in microsomes. Earlier, phase I metabolism of 17β-estradiol (100 μM) by CYP isoforms CYP1A1, CYP3A4, CYP2B6, and CYP2E1 was shown to have a turnover number of 3.43, 1.02, 1.04, and 0.39, respectively [19, 20]. Interestingly, Delaforge et al. [21] also reported a much slower turnover number for CYP-mediated metabolism of 17β-estradiol-glucuronide (0.1–0.3 molecules per CYP per min). Taken together, these results suggest that phase II conjugation of 17β-estradiol would normally be the dominant metabolic pathway for 17β-estradiol in liver, as the turnover number appears to be much higher. This is consistent with the fact that a majority of 17β-estradiol in plasma are present as conjugates (glucuronides and sulfates).
CYPs and UGTs are collocated on the surface of the endoplasmic reticulum (ER) and nuclear envelope of cells. Specifically, P450s are anchored to the cytosolic side of the ER, and UGTs are localized to the luminal side of the ER. Taura et al. [22] showed that several human UGT isoforms immunoprecipitated with CYP3A4 in the endoplasmic reticulum, suggesting that these enzymes may be closely associated with each other during the metabolism of compounds. Several investigators also have noted that the protein-protein interaction between phase I and II enzymes would more efficiently metabolize and eliminate the compounds from the body [23]. Our results suggest that the turnover number of UGT1A1 could be much higher than CYP3A4 against the same substrate, and as such UGT is probably quite capable of further metabolizing phase I metabolites that happen to be phase II substrates. Indeed, this is true for many drugs and endogenous substances, whose phase I metabolites are phenolics (e.g., tamoxifen, raloxifene, and testosterone).
The UGT1A1 expression levels in human liver microsome afforded by using this label-free method is comparable to those obtained from stable-isotope labeled method. For example, by using a stable-isotope labeled LC-MS method, Fallon et al. reported that the UGT1A1 in a pooled human liver microsome was about 30 (7–59) pmol/mg protein [14]. Another publication showed that the UGT1A1 expression was determined to be 7–33 pmol/mg of liver microsomes by using a stable-isotope labeled LC-MS method [12]. These reported data, which is similar to ours (Fig 5A), suggested that this label free LC-MS method is as reliable as the method that utilized a stable-isotope labeled signature peptide.
One of the un-expected observations is that 728, 436, and 743 were out of the correlation curve (Fig 5A), which lead to un-correlation between UGT1A1 expression and its activity. For example, the UGT1A1 expression level in 743 was similar with that in 751; however, the activities of these two microsomes were about 5 folds different. The reasons for these unexpected differences are complicated. One of the explanations could be enzyme specificity. Although UGT1A1 is the predominantly enzyme in human microsome that catalyzes glucuronidation of 17β-estradiol, other UGT isoforms could also contribute to the glucuronidation [24], resulting in higher than expected activities (HLM 751). The other explanations could be post translational modification (PTM). For example, it was reported that UGTs could be phosphorylated resulting the change of substrate specificity [25]. In the present protein quantification methods using LC-MS, regardless if the method used a stable-isotope peptide or not, the assumption is targeted protein has the identical PTMs in all samples, which may or may not be true. In case of PTMs occur (e.g., phosphorylation, methylation), the expression level quantified by LC-MS maybe consistent but the activity will most likely change, resulting in poor correlation between expression and activity (in this case, less than expected activities for HLM728, HLM743). Further study is needed to explain this un-expected phenomenon.
Another un-expected observation is that the trypsin digestion efficiency (Fig 3A). The digestion result showed that substantial hydrolysis occurred after 2 h and the full digestion had quickly reached the maximum at 4 h, after which the peak intensity of pep-1 and 2 decreased. The reason could be because the stability of the peptides. Further investigated is needed on stability of peptides during digestion.
5. Conclusion
A robust, reproducible and reliable LC-MS/MS protein quantification method based on label-free signature peptides has been established and shown to be able to quantify human UGT1A1 proteins in different microsomes (Supersomes™ and HLMs) and human cell lines (i.e., Caco2, Hela, HepG2, and MCF-7). Glucuronidation activities of the respective probe substrates significantly correlated with protein levels, which allowed us to determine the turnover number for UGT1A1 against a prototypical substrate, 17β-estradiol. Unexpected discrepancies in correlation between activities and UGT1A1 levels suggest possible differences in PTM of UGT1A1 or expression of other contributing UGT isoforms in certain human liver microsomal samples.
Fig. 6.
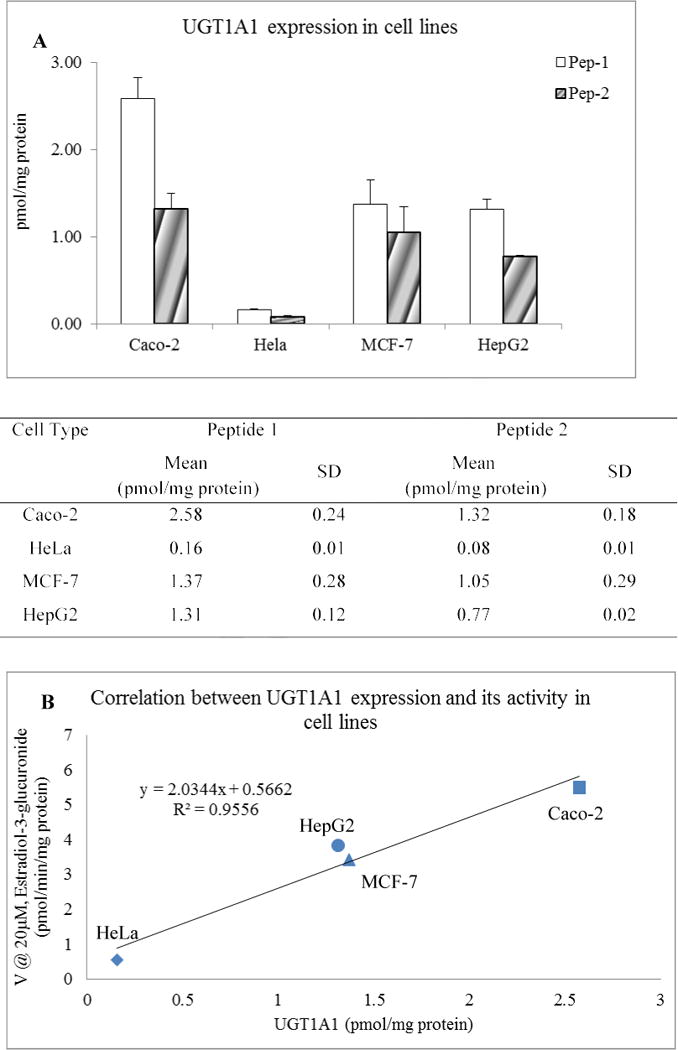
(A) Absolute quantification of human UGT1A1 protein in human derived cell lines. The microsomal protein prepared from Caco-2, HeLa, MCF-7, and HepG2 cells were subjected to LC-MS/MS analysis for absolute quantification of UGT1A1 protein. The blank and solid bars indicate UGT1A1 protein level (pmol/mg protein) determined by two MRM transitions from peptide 1 and peptide 2 respectively. The data represents the mean± SD (n=3). The table below histogram gives the corresponding number. (B) Correlation between the protein levels of UGT1A1 and 17β-estradiol glucuronidation in human derived cell lines. Microsomal proteins isolated from Caco-2, HeLa, MCF-7, and HepG2 cells were used in the present study. R2 values are Pearson’s correlation coefficient.
Highlights.
The highlights for this paper are:
Develop an isotope-free UPLC-MS method to absolutely quantify UGT1A1
Validate the accuracy of the method with respect to accuracy and precision
Corroborate the accuracy of this method using a standard addition approach
Demonstrate the correlation between UGT1A1 level and UGT1A1 activity
Determine the UGT1A1 turnover number in various cell lines using estradiol.
Abbreviations
- UGT
Uridine 5′-diphospho-glucuronosyltransferase (UDP-glucuronosyltransferase)
- CYP
Cytochrome P450
- UPLC
Ultra performance liquid chromatography
- MRM
multiple reaction monitoring
- DP
declustering potential
- CE
collision energy
- CXP
collision cell exit potential
- LLOQ
lower limit of quantification
- HLM
human liver microsome
- RLM
rat liver microsome
- PTM
post translational modification
Footnotes
Publisher's Disclaimer: This is a PDF file of an unedited manuscript that has been accepted for publication. As a service to our customers we are providing this early version of the manuscript. The manuscript will undergo copyediting, typesetting, and review of the resulting proof before it is published in its final citable form. Please note that during the production process errors may be discovered which could affect the content, and all legal disclaimers that apply to the journal pertain.
References
- 1.Wu B, Kulkarni K, Basu S, Zhang S, Hu M. First-pass metabolism via UDP-glucuronosyltransferase: a barrier to oral bioavailability of phenolics. J Pharm Sci. 2011;100:3655–3681. doi: 10.1002/jps.22568. [DOI] [PMC free article] [PubMed] [Google Scholar]
- 2.Liu Y, Hu M. Absorption and metabolism of flavonoids in the caco-2 cell culture model and a perused rat intestinal model. Drug Metab Dispos. 2002;30:370–377. doi: 10.1124/dmd.30.4.370. [DOI] [PubMed] [Google Scholar]
- 3.Wu B, Basu S, Meng S, Wang X, Hu M. Regioselective sulfation and glucuronidation of phenolics: insights into the structural basis. Curr Drug Metab. 2011;12:900–916. doi: 10.2174/138920011797470100. [DOI] [PMC free article] [PubMed] [Google Scholar]
- 4.Wu B, Wang X, Zhang S, Hu M. Accurate prediction of glucuronidation of structurally diverse phenolics by human UGT1A9 using combined experimental and in silico approaches. Pharm Res. 2012;29:1544–1561. doi: 10.1007/s11095-012-0666-z. [DOI] [PMC free article] [PubMed] [Google Scholar]
- 5.Takahashi M, Hirano A, Oishi Y, Sato M, Yoshino M, Ikemura K, Shibata M, Fukushima N, Amioka K, Nomura T, Yokomaku Y, Sugiura W. Lack of correlation between UGT1A1*6, *28 genotypes, and plasma raltegravir concentrations in Japanese HIV-1-infected patients. J Int AIDS Soc. 2012;15:18342. doi: 10.1089/AID.2011.0231. [DOI] [PubMed] [Google Scholar]
- 6.Gagnon JF, Bernard O, Villeneuve L, Tetu B, Guillemette C. Irinotecan inactivation is modulated by epigenetic silencing of UGT1A1 in colon cancer. Clin Cancer Res. 2006;12:1850–1858. doi: 10.1158/1078-0432.CCR-05-2130. [DOI] [PubMed] [Google Scholar]
- 7.Wang Y, Shen L, Xu N, Wang JW, Jiao SC, Liu ZY, Xu JM. UGT1A1 predicts outcome in colorectal cancer treated with irinotecan and fluorouracil. World J Gastroenterol. 2012;18:6635–6644. doi: 10.3748/wjg.v18.i45.6635. [DOI] [PMC free article] [PubMed] [Google Scholar]
- 8.Tang L, Singh R, Liu Z, Hu M. Structure and concentration changes affect characterization of UGT isoform-specific metabolism of isoflavones. Mol Pharm. 2009;6:1466–1482. doi: 10.1021/mp8002557. [DOI] [PMC free article] [PubMed] [Google Scholar]
- 9.Tang L, Ye L, Singh R, Wu B, Lv C, Zhao J, Liu Z, Hu M. Use of glucuronidation fingerprinting to describe and predict mono- and dihydroxyflavone metabolism by recombinant UGT isoforms and human intestinal and liver microsomes. Mol Pharm. 2010;7:664–679. doi: 10.1021/mp900223c. [DOI] [PMC free article] [PubMed] [Google Scholar]
- 10.Wu B. Use of physiologically based pharmacokinetic models to evaluate the impact of intestinal glucuronide hydrolysis on the pharmacokinetics of aglycone. J Pharm Sci. 2012;101:1281–1301. doi: 10.1002/jps.22827. [DOI] [PubMed] [Google Scholar]
- 11.Wu B, Morrow JK, Singh R, Zhang S, Hu M. Three-dimensional quantitative structure-activity relationship studies on UGT1A9-mediated 3-O-glucuronidation of natural flavonols using a pharmacophore-based comparative molecular field analysis model. J Pharmacol Exp Ther. 2011;336:403–413. doi: 10.1124/jpet.110.175356. [DOI] [PMC free article] [PubMed] [Google Scholar]
- 12.Fallon JK, Harbourt DE, Maleki SH, Kessler FK, Ritter JK, Smith PC. Absolute quantification of human uridine-diphosphate glucuronosyl transferase (UGT) enzyme isoforms 1A1 and 1A6 by tandem LC-MS. Drug Metab Lett. 2008;2:210–222. doi: 10.2174/187231208785425764. [DOI] [PubMed] [Google Scholar]
- 13.Izukawa T, Nakajima M, Fujiwara R, Yamanaka H, Fukami T, Takamiya M, Aoki Y, Ikushiro S, Sakaki T, Yokoi T. Quantitative analysis of UDP-glucuronosyltransferase (UGT) 1A and UGT2B expression levels in human livers. Drug Metab Dispos. 2009;37:1759–1768. doi: 10.1124/dmd.109.027227. [DOI] [PubMed] [Google Scholar]
- 14.Harbourt DE, Fallon JK, Ito S, Baba T, Ritter JK, Glish GL, Smith PC. Quantification of human uridine-diphosphate glucuronosyl transferase 1A isoforms in liver, intestine, and kidney using nanobore liquid chromatography-tandem mass spectrometry. Anal Chem. 2012;84:98–105. doi: 10.1021/ac201704a. [DOI] [PMC free article] [PubMed] [Google Scholar]
- 15.Sato Y, Nagata M, Kawamura A, Miyashita A, Usui T. Protein quantification of UDP-glucuronosyltransferases 1A1 and 2B7 in human liver microsomes by LC-MS/MS and correlation with glucuronidation activities. Xenobiotica. 2012;42:823–829. doi: 10.3109/00498254.2012.665950. [DOI] [PubMed] [Google Scholar]
- 16.Wu B, Zhang S, Hu M. Evaluation of 3,3′,4′-trihydroxyflavone and 3,6,4′-trihydroxyflavone (4′-O-glucuronidation) as the in vitro functional markers for hepatic UGT1A1. Mol Pharm. 2011;8:2379–2389. doi: 10.1021/mp200300w. [DOI] [PMC free article] [PubMed] [Google Scholar]
- 17.Matuszewski BK, Constanzer ML, Chavez-Eng CM. Strategies for the assessment of matrix effect in quantitative bioanalytical methods based on HPLC-MS/MS. Anal Chem. 2003;75:3019–3030. doi: 10.1021/ac020361s. [DOI] [PubMed] [Google Scholar]
- 18.Zhou J, Tracy TS, Remmel RP. Correlation between bilirubin glucuronidation and estradiol-3-gluronidation in the presence of model UDP-glucuronosyltransferase 1A1 substrates/inhibitors. Drug Metab Dispos. 2011;39:322–329. doi: 10.1124/dmd.110.035030. [DOI] [PMC free article] [PubMed] [Google Scholar]
- 19.Zhu BT, Lee AJ. NADPH-dependent metabolism of 17beta-estradiol and estrone to polar and nonpolar metabolites by human tissues and cytochrome P450 isoforms. Steroids. 2005;70:225–244. doi: 10.1016/j.steroids.2005.01.002. [DOI] [PubMed] [Google Scholar]
- 20.Ohe T, Hirobe M, Mashino T. Novel metabolic pathway of estrone and 17beta-estradiol catalyzed by cytochrome P-450. Drug Metab Dispos. 2000;28:110–112. [PubMed] [Google Scholar]
- 21.Delaforge M, Pruvost A, Perrin L, Andre F. Cytochrome P450-mediated oxidation of glucuronide derivatives: example of estradiol-17beta-glucuronide oxidation to 2-hydroxy-estradiol-17beta-glucuronide by CYP 2C8. Drug Metab Dispos. 2005;33:466–473. doi: 10.1124/dmd.104.002097. [DOI] [PubMed] [Google Scholar]
- 22.Taura KI, Yamada H, Hagino Y, Ishii Y, Mori MA, Oguri K. Interaction between cytochrome P450 and other drug-metabolizing enzymes: evidence for an association of CYP1A1 with microsomal epoxide hydrolase and UDP-glucuronosyltransferase. Biochem Biophys Res Commun. 2000;273:1048–1052. doi: 10.1006/bbrc.2000.3076. [DOI] [PubMed] [Google Scholar]
- 23.Meech R, Mackenzie PI. UDP-glucuronosyltransferase, the role of the amino terminus in dimerization. J Biol Chem. 1997;272:26913–26917. doi: 10.1074/jbc.272.43.26913. [DOI] [PubMed] [Google Scholar]
- 24.Lepine J, Bernard O, Plante M, Tetu B, Pelletier G, Labrie F, Belanger A, Guillemette C. Specificity and regioselectivity of the conjugation of estradiol, estrone, and their catecholestrogen and methoxyestrogen metabolites by human uridine diphospho-glucuronosyltransferases expressed in endometrium. J Clin Endocrinol Metab. 2004;89:5222–5232. doi: 10.1210/jc.2004-0331. [DOI] [PubMed] [Google Scholar]
- 25.Basu NK, Kovarova M, Garza A, Kubota S, Saha T, Mitra PS, Banerjee R, Rivera J, Owens IS. Phosphorylation of a UDP-glucuronosyltransferase regulates substrate specificity. Proc Natl Acad Sci U S A. 2005;102:6285–6290. doi: 10.1073/pnas.0407872102. [DOI] [PMC free article] [PubMed] [Google Scholar]