

Abstract
Purpose
To determine the reproducibility of MRI aortic hemodynamic markers and to assess their relationship to aortic growth in a cohort of patients with bicuspid aortic valves (BAV).
Materials and Methods
25 patients previously studied with 4D Flow imaging who had at least 2 separate cross-sectional imaging studies to assess for aortic growth were included: tricuspid aortic valve (TAV) controls without valvular disease (n = 12) and patients with BAV (n = 13). Flow data from the ascending aorta was used for calculation of peak velocity, normalized flow displacement, maximum wall shear stress (WSS), mean WSS, and minimal WSS. Pearson’s correlation was used to evaluate inter-observer agreement, and linear regression to evaluate the correlation between the different hemodynamic markers and growth. Patient informed consent was waived by the institutional review board that approved the study.
Results
Peak velocity and flow displacement were very reproducible (r = 0.90–1.0 and r = 0.91–0.98, respectively). The range of WSS parameters was largely reproducible (0.47 < r < 0.96) with the greatest variability at the data extraction stage of analysis (0.47 < r < 0.85). Flow displacement best correlated with interval aortic growth (r = 0.65), peak velocity was moderately correlated (r = 0.35), but the WSS parameters did not correlate well with growth (r < 0.17).
Conclusion
Flow displacement is a simple and reproducible hemodynamic marker that shows good correlation with aortic growth in patients with bicuspid aortic valves.
Keywords: MRI, Aorta, Valves, BAV, Eccentric Jets
Background
Altered blood flow with a bicuspid aortic valve (BAV) has long been suspected of influencing aortic disease progression (1), and advances in magnetic resonance (MR) blood flow imaging have heightened speculation about the importance of hemodynamics in these patients. Eccentric, helical flow patterns have been demonstrated (2–4) and linked to increased wall shear stress (WSS) at the aortic convexity (5,6). Intriguingly, aneurysms of the ascending aorta with BAV are reported to bulge asymmetrically toward the convexity (7–9). Until recently, however, there has been no clear link between abnormal hemodynamics and disease progression. Now data is available that both indirectly and directly correlates eccentric flow with BAV to increased aortic growth rates (10,11).
Previous reports demonstrate that normalized flow displacement is reproducible and correlates well with growth (5,12). We seek to provide a more comprehensive analysis of aortic hemodynamic features with BAV, including peak systolic velocity and WSS, which has been shown to significantly influence endothelial function (13,14). Our study aims to contribute to the development of reliable aortic flow evaluation by determining which MRI hemodynamic markers are most reproducible in relation to assessment of aortic growth in a cohort of patients with BAV.
Methods
Time-resolved, 3D phase-contrast MR imaging (4D Flow) was used to assess blood flow patterns in the thoracic aorta of 135 subjects who presented for cardiac imaging between February 9, 2007 and March 20, 2012. From this group, patients with serial, contrast-enhanced magnetic resonance or computed tomographic angiography studies to evaluate aortic growth were selected. Ascending aortic diameters were measured independently at standard levels by two blinded observers (both radiologists with a combined 11 years experience with cardiovascular imaging; MDH and SJW), and the growth rate of the maximally enlarged segment was determined. Determination of aortic valve morphology was made by echocardiography and/or MRI, and qualitative characterization of AsAo flow patterns was made by previously reported criteria (MDH) (5). Patients were excluded from the study if they 1) did not have an echocardiogram or had insufficient evaluation of the aortic valve, 2) had congenital heart disease other than successfully repaired aortic coarctation or 3) had poor quality 4D Flow datasets. The HIPAA compliant protocol received institutional review board approval, and informed consent was obtained in all cases.
MR Imaging Technique
The 4D Flow technique employed has been previously validated (15). Briefly, measurements were performed on a 1.5T system (Signa CV/i, GE, Milwaukee, WI, Gmax = 40 mT/m, rise time = 268 μsec) using an RF-spoiled gradient echo pulse sequence and an oblique-sagittal slab encompassing the thoracic aorta. Scans were performed with an 8-channel cardiac coil, respiratory compensation, retrospective ECG gating and the following imaging parameters: VENC = 160–250 cm/s, fractional FOV= (300 × 270) mm2, slab thickness = 78 mm, matrix = (256 × 192 × 30), spatial resolution = (1.17 × 1.56 × 2.60) mm3, temporal resolution = 74–77 ms. Parallel imaging (GRAPPA) with an acceleration factor of 2 was used. 735 heartbeats were required for data acquisition, resulting in scan times of 8 to 15 minutes. 4D Flow was performed after standard cardiac MRI protocols in all patients. Data were corrected for Maxwell phase effects, encoding errors due to the gradient field distortions, phase wraps and effects from eddy currents (16–18).
Data Collection and Analysis
Corrected velocity data were imported into 3D visualization software (EnSight, CEI, Inc. Apex, NC). For each patient, a cross-sectional plane was placed at the ascending aorta just distal to the sinotubular junction separately by two blinded observers (Observerplanes#1 and Observerplanes#2; both radiologists with a combined 11 years experience with cardiovascular imaging; MDH and SJW) (19). The planes, complete with embedded velocity and magnitude data, were exported for quantitative analysis of hemodynamic markers (Figure 1). The contours of the aortic lumen were the segmented independently by two separate blinded observers (Observercontours#1 and Observercontours#2; both cardiovascular imaging researchers with a combined 10 years experience; MS and PD) using proprietary software (flow tool) for WSS estimation (20). Segmentation was performed at peak systole as defined by the peak of the flow versus time curve, and on the two adjacent images (i.e., the frame pre- and post-peak systole). Maximum and minimum WSS at both peak systole and averaged for the three time-points, as well as mean WSS at peak systole, were calculated using these segmentations. Note that maximum WSS measurements were taken from the right-anterior quadrant where prior studies have shown the highest values in patients with BAV (5,6). Subsequently, peak systolic velocity and normalized flow displacement from the vessel center were calculated in Matlab (The MathWorks Inc, Natick, MA) using the same segmentation. Normalized flow displacement is a recently developed parameter to quantify flow eccentricity (12), and is defined as the distance between the center of the lumen and the “center of velocity” of the forward flow, which is then normalized to the lumen diameter (Figure 1).
Figure 1.

Example case demonstrating how cross-sectional planes of data were exported and then segmented for quantitative analysis. An isosurface of the thoracic aorta is provided on the left to show the location of the planes selected independently by two observers (one in red, the other in yellow). Each plane was then independently segmented by two separate observers for quantification of MRI blood hemodynamic markers (one contour in purple, the other in green). Normalized flow displacement from the vessel center (blue circle) is depicted for each of the planes.
Statistics
A Shapiro-Wilk test was used to test for a normal distribution of measurements. Pearson’s correlation was used to evaluate the inter-observer agreement. Bland Altman plots were used as well to assess agreement and to test for proportional bias. Linear regression was used to evaluate the correlation between the different hemodynamic markers and growth. A value of p < 0.05 was considered significant. All statistical analyses were performed using Intercooled Stata 10.0 (StataCorp LP, College Station, TX) and Matlab (The MathWorks Inc, Natick, MA).
Results
Patient Characteristics
The average time of follow-up was 4.3 ± 2.9 years. 13 patients had BAV (26.5 years old, range 17–43, 5 female, 3.5 ± 0.7 cm baseline aortic size) and 12 tricuspid aortic valve (TAV) controls (30.7 years old, range 17–64, 3 female, 3.4 ± 0.5 cm baseline aortic size). The patients with BAV were relatively free from significant aortic valve disease: only 3 had greater than mild stenosis, and one greater than mild insufficiency (21). All patients with BAV had fusion of the right and left aortic leaflets. None of the patients with TAV had valve disease. One patient was excluded because of poor 4D Flow data quality.
Reproducibility analysis
Inter-observer correlations with regards to plane selection and contour segmentation are reported for each hemodynamic marker in Tables 1 and 2. Correlations were better between the different contours than they were between the different planes exported. For the contours, correlation coefficients were 1.0 for maximum velocity, 0.97–0.98 for normalized displacement and 0.78–0.96 for the WSS parameters. For the planes, these correlation coefficients were lower: 0.90 for maximum velocity, 0.91–0.93 for normalized displacement and 0.47–0.85 for the WSS parameters.
Table 1.
Reproducibility analysis: inter-observer correlations (Pearson’s r) for plane placement.
| Maximum Velocity | MeanWSSsystole | MaxWSSsystole | MinWSSsystole | MaxWSSavg | MinWSSavg | Normalized Displacement | |
|---|---|---|---|---|---|---|---|
| Contours #1 | 0.90 | 0.71 | 0.67 | 0.47 | 0.74 | 0.71 | 0.91 |
| Contours #2 | 0.90 | 0.82 | 0.85 | 0.51 | 0.85 | 0.70 | 0.93 |
Table 2.
Reproducibility analysis: inter-observer correlations (Pearson’s r) for segmentation (i.e., contour drawing).
| Maximum Velocity | MeanWSSsystole | MaxWSSsystole | MinWSSsystole | MaxWSSavg | MinWSSavg | Normalized Displacement | |
|---|---|---|---|---|---|---|---|
| Planes #1 | 1.00 | 0.93 | 0.87 | 0.84 | 0.87 | 0.88 | 0.98 |
| Planes #2 | 1.00 | 0.96 | 0.91 | 0.81 | 0.90 | 0.78 | 0.97 |
We evaluated the agreement and proportional bias using Bland-Altman analysis. 36 plots were generated, and demonstrated good results with the 95% limits of agreement from −0.6 to 0.9 m/s for maximum velocity; from −0.467 to 0.357 N/m2 for mean WSSsystole; from −0.815 to 0.620 N/m2 for maximum WSSsystole; from −655.6 to 455 N/m2 for minimum WSSsystole; from −0.622 to 0.416 N/m2 for maximum WSSavg; from −0.499 to 0.284 N/m2 for minimum WSSavg; and from −0.1 to 0.1 for normalized displacement.
Growth Correlation
The growth rates of patients with BAV were significantly higher than those of TAV controls (0.8 versus 0.1 mm/yr, p-value = 0.004). Amongst patients with BAV, those with abnormal flow patterns demonstrated significantly higher growth rates than those with normal flow (1.0 versus 0.0 mm/yr, p-value = 0.02). Furthermore, patients with BAV demonstrating markedly eccentric flow exhibited more rapid growth than other patients with BAV (1.2 versus 0.3 mm/yr, p-value = 0.02).
The measured growth values and calculated normalized displacement values were not normally distributed. Because good to very good correlation was obtained between all observers (except for minimum WSS), the linear regression between growth and the hemodynamic markers was performed on values averaged between the 4 observations (Table 3). Normalized displacement demonstrated the best correlation with growth (r = 0.65, p < 0.001, Figure 2). Maximum velocity had a lower correlation (r = 0.35), but better than the WSS parameters (0.06–0.16). Maximum WSS, however, demonstrated reasonable correlation with normalized flow displacement (r = 0.5).
Table 3.
Correlation of MRI blood hemodynamic markers and aortic growth.
| Maximum Velocity | MeanWSSsystole | MaxWSSsystole | MinWSSsystole | MaxWSSavg | MinWSSavg | Normalized Displacement |
|---|---|---|---|---|---|---|
| 0.35 | 0.12 | 0.14 | 0.12 | 0.16 | 0.06 | 0.65* |
p < 0.001
Figure 2.
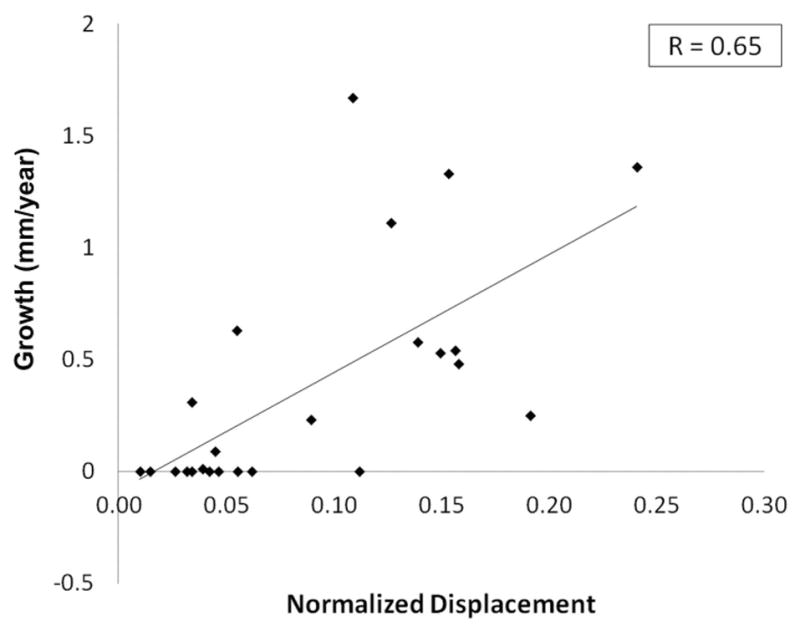
Plot of interval aortic growth versus normalized displacement. Note that the average of the 4 data points shown in Figure 1 was used for normalized displacement. A good correlation (r = 0.65, p < 0.001) was demonstrated, significantly higher than for any of the other MRI blood hemodynamic markers.
Discussion
We have demonstrated that for the assessment of systolic ascending aortic blood flow with MRI, peak velocity and flow displacement are very reproducible, and WSS parameters (including maximum, mean and minimum) are largely reproducible with the greatest variability at the data export stage of analysis (Tables 1 and 2, Figure 3). Our assessment focused on a homogeneous group of patients with BAV with the most common aortic leaflet fusion pattern (i.e., left-right fusion). Flow displacement best correlated with aortic growth, peak velocity was moderately correlated, but the WSS parameters did not correlate well with growth.
Figure 3.
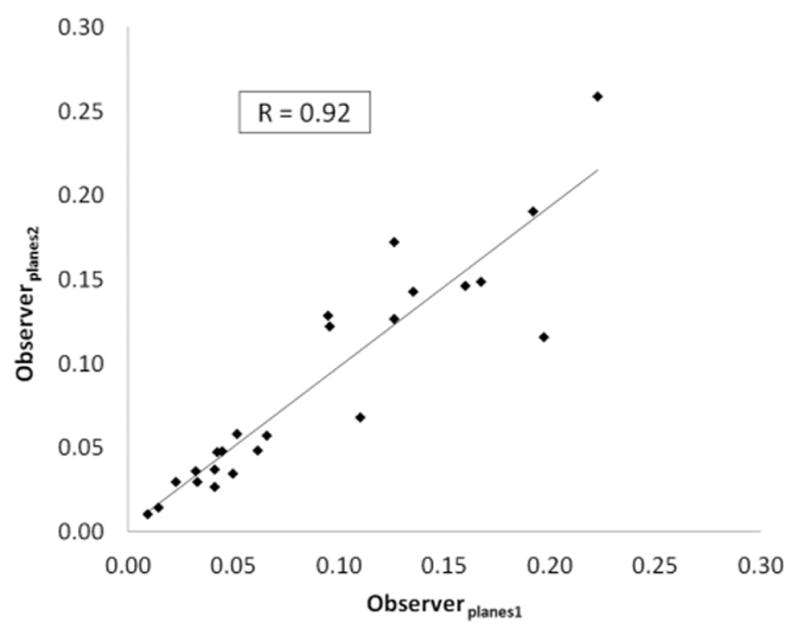
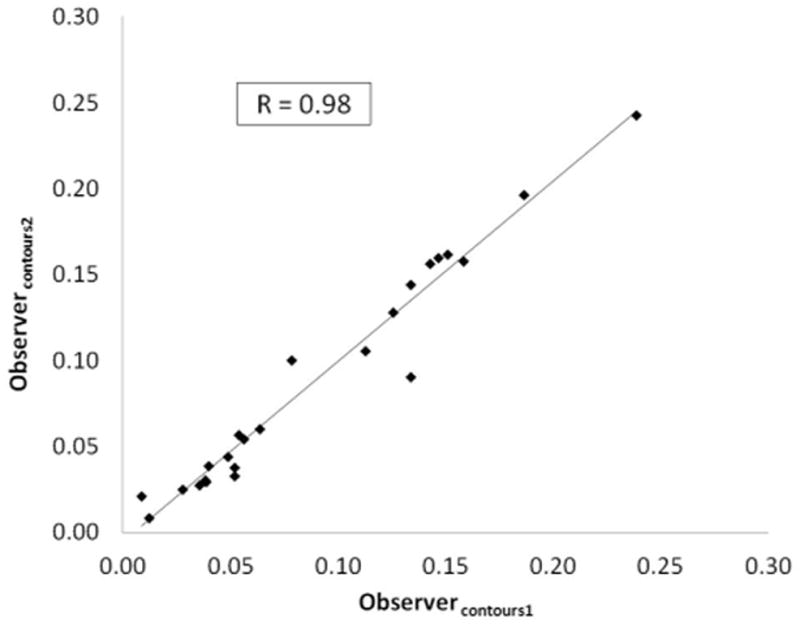
Reproducibility analysis for normalized displacement at the plane placement (3a) and segmentation (3b) stages.
We have performed redundant and blinded analysis at all important steps in our study to assess the reproducibility of a range of MRI hemodynamic markers. We believe that our data is unique among multidimensional MRI blood flow studies in this regard; we are unaware of any other study that has performed inter-observer reproducibility analysis both at the data export and then data segmentation steps in patients with aortic valve pathology (prior work has only addressed the segmentation step (22). We chose the imaging plane typically used for assessment of ascending aortic flow (19). Our results clearly show that reproducibility is better at the segmentation stage than at the plane exportation stage for all hemodynamic markers measured (Tables 1 and 2). Normalized flow displacement and peak systolic velocity are both very reproducible, but displacement demonstrates substantially better correlation with aortic growth (r = 0.65 versus r = 0.35). WSS is both less reproducible and exhibits only a weak correlation with growth at best.
Our data also indirectly address the issue of which imaging modality is required for flow analysis of valve-related aortic disease. Echocardiography is preferable because it is inexpensive, widely available and best captures peak systolic velocities due to its high temporal resolution. Yet it does not allow for the cross-sectional analysis and evaluation of multidimensional velocity data that is necessary for calculation of flow displacement. For this, MR blood flow imaging is needed. While our current study used 4D Flow datasets, the analysis we performed at a standard anatomic location with planes of 3D velocity data could be performed with conventional phase contrast imaging (i.e., with 2D planes rather than volumetric data). The potential advantage of the volumetric dataset may be the targeting of hemodynamic analysis to regions of maximum flow disturbance or eccentricity, which cannot be prospectively evaluated using routine 2D phase contrast methods.
The relationship of hemodynamics and disease progression in the ascending aorta has become a topic of growing interest with advances in MR blood flow imaging. Dynamic helical flow patterns have been visualized with BAV and linked to alterations in WSS as estimated by MRI (2,3,5,6). Recently, higher growth rates have been reported in patients with BAV and abnormal leaflet excursion and eccentric systolic flow (10,11). Patients with markedly eccentric flow demonstrate the most rapid growth. It might seem surprising that growth correlates better with normalized displacement than WSS. Supraphysiologic WSS has, after all, been linked to vessel wall injury and aneurysm formation through mechanisms including smooth muscle cell apoptosis and matrix breakdown (13,14,23,24). Yet, WSS is not well resolved by MRI for a number of reasons including limited spatial resolution and partial volume effects (20,25,26). Investigators have argued that despite this underestimation, gross differences in MR-measured WSS values between patient groups may be of value (5,6). However, recent assessment of MR-based WSS estimations using numerical simulations suggest otherwise. At spatial resolutions typical of aortic 4D Flow studies, high WSS values are not well resolved with MRI. In fact, estimated WSS becomes progressively worse with increasing true WSS values (27). Thus, the lack of significant correlation between WSS metrics and aortic growth may reflect the technical shortcomings of MR-based WSS estimates as discussed above, rather than the absence of a true correlation.
How can these observations that flow abnormalities appear to drive aortic growth in patients with BAV be reconciled with the body of evidence that supports the theory that an intrinsic wall abnormality predisposes to aneurysm with BAV (28)? A heritable, intrinsic vessel wall defect and a flow-mediated mechanism for aortic dilation with BAV need not be mutually exclusive. The former may weaken the aortic wall, and the latter focally exacerbate disease progression at specific locations. This would explain why BAV is associated with asymmetric aneurysms at the aortic convexity even without aortic stenosis (7–9), why only a subgroup of BAV patients have dilated aortas, and why right-left aortic leaflet fusion (seen in all of the patients in this study) is associated with rapid aortic dilation (29,30). Nevertheless, it should be noted that the present study did not directly address the issue of causation. Larger, prospective are needed to validate our findings.
The analysis we present, while specific to the most common aortic leaflet fusion pattern with BAV, is not limited to this fusion pattern or even congenital valvular abnormalities. Other studies have shown similar systolic flow abnormalities with other leaflet fusion patterns with BAV (31), stenotic tricuspid aortic valve (32), and after transcatheter aortic valve implantation (33), making the data we present potentially relevant to valve-related aortic disease in general. Other groups have extended similar analysis throughout the aorta and have targeted other pathologies, including aortic dissection (34).
In conclusion, we have studied a range of MRI hemodynamic markers and have found that normalized flow displacement is reproducible and best correlates with interval aortic growth rates in a cohort of patients with bicuspid aortic valves. We therefore believe that flow displacement should be used in future work aimed at identifying and risk-stratifying patients who are likely to develop clinically significant aortic disease based on MRI blood hemodynamic markers.
Acknowledgments
Funding Source
Radiologic Society of North America Research Scholar Grant 2012–2014, National Institutes of Health (grant NS059944), Veterans Affairs Merit Review Grant.
Abbreviations
- AsAo
ascending thoracic aorta
- BAV
bicuspid aortic valve
- TAV
tricuspid aortic valve
- MRI
magnetic resonance imaging
- 3D
three-dimensional
- 4D Flow
3D, time-resolved phase contrast MRI
- WSS
wall shear stress
Footnotes
Disclosures
No conflicts to disclose.
References
- 1.Robicsek F, Thubrikar MJ, Cook JW, Fowler B. The congenitally bicuspid aortic valve: how does it function? Why does it fail? Ann Thorac Surg. 2004;77(1):177–185. doi: 10.1016/s0003-4975(03)01249-9. [DOI] [PubMed] [Google Scholar]
- 2.Hope MD, Meadows AK, Hope TA, et al. Images in cardiovascular medicine. Evaluation of bicuspid aortic valve and aortic coarctation with 4D flow magnetic resonance imaging. Circulation. 2008;117(21):2818–2819. doi: 10.1161/CIRCULATIONAHA.107.760124. [DOI] [PubMed] [Google Scholar]
- 3.Hope MD, Hope TA, Meadows AK, et al. Bicuspid aortic valve: four-dimensional MR evaluation of ascending aortic systolic flow patterns. Radiology. 2010;255(1):53–61. doi: 10.1148/radiol.09091437. [DOI] [PubMed] [Google Scholar]
- 4.den Reijer PM, Sallee D, 3rd, van der Velden P, et al. Hemodynamic predictors of aortic dilatation in bicuspid aortic valve by velocity-encoded cardiovascular magnetic resonance. J Cardiovasc Magn Reson. 2010;12:4. doi: 10.1186/1532-429X-12-4. [DOI] [PMC free article] [PubMed] [Google Scholar]
- 5.Hope MD, Hope TA, Crook SE, et al. 4D flow CMR in assessment of valve-related ascending aortic disease. JACC Cardiovasc Imaging. 2011;4(7):781–787. doi: 10.1016/j.jcmg.2011.05.004. [DOI] [PubMed] [Google Scholar]
- 6.Barker AJ, Markl M, Burk J, et al. Bicuspid aortic valve is associated with altered wall shear stress in the ascending aorta. Circ Cardiovasc Imaging. 2012;5(4):457–466. doi: 10.1161/CIRCIMAGING.112.973370. [DOI] [PubMed] [Google Scholar]
- 7.Bauer M, Gliech V, Siniawski H, Hetzer R. Configuration of the ascending aorta in patients with bicuspid and tricuspid aortic valve disease undergoing aortic valve replacement with or without reduction aortoplasty. J Heart Valve Dis. 2006;15(5):594–600. [PubMed] [Google Scholar]
- 8.Cotrufo M, Della Corte A. The association of bicuspid aortic valve disease with asymmetric dilatation of the tubular ascending aorta: identification of a definite syndrome. J Cardiovasc Med (Hagerstown) 2009;10(4):291–297. doi: 10.2459/JCM.0b013e3283217e29. [DOI] [PubMed] [Google Scholar]
- 9.Lu MT, Thadani SR, Hope MD. Quantitative assessment of asymmetric aortic dilation with valve-related aortic disease. Acad Radiol. 2013;20(1):10–15. doi: 10.1016/j.acra.2012.07.012. [DOI] [PubMed] [Google Scholar]
- 10.Della Corte A, Bancone C, Conti CA, et al. Restricted cusp motion in right-left type of bicuspid aortic valves: A new risk marker for aortopathy. J Thorac Cardiovasc Surg. 2012 Aug;144(2):360–9. 369.e1. doi: 10.1016/j.jtcvs.2011.10.014. [DOI] [PubMed] [Google Scholar]
- 11.Hope MD, Wrenn SJ, Sigovan M, Foster E, Tseng E, Saloner D. Imaging Biomarkers of Aortic Disease: Increased growth rates with eccentric systolic flow. J Am Coll Cardiol. 2012 Jul 24;60(4):356–357. doi: 10.1016/j.jacc.2012.01.072. [DOI] [PubMed] [Google Scholar]
- 12.Sigovan M, Hope MD, Dyverfeldt P, Saloner D. Comparison of four-dimensional flow parameters for quantification of flow eccentricity in the ascending aorta. J Magn Reson Imaging. 2011;34(5):1226–1230. doi: 10.1002/jmri.22800. [DOI] [PubMed] [Google Scholar]
- 13.Malek AM, Alper SL, Izumo S. Hemodynamic shear stress and its role in atherosclerosis. JAMA. 1999;282(21):2035–2042. doi: 10.1001/jama.282.21.2035. [DOI] [PubMed] [Google Scholar]
- 14.Slager CJ, Wentzel JJ, Gijsen FJ, et al. The role of shear stress in the destabilization of vulnerable plaques and related therapeutic implications. Nat Clin Pract Cardiovasc Med. 2005;2(9):456–464. doi: 10.1038/ncpcardio0298. [DOI] [PubMed] [Google Scholar]
- 15.Markl M, Chan FP, Alley MT, et al. Time-resolved three-dimensional phase-contrast MRI. J Magn Reson Imaging. 2003;17(4):499–506. doi: 10.1002/jmri.10272. [DOI] [PubMed] [Google Scholar]
- 16.Walker PG, Cranney GB, Scheidegger MB, Waseleski G, Pohost GM, Yoganathan AP. Semiautomated method for noise reduction and background phase error correction in MR phase velocity data. J Magn Reson Imaging. 1993;3(3):521–530. doi: 10.1002/jmri.1880030315. [DOI] [PubMed] [Google Scholar]
- 17.Bernstein MA, Zhou XJ, Polzin JA, et al. Concomitant gradient terms in phase contrast MR: analysis and correction. Magn Reson Med. 1998;39(2):300–308. doi: 10.1002/mrm.1910390218. [DOI] [PubMed] [Google Scholar]
- 18.Markl M, Bammer R, Alley MT, et al. Generalized reconstruction of phase contrast MRI: analysis and correction of the effect of gradient field distortions. Magn Reson Med. 2003;50(4):791–801. doi: 10.1002/mrm.10582. [DOI] [PubMed] [Google Scholar]
- 19.Lotz J, Meier C, Leppert A, Galanski M. Cardiovascular flow measurement with phase-contrast MR imaging: basic facts and implementation. Radiographics. 2002;22(3):651–671. doi: 10.1148/radiographics.22.3.g02ma11651. [DOI] [PubMed] [Google Scholar]
- 20.Stalder AF, Russe MF, Frydrychowicz A, Bock J, Hennig J, Markl M. Quantitative 2D and 3D phase contrast MRI: optimized analysis of blood flow and vessel wall parameters. Magn Reson Med. 2008;60(5):1218–1231. doi: 10.1002/mrm.21778. [DOI] [PubMed] [Google Scholar]
- 21.Bonow RO, Carabello BA, Kanu C, et al. ACC/AHA 2006 guidelines for the management of patients with valvular heart disease: a report of the American College of Cardiology/American Heart Association Task Force on Practice Guidelines (writing committee to revise the 1998 Guidelines for the Management of Patients With Valvular Heart Disease): developed in collaboration with the Society of Cardiovascular Anesthesiologists: endorsed by the Society for Cardiovascular Angiography and Interventions and the Society of Thoracic Surgeons. Circulation. 2006;114(5):e84–231. doi: 10.1161/CIRCULATIONAHA.106.176857. [DOI] [PubMed] [Google Scholar]
- 22.Markl M, Wallis W, Harloff A. Reproducibility of flow and wall shear stress analysis using flow-sensitive four-dimensional MRI. J Magn Reson Imaging. 2011;33(4):988–994. doi: 10.1002/jmri.22519. [DOI] [PubMed] [Google Scholar]
- 23.Fry DL. Certain histological and chemical responses of the vascular interface to acutely induced mechanical stress in the aorta of the dog. Circ Res. 1969;24(1):93–108. doi: 10.1161/01.res.24.1.93. [DOI] [PubMed] [Google Scholar]
- 24.Dolan JM, Meng H, Singh S, Paluch R, Kolega J. High fluid shear stress and spatial shear stress gradients affect endothelial proliferation, survival, and alignment. Ann Biomed Eng. 2011;39(6):1620–1631. doi: 10.1007/s10439-011-0267-8. [DOI] [PMC free article] [PubMed] [Google Scholar]
- 25.Masaryk AM, Frayne R, Unal O, Krupinski E, Strother CM. In vitro and in vivo comparison of three MR measurement methods for calculating vascular shear stress in the internal carotid artery. AJNR Am J Neuroradiol. 1999;20(2):237–245. [PMC free article] [PubMed] [Google Scholar]
- 26.Wentzel JJ, Corti R, Fayad ZA, et al. Does shear stress modulate both plaque progression and regression in the thoracic aorta? Human study using serial magnetic resonance imaging. J Am Coll Cardiol. 2005;45(6):846–854. doi: 10.1016/j.jacc.2004.12.026. [DOI] [PubMed] [Google Scholar]
- 27.Petersson S, Dyverfeldt P, Ebbers T. Assessment of the accuracy of MRI wall shear stress estimation using numerical simulations. J Magn Reson Imaging. 2012 Jul;36(1):128–138. doi: 10.1002/jmri.23610. [DOI] [PubMed] [Google Scholar]
- 28.Tadros TM, Klein MD, Shapira OM. Ascending aortic dilatation associated with bicuspid aortic valve: pathophysiology, molecular biology, and clinical implications. Circulation. 2009;119(6):880–890. doi: 10.1161/CIRCULATIONAHA.108.795401. [DOI] [PubMed] [Google Scholar]
- 29.Nistri S, Sorbo MD, Marin M, Palisi M, Scognamiglio R, Thiene G. Aortic root dilatation in young men with normally functioning bicuspid aortic valves. Heart. 1999;82(1):19–22. doi: 10.1136/hrt.82.1.19. [DOI] [PMC free article] [PubMed] [Google Scholar]
- 30.Thanassoulis G, Yip JW, Filion K, et al. Retrospective study to identify predictors of the presence and rapid progression of aortic dilatation in patients with bicuspid aortic valves. Nat Clin Pract Cardiovasc Med. 2008;5(12):821–828. doi: 10.1038/ncpcardio1369. [DOI] [PubMed] [Google Scholar]
- 31.Bissell MM, Hess AT, Biasiolli L, et al. Aortic Dilation in Bicuspid Aortic Valve Disease: Flow Pattern Is a Major Contributor and Differs with Valve Fusion Type. Circ Cardiovasc Imaging. 2013 Jun 14; doi: 10.1161/CIRCIMAGING.113.000528. [DOI] [PMC free article] [PubMed] [Google Scholar]
- 32.Hope MD, Dyverfeldt P, Acevedo-Bolton G, et al. Post-stenotic dilation: evaluation of ascending aortic dilation with 4D flow MR imaging. Int J Cardiol. 2012;156(2):e40–42. doi: 10.1016/j.ijcard.2011.08.018. [DOI] [PubMed] [Google Scholar]
- 33.Markl M, Mikati I, Carr J, McCarthy P, Malaisrie SC. Three-dimensional blood flow alterations after transcatheter aortic valve implantation. Circulation. 2012;125(15):e573–575. doi: 10.1161/CIRCULATIONAHA.111.070086. [DOI] [PubMed] [Google Scholar]
- 34.Clough RE, Waltham Matthew, Giese Daniel, Taylor Peter R, Schaeffter Tobias. A new imaging method for assessment of aortic dissection using four-dimensional phase contrast magnetic resonance imaging. Journal of Vascular Surgery. 2012;55(4):914–923. doi: 10.1016/j.jvs.2011.11.005. [DOI] [PubMed] [Google Scholar]