ABSTRACT
The present study marks the first evaluation of combined application of the antioxidant N-acetylcysteine (NAC) and the free radical spin trap reagent, disodium 2,4-disulfophenyl-N-tert-butylnitrone (HPN-07), as a therapeutic approach for noise-induced hearing loss (NIHL). Pharmacokinetic studies and C-14 tracer experiments demonstrated that both compounds achieve high blood levels within 30 min after i.p injection, with sustained levels of radiolabeled cysteine (released from NAC) in the cochlea, brainstem, and auditory cortex for up to 48 h. Rats exposed to 115 dB octave-band noise (10–20 kHz) for 1 h were treated with combined NAC/HPN-07 beginning 1 h after noise exposure and for two consecutive days. Auditory brainstem responses (ABR) showed that treatment substantially reduced the degree of threshold shift across all test frequencies (2–16 kHz), beginning at 24 h after noise exposure and continuing for up to 21 days. Reduced distortion product otoacoustic emission (DPOAE) level shifts were also detected at 7 and 21 days following noise exposure in treated animals. Noise-induced hair cell (HC) loss, which was localized to the basal half of the cochlea, was reduced in treated animals by 85 and 64 % in the outer and inner HC regions, respectively. Treatment also significantly reduced an increase in c-fos-positive neuronal cells in the cochlear nucleus following noise exposure. However, no detectable spiral ganglion neuron loss was observed after noise exposure. The results reported herein demonstrate that the NAC/HPN-07 combination is a promising pharmacological treatment of NIHL that reduces both temporary and permanent threshold shifts after intense noise exposure and acts to protect cochlear sensory cells, and potentially afferent neurites, from the damaging effects of acoustic trauma. In addition, the drugs were shown to reduce aberrant activation of neurons in the central auditory regions of the brain following noise exposure. It is likely that the protective mechanisms are related to preservation of structural components of the cochlea and blocking the activation of immediate early genes in the auditory centers of the brain.
Keywords: acoustic trauma, cochlea, hair cell, brainstem, HPN-07, N-acetylcysteine, antioxidant
INTRODUCTION
It is estimated that 26 million Americans between the ages of 20 and 69 have significant sensorineural hearing loss that is likely the result of loud noise exposure (NIDCD 2008). The mechanisms of noise-induced hearing loss (NIHL) can be classified into two main categories: (1) direct mechanical trauma (Hamernik et al. 1984) and (2) indirect metabolic damage to the cellular components of the inner ear (Ohlemiller et al. 2000; Van Campen et al. 2002; Coling et al. 2003) due to excessive formation of reactive oxygen species (ROS), reactive nitrogen species, and other free radical species (Fetoni et al. 2013; Ohinata et al. 2003; Yamashita et al. 2004; Henderson et al. 2006; Puel et al. 1996, 1998; Lamm and Arnold 2000; Miller et al. 2003; Saunders et al. 1985; Hu et al. 2000, 2002). ROS directly damage cell structures by reacting with proteins, lipids, and DNA and also act as signaling molecules that upregulate genes responsible for apoptosis. Accordingly, a great deal of research has been dedicated to discover antioxidant compounds that can neutralize highly reactive oxygen species to prevent and/or treat damage to the cochlea (Hu et al. 1997; Hight et al. 2003; Seidman et al. 1993; Yamasoba et al. 1999; Ohinata et al. 2000a, b; Kopke et al. 2000, 2002). N-acetylcysteine (NAC) is a thiol-containing amino acid derivative that acts as a ROS scavenger and a substrate for glutathione production, the major endogenous antioxidant produced by cells. NAC has been shown to reduce NIHL in animal models (Kopke et al. 2000; Lorito et al. 2008; Fetoni et al. 2009; Mortazavi et al. 2010) and correlates of noise-induced cochlear injury in clinical trials (Lin et al. 2010; Lindblad et al. 2011). When NAC was combined with a nitrone-based spin trapping agent of free radical species, 4-OHPBN, a synergistic effect was observed between the two compounds on reducing acute acoustic trauma (Choi et al. 2008). In this study, a structural analog of 4-OHPBN, disodium 2,4-disulfophenyl-N-tert-butylnitrone (HPN-07, previously called NXY-059), was used in combination with NAC. HPN-07 has been shown to be (1) a better neuroprotectant than 4-OHPBN (Kuroda et al. 1999; Sydserff et al. 2002; Hainsworth et al. 2008; Clausen et al. 2008), (2) effective in treating acute acoustic trauma in chinchilla (unpublished data from our lab), and (3) low in toxicity in phase I, II, and III clinical trials for treatment of stroke (Lees et al. 2001; Green et al. 2003).
Previously, we have shown that NAC plus HPN-07 effectively reduced hearing loss and cochlear hair cell death in rats when administered after exposure to blast overpressure (Ewert et al. 2012; Du et al. 2013). In the current study, we examined the effects of the NAC/HPN-07 combination on rats exposed to loud noise, which has distinct physical properties from impulse or blast noise (Hamernik and Hsueh 1991; Hamernik et al. 1991). This study was designed to document the pharmacokinetics of NAC/HPN-07 delivery and their protective effects on hearing loss induced by intense noise and to explore mechanisms related to that protection, involving the cellular components of the cochlea and auditory centers of the brain.
METHODS
Experimental Design
The duration of experimental procedures following noise exposure was 21 days, during which changes in auditory function, histology, and neuronal protein expression in the cochlea and central auditory pathway were assessed. Rats were randomly assigned to five groups with 8–10 animals in each group, according to the observation times. Each group was further divided into two subgroups: one treated group and one vehicle control group. The treatment paradigm with NAC/HPN-07 was truncated from the full five dose regimen based on when the experiment was terminated as follows: (1) Rats in the 8-h group received one dose at 1 h after noise exposure; (2) Rats in the 24-h group received an initial dose at 1 h after exposure and another dose on the following day; (3) Rats in the 7-day and 21-day groups received the full five doses with an initial dose at 1 h after exposure and two doses on each of the following 2 days. Hearing loss was characterized by auditory brainstem responses (ABR) threshold shifts (TS) and distortion product otoacoustic emission (DPOAE) level shifts (LS) at 3–5 days before noise exposure and 8 h, 24 h, 7 days, or 21 days after noise exposure. Following the final post-exposure recording session, the animal was euthanized under deep anesthesia and was intracardially perfused for collection of cochlear and brain tissue for immunohistochemical analyses. Separate groups of rats were used for pharmacokinetic and biodistribution studies.
Animals
Male Long–Evans pigmented rats weighing between 310 and 340 g (Harlan Laboratories, Indianapolis, IN) were used in noise exposure experiments and pharmacokinetic studies of serum levels of HPN-07 and total free cysteine, and the Sprague–Dawley rat (CD strain) from Charles River, Wilmington, MA was used for the tissue distribution study. The rats were housed in the Oklahoma Medical Research Foundation (OMRF) animal care facility, which is AAALAC accredited. All of the animals were evaluated by the attending veterinarian upon arrival and were monitored on a daily basis by a trained staff of laboratory animal technicians. The animals were maintained on a normal day/night cycle at 21 °C with free access to food (Purina lab diet, Purina Mills, Richmond, IN) and water and were provided a 1-week or more acclimation period prior to experimentation. All procedures regarding the use and handling of animals were reviewed and approved by the OMRF Institutional Animal Care and Use Committee and the United States Department of the Navy Bureau of Medicine and Surgery.
Noise Exposure
While under anesthesia (80–100 mg/kg, ketamine/9 mg/kg, xylazine), 10–11-week-old Long–Evans rats were subjected to an octave band noise (OBN) of 10–20 kHz at a root-mean square level of 115 dB sound pressure level (SPL) for 1 h in a soundproof testing booth. These conditions were selected to achieve an initial 50–70 dB TS based on preliminary tests. The OBN with a 12-dB per octave roll-off was digitally generated using a Tucker-Davis Technology (TDT) RP2.1 Enhanced Real-time Processor (TDT, Inc., Alachua, FL) in conjunction with TDT RPvdsEx software 5.4, which was amplified using a QSC PLX-3402 Power Amplifier (QSC Audio Products Inc., Costa Mesa, CA). The resulting OBN was presented via two matched speakers (Vifa D25AG-05-06, Videbaek, Denmark) located 10 cm over the animal’s head in the horizontal plane. The animal was oriented so that its head faced the mid-line between the two speakers. Noise intensity was measured and monitored near the rat’s pinnae using a B&K Type 4133 1/2-inch microphone connected to a B&K Type 2619 preamplifier working with a B&K Type 3560-L PULSE Lite pocket analyzer.
Drug Administration
NAC was purchased as a 20 % solution from Hospira, Inc. (Lake Forest, IL). HPN-07 was synthesized and provided at greater than 98.5 % purity by APAC Pharmaceuticals LLC (Columbia, MD). A mixture of both drugs was prepared in saline to give a final concentration of 60 mg/mL for each drug. The drug mixture was delivered intraperitoneally (i.p.) at 5 mL/kg, resulting in a dose of 300 mg/kg that was administered 1 h after noise exposure and then twice daily for the following 2 days. Rats in the vehicle control group were injected i.p. with saline at 5 mL/kg, according to the same schedule as the treated group. This dosing regimen was based on previous published studies from our laboratory (Choi et al. 2008, 2011; Du et al. 2012; Ewert et al. 2012).
Quantification of Rat Plasma HPN-07 and Total Free Cysteine Levels
Following i.p. injection of HPN-07 and NAC at 300 mg/kg each, blood was collected at timed intervals from a jugular cannula in heparin-containing syringes. Plasma was fractionated from blood cells by centrifugation at 2,000 × g for 10 min. Fractionated blood plasma from each sample was divided into 50 μL aliquots and immediately placed on dry ice prior to long-term storage at −80 °C. Estimated concentrations of HPN-07 and total free cysteine in blood plasma were determined utilizing high-pressure liquid chromatography (HPLC). For HPN-07, plasma protein in a 50-μL aliquot of plasma was precipitated with a 10-fold volume of ice-cold methanol on ice for 10 min. The insoluble material was pelleted at 14,000 × g for 20 min at 4 °C. The supernatant was removed, and the solvent was evacuated by centrifugal evaporation at 35–40 °C. Dried samples were reconstituted in 200 μL methanol/H2O (1/9, v/v), vortexed, and filtered through a 10,000-Da molecular weight cutoff filter (Ultracel-10 K Membrane, Millipore) by centrifugation at 14,000 × g for 90 min, using an Eppendorf microcentrifuge. The filtrates were then dehydrated by centrifugal evaporation and reconstituted in 60 μL of 100 mM NaH2PO4 buffer (pH 7.0). Reconstituted samples were subjected to isocratic HPLC analysis on a Shimadzu LC20AD pump system connected to a Shimadzu SPD-20A UV–VIS detector (Shimadzu America, Columbia, MD). The samples (in vials) were delivered with a Shimadzu SIL-10AF automatic sample injector and analyzed on an ACE 5 C-8 base-deactivated column (5 μm, 150 × 4.6 mm i.d., MAC-MOD, Chadds Ford, PA) in-line with a C-8 base-deactivated guard column (MAC-MOD). The mobile phase was 6 % acetonitrile, 94 % potassium phosphate (KH2PO4) buffer (40 mM, pH 7.0). HPN-07 levels were measured using UV detection monitored continuously at 297 nm. These conditions consistently yielded a clean, sharp HPN-07 peak that eluted at approximately 12 min post-column injection. Standards of known HPN-07 concentration were prepared in diluent solution (NaH2PO4 buffer) and subjected to isocratic HPLC analysis in parallel with extracted plasma samples for each analytical run. The peak area values for the HPN-07 peak measured for each standard solution were graphed, and the resultant standard curves were used to estimate the concentration of HPN-07 within the extracted plasma samples.
When administered intraperitoneally, NAC undergoes rapid and extensive deacetylation into either free cysteine or cysteine-thiol metabolites (Yao et al. 1994). As the antioxidant capacity of NAC is primarily mediated through its ability to act as a prodrug for cysteine, we analyzed total free cysteine (tCys) levels in blood plasma as a function of time following i.p. administration of combinatorial antioxidant treatment. According to the method developed by Amarnath et al. (2003). Briefly, 50 μL of blood plasma was reduced in the presence of 5 mM tris(2-carboxyethyl)phosphine and then derivatized upon reacting with excess (7 mM) 1,1′-thiocarbonyldiimidazole (TCDI, Sigma) under basic conditions to obtain the stable cyclic product 2-thioxothiazolidine-4-carboxylic acid (TTCA), which exhibits intense UV absorption. Prior to derivatization, each sample was supplemented with 25 μL of a 400-μM stock of 2-methylcysteine as an internal standard, which is not found within biological samples and reacts with TCDI to form a stable cyclic product, MeTTCA. The cyclic derivatives of cysteine and methylcysteine were fractionated from plasma contaminants by solid phase extraction under acidic conditions over disposable OasisMAX cartridges (Waters Corp., Milford, MA) and then quantified by measuring their absorbance at 272 nm with the in-line Shimadzu SPD-20A UV detector described above following their chromatographic resolution on a MAC-MOD ACE 5 C+8 base-deactivated column (mobile phase of 7.5 % acetonitrile, 1 % acetic acid). Quantification of tCys in each sample was performed using a HPLC calibration curve developed with the appropriate TCDI-derivatized L-cysteine standards.
Measurement of Total Antioxidant Capacity of Blood Plasma
Plasma from each rat was collected and stored as described above for the HPN-07 and NAC plasma concentration analyses. The total antioxidant capacity (TAC) of each plasma sample was determined using the OxiSelect Total Antioxidant Capacity kit from Cell Biolabs (San Diego, CA), according to the manufacturer’s instructions. Briefly, a 5-μL aliquot of plasma was diluted with 15 μL of phosphate-buffered saline (PBS, pH 7.4) and mixed with 180 μL of the chromagenic reaction buffer in a standard 96-well plate. An initial absorbance value was measured with a Bio-Rad model 680 microplate reader with Microplate Manager 5.2 software (Bio-Rad) for each sample at 490 nm. To this mixture, 50 μL of the Cu2+ solution, which is reduced to Cu + in accordance with the antioxidant capacity of the sample, was added to each well. After a 3-min incubation period at room temperature, 50 μL of an EDTA-containing “stop” solution was added to each well, and the amount of stable product formed from the reduced copper ion and the chromagenic reagent was measured at its optimal absorbance of 490 nm. The TAC level of each plasma sample was quantified by subtracting the initial 490 nm reading from the final reading for each sample, and TAC values for replicate samples were estimated by comparative analysis to a standard curve of known uric acid concentrations. The resultant values (in millimolar uric acid equivalents) were then multiplied by 2,189 in order to convert the values into copper reducing equivalents (1 mM uric acid = 2,189 μM copper reducing equivalents).
Tissue Distribution of Radiolabeled N-Acetylcysteine
Male and female Sprague–Dawley rats (8–9 days old, Charles River, Wilmington, MA), weighing between 230 and 300 g, were used. Two rats of each sex were used per time point. The time points for the experiment were 1, 4, 8, 24, and 48 h. [1-14C]-N-acetylcysteine was synthesized and provided as a solid with a specific activity of 54.3 mCi/mmol (Moravek Biochemicals, Brea, CA). Unlabeled N-acetylcysteine was obtained as a 20 % solution in EDTA (Hospira, Lake Forest, IL). Rats were injected i.p. with 100 mg/kg body weight NAC to which 40 μCi of [14C]-NAC was added. Tissue samples of approximately 100 mg collected from the auditory cortex and brain stem were dissected and weighed accurately. Cochleae from each rat were dissected by opening the bulla and trimming the bones around the cochlea and weighed. Brain samples were incubated in glass scintillation vials with 2 mL Solvable (Perkin-Elmer) at 56 °C overnight. Decolorization of the samples was accomplished by two sequential additions of 100 μL of 30 % hydrogen peroxide, with time between additions for foaming to subside. The vials were incubated at 56 °C for at least 1 h. After cooling to room temperature, 10 mL of Hionic Fluor scintillation cocktail (PerkinElmer) was added to each vial. Cochlear samples were incubated with 1 mL of 6 N hydrochloric acid at 56 °C overnight. One milliliter of 6 N potassium hydroxide was used to neutralize the acid, and 20 mL of Hionic Fluor was dispensed into each vial. Liquid scintillation counting was performed with a Packard TriCarb 2900 LSC unit programmed to determine 14C DPM for labeled samples.
Auditory Brainstem Responses
ABR testing was conducted in a sound-attenuated, electrically shielded booth at 3–5 days prior to noise exposure and 8 h, 24 h, 7 days, and 21 days after noise exposure. Prior to testing, rats were anesthetized with an intramuscular injection of 50 mg/kg of ketamine and 6 mg/kg of xylazine. Throughout the duration of the testing, supplemental injections of anesthetic agents were provided at approximately half the induction dose to maintain sedation. While under anesthesia, an animal was placed on a heating pad, the temperature of which was monitored with a rectal thermistor probe and automatically maintained at 37 °C by a FHC temperature controller (FHC-40908, FHC, Bowdoinham, ME). The stimulus presentation, ABR acquisition, equipment control, and data management were coordinated using a computerized Intelligent Hearing Systems (IHS) SmartEP, running IHS USBez software 3.96. ABRs were recorded using three stainless steel needle electrodes (M019258, IHS, Miami, FL) placed sub-dermally over the vertex (non-inverting electrode) and the ipsilateral and contralateral mastoids (inverting and ground electrodes) of the animal. The biological signals were amplified 100,000 times and band-pass filtered between 100 and 3,000 Hz with an artifact rejection level of 15–20 μV. The amplified responses were averaged and displayed on the computer screen with a recording epoch of 10 ms following stimulus onset. Acoustic stimuli were generated by the PC-based IHS and were presented via two IHS high-frequency transducers (M014600, IHS, Miami, FL), the ends of which were fitted with rubber tips that could allow for the stimuli to be delivered into the sealed ear canal. The sound stimuli were trapezoidal pips with rise–fall times of 0.5 ms and plateaus of 5 ms at frequencies of 2, 4, 8, and 16 kHz. Sound intensities, starting at 100 dB SPL, were reduced in 10 dB steps to near-threshold levels and then in 5 dB steps (up and down) to identify threshold. ABR threshold, tested separately for each ear, was defined as the lowest decibel level of stimulation, at which peak 2 of the ABR waveform could be positively recognized from two consecutive ABR trials. Each ABR trial represented the average response to 256 stimulus presentations at a rate of 11/s. ABR TSs were calculated by subtracting pre-exposure from post-exposure thresholds. A maximum intensity of 100 dB SPL was employed. Rats that were unresponsive at this level were assigned a threshold of 110 dB SPL. In addition to ABR thresholds, the peak-to-peak amplitudes of wave I responses at suprathreshold stimulus intensities were measured for analysis of ABR amplitude input–output functions. At a given test frequency, both pre- and post-exposure amplitudes measured at 40–100 dB SPL for each animal were normalized to the maximum pre-exposure amplitude that respond to the highest stimulus intensity (100 dB SPL). The normalization process was on an animal-by-animal basis.
Distortion Product Otoacoustic Emissions
DPOAE testing was conducted on the same schedule and in the same booth used for ABR testing, and rats were prepared for the procedure as described above for the ABR measurements. Using an IHS SmartOAE system with IHS USBez software 4.54, DPOAEs were recorded via an Etymotic ER-10B + microphone contained in a single ear probe unit that was sealed securely within the outer ear canal via a small soft rubber tip. The ear probe was connected though two small-bore tubes to the two IHS high-frequency transducers emitting pure-tone stimulation. Cubic 2f1-f2 DPOAEs were measured within the outer ear canal when primary tones f1 and f2, with a frequency ratio of f2 / f1 = 1.22, were presented to the ipsilateral ear at L1 = 70 and L2 = 60 dB SPL. DPOAE levels, as amplitudes expressed in decibel, were defined as the signal-to-noise ratio of the 2f1–f2 distortion product. The surrounding noise was defined as the average of the 10 neighboring frequencies (five above and five below the 2f1–f2 distortion product). The distortion product was the average response of 50 stimulus pair presentations. DPOAE audiograms (DP-gram) were measured with a resolution of five points per octave in the f2 frequency range of 2–16 kHz (the upper limit of our instrumentation). DPOAE LSs were calculated by subtracting the post-exposure from the pre-exposure levels. Rats that failed to elicit DPOAEs after noise trauma were assigned a level of 0 dB.
Histological Examination
Rats were euthanized with Euthasol solution (Virbac AH, Inc., Fort Worth, Texas) under deep anesthesia following the final recording session. Cardiac perfusion was performed with normal saline followed by the fixative 4 % paraformaldehyde in 0.1 M PBS, pH 7.2. Immediately following perfusion, the cochleae and brain were removed and post-fixed in the same fixative at 4 °C either overnight or 1 week, respectively, before they were transferred to 0.1 M PBS buffer until they were dissected. The right cochlea from each animal was used for microdissection and hair cell counting. Cochlear microdissection was accomplished under a light dissecting microscope. After permeabilization with 0.3 % Triton X-100 in PBS for 10 min, the organ of Corti (OC) was incubated with a 5 μg/mL solution of phalloidin conjugated to tetramethylrhodamine isothiocyanate (Sigma, St. Louis, MO) at room temperature for 30 min in the dark. Each OC specimen was then flat mounted in an anti-fade medium on glass slides and was examined under a fluorescence microscope (Olympus BX51, Melville, NY) with × 40 magnification. The number of missing hair cells was counted from the apex to the base in 500 μm segments and plotted as cytocochleograms with the corresponding frequencies represented along the basilar membrane (Muller 1991). Hair cells were counted as missing if stereocilia and cuticular plates were absent (Pirvola et al. 2000). The brainstem was dissected out, paraffin-embedded, and sectioned in a coronal plane at a thickness of 6 μm, and every 10th section was mounted on a slide (total of 10 slides). For c-fos immunohistochemical staining, brainstem sections were deparaffinized, washed with PBS, and blocked in PBS plus 0.2 % Triton X-100 (PBS/T) containing 1 % bovine serum albumin (fraction V) and 1 % normal goat serum. After rinsing with PBS/T, the sections were incubated with rabbit anti-c-fos IgG (1:100, Santa Cruz, Inc.) overnight. After PBS/T washing, biotinylated anti-rabbit IgG (1:200, Vector Laboratories, Inc. Burlingame, CA) was applied to the sections for 1 h at room temperature, and Vectastain ABC and DAB kits (Vector Laboratories, Inc. Burlingame, CA) were then used for the immunolabeling visualization. Immuno-positive cells exhibited a dark brown reaction product. Methyl green was used for nuclear counter staining. A set of sections (adjacent sections to those used in the immunostaining) were subjected to Nissl staining to verify the histology of the dorsal cochlear nucleus (DCN) and the ventral cochlear nucleus (VCN), using a rat brain atlas (Paxinos and Watson 2007). Representative images were collected from lateral, middle, and medial regions of the DCN and the VCN (Du et al. 2012), and the number of c-fos positive cells was counted using Image J software from the US National Institutes of Health (NIH). The DCN was treated as three separate regions while the anterior VCN (AVCN) and posterior VCN (PVCN) were each treated as one, since the DCN shows c-fos tonotopic distribution after noise exposure, while AVCN and PVCN do not (Brown and Liu 1995; Ehret and Fischer 1991; Sato et al. 1993). The left cochlea from each animal was decalcified in 10 % EDTA for about 2 weeks. After decalcification, the cochleae were processed for paraffin embedding and sectioning in a paramodiolar plane at a thickness of 6 μm, and every 10th section was mounted on a slide (total of 10 slides). Toluidine blue staining was conducted (Nagase et al. 2003). Images were taken from spiral ganglion cells in the basal (B), lower middle (LM), and upper middle (UM) turns in five to six mid-modiolar sections using a microscope (Olympus BX51, Melville, NY). The number of neurons in spiral ganglia was counted, and the size of spiral ganglion cells was measured using ImageJ software (NIH). Spiral ganglion neuron density was calculated and statistically analyzed.
Statistical Analyses
Means ± standard errors of the mean (SEM) were calculated for all parameters measured. Statistical significance calculations of differences in ABR thresholds/amplitudes, DPOAE amplitudes, and hair cell counts between groups were performed by two-way analysis of variance (ANOVA). Statistical significance assessment of group differences in the c-fos expression and spiral ganglion neuron density was performed using one-way ANOVA. When significant differences were found within the overall analysis, further post hoc comparisons were conducted using a Bonferroni or Tukey’s test. A p value of <0.05 was considered significant. Statistical analyses were conducted using the commercially available software suite GraphPad Prism 4 (GraphPad Software, Inc., La Jolla, CA).
RESULTS
Pharmacokinetics
The time course kinetics of plasma HPN-07 and tCys concentrations in blood following a single i.p. injection of 300 mg/kg HPN-07 and 300 mg/kg NAC was determined over a period of 8 h. The plasma levels of both HPN-07 and tCys were characterized by a uniform response pattern (i.e., low animal-to-animal variability) with very similar plasma concentration estimates of HPN-07 and tCys over the selected time course. Prior to drug administration, the average baseline concentration of tCys was 31.3 ± 3.7 μg/mL (258.4 ± 30.4 μM), a value consistent with previous reports of endogenous total cysteine levels in rat plasma (Elshorbagy et al. 2011; Otani et al. 2011). Average plasma concentrations of HPN-07 and tCys reached 397.9 ± 36 and 62.8 ± 4.4 μg/mL, respectively, at 30 min post i.p. injection before declining to near baseline levels at 4 h post-administration (Fig. 1). It is possible that higher levels were achieved before the initial (30 min) sampling time point.
FIG. 1.
Plasma concentration of HPN-07 and total free cysteine versus time following i.p. injection of HPN-07 and NAC in rats. Plasma concentrations (in microgram per milliliter) of HPN-07 (left axis) and total free cysteine (tCys, right axis) following a single i.p. injection of 300 mg/kg HPN-07 and 300 mg/kg NAC were measured by HPLC within samples collected over an 8-h period post-administration as described in the “METHODS” section. Mean values (±SD, n = 5) from each sample set were then plotted versus time. The pharmacokinetic analysis revealed a uniform response pattern within the experimental cohort (i.e., low animal-to-animal variability).
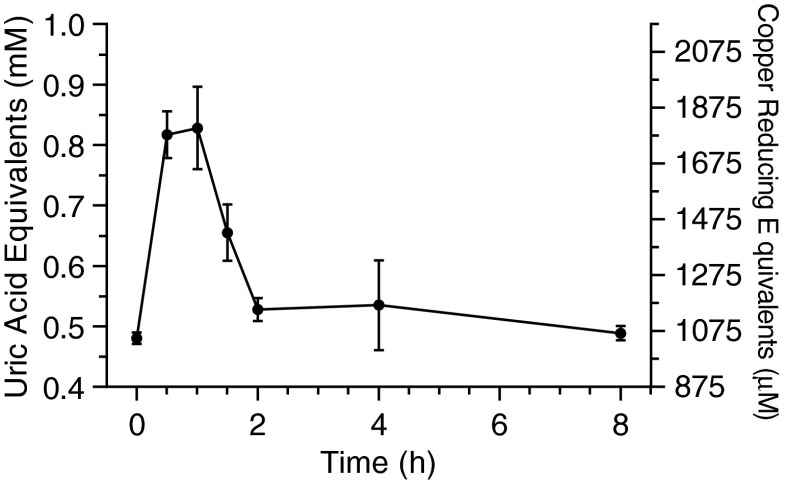
To provide a quantitative assessment of the systemic metabolic contributions from both primary and secondary effects of the drugs on the antioxidant status of the plasma from these animals, we then performed TAC analyses on samples collected at each time point post-administration. After an initial elevated plateau between 30 and 60 min, the total antioxidant capacity declined to baseline levels between 2 and 4 h after drug administration (Fig. 2), consistent with the observed changes in the plasma drug levels over this time course. These results demonstrate that the antioxidant status of plasma is highly responsive to the administration of HPN-07 and NAC yet rapidly normalizes to baseline conditions following an acute i.p. high dosage of HPN-07 and NAC, consistent with the stringent hepatic regulation of plasma antioxidant levels (Stipanuk et al. 2006).
FIG. 2.
Time-dependent profiling of rat plasma total antioxidant capacity (TAC) following i.p. injection of 300 mg/kg HPN-07 and 300 mg/kg NAC. Changes in plasma TAC were measured for each rat (n = 5) over the time course of the combinatorial HPN-07 and NAC pharmacokinetic analysis depicted in Figure 1. An initial elevated plateau was observed between 30 and 60 min and then declined to baseline levels between 2 and 4 h after drug administration. Mean TAC values (±SEM [error bars]) for each time point were plotted as either uric acid equivalents (left axis) or copper reducing equivalents (right axis).
To determine whether the robust, yet transient, increase in plasma antioxidant levels resulted in penetrance of drugs into target tissues, we measured the levels of radioisotope-labeled NAC in the cochleae, auditory cortex, and brainstem of rats following combinatorial administration of NAC and HPN-07. In the absence of a commercial source for radiolabeled HPN-07, 14C-labeled NAC was chosen as the reporter molecule for this analysis. Concentrations of 14C-labeled cysteine in the rat cochlea, auditory cortex, and brainstem reached 12.2 ± 1.0, 9.3 ± 1.9, and 10.8 ± 1.9 μg per wet weight (in grams) of tissue, respectively, at 1 h after administration of 100 mg/kg 14C-labeled NAC. These levels declined gradually, reaching 4.7 ± 1.7, 4.4 ± 1.5, and 5.5 ± 1.9 μg per wet weight of tissue, respectively, at 48 h post-administration.
ABR Threshold Shifts and ABR Wave I Amplitude Input–Output Functions
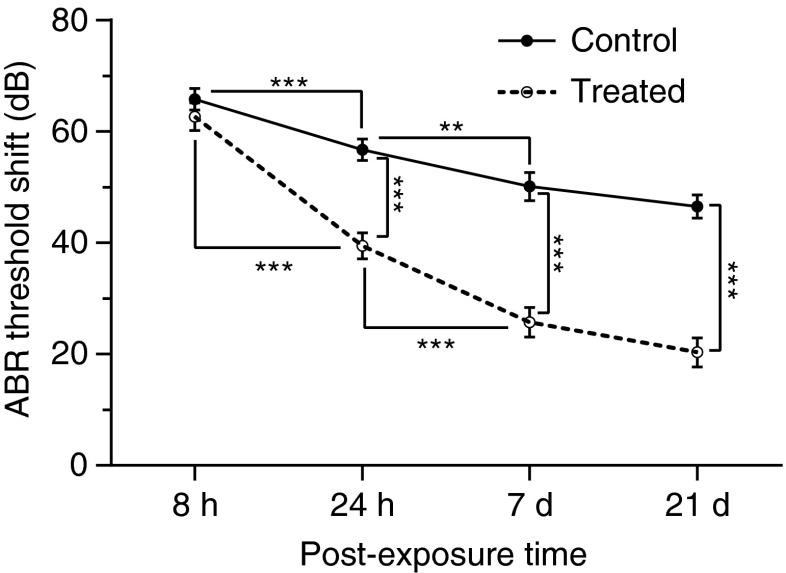
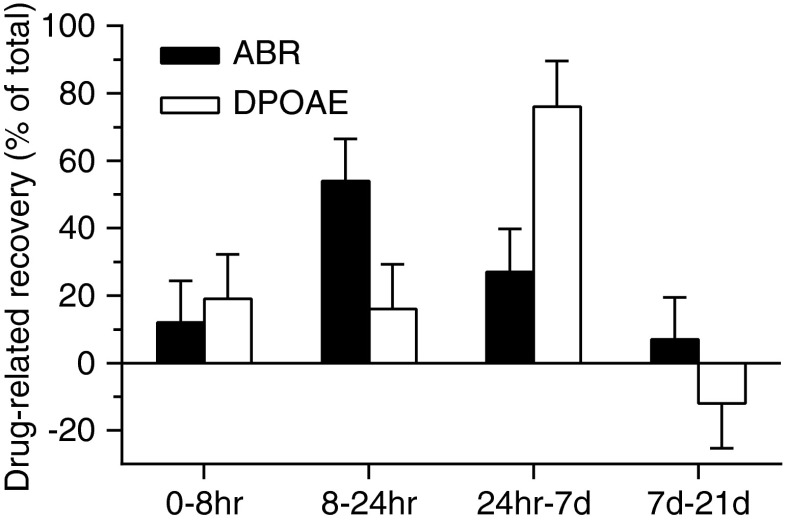
The average TS across 2–16 kHz measured 8 h, 24 h, 7 days, and 21 days after noise exposure is shown in Figure 3. A TS of approximately 65 dB was observed 8 h after noise exposure in the control group, and no significant difference was observed upon comparing antioxidant-treated and control animals at this time point (F(1, 136) = 1.54, p = 0.22), indicating that the same degree of initial hearing loss occurred in both groups of animals. In control groups, the initial TS had a partial recovery during the first 7 days following acoustic trauma (F(1, 136) = 19.8, p < 0.0001 for 8 vs. 24 h; F(1, 128) = 7.58, p = 0.007 for 24 h vs. 7 days) to reach a final elevation of approximately 50 dB. However, there was no further improvement over the remaining experimental period (F(1, 136) = 2.36, p = 0.13 for 7 vs. 21 days). Compared to controls, animals treated with NAC/HPN-07 showed a similar time course of functional recovery (F(1, 136) = 75.63, p < 0.0001 for 8 vs. 24 h; F(1, 136) = 24.36, p < 0.0001 for 24 h vs. 7 days; and F(1, 128) = 2.58, p = 0.11 for 7 vs. 21 days). However, the treated animals showed a significant improvement in the recovery of ABR thresholds relative to controls at each time point beginning at 24 h after noise exposure (F(1, 136) = 59.62, p < 0.0001 for 24 h; F(1, 128) = 67.05, p < 0.0001 for 7 days; and F(1, 136) = 91.33, p < 0.0001 for 21 days). When the average TS for the untreated group was subtracted from those of the treated group at each observation time, the resultant values were interpreted to represent the drug-related hearing improvement measured by ABRs. When the drug-related improvement for each testing interval was compared to the total improvement of 23 dB over the 21-day interval, it appears that most (66 %) of the therapeutic recovery occurred between 1 and 24 h after noise exposure, i.e., following either one or two doses of antioxidants (Fig. 4).
FIG. 3.
ABR threshold shifts (TS) averaged across 2–16 kHz as a function of time course. TS showed a similar maximal increase at 8 h after noise exposure in both treatment and control groups. As shown in the control groups, the TS gradually decreased over a 7-day period and then stabilized. Compared to controls, animals treated with NAC/HPN-07 showed a similar temporary TS at 8 h post-noise but a significant improvement in the recovery of TS from 24 h to 21 days. Data was combined for animals remaining in each group at the time of testing. The number of ears was: 18 (8 h), 18 (24 h), 16 (7 days), 20 (21 days). Data were analyzed using a two-way ANOVA with the Bonferroni test, **p < 0.01, ***p < 0.0001 and plotted as mean ± SEM.
FIG. 4.
Recovery of auditory function related to drug treatment after noise exposure. The average ABR and DPOAE values of the untreated noise-exposed group were subtracted from those of the treated group at each time point to give the values associated with the drug treatment. The changes in drug-related values between each observation time were divided by the total change between the 1-h and 21-day observation time points. The data show that the majority of the drug-related improvements measured by ABR threshold shifts occurred prior to those measured by DPOAE level shifts. Error bars represent standard error of the mean.
Figure 5 presents the ABR TS as a function of frequency for each observation time point. No significant difference between the untreated and treated groups was observed for any of the test frequencies at 8 h after noise exposure. In contrast, animals in the treated groups showed a significant decrease in TS for all the frequencies from 24 h to 21 days after noise exposure (p < 0.001 or 0.05) when compared to untreated controls. At 21 days after noise exposure, treated animals exhibited PTSs of 13 dB at 2 kHz, 13 dB at 4 kHz, 27 dB at 8 kHz, and 27 dB at 16 kHz, whereas the untreated animals exhibited PTSs of 29 dB at 2 kHz, 35 dB at 4 kHz, 59 dB at 8 kHz, and 61 dB at 16 kHz. This group difference indicates that administration of NAC/HPN-07 provided a 16–34-dB reduction in PTS against noise injury in the frequency range from 2 to 16 kHz. We did not observe a significant difference in TS between ABRs at 8 and 16 kHz in subjects exposed to the 10–20-kHz OBN that typically leads to greater TS values at 16 kHz than those at 8 kHz (Chen 2006). The possible reason would be the arbitrary ceiling value of ABR thresholds (i.e., 110 dB SPL) assigned to the subjects that were unresponsive at 100 dB SPL (see “METHODS” section). As a result, this practice would likely lead to an underestimation of the actual thresholds for the subjects that did not register ABRs under our experimental conditions, which is likely to be maximal for the 16-kHz ABRs as compared with the other test frequencies (i.e., 2, 4, and 8 kHz).
FIG. 5.
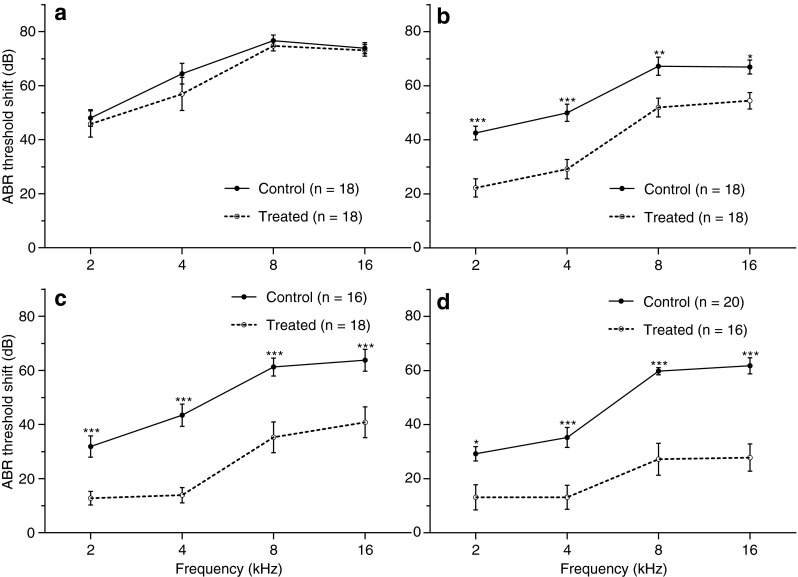
ABR threshold shifts (TS) observed following noise exposure at 8 h (A), 24 h (B), 7 days (C), and 21 days (D) across frequencies of 2–16 kHz. ABR TSs of antioxidant-treated animals were almost identical to those of controls at 8 h after noise exposure for all tested frequencies. From 24 h to 21 days, TSs in the treated groups were significantly lower than those in control groups at each tested frequency. Data are plotted as mean ± SEM. n represents the number of ears. Data were analyzed using a two-way ANOVA with the Bonferroni test, *p < 0.05, **p < 0.01, ***p < 0.001.
Figure 6 shows input–output curves of ABR wave I for the untreated and treated groups before and 21 days after noise exposure. By 21 days post-exposure, wave I amplitudes were significantly reduced in the noise-exposed untreated group for all four test frequencies (F(1, 170) = 147.8 for 2 kHz; F(1, 174) = 405.5 for 4 kHz; F(1, 106) = 1072 for 8 kHz; and F(1, 68) = 1768 for 16 kHz: all p < 0.0001), while in the antioxidant-treated group, wave I amplitudes were significantly reduced for the 4, 8, and 16 kHz stimuli (F(1, 198) = 39.94 for 4 kHz; F(1, 198) = 34.16 for 8 kHz; and F(1, 142) = 28.14 for 16 kHz: all p < 0.0001). The degree of amplitude reduction in both treated and untreated groups was more pronounced with increasing test frequencies from 2 to 16 kHz. This phenomenon correlating with the 10–20-kHz OBN trauma (i.e., the greatest reduction of hearing capacity near and basal to the trauma center frequency of 14 kHz). However, there was a statistically significant enhancement in amplitude at all test frequencies for the treated group compared with the untreated control group (F(1, 170) = 36.72 for 2 kHz; F(1, 170) = 50.52 for 4 kHz; F(1, 102) = 28.54 for 8 kHz; and F(1, 68) = 13.17 for 16 kHz: all p < 0.001), indicating that the NAC/HPN-07 treatment reduced the injurious effect of noise on the signal input of the auditory nerves to the cochlear nucleus.
FIG. 6.
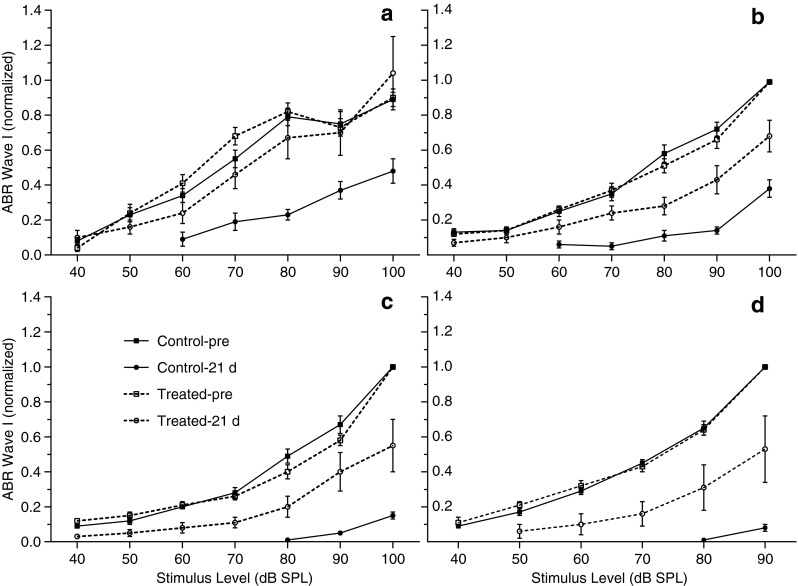
ABR input–output functions of wave I amplitude in the control (n = 20 ears) and treated groups (n = 16 ears) before (pre) and 21 days (21 d) after noise exposure for the 2-kHz (A), 4-kHz (B), 8-kHz (C), and 16-kHz stimuli (D). Data are plotted as mean ± SEM. For each test frequency, ABR wave I amplitudes (peak to peak) are normalized (on an animal-by-animal basis) as a fraction of the maximum pre-exposure amplitude. Although wave I amplitudes were significantly reduced after exposure in both control and treated groups, there was a statistically significant enhancement in amplitude at any test frequency for the treated group as compared with the untreated control group. At 2 kHz, the ABR recovery of treated animals was stimulus level dependent, with full recovery at 90–100 dB SPL and partial recovery at 40–80 dB SPL.
A stimulus level-dependent recovery of ABR wave I for the 2-kHz stimulus was observed in the treated group (Fig. 6A); that is, the wave I amplitudes at 90–100 dB SPL returned to pre-exposure values (F(1, 56) = 0.16, p > 0.05 for pre-exposure vs. 21 days), whereas the responses at 40–80 dB SPL only partially recovered (F(1, 146) = 8.01, p < 0.01 for pre-exposure vs. 21 days). The outer hair cells (OHC) are thought to be the main component of the cochlear amplifier for low level sounds (Ashmore 1987). The absence of the cochlear amplifier due to OHC loss or dysfunction is most likely responsible for the incomplete recovery of the wave I amplitudes in response to low-level sound stimuli that we observed in noise-damaged cochleae. Because the gain of the cochlear amplifier at high signal levels is much smaller than its gain at low signal levels and because the response of the cochlea is more linear at very high signal levels, the wave I response can maintain its normal amplitudes in response to high-level stimulation only when IHCs/cochlear nerves are functioning properly. Therefore, this level-dependent amplitude growth curve of the auditory nerve response at 2 kHz suggests that the IHCs and the related nerves, with a characteristic frequency (CF) of 2 kHz, were functioning properly despite noise-induced damage to the OHCs in this CF region (Chen et al. 2008). Here, the term “CF region” is used, to some degree, inexactly, although we intended to more specifically refer to the cochlear region in response to the 2-kHz stimulus with higher intensities, which would likely activate a larger portion of the cochlear partition, extending basally beyond the location of maximum displacement on the basilar membrane corresponding to the frequency of 2 kHz. For the input–output functions observed at 4–16 kHz (Fig. 6B–D), the wave I amplitudes measured after noise exposure were significantly smaller than the pre-exposure values at all decibel levels in the two groups, suggesting that excessive noise trauma has caused permanent damage to both OHCs and IHCs/cochlear nerves in the cochlear region with CFs of 4–16 kHz.
DPOAE Level Shifts
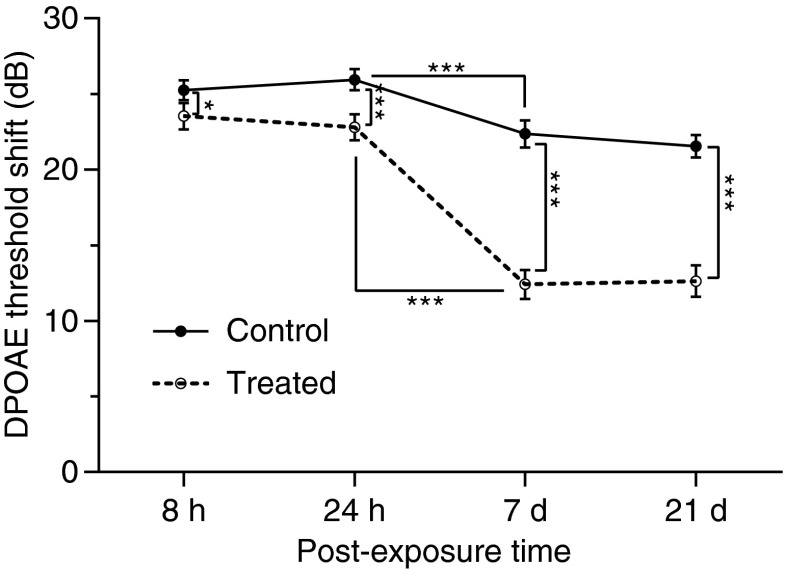
Cubic 2f1-f2 DPOAE levels for the 70 and 60 dB SPL f1 and f2 primaries were measured in the experimental and control animal cohorts. The time course of the recovery of the average LS across 2–16 kHz is shown in Figure 7. In the control group, noise resulted in an initial LS of approximately 25 dB, which was observed at 8 h after exposure, and remained relatively constant until the 24-h time point (F(1, 442) = 1.20, p = 0.27). From 24 h through 7 days after exposure, there was a 3-dB reduction in LS, representing a significant recovery (F(1, 416) = 19.04, p < 0.0001). No further reduction in shift was noted during the remainder of the experimental time course (F(1, 442) = 0.91, p = 0.34). However, animals in the antioxidant-treated groups showed a greater improvement in DPOAE levels at each time point than control partners; the effect being most pronounced at days 7 and 21 (F(1, 442) = 5.26, p = 0.02 for 8 h; F(1, 442) = 13.89, p = 0.0002 for 24 h; F(1, 416) = 81.1, p < 0.0001 for 7 days; and F(1, 442) = 68.64, p < 0.0001 for 21 days), with an average 10 dB shift decrease at frequencies of 2 to 16 kHz. The DPOAE LS versus f2 frequency function obtained 8 h, 24 h, 7 days, and 21 days after noise exposure are displayed in Figure 8. The post hoc analysis did not reveal any significant difference between the treated and untreated animals at 8 or 24 h for any of the measurable frequencies, whereas the significant pairwise differences were apparent at day 7 for 3–6 kHz and day 21 for 6–8 kHz. The LS curves for treated animals were clearly lower than those of control animals across the range of 2–16 kHz (Fig. 8), which is in agreement with the statistical analyses (Fig. 7), showing the main effect for treatment across all test frequencies. Interestingly, the majority (65 %) of the treatment-specific recovery as measured by DPOAE analysis occurred between 24 h and 7 days after noise exposure, which is later than when the majority of the drug-related recovery was observed as measured by ABRs (Fig. 4).
FIG. 7.
DPOAE level shifts (LS) averaged across 2–16 kHz as a function of time. In the control groups, after noise exposure, a maximal LS was observed at 8 h and remained relatively constant until 24 h, while permanent LSs were observed at 7 days. A partial recovery of LS occurred during the 24-h–7-day period. Animals in the treated groups showed a similar time course of functional recovery but a significant reduction in LS from 8 h to 21 days when compared to control animals. The number of ears tested was: 18 (8 h), 18 (24 h), 18 (7 d), 16 (21 d). Data were analyzed using a two-way ANOVA with the Bonferroni test, *p < 0.05; ***p < 0.001 or 0.0001 and plotted as mean ± SEM.
FIG. 8.
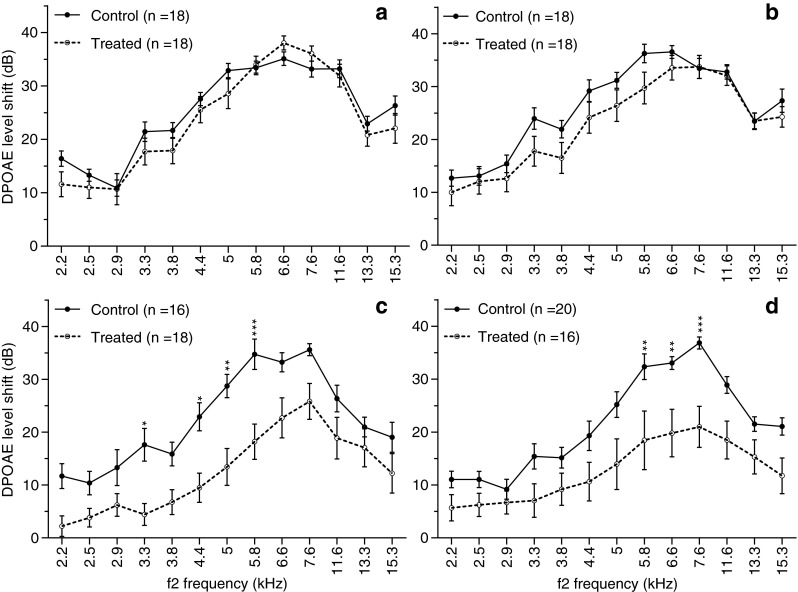
DPOAE level shifts (LS) as a function of f2 frequency measured following noise exposure at 8 h (A), 24 h (B), 7 days (C), and 21 days (D). Compared with noise-exposed controls, animals treated with NAC/HPN-07 showed a clear reduction (or a tendency for reduction) in LS over the entire frequency range for points beginning at 24 h post-exposure and continuing through the 21-day terminal time point. A significant effect was present at 7 days for 3–6 kHz and 21 days for 6–8 kHz. Data were plotted as mean ± SEM. n represents the number of ears. Data was analyzed using a two-way ANOVA with the Bonferroni test, *p < 0.05, **p < 0.01, ***p < 0.001.
Hair Cell Counts
A skewed distribution of HC loss toward the basal half of the basilar membrane was evident in both the OHC and IHC regions, with most of the HC loss occurring at or basal to the regions of the cochlea corresponding to the frequency (16 kHz) of the noise insult. The percentage of OHC loss in the most basal half of the basilar membrane was 84.9 ± 4.1 in untreated animals and 13.27 % ± 5.1 in antioxidant-treated animals, respectively (Fig. 9). Similarly, the percentage of IHC loss in the most basal half of the basilar membrane was 2.4 % ± 1.01 and 0.88 % ± 0.38 for the untreated and antioxidant-treated animals, respectively (Fig. 10). By comparison, in the apical half of the cochlea, only 2.55 % ± 0.63 and 0.64 % ± 0.02 of the OHCs and IHCs, respectively, were missing in the untreated, noise-exposed animals (Figs. 9 and 10). In antioxidant-treated animals, the number of missing OHCs was reduced to 0.64 % ± 0.26, and the number of missing IHCs was reduced to 0.03 % ± 0.03 in the apical region of the cochlea.
FIG. 9.
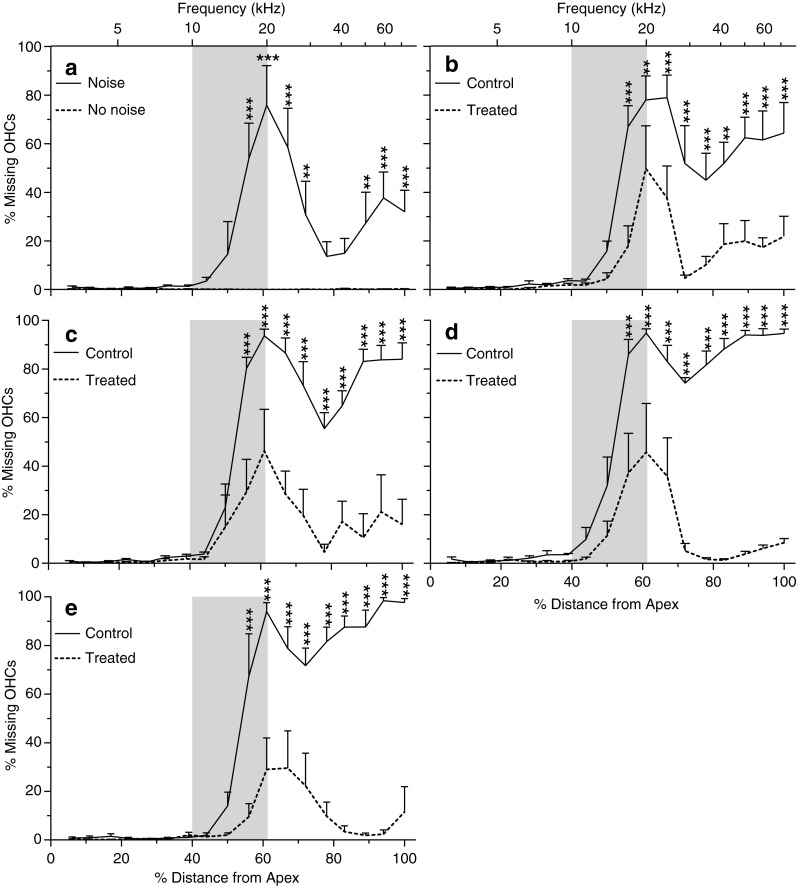
Percent OHC loss as a function of percent distance (frequency place in kiloHertz) from the OC apex in normal control (no noise, untreated) and at 4 h (A), 12 h (B), 24 h (C), 7 days (D), and 21 days (E) after exposure to the 115-dB OBN in the noise only and treated groups. Shaded areas show the frequency range of the noise. The data are plotted as mean ± SEM. Six cochlea were analyzed for each data point. OHC loss was already seen in the middle to basal part of the cochlea at 4 h post-exposure and progressively increased, especially in the basal part of the cochlea, in the untreated noise-exposed group, while OHC loss remained at a low level in the treated group over the 21 days after noise exposure. Data analysis was performed by two-way ANOVA followed by Bonferroni post-tests: *p <0.05; **p < 0.01; ***p < 0.001.
FIG. 10.
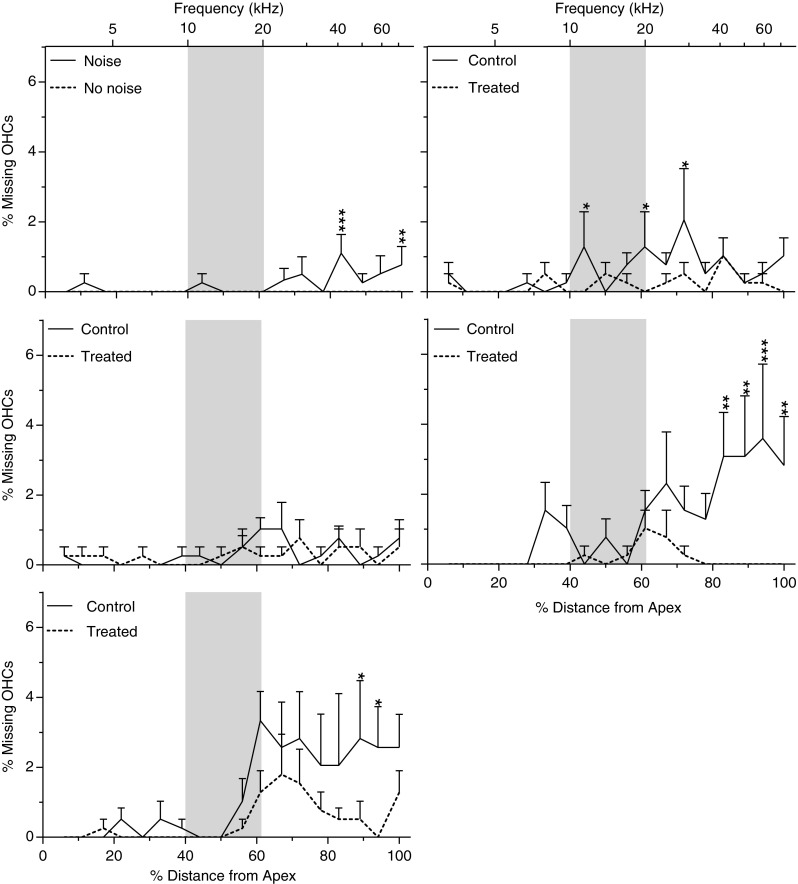
Percent IHC loss as a function of percent distance (frequency place in kilohertz) from the OC apex in normal control (no noise, untreated) and at 4 h (A), 12 h (B), 24 h (C), 7 days (D), and 21 days (E) after exposure to the 115-dB OBN in the noise only and treated groups. Shaded areas show the frequency range of the noise. The data are plotted as mean ± SEM. Six cochlea were analyzed for each data point. IHC loss was first seen in the basal part of the cochlea 4 h post-noise exposure and increased and expanded over the 21 days after noise exposure. Significant differences were seen at 4 h, 12 h, 7 days, and 21 days after noise exposure. Data analysis was performed by two-way ANOVA followed by Bonferroni post-tests: *p < 0.05; **p < 0.01; ***p < 0.001.
C-fos Expression in the Dorsal Cochlear Nucleus (DCN)
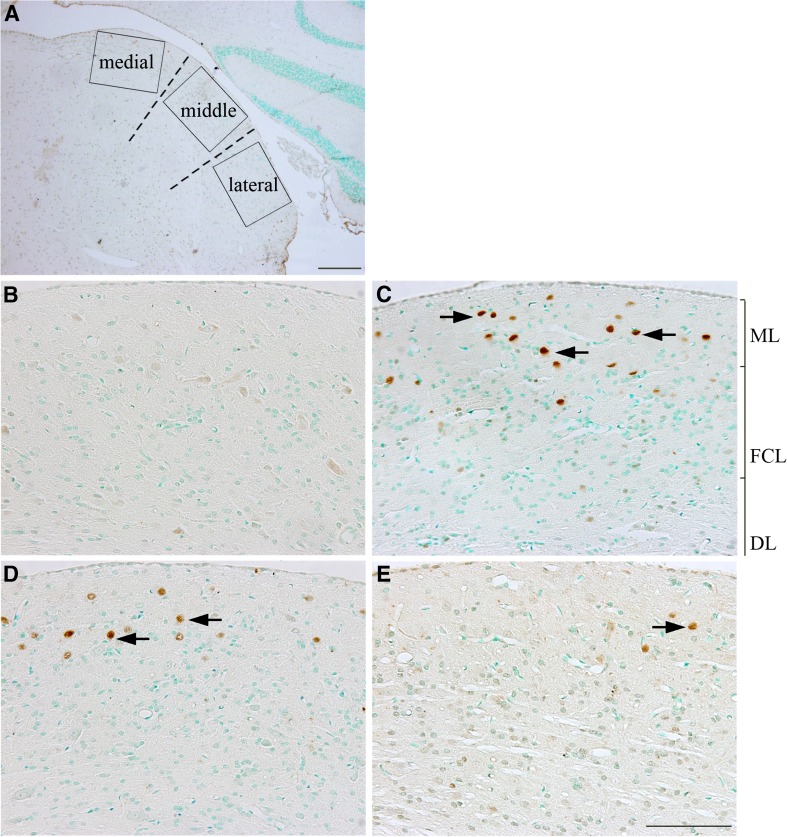
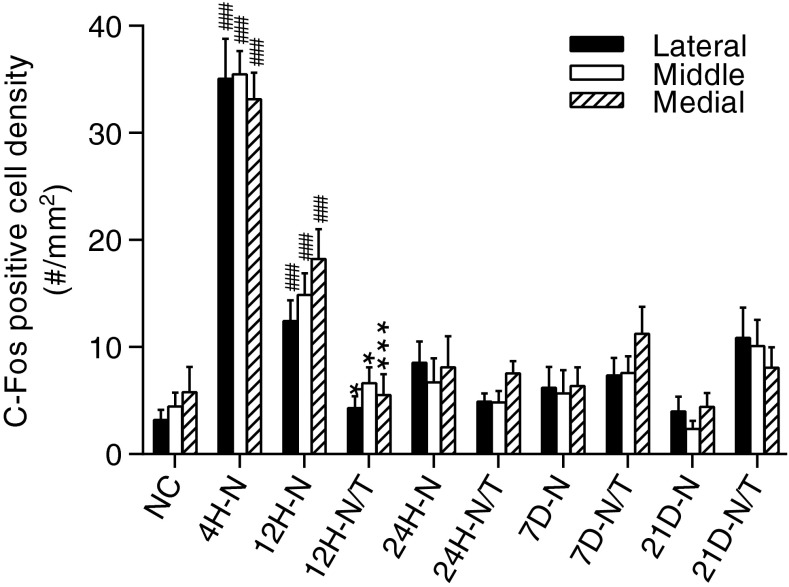
A representative low magnification image of the DCN and the designated sampling technique for immunohistochemical comparisons are shown in Fig. 11A. Four hours after noise exposure, a significant increase in the number of c-fos-positive cells was observed in the molecular layer of the DCN, with fewer positive cells in the fusiform soma and deep layers (FSL and D, arrows in Fig. 11C), suggesting that c-fos expression was upregulated in the DCN immediately after noise exposure. This noise-induced expression of c-fos was observed in the lateral, middle, and medial regions in the DCN, corresponding, respectively, to low, middle, and high frequency regions in the tonotopic map (Fig. 11A and 12), with no significant differences in the number of c-fos-positive cells apparent between any two regions at this time point or at any subsequent time point after noise exposure (Fig. 12, all p > 0.05). The number of c-fos-positive cells in the DCN decreased at 12 h (Figs. 11D, 12) and returned to normal levels 24 h (and up to 21 days) after noise exposure (Fig. 12). A significant reduction in c-fos-positive cells was observed in the noise-exposed animals that were treated with antioxidants relative to the untreated noise-exposed group at 12 h post-insult (p < 0.01), suggesting that antioxidant treatment suppressed the upregulation of c-fos expression in the DCN after noise exposure (Figs. 11E and 12). No significant difference was observed at later time points (24 h to 21 days after noise exposure, all p > 0.05), consistent with the reduction of c-fos levels in the noise-exposed animals to that of normal controls at these later sampling intervals (Fig. 12).
FIG. 11.
An example of a low magnification image of the DCN with methyl green nuclear counter-staining (A). The DCN was divided into three parts (dashed lines): the medial third (medial), the middle third (middle), and the lateral third (lateral) which correspond to the high, middle, and low frequency regions in the tonotopic map, respectively. The rectangles indicate the locations where images were taken for quantification of immunostaining. Examples of c-fos immunostaining in the DCN of normal controls (B), 4 h (C), or 12 h (D) after noise exposure, and 12 h after noise exposure plus treatment (E). More c-fos-positive cells were observed in the molecular layer (ML) after noise exposure (arrows in C and D) than in the noise plus treatment group (arrow in E). Scale bar in A = 500 μm and 200 μm in E for B–E.
FIG. 12.
Effects of treatment (T) on c-fos expression in the DCN. The number of c-fos-positive cells in the DCN was counted and statistically analyzed in the three regions designated in Fig. 11A. No significant difference was observed between the regions at each time point (all p > 0.05). Compared to normal controls, significantly more c-fos-positive cells were observed in all regions in the DCN 4 and 12 h (H) after noise (N) exposure (all p < 0.01 or 0.001, 4H-N and 12H-N). The treated animals showed a significant reduction in c-fos-positive cells compared to controls at 12 h after noise exposure (12H-N/T, p < 0.05 or 0.001). No significant difference was observed with the one-way ANOVA with Tukey post hoc test at later time points (all p > 0.05). ###p < 0.001 compared to normal control group; *p < 0.05 and ***p < 0.001 compared to the noise exposure group. Error bars represent standard error of the means.
C-fos Expression in the Ventral Cochlear Nucleus
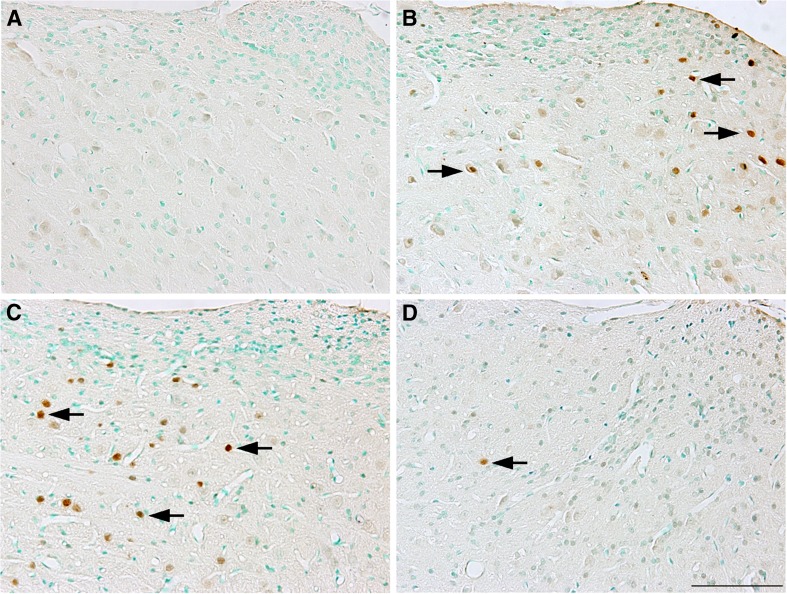
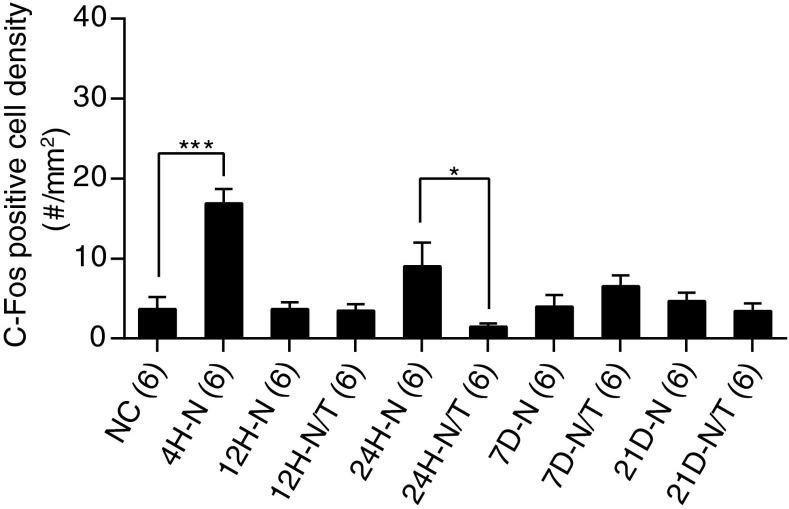
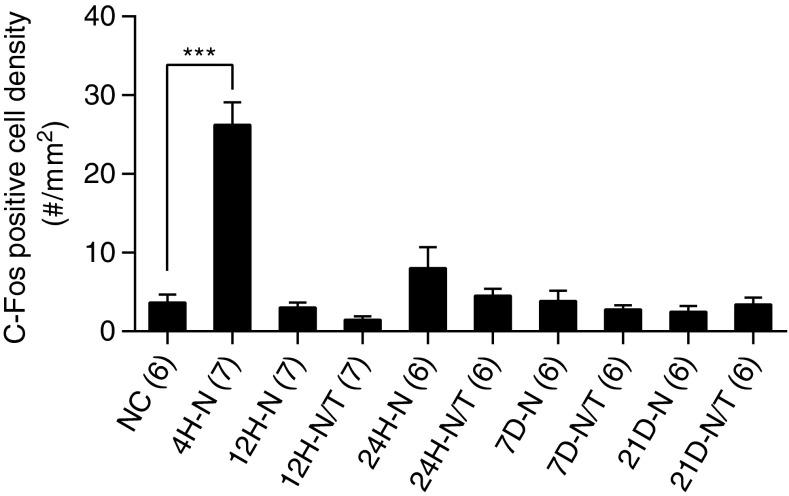
Noise exposure also induced a marked increase in the number of c-fos-positive cells observed in the AVCN, 4 h after acoustic trauma (Fig. 13B), suggesting that c-fos expression was upregulated immediately after noise exposure in the AVCN. The number of positively stained cells returned to normal levels at 12 h and 7–21days after noise exposure (Fig. 14). However, there was a second peak of apparent upregulation 24 h after noise exposure (Figs. 13C and 14). To quantify these differences, positively stained cells in the AVCN were counted and statistically analyzed (Fig. 14). A significantly increased number of c-fos-positive cells was found in noise-exposed animals relative to non-noise-exposed animals at 4 h and at 24 h post-insult (p < 0.05 or 0.01). A significant decrease in c-fos-positive cells was found when noise-exposed animals that had been subsequently treated with antioxidants were compared to the untreated noise-exposed controls at 24 h after acoustic insult (p < 0.01), suggesting that antioxidant treatment suppressed the upregulation of c-fos expression in the AVCN at this time point after noise exposure (Figs. 13D and 14). No significant difference in c-fos levels were observed at the other sampling time points (12 h and 7 to 21 days after noise exposure, all p > 0.05), during which the levels of this biomarker returned to the levels observed in the normal control group (Fig. 14).
FIG. 13.
Examples of c-fos immunostaining in the AVCN of normal control (A), 4 h (B), or 24 h (C) after noise exposure, and 24 h after noise exposure plus treatment (D). More c-fos-positive cells were observed in the AVCN after in noise-exposed animals (arrows in B and C) than were observed in the AVCN of noise-exposed animals that were subsequently treated with antioxidants (arrow in D). Scale bar = 200 μm in D for A–D.
FIG. 14.
Effects of treatment on c-fos expression in the AVCN. The number of c-fos-positive cells in the AVCN was counted and statistically analyzed. Compared to normal controls, significantly more c-fos-positive cells were observed in the AVCN 4 h (H) after noise (N) exposure (p < 0.001, 1H-N). There was a significant reduction in the number of c-fos-positive cells in the treated (T) group compared to the non-untreated group at 24 h after noise exposure (24H-N/T vs. 24H-N, p < 0.05). No significant difference was observed at later time points by one-way ANOVA with Tukey post hoc test (all p > 0.05). *p < 0.05 and ***p < 0.001. Error bars represent standard error of the mean.
In the PVCN, a significantly increased number of c-fos-positive cells was observed at 4 h following noise exposure relative to non-noise-exposed animals (p < 0.001), suggesting that c-fos expression was also upregulated immediately after noise exposure in the PVCN (Fig. 15). Similar to observations within the AVCN, c-fos levels in this region of the cochlear nucleus returned to those observed in normal controls 8 h after noise exposure. However, no significant difference in c-fos levels was observed in the PVCN at later time points in noise-exposed animals (12 h to 21 days after noise exposure, all p > 0.05) (Fig. 15).
FIG. 15.
Effects of treatment (T) on c-fos expression in the PVCN. The number of c-fos-positive cells in the PVCN was counted and statistically analyzed. Compared to normal controls, significantly more c-fos-positive cells were observed in the AVCN 4 h (H) after noise (N) exposure (p < 0.001, 1H-N). No significant difference was observed at the remaining time points by one-way ANOVA with Tukey post hoc test (all p > 0.05). ***p < 0.001. Error bars represent standard error of the mean.
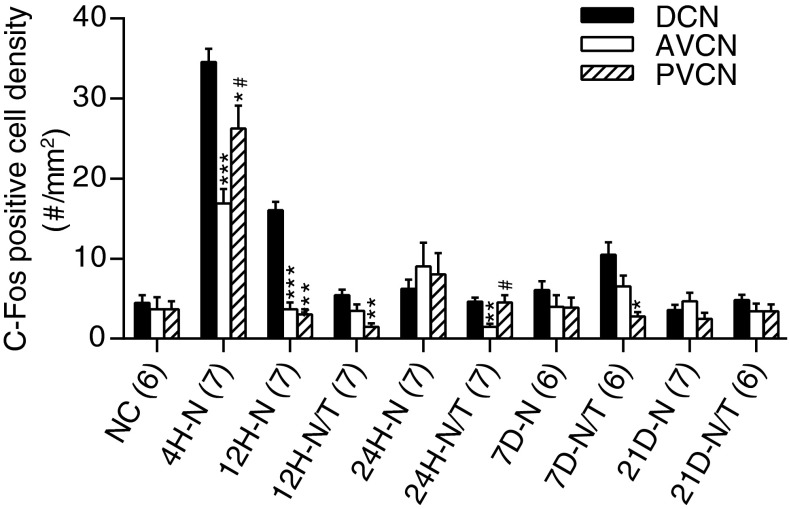
A comparison of c-fos expression in the DCN, AVCN, and PVCN at different time points after noise exposure and antioxidant treatment is summarized in Figure 16. In this analysis, we combined c-fos quantification data from the three regions in the DCN at each time point in each group. The DCN has significantly more c-fos-positive cells than the VCN at two time points (4 and 12 h) after noise exposure (p < 0.01, Fig. 16), suggesting that, although only the deep layer of the DCN has direct auditory input, it, too, is sensitive to intense noise exposure.
FIG. 16.
Comparison of c-fos expression in the DCN and the VCN at different time points (H = hour) after noise (N) exposure and antioxidant treatment (T). More c-fos-positive cells were observed in the DCN than AVCN or PVCN at 4 to 24 h after noise exposure by, one-way ANOVA with Tukey post hoc test (p < 0.05, 0.01, or 0.001). *p < 0.05, **p < 0.01, and ***p < 0.001, compared to the corresponding DCN value. #p < 0.05 compared to the corresponding AVCN value. Error bars represent standard error of the mean.
Spiral Ganglion Neuron Density
Loss of afferent neurons (spiral ganglion) after noise exposure has been shown to be one of the structural changes associated with loss of auditory function as measured by ABR (Hall 1990). To determine if such loss was a factor in these studies, we examined spiral ganglion cell density 21 days after noise exposure. From this analysis, we observed no significant neuron loss after noise exposure at this time point (all p > 0.05) (data not shown). Therefore, it was not possible to determine if the antioxidant treatment had an effect on neuron loss within the time frame of these experiments.
DISCUSSION
The present study demonstrated a substantial treatment effect for the combination of NAC and HPN-07 on NIHL by functional and histological analyses. Bioavailability was demonstrated by elevated blood levels of both compounds with a corresponding rise in total plasma antioxidant capacity within 30 min after i.p. injection and by radiotracer studies showing incorporation of the NAC-derived cysteine in the cochlea, brainstem, and auditory cortex. The initial noise-induced elevation of ABR thresholds was statistically indistinguishable between the control and treated subjects, indicating that both groups sustained similar levels of acoustic injury. At all subsequent observation time points, TS and LS were significantly reduced in the treated group compared to the untreated group with a total drug-related recovery over the 21 days after noise exposure of approximately 23 and 8 dB for the two types of electrophysiological tests, respectively. Interestingly, the majority (66 %) of the total 21-day TS recovery occurred between 1 and 24 h, after noise exposure and after two drug doses were administered, while 65 % of the recovery of LS occurred between 24 h and 7 days, and following five doses of antioxidants (Fig. 4). These observations suggest that distinct components of the functional recovery, represented by ABR and DPOAE analysis, are enhanced by the drug treatment. However, given the timing of the recovery events relative to the drug delivery schedule, these results could also reflect a drug dose effect. Taken together with the hair cell (HC) data, the more rapid ABR-TS recovery may be associated with recovery of inner HC and neurites, and the DPOAE-LS recovery was likely associated with slower recovery of outer HCs following the acoustic trauma (Wang et al. 2002).
Most of the inner (95 %) and outer (97 %) HC death occurred in the basal half of the cochlea. This localization of HC loss in the region at and above the trauma center (14 kHz) is consistent with previous reports (Chen and Fechter 2003). The effect of antioxidant treatment was most dramatically demonstrated by the reduction in the number of missing OHCs and IHCs by 95 and 64 %, respectively, in this basal region of the cochlea at 21 days after noise exposure. Correlation of functional ABR and DPOAE results with HC counts was complicated by the fact that these functional tests were limited by instrumentation to frequencies below 16 kHz, preventing their direct comparison in the higher frequency basal region of the cochlea. It is therefore possible that greater TS occurred in the basal region of the cochlea above the region of the auditory trauma, as previously reported (Wang et al. 2002; Kujawa and Liberman 2009). Nonetheless, elevated TSs and LSs in the apical half of cochlea, in the absence of appreciable HC death (<1 %), suggests that other factors (e.g., damage to mechano-sensory hair bundles of cochlear HCs or changes in the OHC plasma membrane fluidity associated with a loss of OHC electromotility) may be responsible for reduced physiological responses (Liberman and Dodds 1984, Chen and Zhao 2007). With respect to the physiological measures obtained 21 days after exposure, the irreversible injury of the HCs is likely reflected in elevations of ABR-TS or DPOAE-LS. Furthermore, the substantial HC damage, combined with degeneration of cochlear nerve peripheral terminals over 21 days, would likely lead to reduction in the amplitude of ABR wave I despite the presence of normal spiral ganglion cell populations (Wang et al. 2002; Lin et al. 2011).
Moreover, we provide functional evidence that antioxidant treatment reduces acoustic damage to IHCs (including afferent synapses and terminals). OHCs are known to be more susceptible than IHCs to acoustic trauma. The first 40-dB PTS caused by acoustic trauma mainly results from damaged OHCs (Chen 2006; Chen and Liu 2005; Chen and Zhao 2007), whereas a PTS in excess of 40 dB is generally indicative of IHC damage. In this study, the PTS observed in the untreated control group was about 60 dB in the frequency range of 8–16 kHz (Fig. 5D), exceeding the 40-dB PTS attributed to irreversible injury or loss of OHCs. Furthermore, the auditory nerve response to sound stimulation can maintain its normal amplitudes at 90 dB SPL or higher only when IHCs and their associated nerves are functioning properly, even if all OHCs are destroyed (Chen et al. 2008). However, we observed that, with the exception of the 2-kHz ABRs obtained in the antioxidant-treated group, the amplitudes of wave I response at 90–100 dB SPL were attenuated by noise but failed to return to pre-exposure values for any of the test frequencies between 2 and 16 kHz (Fig. 6). Therefore, these ABR-based measurements directly support the conclusion of noise-induced IHC damage (or including damage to auditory neurites) in this model system. The observation of treatment-reduced PTS at frequencies of 8 to 16 kHz (Fig. 5D) and treatment-enhanced amplitudes at 90–100 dB SPL from 2 to 16 kHz (Fig. 6), in particular treatment-maintained normal amplitudes at 90–100 dB SPL at 2 kHz (Fig. 6A), strongly indicate that the combination of NAC/HPN-07 can provide effective protection of IHCs/cochlear neurites against acoustic trauma.
We observed upregulation of c-fos in the cochlear nucleus 4 h after noise exposure, which is consistent with previous reports of increased c-fos expression in the CNS, specifically in neurons of the cochlear nucleus and other regions in the brainstem, within a few hours and up to 5.5 weeks after noise exposure (Brown and Liu 1995; Ehret and Fischer 1991; Kai and Niki 2002; Morgan and Curran 1991; Rouiller et al. 1992; Säljö et al. 2002; Sato et al. 1993; Zhang et al. 2003; Saint Marie et al. 1999; Wallhäusser-Franke 1997). In general, the pattern of c-fos expression in the auditory system is noise frequency-, intensity-, and duration-dependent (Olucha et al. 1997). Two mechanisms have been suggested to explain increased c-fos expression in the central auditory system: (1) elevations of spontaneous activity and (2) a plastic readjustment to the partial loss of cochlear input to the central auditory system (Zhang et al. 2003). In the DCN, most c-fos-positive cells were restricted to the molecular layer, presumably labeling satellite cells that do not receive auditory nerve projections. This could reflect increased activity of these cells related to encroachment of somatosensory innervations (Shore et al. 2008). Such an increase in non-auditory input can lead to increased spontaneous activity in DCN neurons, which is thought to be related to noise-induced tinnitus (Brozoski et al. 2002; Kaltenbach et al. 2004; Zeng et al. 2009). In the present study, we observed significantly more c-fos-positive cells in the DCN than in the VCN. A similar distribution of noise-induced c-fos expression has previously been observed in the DCN of rats (Rouiller et al. 1992). The DCN has direct auditory input only in its deep layer, and most of the c-fos-positive neurons that we observed following acoustic insult were located in the molecular layer. Therefore, this upregulated c-fos expression in the DCN is not likely to be directly induced by intense noise. Alternatively, enhanced somatosensory input may be involved (Dehmel et al. 2012; Shore et al. 2008). While tonotopic c-fos distribution has been observed in the DCN following tonal stimulation (Brown and Liu 1995; Ehret and Fischer 1991; Sato et al. 1993), we did not observe such tonotopic c-fos distribution in the DCN in animals exposed to OBN (10–20 kHz) based on sampling of three regions of the DCN (see Figs 11 and 12). Moreover, a second peak observed at 24 h after noise exposure in the AVCN may indicate that noise exposure induces changes in inhibitory interneurones in the cochlear nucleus (Gleich et al. 1995; Olucha et al. 1997). We show here that antioxidant treatment can significantly attenuate noise-induced c-fos expression in the DCN (12 h) and the AVCN (24 h). Previously, we demonstrated that antioxidants can reduce degeneration of synapses in the DCN of chinchilla after noise exposure (Du et al. 2012).
Taken together, these results suggest that antioxidant treatment may provide protection to central auditory structures by inhibiting expression of immediate early genes that reflect hyperactivity in the DCN and, thus, noise-induced tinnitus. However, the cochlear nucleus has been shown to exhibit signs of noise-induced plasticity, which could arise from noise-induced alterations in synapses, gene expression, or cell density within the cochlear nucleus (Dong et al. 2010; Kim et al. 2004, Feng et al. 2012; Gröschel et al. 2010). Based on the restricted nature of c-fos labeling shown here, the expression data provide insight into only one dimension of many possible changes that could be occurring.
In conclusion, the present study is the first evaluation of the combined application of NAC and HPN-07 as a treatment for NIHL resulting from intense steady state noise. The use of antioxidants, such as NAC, which increases glutathione levels (an important cellular antioxidant), has been shown to protect HCs from NIHL in animals models (Ohinata et al. 2000a, b; Kopke et al. 2000, 2002, 2007) and to partially ameliorate noise-induced cochlear injury in humans (Lin et al. 2010; Lindblad et al. 2011). We have shown previously that greater otoprotective effects are obtained when NAC is combined with a nitrone-based free radical trapping agent 4-OHPBN than is obtained with either compound alone (Choi et al. 2008). It was anticipated, therefore, that HPN-07, a structural analog of 4-OHPBN would have a similar synergistic effect when combined with NAC. Our studies in chinchilla and rat have confirmed this assumption (unpublished findings). The results reported herein demonstrate that the combination of two clinically safe compounds, HPN-07 and NAC, shows promise for treatment of NIHL by protecting cochlear sensory cells, and potentially afferent neurites, from the damaging effects of intense, acute noise. In addition, the drugs were shown to reduce aberrant activation of neurons in the central auditory regions of the brain following noise exposure.
ACKNOWLEDGMENTS
The authors appreciate the efforts of Weihua Cheng for her outstanding technical assistance and would like to extend our appreciation to Dr. Marie H. Hanigan (OUHSC) for her assistance with TAC experiments. This research was supported by grant N00014-09-1-0999 from the US Department of the Navy, Office of Naval Research.
Contributor Information
Jianzhong Lu, Email: jlu@houghear.org.
Wei Li, Email: weili@houghear.org.
Xiaoping Du, Email: xdu@houghear.org.
Donald L. Ewert, Email: dewert@houghear.org
Matthew B. West, Email: mwest@houghear.org
Charles Stewart, Email: cstewart1170@gmail.com.
Robert A. Floyd, Email: robert-floyd@omrf.org
Richard D Kopke, Phone: +1-405-6392876, FAX: +1-405-9476226, Email: rkopke@houghear.org.
REFERENCES
- Amarnath K, Amarnath V, Amarnath K, Valentine HL, Valentine WM. A specific HPLC-UV method for the determination of cysteine and related aminothiols in biological samples. Talanta. 2003;60(6):1229–1238. doi: 10.1016/S0039-9140(03)00232-7. [DOI] [PubMed] [Google Scholar]
- Ashmore JF. A fast motile response in guinea pig outer hair cells: the cellular basis of the cochlear amplifier. J Physiol (London) 1987;388:323–347. doi: 10.1113/jphysiol.1987.sp016617. [DOI] [PMC free article] [PubMed] [Google Scholar]
- Brown MC, Liu TS. Fos-like immunoreactivity in central auditory neurons of the mouse. J Comp Neurol. 1995;357(1):85–97. doi: 10.1002/cne.903570109. [DOI] [PubMed] [Google Scholar]
- Brozoski TJ, Bauer CA, Caspary DM. Elevated fusiform cell activity in the dorsal cochlear nucleus of chinchillas with psychophysical evidence of tinnitus. J Neurosci. 2002;22:2383–2390. doi: 10.1523/JNEUROSCI.22-06-02383.2002. [DOI] [PMC free article] [PubMed] [Google Scholar]
- Chen GD. Prestin gene expression in the rat cochlea following intense noise exposure. Hear Res. 2006;222:54–61. doi: 10.1016/j.heares.2006.08.011. [DOI] [PubMed] [Google Scholar]
- Chen G-D, Fechter LD. The relationship between noise-induced hearing loss and hair cell loss in rats. Hear Res. 2003;177:81–90. doi: 10.1016/S0378-5955(02)00802-X. [DOI] [PubMed] [Google Scholar]
- Chen GD, Liu Y. Mechanisms of noise-induced hearing loss potentiation by hypoxia. Hear Res. 2005;200:1–9. doi: 10.1016/j.heares.2004.08.016. [DOI] [PubMed] [Google Scholar]
- Chen GD, Zhao HB. Effects of intense noise exposure on the outer hair cell plasma membrane fluidity. Hear Res. 2007;226:14–21. doi: 10.1016/j.heares.2006.06.007. [DOI] [PubMed] [Google Scholar]
- Chen GD, Tanaka C, Henderson D. Relation between outer hair cell loss and hearing loss in rats exposed to styrene. Hear Res. 2008;243:28–34. doi: 10.1016/j.heares.2008.05.008. [DOI] [PMC free article] [PubMed] [Google Scholar]
- Choi C, Chen K, Vasquez-Weldon A, Jackson RL, Floyd RA, Kopke RD. Effectiveness of 4-OHPBN alone and in combination with other antioxidant drugs in the treatment of acute acoustic trauma in chinchilla. Free Radic Biol Med. 2008;44:1772–1784. doi: 10.1016/j.freeradbiomed.2008.02.005. [DOI] [PubMed] [Google Scholar]
- Choi C, Chen K, Du X, Floyd RA, Kopke RD. Effects of delayed and extended antioxidant treatment on acute acoustic trauma. Free Radic Res. 2011;45(10):1162–1172. doi: 10.3109/10715762.2011.605360. [DOI] [PubMed] [Google Scholar]
- Clausen F, Marklund N, Lewén A, Hillered L. The nitrone free radical scavenger NXY-059 is neuroprotective when administered after traumatic brain injury in the rat. J Neurotrauma. 2008;25(12):1449–1457. doi: 10.1089/neu.2008.0585. [DOI] [PubMed] [Google Scholar]
- Coling DE, Yu KC, Somand D, Satar B, Bai U, Huang TT, Seidman MD, Epstein CJ, Mhatre AN, Lalwani AK (2003) Effect of SOD1 overexpression on age- and noise-related hearing loss. Free Radic Biol Med 34:873–880 [DOI] [PubMed]
- Dehmel S, Pradhan S, Koehler S, Bledsoe S, Shore S. Noise overexposure alters long-term somatosensory-auditory processing in the dorsal cochlear nucleus—possible basis for tinnitus-related hyperactivity? J Neurosci. 2012;32(5):1660–1671. doi: 10.1523/JNEUROSCI.4608-11.2012. [DOI] [PMC free article] [PubMed] [Google Scholar]
- Dong S, Mulders W, Rodger J, Woo S, Robertson D. Acoustic trauma evokes hyperactivity and changes in gene expression in guinea-pig auditory brainstem. Eur J Neurosci. 2010;31:1616–1628. doi: 10.1111/j.1460-9568.2010.07183.x. [DOI] [PubMed] [Google Scholar]
- Du X, Chen K, Choi CH, Li W, Cheng W, Stewart C, Hu N, Floyd RA, Kopke RD. Selective degeneration of synapses in the dorsal cochlear nucleus of chinchilla following acoustic trauma and effects of antioxidant treatment. Hear Res. 2012;283(1–2):1–13. doi: 10.1016/j.heares.2011.11.013. [DOI] [PubMed] [Google Scholar]
- Du X, Ewert DL, Cheng W, West MB, Lu J, Li W, Floyd RA, Kopke RD (2013) Effects of antioxidant treatment on blast-induced brain injury. PLoS One. 8(11): e80138. doi:10.1371/journal.pone.0080138 [DOI] [PMC free article] [PubMed]
- Ehret G, Fischer R. Neuronal activity and tonotopy in the auditory system visualized by c-fos gene expression. Brain Res. 1991;567(2):350–354. doi: 10.1016/0006-8993(91)90819-H. [DOI] [PubMed] [Google Scholar]
- Elshorbagy AK, Valdivia-Garcia M, Mattocks DA, Plummer JD, Smith AD, Drevon CA, Refsum H, Perrone CE. Cysteine supplementation reverses methionine restriction effects on rat adiposity: significance of stearoyl-coenzyme A desaturase. J Lipid Research. 2011;52:104–112. doi: 10.1194/jlr.M010215. [DOI] [PMC free article] [PubMed] [Google Scholar]
- Ewert DL, Lu J, Li W, Du X, Floyd R, Kopke R. Antioxidant treatment reduces blast-induced cochlear damage and hearing loss. Hear Res. 2012;285:29–39. doi: 10.1016/j.heares.2012.01.013. [DOI] [PubMed] [Google Scholar]
- Feng J, Bendiske J, Morest DK. Degeneration in the ventral cochlear nucleus after severe noise damage in mice. J Neurosci Res. 2012;90(4):831–841. doi: 10.1002/jnr.22793. [DOI] [PMC free article] [PubMed] [Google Scholar]
- Fetoni AR, Ralli M, Sergi B, Parrilla C, Troiani D, Paludetti G. Protective effects of N-acetylcysteine on noise-induced hearing loss in guinea pigs. Acta Otorhinolaryngol Ital. 2009;29:70–75. [PMC free article] [PubMed] [Google Scholar]
- Fetoni AR, De Bartolo P, Eramo SL, Rolesi R, Paciello F, Bergamini C, Fato R, Paludetti G, Petrosini L, Troiani D. Noise-induced hearing loss (NIHL) as a target of oxidative stress-mediated damage: cochlear and cortical responses after an increase in antioxidant defense. J Neurosci. 2013;33(9):4011–4023. doi: 10.1523/JNEUROSCI.2282-12.2013. [DOI] [PMC free article] [PubMed] [Google Scholar]
- Gleich O, Bielenberg K, Strutz J. Sound induced expression of c-Fos in GABA positive neurones of the gerbil cochlear nucleus. Neuroreport. 1995;7(1):29–32. doi: 10.1097/00001756-199512290-00006. [DOI] [PubMed] [Google Scholar]
- Green AR, Ashwood T, Odergren T, Jackson DM. Nitrones as neuroprotective agents in cerebral ischemia, with particular reference to NXY- 059. Pharmacol Ther. 2003;100:195–214. doi: 10.1016/j.pharmthera.2003.07.003. [DOI] [PubMed] [Google Scholar]
- Gröschel M, Götze R, Ernst A, Basta D. Differential impact of temporary and permanent noise-induced hearing loss on neuronal cell density in the mouse central auditory pathway. J Neurotrauma. 2010;27:1499–1507. doi: 10.1089/neu.2009.1246. [DOI] [PubMed] [Google Scholar]
- Hainsworth AH, Bhuiyan N, Green AR. The nitrone disodium 2,4-sulphophenyl-N-tert-butylnitrone is without cytoprotective effect on sodium nitroprusside-induced cell death in N1E-115 neuroblastoma cells in vitro. J Cereb Blood Flow Metab. 2008;28:24–28. doi: 10.1038/sj.jcbfm.9600517. [DOI] [PubMed] [Google Scholar]
- Hall RD. Estimation of surviving spiral ganglion cells in the deaf rat using the electrically evoked auditory brainstem response. Hear Res. 1990;45(1–2):123–136. doi: 10.1016/0378-5955(90)90188-U. [DOI] [PubMed] [Google Scholar]
- Hamernik RP, Hsueh DD. Impulse noise: some definitions, physical acoustics and other considerations. J Acoust Soc Am. 1991;90:189–195. doi: 10.1121/1.401287. [DOI] [PubMed] [Google Scholar]
- Hamernik RP, Turrentine G, Roberto M, Salvi R, Henderson D. Anatomical correlates of impulse noise-induced mechanical damage in the cochlea. Hear Res. 1984;3:229–247. doi: 10.1016/0378-5955(84)90077-7. [DOI] [PubMed] [Google Scholar]
- Hamernik RP, Ahroon WA, Hsueh DD. The energy spectrum of an impulse: its relation to hearing loss. J Acoust Soc Am. 1991;90:197–204. doi: 10.1121/1.402344. [DOI] [PubMed] [Google Scholar]
- Henderson D, Bielefeld EC, Harris KC, Hu BH. The role of oxidative stress in noise-induced hearing loss. Ear Hear. 2006;27:1–19. doi: 10.1097/01.aud.0000191942.36672.f3. [DOI] [PubMed] [Google Scholar]
- Hight NG, McFadden SL, Henderson D, Burkard RF, Nicotera T. Noise-induced hearing loss in chinchillas pre-treated with glutathione monoethylester and R-PIA. Hear Res. 2003;179:21–32. doi: 10.1016/S0378-5955(03)00067-4. [DOI] [PubMed] [Google Scholar]
- Hu BH, Zheng XY, McFadden SL, Kopke RD, Henderson D. R-Phenylisopropyladenosine attenuates noise-induced hearing loss in the chinchilla. Hear Res. 1997;113:198–206. doi: 10.1016/S0378-5955(97)00143-3. [DOI] [PubMed] [Google Scholar]
- Hu BH, Guo W, Wang PY, Henderson D, Jiang SC. Intense noise-induced apoptosis in hair cells of guinea pig cochleae. Acta Otolaryngol. 2000;120:19–24. doi: 10.1080/000164800760370774. [DOI] [PubMed] [Google Scholar]
- Hu BH, Henderson D, Nicotera TM. Involvement of apoptosis in progression of cochlear lesion following exposure to intense noise. Hear Res. 2002;166:62–71. doi: 10.1016/S0378-5955(02)00286-1. [DOI] [PubMed] [Google Scholar]
- Kai N, Niki H. Altered tone-induced Fos expression in the mouse inferior colliculus after early exposure to intense noise. Neurosci Res. 2002;44(3):305–313. doi: 10.1016/S0168-0102(02)00152-9. [DOI] [PubMed] [Google Scholar]
- Kaltenbach JA, Zacharek MA, Zhang J, Frederick S. Activity in the dorsal cochlear nucleus of hamsters previously tested for tinnitus following intense tone exposure. Neurosci Lett. 2004;355:121e–125e. doi: 10.1016/j.neulet.2003.10.038. [DOI] [PubMed] [Google Scholar]
- Kim JJ, Gross J, Morest DK, Potashner SJ. Quantitative study of degeneration and new growth of axons and synaptic endings in the chinchilla cochlear nucleus after acoustic overstimulation. J Neurosci Res. 2004;77:8. doi: 10.1002/jnr.20211. [DOI] [PubMed] [Google Scholar]
- Kopke RD, Weisskopf PA, Boone JL, Jackson RL, Wester DC, et al. Reduction of noise-induced hearing loss using L-NAC and salicylate in the chinchilla. Hear Res. 2000;149:138–146. doi: 10.1016/S0378-5955(00)00176-3. [DOI] [PubMed] [Google Scholar]
- Kopke RD, Coleman JK, Liu J, Campbell KC, Riffenburgh RH. Candidate’s thesis: enhancing intrinsic cochlear stress defenses to reduce noise-induced hearing loss. Laryngoscope. 2002;112:1515–1532. doi: 10.1097/00005537-200209000-00001. [DOI] [PubMed] [Google Scholar]
- Kopke RD, Jackson RL, Coleman JK, Liu J, Bielefeld EC, Balough BJ. NAC for noise: from the bench top to the clinic. Hear Res. 2007;226(1–2):114–125. doi: 10.1016/j.heares.2006.10.008. [DOI] [PubMed] [Google Scholar]
- Kujawa SG, Liberman MC. Adding insult to injury: cochlear nerve degeneration after “temporary” noise-induced hearing loss. J Neurosci. 2009;29:14077–14085. doi: 10.1523/JNEUROSCI.2845-09.2009. [DOI] [PMC free article] [PubMed] [Google Scholar]
- Kuroda S, Tsuchidate R, Smith ML, Maples KR, Siesjo BK. Neuroprotective effects of a novel nitrone, NXY-059, after transient focal cerebral ischemia in the rat. J Cereb Blood Flow Metab. 1999;19:778–787. doi: 10.1097/00004647-199907000-00008. [DOI] [PubMed] [Google Scholar]
- Lamm K, Arnold W. The effect of blood flow promoting drugs on cochlear blood flow, perilymphatic pO(2) and auditory function in the normal and noise-damaged hypoxic and ischemic guinea pig inner ear. Hear Res. 2000;141:199–219. doi: 10.1016/S0378-5955(00)00005-8. [DOI] [PubMed] [Google Scholar]
- Lees KR, Sharma AK, Barer D, Ford GA, Kostulas V, Cheng YF, Odergren T. Tolerability and pharmacokinetics of the nitrone NXY-059 in patients with acute stroke. Stroke. 2001;32:675–680. doi: 10.1161/01.STR.32.3.675. [DOI] [PubMed] [Google Scholar]
- Liberman MC, Dodds LW. Single-neuron labeling and chronic cochlear pathology. III. Stereocilia damage and alterations of threshold tuning curves. Hear Res. 1984;16:55–74. doi: 10.1016/0378-5955(84)90025-X. [DOI] [PubMed] [Google Scholar]
- Lin CY, Wu JL, Shih TS, Tsai PJ, Sun YM, Ma MC, Guo YL. N-Acetyl-cysteine against noise-induced temporary threshold shift in male workers. Hear Res. 2010;269(1–2):42–47. doi: 10.1016/j.heares.2010.07.005. [DOI] [PubMed] [Google Scholar]
- Lin HW, Furman AC, Kujawa SG, Liberman MC. Primary neural degeneration in the guinea pig cochlea after reversible noise-induced threshold shift. J Assoc Res Otolaryngol. 2011;12:605–616. doi: 10.1007/s10162-011-0277-0. [DOI] [PMC free article] [PubMed] [Google Scholar]
- Lindblad AC, Rosenhall1 U, Olofsson A, Hagerman B (2011) The efficacy of N-acetylcysteine to protect the human cochlea from subclinical hearing loss caused by impulse noise: a controlled trial. Noise Health November-December Volume 13:55, 392–401 [DOI] [PubMed]
- Lorito G, Giordano P, Petruccelli J, Martini A, Hatzopoulos S. Different strategies in treating noiseinduced hearing loss with N-acetylcysteine. Med Sci Monit. 2008;14(8):BR159–BR164. [PubMed] [Google Scholar]
- Miller JM, Brown JN, Schacht J. 8-Iso-prostaglandin F (2alpha), a product of noise exposure, reduces inner ear blood flow. Audiol Neurootol. 2003;8:207–221. doi: 10.1159/000071061. [DOI] [PubMed] [Google Scholar]
- Morgan JI, Curran T. Stimulus-transcription coupling in the nervous system: involvement of the inducible proto-oncogenes fos and jun. Annu Rev Neurosci. 1991;14:421–451. doi: 10.1146/annurev.ne.14.030191.002225. [DOI] [PubMed] [Google Scholar]
- Mortazavi S, Kashani MM, Khavanin A, Alameh A, Mirzaee R, Akbari M. Effects of N-acetylcysteine on auditory brainstem response threshold shift in rabbits exposed to noise and carbon monoxide. Am J Applied Sci. 2010;7(2):201–207. doi: 10.3844/ajassp.2010.201.207. [DOI] [Google Scholar]
- Muller M. Frequency representation in the rat cochlea. Hear Res. 1991;51:247–254. doi: 10.1016/0378-5955(91)90041-7. [DOI] [PubMed] [Google Scholar]
- Nagase S, Mukaida M, Miller JM, Altschuler RA. Neonatal deafening causes changes in Fos protein induced by cochlear electrical stimulation. J Neurocytol. 2003;32(4):353–361. doi: 10.1023/B:NEUR.0000011329.64948.82. [DOI] [PubMed] [Google Scholar]
- NIDCD (2008) Noise induced hearing loss. National Institute on Deafness and Other Communication Disorders web. http://www.nidcd.nih.gov/health/hearing/pages/noise.aspx. Accessed 23 January 2013
- Ohinata Y, Miller JM, Altschuler RA, Schacht J. Intense noise induces formation of vasoactive lipid peroxidation products in the cochlea. Brain Res. 2000;878:163–173. doi: 10.1016/S0006-8993(00)02733-5. [DOI] [PubMed] [Google Scholar]
- Ohinata Y, Yamasoba T, Schacht J, Miller JM. Glutathione limits noise-induced hearing loss. Hear Res. 2000;146:28–34. doi: 10.1016/S0378-5955(00)00096-4. [DOI] [PubMed] [Google Scholar]
- Ohinata Y, Miller JM, Schacht J. Protection from noise-induced lipid peroxidation and hair cell loss in the cochlea. Brain Res. 2003;966:265–273. doi: 10.1016/S0006-8993(02)04205-1. [DOI] [PubMed] [Google Scholar]
- Ohlemiller KK, McFadden SL, Ding DL, Lear PM, Ho YS. Targeted mutation of the gene for cellular glutathione peroxidase (Gpx1) increases noise-induced hearing loss in mice. J Assoc Res Otolaryngol. 2000;1:243–254. doi: 10.1007/s101620010043. [DOI] [PMC free article] [PubMed] [Google Scholar]
- Olucha FE, Molina Mira A, Valenzuela Méndez C, Valverde Navarro AA, Martínez Soriano F. Activation of proto-oncogene c-fos in the auditory tract of rats stimulated with wide-band noise. Acta Otorrinolaringol Esp. 1997;48(2):85–92. [PubMed] [Google Scholar]
- Otani L, Ogawa S, Zhao Z, Nakazawa K, Umehara S, Yoshimura E, Chang SJ, Kato H. Optimized method for determining free L-cysteine in rat plasma by high-performance liquid chromatography with the 4-aminosulfonyl-7-fluoro-2,1,3-benzoxadiazole conversion reagent. Biosci Biotechnol Biochem. 2011;75:2119–2124. doi: 10.1271/bbb.110356. [DOI] [PubMed] [Google Scholar]
- Paxinos G, Watson C. The rat brain in stereotaxic coordinates. 6. New York: Academic Press; 2007. [DOI] [PubMed] [Google Scholar]
- Pirvola U, Xing-Qun L, Virkkala J, Saarma M, Murakata C, Camoratto AM, Walton KM, Ylikoski J. Rescue of hearing, auditory hair cells, and neurons by CEP-1347/KT7515, an inhibitor of c-Jun N-terminal kinase activation. J Neurosci. 2000;20(1):43–50. doi: 10.1523/JNEUROSCI.20-01-00043.2000. [DOI] [PMC free article] [PubMed] [Google Scholar]
- Puel JL, D’Aldin CG, Saffiende S, Eybalin M, Pujol R. Excitotoxicity and plasticity of IHC-auditory nerve contributes to both temporary and permanent threshold shift. In: Axelsson A, Borchgrevink HM, Hamernik RP, Hellstrom P-A, Henderson D, Salvi RJ, editors. Scientific basis of noise-induced hearing loss. New York: Thieme; 1996. pp. 36–42. [Google Scholar]
- Puel JL, Ruel J, Gervais D’Aldin C, Pujol R. Excitotoxicity and repair of cochlear synapses after noise trauma induced hearing loss. Neuroreport. 1998;9:2109–2114. doi: 10.1097/00001756-199806220-00037. [DOI] [PubMed] [Google Scholar]
- Rouiller EM, Wan XS, Moret V, Liang F. Mapping of c-fos expression elicited by pure tones stimulation in the auditory pathways of the rat, with emphasis on the cochlear nucleus. Neurosci Lett. 1992;144(1–2):19–24. doi: 10.1016/0304-3940(92)90706-D. [DOI] [PubMed] [Google Scholar]
- Saint Marie RL, Luo L, Ryan AF. Effects of stimulus frequency and intensity on c-fos mRNA expression in the adult rat auditory brainstem. J Comp Neurol. 1999;404(2):258–270. doi: 10.1002/(SICI)1096-9861(19990208)404:2<258::AID-CNE9>3.0.CO;2-U. [DOI] [PubMed] [Google Scholar]
- Säljö A, Bao F, Shi J, Hamberger A, Hansson HA, Haglid KG. Expression of c-Fos and c-Myc and deposition of beta-APP in neurons in the adult rat brain as a result of exposure to short-lasting impulse noise. J Neurotrauma Mar. 2002;19(3):379–385. doi: 10.1089/089771502753594945. [DOI] [PubMed] [Google Scholar]
- Sato K, Houtani T, Ueyama T, Ikeda M, Yamashita T, Kumazawa T, Sugimoto T. Identification of rat brainstem sites with neuronal Fos protein induced by acoustic stimulation with pure tones. Acta Otolaryngol Suppl. 1993;500:18–22. doi: 10.3109/00016489309126171. [DOI] [PubMed] [Google Scholar]
- Saunders JC, Dear SP, Schneider ME. The anatomical consequences of acoustic injury: a review and tutorial. J Acoust Soc Am. 1985;78:833–860. doi: 10.1121/1.392915. [DOI] [PubMed] [Google Scholar]
- Seidman MD, Shivapuja BG, Quirk WS. The protective effects of allopurinol and superoxide dismutase on noise-induced cochlear damage. Otolaryngolog Head Neck Surg. 1993;109:1052–1056. doi: 10.1177/019459989310900613. [DOI] [PubMed] [Google Scholar]
- Shore SE, Koehler S, Oldakowski M, Hughes LF, Syed S. Dorsal cochlear nucleus responses to somatosensory stimulation are enhanced after noise-induced hearing loss. Eur J Neurosci. 2008;27(1):155–168. doi: 10.1111/j.1460-9568.2007.05983.x. [DOI] [PMC free article] [PubMed] [Google Scholar]
- Stipanuk MH, Dominy JE, Jr, Lee JI, Coloso RM. Mammalian cysteine metabolism: new insights into regulation of cysteine metabolism. J Nutr. 2006;136(6 Suppl):1652S–1659S. doi: 10.1093/jn/136.6.1652S. [DOI] [PubMed] [Google Scholar]
- Sydserff SG, Borelli AR, Green AR, Cross AJ. Effect of NXY-059 on infarct volume after transient or permanent middle cerebral artery occlusion in the rat; studies on dose, plasma concentration and therapeutic time window. Br J Pharmacol. 2002;135:103–112. doi: 10.1038/sj.bjp.0704449. [DOI] [PMC free article] [PubMed] [Google Scholar]
- Van Campen LE, Murphy WJ, Franks JR, Mathias PI, Toraason MA. Oxidative DNA damage is associated with intense noise exposure in the rat. Hear Res. 2002;164:29–38. doi: 10.1016/S0378-5955(01)00391-4. [DOI] [PubMed] [Google Scholar]
- Wallhäusser-Franke E. Salicylate evokes c-fos expression in the brain stem: implications for tinnitus. Neuroreport. 1997;8:725–728. doi: 10.1097/00001756-199702100-00029. [DOI] [PubMed] [Google Scholar]
- Wang Y, Hirose K, Liberman MC. Dynamics of noise-induced cellular injury and repair in the mouse cochlea. J Assoc Res Otolaryngol. 2002;3:248–268. doi: 10.1007/s101620020028. [DOI] [PMC free article] [PubMed] [Google Scholar]
- Yamashita D, Jiang HY, Schacht J, Miller JM. Delayed production of free radicals following noise exposure. Brain Res. 2004;1019:201–209. doi: 10.1016/j.brainres.2004.05.104. [DOI] [PubMed] [Google Scholar]
- Yamasoba T, Schacht J, Shoji F, Miller JM. Attenuation of cochlear damage from noise trauma by an iron chelator, a free radical scavenger and glial cell line-derived neurotrophic factor in vivo. Brain Res. 1999;815:317–325. doi: 10.1016/S0006-8993(98)01100-7. [DOI] [PubMed] [Google Scholar]
- Yao WB, Zhao YQ, Abe T, Ohta J, Ubuka T. Effect of N-acetylcysteine administration on cysteine and glutathione contents in liver and kidney and in perfused liver of intact and diethyl maleate-treated rats. Amino Acids. 1994;3:255–266. doi: 10.1007/BF00807701. [DOI] [PubMed] [Google Scholar]
- Zeng C, Nannapaneni N, Zhou J, Hughes LF, Shore S. Cochlear damage changes the distribution of vesicular glutamate transporters associated with auditory and nonauditory inputs to the cochlear nucleus. J Neurosci. 2009;29:4210–4217. doi: 10.1523/JNEUROSCI.0208-09.2009. [DOI] [PMC free article] [PubMed] [Google Scholar]
- Zhang JS, Kaltenbach JA, Wang J, Kim SA. Fos-like immunoreactivity in auditory and nonauditory brain structures of hamsters previously exposed to intense sound. Exp Brain Res. 2003;153:655–660. doi: 10.1007/s00221-003-1612-4. [DOI] [PubMed] [Google Scholar]


