

Abstract
Age-related hearing loss (AHL) is characterized by a symmetric sensorineural hearing loss primarily in high frequencies and individuals have different levels of susceptibility to AHL. Heritability studies have shown that the sources of this variance are both genetic and environmental, with approximately half of the variance attributable to hereditary factors as reported by Huag and Tang (Eur Arch Otorhinolaryngol 267(8):1179–1191, 2010). Only a limited number of large-scale association studies for AHL have been undertaken in humans, to date. An alternate and complementary approach to these human studies is through the use of mouse models. Advantages of mouse models include that the environment can be more carefully controlled, measurements can be replicated in genetically identical animals, and the proportion of the variability explained by genetic variation is increased. Complex traits in mouse strains have been shown to have higher heritability and genetic loci often have stronger effects on the trait compared to humans. Motivated by these advantages, we have performed the first genome-wide association study of its kind in the mouse by combining several data sets in a meta-analysis to identify loci associated with age-related hearing loss. We identified five genome-wide significant loci (<10−6). One of these loci confirmed a previously identified locus (ahl8) on distal chromosome 11 and greatly narrowed the candidate region. Specifically, the most significant associated SNP is located 450 kb upstream of Fscn2. These data confirm the utility of this approach and provide new high-resolution mapping information about variation within the mouse genome associated with hearing loss.
Keywords: genome-wide association study, age-related hearing loss (ARL), meta-analysis, random-effects model, mouse models
INTRODUCTION
Age-related hearing impairment (AHL) is characterized by a symmetric sensorineural hearing loss primarily in the high frequencies. Age of onset, progression, and severity of AHL show great variation, but males are generally more affected than females. Approximately 35 % of people over the age of 65, and 50 % of octogenarians suffer from AHL (Gates and Mills 2005).
Heritability studies have shown that the sources of this variance are both genetic and environmental, with approximately half of the variance attributable to hereditary factors (Huang and Tang 2010). Only a limited number of large-scale genome-wide association studies (GWAS) for AHL have been undertaken in humans, to date. A first pooled genome-wide association study for AHL was carried out in a population consisting of eight subpopulations from six European countries. An association was found between AHL and SNPs within the GRM7 gene. This gene encodes the metabotropic glutamate receptor type7, which is activated through l-glutamate, the primary excitatory neurotransmitter in the auditory system (Friedman et al. 2009). This study was followed up in a US population and an association was found with GRM7 and AHL on several measures of central auditory function (Newman et al. 2012). A GWAS in 352 samples from the Sami, an isolated population originating from northern Finland, revealed no genome-wide significant associations for AHL, although the authors noted one SNP immediately downstream of the GRM7 gene among the most significant association signals (Van Laer et al. 2010).
As delineated above for AHL, the genetic analysis of human complex traits has been revolutionized by the ability to carry out association studies on a genome-wide basis. Such GWAS have been applied to numerous complex traits (Manolio et al. 2009; Altshuler et al. 2008). Despite these successes, the fraction of the genetic component that has been explained is relatively modest for most traits. Furthermore, formal proof that a specific variant is responsible for a given trait has proven difficult. Buoyed by the prospects and successes of human association studies, several groups have proposed mouse GWAS (Bennett et al. 2010; Ghazalpour et al. 2012; Valdar et al. 2006; Yalcin et al. 2010; Churchill et al. 2004; Flint and Eskin 2012; Mott and Flint 2013; Kirby et al. 2010). For obvious reasons, mouse models have several advantages over human studies. The environment can be more carefully controlled, measurements can be replicated in genetically identical animals, and the proportion of the variability explained by genetic variation is increased. Complex traits in mouse strains have been shown to have higher heritability and genetic loci often have stronger effects on the trait compared to humans (Lindblad-Toh et al. 2000; Wiltshire et al. 2003; Yalcin et al. 2004) Furthermore, several recently developed strategies for mouse genetic studies, such as use of the hybrid mouse diversity panel (HMDP), provide much higher resolution for associated loci than traditional approaches to quantitative trait loci (QTL) mapping (Bennett et al. 2010; Ghazalpour et al. 2012). In genome-wide association studies in humans, the use of meta-analysis is becoming more and more popular because one can virtually collect tens of thousands of individuals that will provide power to identify associated variants with small effect sizes (Hinds et al. 2013; Anttila et al. 2013; Berndt et al. 2013).
Motivated by the success in human studies, in this paper, we combine data sets from several studies by applying Meta-GxE (Kang et al. 2014), which is a meta-analytic approach based upon a random-effects model. This approach achieves high statistical power by modeling random effects (Han and Eskin 2011) in the effect sizes between studies, while it also corrects the population structure by employing mixed models. Utilizing a framework facilitating the interpretation of the results of the meta-analysis combining inbred strains within the HMDP, a QTL study mapping ahl8, and auditory-evoked potential data on common inbred strains (www.jax.org/), we are able to distinguish between the data sets predicted to have an effect, the data sets predicted not to have an effect, and the ambiguous studies that were underpowered (Han and Eskin 2012) for each locus. Several loci that we have identified with our combined analysis were not previously evident in any of the individual studies.
METHODS AND MATERIALS
Standard meta-analysis approach
Before describing the random effect model meta-analysis approach, we first describe the standard meta-analysis. In standard meta-analysis, we have N studies. In each of the N studies, we estimate the effect size of interest. Suppose that we estimate the genetic effect in study i,
 |
1 |
We can obtain the estimates of δi and its variance Vi. In the fixed effects model meta-analysis, we assume that the underlying effect sizes are the same as δ (δ = δ1 = … = δN). The best estimate of δ is the inverse variance-weighted effect size,
 |
2 |
Wi = 1/Vi is the so-called inverse variance. Then, we test the null hypothesis δ = 0 versus the alternative hypothesis δ ≠ 0.
Linear mixed models for association studies with structured population
Model organism such as the mouse are well-known to exhibit population structure or cryptic relatedness (Devlin et al. 2001; Voight and Pritchard 2005), where genetic similarities between individuals both inhibit the ability to find true associations and cause the appearance of a large number of false or spurious associations. In this case, mixed effects models are often used in order to correct this problem (Lange 2002; Yu et al. 2006; Kang et al. 2008; Lippert et al. 2013; Listgarten et al. 2013) instead of simple linear model shown in Eq. (1). Methods employing a mixed effects correction account for the genetic similarity between individuals with the introduction of a random variable into the traditional linear model.
 |
3 |
In the model in Eq. (3), yi represents the ni × 1 phenotype vector, μ is the phenotypic mean, δi is the genetic effect size, X is ni × 1 SNP vector, ϵ represents the residual error, and the random variable ui represents the vector of genetic contributions to the phenotype for individuals in population i. This random variable is assumed to follow a normal distribution with ui ∼ N(0, σ2gKi), where Ki is the ni × ni kinship coefficient matrix for population i. With this assumption, the total variance of yi is given by Σi = σ2gKi + σ2eI A z score statistic is derived for the test δi = 0 by noting the distribution of the estimate of  . In order to avoid complicated notation, we introduce a more basic matrix form of the model in Eq. (3), shown in Eq. (4).
 |
4 |
In Eq. (4), Si is a ni × 2 matrix with the first column being a vector of 1 s representing the global mean and the second vector is the vector and Γ is a 2 × 1 coefficient vector containing the mean αi and genotype effect (δi). We note that this form also easily extends to models with multiple covariates. The maximum likelihood estimate for Γ in population i is given by  which follows a normal distribution with a mean equal to the true Γ and variance (S′iΣ− 1iSi)− 1. The estimates of the effect size δi and standard error of the δi (SE(δi)) are then given in Eqs. (5) and (6), where R = [0 1] is a vector used to select the appropriate entry in the vector
 |
5 |
 |
6 |
Random effects model meta-analysis
Under the random effects model meta-analysis, we explicitly model heterogeneity by assuming a hierarchical model. We assume that the effect size of each study δi is a random variable picked by random from a distribution with the grand mean δ and the variance τ2,
 |
We recently developed a powerful random effects model, which addresses the problem of the conservative nature of traditional random effects model by assuming no heterogeneity under the null hypothesis (Han and Eskin 2011). This modification is natural because the effect size should be fixed to be zero under the null hypothesis. This random effects model tests the null hypothesis δ = 0 and τ2 = 0 versus the alternative hypothesis δ ≠ 0 or τ2 ≠ 0.
Similarly to the traditional random effect model (DerSimonian and Laird 1986), we use the likelihood ratio framework considering each statistic as a single observation. Since we assume no heterogeneity under the null, μ = 0 and τ2 = 0 under the null hypothesis. The likelihoods are then
 |
The maximum likelihood estimates  and
and  can be found by an iterative procedure suggested by Hardy and Thompson (Hardy and Thompson 1996). Then the likelihood ratio test statistic will be
 |
7 |
where δi = R(S′iΣ− 1iSi)− 1S′iΣ− 1iyi and Vi = [R(S′iΣ− 1iSi)− 1R′]. P values can be easily computed using precomputed tabulated values (Han and Eskin 2011).
Identifying studies with an effect
After identifying loci exhibiting interaction effects, we employ the meta-analysis interpretation framework that we recently developed. The m value (Han and Eskin 2012) is the posterior probability that the effect exists in each study. Suppose we have n number of studies we want to combine. Let E = [δ1, δ2, …, δn] be the vector of estimated effect sizes and V = [V1, V2, …, Vn] be the vector of estimated variance of n effect sizes. We assume that the effect size δi follows the normal distribution.
 |
8 |
 |
9 |
We assume that the prior for the effect size is
 |
10 |
A possible choice for σ in GWAS is 0.2 for small effect and 0.4 for large effect. We also denote Ci as a random variable whose value is 1 if a study i have an effect and 0 otherwise. We also denote C as a vector of Ci for n studies. Since C has n binary values, C can be 2n possible configurations. Let U = [c1, …, c2n] be a vector containing all the possible these configurations. We define m value mi as the probability P (Ci = 1|E), which is the probability of study i having an effect given the estimated effect sizes. We can compute this probability using the Bayes’ theorem in the following way.
 |
11 |
where Ui is a subset of U whose elements’ ith value is 1. Now we need to compute P (E|C = c) and P (C = c). P (C = c) can be computed as
 |
12 |
where |c| denotes the number of 1’s in c and B denotes the beta function and we set α and β as 1 (Han and Eskin 2012). The probability E given configuration c, P (E|C = c), can be computed as
 |
13 |
 |
14 |
 |
15 |
where c0 is the indices of 0 in c and c1 is the indices of 1 in c, N (δ; a, b) denotes the probability density function of the normal distribution with mean a and variance b. Wi = V− 1i is the inverse variance or precision and  is a scaling factor.
 |
16 |
All summations appeared for computing  ,
,  and
and  are with respect to j ∈ t1.
The m values have the following interpretations: small m values (0.1) represent a study that is predicted to not have an effect, large m values (0.9) represent a study that is predicted to have an effect; otherwise, it is ambiguous to make a prediction. It was previously reported that m values can accurately distinguish studies having an effect from the studies not having an effect (Han and Eskin 2012). For interpreting and understanding the result of the meta-analysis, it is informative to look at the P value and m value at the same time. We propose to apply the PM plot framework (Han and Eskin 2012), which plots the P and m values of each study together in two dimensions. For studies with an m value between 0.1 and 0.9, we cannot make a decision. One reason that studies are ambiguous (0.9 ≤ m value ≤ 0.1) is that they are underpowered due to small sample size. If the sample size increases, the study can be drawn to either the left or the right side.
ABR threshold testing
Auditory-evoked brainstem responses (ABR) of anesthetized mice were amplified and averaged and their wave patterns displayed on a computer screen. Auditory thresholds were obtained for each specific auditory stimulus by varying the sound pressure level (SPL) to identify the lowest level at which an ABR pattern could be recognized. The maximum SPL presented for all stimuli was 100 dB.
RESULTS
New loci discovered through random-effects meta-analysis
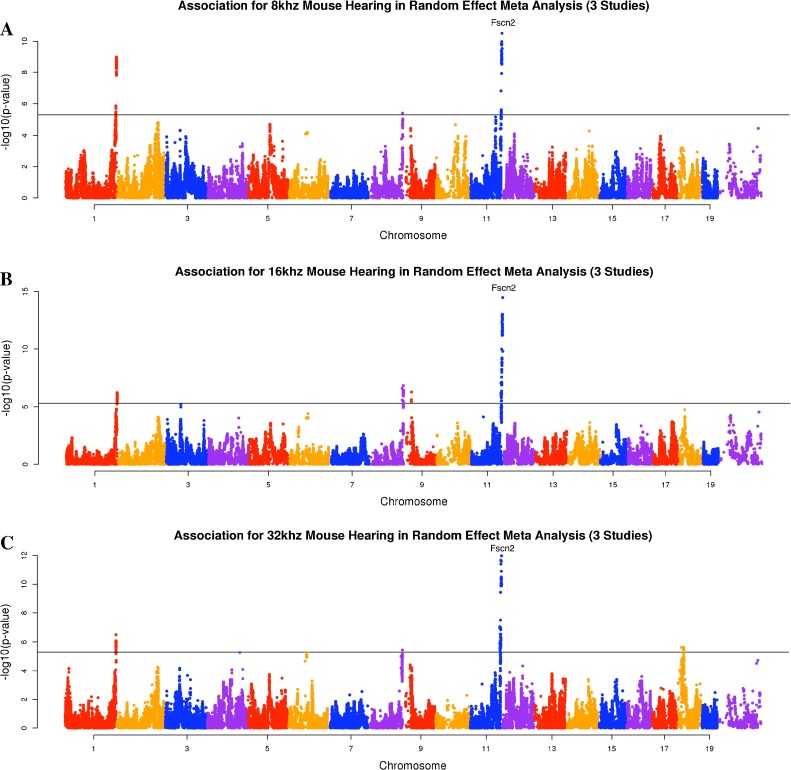
We combined heterogeneous phenotypic data sets (auditory-evoked potential (ABR) thresholds for 8, 16, and 32 kHz) including 226 classic inbred strains (Zheng male (M) and female (F) data) (Zheng et al. 2009; 1999), 387 N2 backcross mice (male (M) and female (F) data) from the ahl8 mapping study (Johnson et al. 2008), and 324 mice from our HMDP panel. The ages of mice at the time of testing were different in each study. Among these datasets, the Zheng dataset phenotyped animals at different ages which, as we show in our analysis, lead to confounding factors that likely cause spurious associations. Application of the random effect meta-analysis approach requires that we first compute the effect size and its standard deviation for each of the five studies using linear mixed model association mapping (Han and Eskin 2011; Furlotte et al. 2012). This strategy corrects for population structure underlying the data sets. Manhattan plots are often used to visualize the result of genome-wide association studies. Manhattan plots display the genomic coordinates along the x-axis and the negative logarithm of the association P value for each SNP along the y-axis. Figures 1, 2, and 3 show the Manhattan plots of five data sets for three hearing phenotypes (8, 16, and 32-kHz tone bursts). As seen in these figures, the Zheng data yield many association peaks, likely false positives secondary to insufficient power. Thus we excluded the Zheng data from the meta-analysis. We applied meta-analysis on the remaining three data sets (Johnson (F), Johnson (M), and HMDP (F)). Figure 4 shows the Manhattan plot combining these data for the three hearing phenotypes (8, 16, 32 kHz). Table 2 summarizes significant peaks from our meta-analysis for the three hearing phenotypes (8, 16, 32 kHz). The combined meta p value for the ahl8 locus is very significant at all frequencies tested.
FIG. 1.
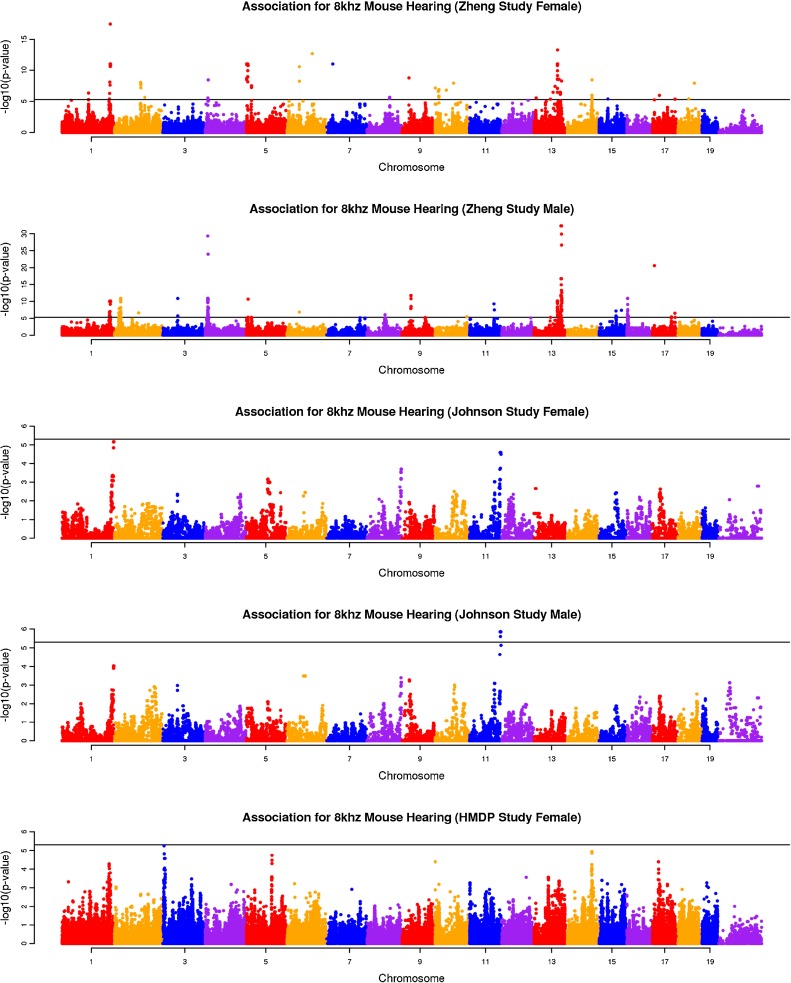
The association result of three studies for 8 kHz mouse hearing. The gray horizontal line represents the genome-wide significance threshold 5.0 × 10⁻⁶.
FIG. 2.
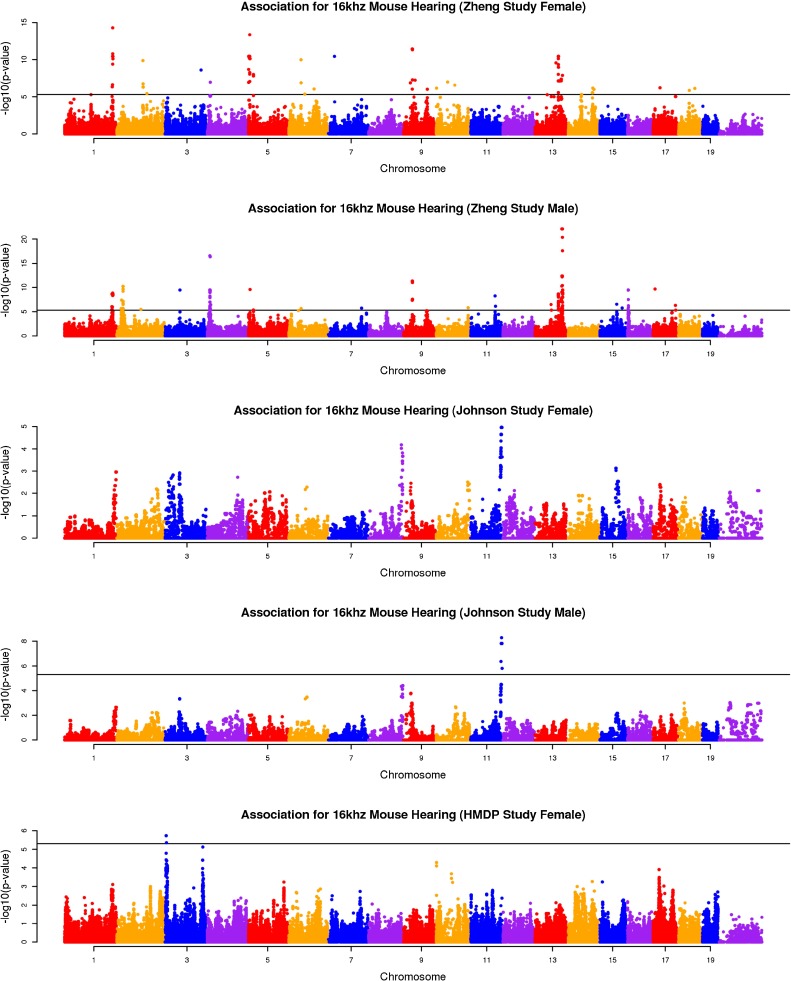
The association result of three studies for 16 kHz mouse hearing. The gray horizontal line represents the genome-wide significance threshold 5.0 × 10⁻⁶.
FIG. 3.
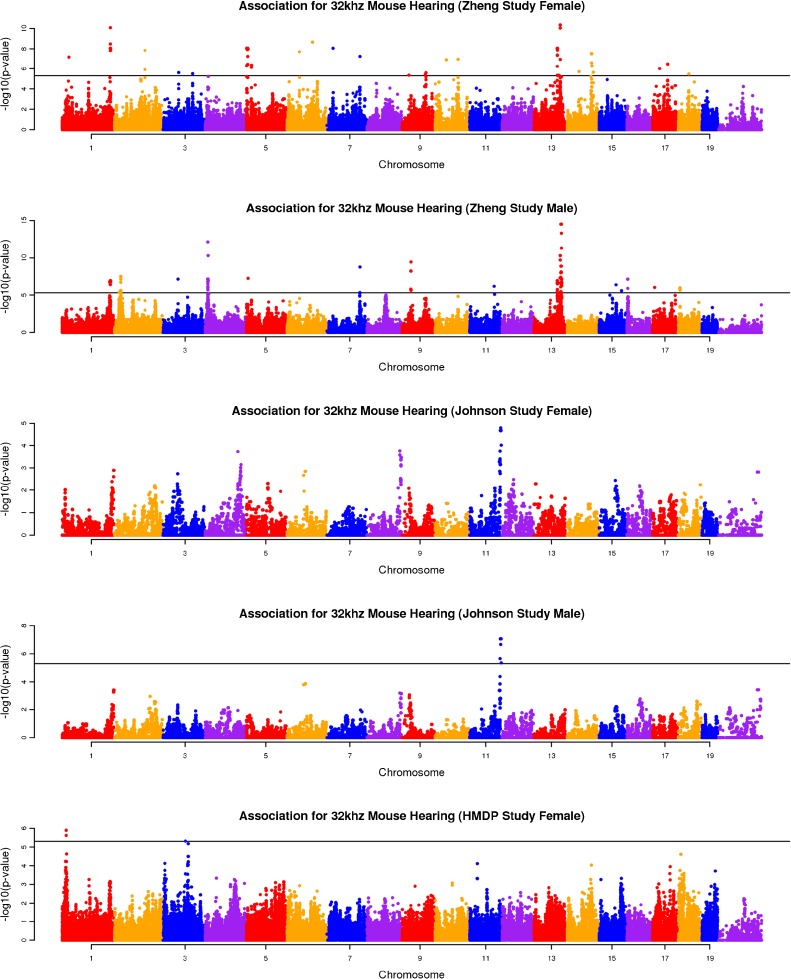
The association result of three studies for 32 kHz mouse hearing. The gray horizontal line represents the genome-wide significance threshold 5.0 × 10⁻⁶.
FIG. 4.
Mouse hearing association results from random effect meta-analysis. The gray horizontal line represents the genome-wide significance threshold 5.0 × 10⁻⁶.
TABLE 2.
Loci identified in meta-analysis
| 8 kHza | |||
| SNP location | Meta P | No. of studies with significant P | No. of Studies (E/A/N) |
| Chr1:196270162 | 1.05 × 10⁻⁹ | 1 | 2/3/0 |
| Chr8:130247700 | 3.92 × 10⁻⁶ | 0 | 2/2/1 |
| Chr11:120818214 | 3.08 × 10⁻¹¹ | 1 | 2/3/0 |
| 16 kHzb | |||
| SNP location | Meta P | No. of studies with significant P | No. of studies (E/A/N) |
| Chr1:196270162 | 5.97 × 10⁻⁷ | 0 | 3/2/0 |
| Chr8:130247700 | 1.54 × 10⁻⁷ | 0 | 2/2/1 |
| Chr9:30287464 | 5.25 × 10⁻⁷ | 0 | 3/2/0 |
| Chr11:120818214 | 3.32 × 10⁻¹⁵ | 1 | 5/0/0 |
| 32 kHzc | |||
| SNP location | Meta P | No. of studies with significant P | No. of studies (E/A/N) |
| Chr1:196270162 | 3.23 × 10⁻⁷ | 0 | 4/1/0 |
| Chr8:131366159 | 3.59 × 10⁻⁶ | 0 | 3/2/0 |
| Chr11:120818214 | 1.06 × 10⁻¹² | 1 | 3/2/0 |
| Chr18:24320393 | 2.32 × 10⁻⁶ | 0 | 3/2/0 |
E number of studies with an effect on the phenotype, A number of studies with an ambiguous effect, N number of studies without an effect
aThree significant loci were identified in the meta-analysis for the 8-kHz tone burst
bFour significant loci were identified in the meta-analysis for the 16-kHz tone burst
cThree significant loci were identified in the meta-analysis for the 32-kHz tone burst
We also examined the resolution of the association mapping of the 16-kHz ABR thresholds in our meta-analysis and compared this to the original QTL study reported by Johnson, et al. As seen in Figure 5, the meta-analysis resolution was approximately three orders of magnitude higher in comparison to the N2 cross study (Johnson et al. 2008), as the peak-associated SNP residing 450 kb upstream of the causative gene Fscn2.
FIG. 5.

This figure highlights the differences in resolution of our meta-analysis GWAS and the backcross QTL mapping strategy of Johnson et al. The results are shown for distal chromosome 11 (112–122 Mb, NCBI build m37) the ahl8 locus. Both approaches successfully identify an association in this region. However, as shown in the figure, the significant association from the N2 cross (Johnson et al. (2008)) implicates a broad region spanning more than 2.5 Mb. In contrast, the meta-analysis identified a peak-associated SNP approximately 450 kb upstream of Fscn2, the implicated gene at this locus. The horizontal line represents the genome-wide significance threshold 5.0 × 10⁻⁶.
The effect sizes, standard errors, and p values for the chromosome 11 locus are shown as forest plots in Figures 6, 7, and 8. In meta-analyses, Forest plots allow visualization of the relative strength of effect sizes between studies. The size of the black square and horizontal lines for each study in the Forest plot represents the precision of the effect size estimate and standard error of the effect size estimate, respectively. The diamond rectangle represents the summarized log odds ratio using all studies. While we excluded the Zheng data due to possible confounding effects, we include it in the Forest plots to aid in the interpretation of the significant peaks. Similar effect sizes in the Zheng data compared to the other studies for the chromosome 11 peak suggest that even in the presence of confounding factors, the effect is present in the Zheng data.
FIG. 6.

(A) Forest plot and (B) PM plot for Chr11:120818214 locus (8 kHz). The Forest plot and PM plot shows the effect size estimates and m value from each study. The black square represents the effect size estimate and the size of the square represents the weights given to each study. The width of line in each study represents the confidence interval (CI) for effect size estimate. The diamond located at the bottom of the Forest plot shows the overall effect size estimate and the width of the diamond shows the confidence intervals for the overall effect estimate. The m value of the study represents the posterior probability that the effect of this locus exists for the phenotype. The horizontal dotted line in the PM plot denotes the genome-wide significance threshold (5.0 × 10⁻⁶). The two vertical dotted lines in the PM plot denote the posterior probability threshold for m value (0.1 and 0.9). The color dots for each study in the Forest plot and PM plot shows the posterior probability that a genetic effect exists for the study. Meta P denotes the P value obtained by the random effect meta-analysis.
FIG. 7.

(A) Forest plot and (B) PM plot for Chr11:120818214 locus (16 kHz).
FIG. 8.

(A) Forest plot and (B) PM plot for Chr11:120818214 locus (32 kHz).
Interpreting meta-analysis using posterior probabilities
As seen in the tables and figures, the presence of the effect may not be reflected in the study-specific p value due to a lack of statistical power. Therefore, it is difficult to distinguish if an effect is absent in a particular study due to a gene-by-environment interaction at the locus or a lack of power. In order to identify which studies have effects, we utilize a statistic called the m value (Han and Eskin 2012), which estimates the posterior probability of an effect being present in a study given the observations from all other studies. We visualize the results through a PM plot, in which p values (y-axis) are simultaneously visualized with the m values (x-axis) at each tested locus. These plots allow us to identify in which studies genetic variation at the locus has an effect and in which it does not. M values for a given variant have the following interpretation: a study with a small m value (≤0.1) is predicted not to be affected by the variant, while a study with a large m value (≥0.9) is predicted to be affected by the variant. Whether or not an effect is present for a study with an m value between 0.1 and 0.9 is ambiguous. The m values are also displayed by the study name near the forest plot where the color dot on the left-hand side of the study name provides information about the m value. A red dot indicates that the study’s m value is greater than 0.9, a blue dot represents that the study’s m value is less than 0.1, and a green dot represents that the study’s m value is between 0.1 and 0.9.
The PM plots for the chromosome 11 locus for each tested frequency are shown in Figures 6b and 8b. If we only look at the separate study p values (y-axis), we can conclude that this locus only has an effect for 8 kHz in the Johnson (F) cohort. However, if we look at m value (x-axis), then we find two studies (Johnson (F) and Johnson (M)), where we predict that the variation has an effect, while in the other three studies, we predict there is no effect. For the 16 kHz trait, we see only the Johnson (M) and (F) cohorts have an effect individually but if we consider the m values all 5 demonstrate an effect at this locus. Lastly, for the 8-kHz trait, only the Johnson (M) cohort has an individual effect but taken in aggregate three studies, Johnson (M and F) and HMDP (F) have an effect at this locus.
In Tables 1, 2, and 3, the column E/A/N summarizes the m values for each associated peak providing the counts of the number of studies where there is a predicted effect (E), the number of studies where the effect is ambiguous (A) and the number of studies where we predict that the effect is not present (N). A comparison of this column compared to the column providing the count of the studies with a significant p value shows that, using the m value predicts significantly more studies that have an effect compared with the p value alone. This is consistent with the fact that each individual study is underpowered.
TABLE 1.
Details of the three cohorts used in the meta-analysis
| Study | Mice tested | Total no. of mice | Ages tested | Reference |
|---|---|---|---|---|
| Zheng Study (M/F) | 47 CI Strains | 226 | 16–39 weeks | Zheng et al. (1999) |
| Johnson Study (M/F) | (B6 × D2) × D2 | 387 | 6 and 13 weeks | Johnson et al. (2008) |
| HMDP Study (F) | 42 CI/RI strains | 280 | 6 weeks | Bennett et al. (2010) |
M = males, F = females
TABLE 3.
Genetic factors that contribute to age-related hearing loss in inbred mouse strains
| AHL locus (gene) | Chr | Location | Mapping methods* | Known strains with susceptibility allele | Known strains with resistance allele | References |
|---|---|---|---|---|---|---|
| ahl(Cdh23) | 10 | 60 Mb | Backcross, strain haplotypes | Many | Many | (Johnson et al. 1997) (Johnson et al. 2000) (Noben-Trauth et al. 2003) |
| ahl4 (Cs) | 10 | 120–130 Mb | RI, CS strains backcross | A/J | C57BL/6J, CAST/Ei | (Zheng et al. 2009) (Johnson et al. 2012) |
| ahl5 (Gipc3) | 10 | 81 Mb | Backcross intercross | Black Swiss | CAST/Ei | (Drayton and Noben-Trauth 2006) (Charizopoulou et al. 2011) |
| ahl8 (Fscn2) | 11 | 120 Mb | RI strains backcross | DBA/2J | C57BL/6J | (Johnson et al. 2008) (Shin et al. 2010) |
| Gpr98, G protein coupled receptor 9 | 13 | 81 Mb | Backcross | BUB/BnJ | CAST/Ei | (Johnson et al. 2005) |
| mtDNA (mt-tr) | Mitochondria | Backcross | A/J | CAST/Ei | (Johnson et al. 2001) | |
CS chromosome substitution; RI recombinant inbred
Through forest plot, we can easily see which study shows a strong effect on the hearing phenotype at this locus and which study does not show an effect on the hearing phenotype at this locus. One interesting observation is that for 16-kHz hearing phenotype in Figure 7, the log odds ratio of the effect size of all five studies is very close (around 0.5). This is strong evidence that an effect of the locus Chr11:120818214 on mouse hearing ability is likely to be real biological signal. For two other hearing phenotypes (8 and 32 kHz) shown in Figures 6 and 8, the forest plots show weak effect size in two Johnson studies. Figures 9, 10, 11, and 12 show the forest and PM plots for all of the discovered loci for each of the phenotypes.
FIG. 9.

(A) Forest plot and (B) PM plot for Chr1:196270162 locus (8 kHz).
FIG. 10.

(A) Forest plot and (B) PM plot for Chr8:130247700 locus (8 kHz).
FIG. 11.

(A) Forest plot and (B) PM plot for Chr9:30287464 locus (16 kHz).
FIG. 12.

(A) Forest plot and (B) PM plot for Chr18:24320393 locus (32 kHz).
Novel loci identified in meta-analysis
Our approach discovered an additional four loci for AHL in mice. What is evident from the data in Table 2 is the power of the meta-analysis approach to identify additional loci in the combined data set that would have gone unrecognized in the individual studies due to insufficient power. As seen in Table 2, all but one of the cohorts in the meta-analysis detected SNP associations with the 8-kHz trait whereas in the individual cohorts, only two of the five were significant. For the 16 and 32-kHz traits, only one study was powered to detect an association at the ahl8 locus by itself, whereas three studies showed association in the meta-analysis. The other loci would have gone unrecognized without the combined analysis.
Lastly, a look at the meta-analysis data reveals that there are three loci associated with the 8-kHz trait on chromosomes 1, 8, and 11. However, for the 16 and 32-kHz studies, there are additional loci on chromosomes 9 and 18, respectively. This underlies the complexity of the hearing phenotype, its polygenic nature, and the likely effects of genetic variation on specific regions of the cochlea. The identification of an additional locus for the 32-kHz trait is also interesting in light of the fact that the Fscn2 BAC transgenic rescue of the ahl8-associated hearing loss in DBA/2J was successful at all frequencies except 32 kHz. It is possible that a locus on chromosome 18 may contribute to DBA/2J hearing loss. Equally plausible, given the size of the BAC transgenic, there may be additional genes in the ahl8 interval contributing to the phenotype.
The resolution in mouse association studies is limited by the size of linkage disequilibrium blocks. For the loci reported here, these blocks span roughly 2 Mb (consistent with average LD blocks in previous HMDP studies (Davis et al. 2013; Bennett et al. 2010) and contain a number of potential candidates including membrane transporter genes, transcription factors, and neurotransmitter receptors. Many of the genes within the intervals are expressed in the cochlea (data not shown) complicating candidate selection to some degree; however, the gene lists are relatively small and serve as a starting point for gene discovery. Snhl2, an AHL locus identified in a backcross between ALR/LtJ and C3HeB/FeJ mapped to chromosome 1 (133–172 Mb) is nearby and these data may serve to refine this locus or may represent an additional locus (Latoche et al. 2011). The two loci, Hfhl3 on chromosome 9 and ahl6 on chromosome 18, map closely to the regions identified in our meta-analysis (Keller and Noben-Trauth 2012; Drayton and Noben-Trauth 2006). In contrast, although Hfhl2 maps to chromosome 8, it is very proximal to the locus identified in our study and likely represents a novel locus (Keller et al. 2011).
DISCUSSION
In this paper, we used a recently developed meta-analysis approach that can be applied to a large number of heterogeneous studies each conducted in different environments with animals from different genetic backgrounds, different genders, and different ages at the time of testing. We show the practical utility of the proposed method by applying it to five mouse AHL studies containing 937 samples, and we successfully identify several loci involved in AHL in the mouse, including the known locus, ahl8. Consistent with the results of meta-analysis in human studies, our combined study recognized loci that were not discovered in any of the individual studies.
Part of the reason for our success in identifying a several loci is that our study combined multiple mouse studies using fundamentally different mapping strategies. Over the past few years, many new strategies have been proposed beyond the traditional F2 cross (Flint and Eskin 2012) which include the HMDP (Bennett et al. 2010; Ghazalpour et al. 2012), heterogeneous outbred stocks (Valdar et al. 2006), commercially available outbred mice (Yalcin et al. 2010), and the collaborative cross (Churchill et al. 2004). In our current study, we are combining data from two HMDP strategies with an N2 backcross. The meta-analysis benefits from the statistical power and resolution advantages of this combination (Furlotte et al. 2012).
There are currently known 17 autosomal loci and one mitochondrial locus for AHL in mice (hearingimpairment.jax.org). As shown in Table 3, of these 18 loci, only 6 have been characterized at the gene level illustrating the inherent difficulties in traditional gene mapping studies. Much of the progress in the genetics of hearing disorders in the mouse has come from the application of linkage analysis (i.e., QTL analysis) to identify naturally occurring single gene mutations (Mendelian traits) and the analysis of targeted gene deletions. Little attention has been directed towards the definition of the genetics of common hearing disorders. Classical genetic approaches have been used to identify several QTLs that are associated with AHL in mice. However, one of the most significant shortcomings of QTL analysis is the use of a limited resource (i.e., a segregating F2 population). Another limitation of this approach is the genomic resolution, typically on the order of 10 Mb or greater. Hence, further progress with these strategies depends upon execution of large-scale fine-mapping crosses wherein several thousand N2 or F2 animals are screened for recombination within the region of interest. Following this several generations of subcongenic lines must be established followed by progeny testing. This process can take years of effort and never achieve the resolution necessary to identify individual genes or causal variants. In this manuscript, we have demonstrated the utility of GWAS using a meta-analysis approach for the high-resolution mapping of loci associated with AHL in the mouse. Subsequent studies will include a replication of this experiment utilizing the entire HMDP and the selection of candidate genes based upon cochlear QTL information, cochlear gene expression, and genes known to be associated with hearing loss in either mouse or humans. Since the mouse inner ear is functionally and genetically very similar to the human ear, these studies will facilitate the identification of genes and pathways associated with AHL in humans.
Acknowledgments
J.O., X.L., and R.F. are supported by the National Institutes of Health grants NIDCD R01DC010856-01. E.Y.K., J.W.J, F.H., and E.E. are supported by the National Science Foundation grants 0513612, 0731455, 0729049, 0916676, and 1065276, and the National Institutes of Health grants K25-HL080079, U01-DA024417, P01-HL30568, and PO1-HL28481. Q.Y.Z is supported by the US National Institutes of Health grants NIDCD R01DC009246.
Conflict of Interest
The authors declare that they have no conflict of interest.
Footnotes
Jeffrey Ohmen and Eun Yong Kang contributed equally to this work.
References
- Altshuler D, Daly MJ, Lander ES. Genetic mapping in human disease. Science. 2008;322(5903):881–888. doi: 10.1126/science.1156409. [DOI] [PMC free article] [PubMed] [Google Scholar]
- Anttila V, Winsvold BS, Gormley P, Kurth T, Bettella F, McMahon G, et al. Genome-wide meta-analysis identifies new susceptibility loci for migraine. Nat Genet. 2013;45(8):912–917. doi: 10.1038/ng.2676. [DOI] [PMC free article] [PubMed] [Google Scholar]
- Bennett BJ, Farber CR, Orozco L, Kang HM, Ghazalpour A, Siemers N, Neubauer M, Neuhaus I, Yordanova R, Guan B, Truong A, Yang W-PP, He A, Kayne P, Gargalovic P, Kirchgessner T, Pan C, Castellani LW, Kostem E, Furlotte N, Drake TA, Eskin E, Lusis AJ. A high-resolution association mapping panel for the dissection of complex traits in mice. Genome Res. 2010;20(2):281–290. doi: 10.1101/gr.099234.109. [DOI] [PMC free article] [PubMed] [Google Scholar]
- Berndt SI, Skibola CF, Joseph V, Camp NJ, Nieters A, Wang Z, et al. Genome-wide association study identifies multiple risk loci for chronic lymphocytic leukemia. Nat Genet. 2013;45(8):868–876. doi: 10.1038/ng.2652. [DOI] [PMC free article] [PubMed] [Google Scholar]
- Charizopoulou N, Lelli A, Schraders M, Ray K, Hildebrand MS, Ramesh A, Srisailapathy CRS, Oostrik J, Admiraal RJC, Neely HR, Latoche JR, Smith RJH, Northup JK, Kremer H, Holt JR, Noben-Trauth K (2011) Gipc3 mutations associated with audiogenic seizures and sensorineural hearing loss in mouse and human. Nat Commun 2:201 [DOI] [PMC free article] [PubMed]
- Churchill GA, Airey DC, Allayee H, Angel JM, Attie AD, Beatty J, Beavis WD, Belknap JK, Bennett B, Berrettini W, Bleich A, Bogue M, Broman KW, Buck KJ, Buckler E, Burmeister M, Chesler EJ, Cheverud JM, Clapcote S, Cook MN, Cox RD, Crabbe JC, Crusio WE, Darvasi A, Deschepper CF, Doerge RW, Farber CR, Forejt J, Gaile D, Garlow SJ, Geiger H, Gershenfeld H, Gordon T, Gu J, Gu W, de Haan G, Hayes NL, Heller C, Himmelbauer H, Hitzemann R, Hunter K, Hsu H-CC, Iraqi FA, Ivandic B, Jacob HJ, Jansen RC, Jepsen KJ, Johnson DK, Johnson TE, Kempermann G, Kendziorski C, Kotb M, Kooy RF, Llamas B, Lammert F, Lassalle J-MM, Lowenstein PR, Lu L, Lusis A, Manly KF, Marcucio R, Matthews D, Medrano JF, Miller DR, Mittleman G, Mock BA, Mogil JS, Montagutelli X, Morahan G, Morris DG, Mott R, Nadeau JH, Nagase H, Nowakowski RS, O’Hara BF, Osadchuk AV, Page GP, Paigen B, Paigen K, Palmer AA, Pan H-JJ, Peltonen-Palotie L, Peirce J, Pomp D, Pravenec M, Prows DR, Qi Z, Reeves RH, Roder J, Rosen GD, Schadt EE, Schalkwyk LC, Seltzer Z, Shimomura K, Shou S, Sillanpää MJ, Siracusa LD, Snoeck H-WW, Spearow JL, Svenson K, Tarantino LM, Threadgill D, Toth LA, Valdar W, de Villena FP-M, Warden C, Whatley S, Williams RW, Wiltshire T, Yi N, Zhang D, Zhang M, Zou F, Consortium CT. The collaborative cross, a community resource for the genetic analysis of complex traits. Nat Genet. 2004;36(11):1133–1137. doi: 10.1038/ng1104-1133. [DOI] [PubMed] [Google Scholar]
- Davis RC, van Nas A, Bennett B, Orozco L, Pan C, Rau CD, Eskin E, Lusis AJ. Genome-wide association mapping of blood cell traits in mice. Mamm Genome. 2013;24(3–4):105–118. doi: 10.1007/s00335-013-9448-0. [DOI] [PMC free article] [PubMed] [Google Scholar]
- DerSimonian R, Laird N. Meta-analysis in clinical trials. Control Clin Trials. 1986;7(3):177–188. doi: 10.1016/0197-2456(86)90046-2. [DOI] [PubMed] [Google Scholar]
- Devlin B, Roeder K, Bacanu S-A. Unbiased methods for population-based association studies. Genet Epidemiol. 2001;21(4):273–284. doi: 10.1002/gepi.1034. [DOI] [PubMed] [Google Scholar]
- Drayton M, Noben-Trauth K. Mapping quantitative trait loci for hearing loss in black swiss mice. Hear Res. 2006;212(1–2):128–139. doi: 10.1016/j.heares.2005.11.006. [DOI] [PubMed] [Google Scholar]
- Flint J, Eskin E. Genome-wide association studies in mice. Nat Rev Genet. 2012;13(11):807. doi: 10.1038/nrg3335. [DOI] [PMC free article] [PubMed] [Google Scholar]
- Friedman RA, Van Laer L, Huentelman MJ, Sheth SS, Van Eyken E, Corneveaux JJ, Tembe WD, Halperin RF, Thorburn AQ, Thys S, Bonneux S, Fransen E, Huyghe J, Pyykkö I, Cremers CWRJ, Kremer H, Dhooge I, Stephens D, Orzan E, Pfister M, Bille M, Parving A, Sorri M, Van de Heyning PH, Makmura L, Ohmen JD, Linthicum FH, Fayad JN, Pearson JV, Craig DW, Stephan DA, Van Camp G. Grm7 variants confer susceptibility to age-related hearing impairment. Hum Mol Genet. 2009;18(4):785–796. doi: 10.1093/hmg/ddn402. [DOI] [PMC free article] [PubMed] [Google Scholar]
- Furlotte NA, Kang EY, Van Nas A, Farber CR, Lusis AJ, Eskin E. Increasing association mapping power and resolution in mouse genetic studies through the use of meta-analysis for structured populations. Genetics. 2012;191(3):959–967. doi: 10.1534/genetics.112.140277. [DOI] [PMC free article] [PubMed] [Google Scholar]
- Gates GA, Mills JH. Presbycusis. Lancet. 2005;366(9491):1111–1120. doi: 10.1016/S0140-6736(05)67423-5. [DOI] [PubMed] [Google Scholar]
- Ghazalpour A, Rau CD, Farber CR, Bennett BJ, Orozco LD, van Nas A, Pan C, Allayee H, Beaven SW, Civelek M, Davis RC, Drake TA, Friedman RA, Furlotte N, Hui ST, Jentsch JD, Kostem E, Kang HM, Kang EY, Joo JW, Korshunov VA, Laughlin RE, Martin LJ, Ohmen JD, Parks BW, Pellegrini M, Reue K, Smith DJ, Tetradis S, Wang J, Wang Y, Weiss JN, Kirchgessner T, Gargalovic PS, Eskin E, Lusis AJ, LeBoeuf RC. Hybrid mouse diversity panel: a panel of inbred mouse strains suitable for analysis of complex genetic traits. Mamm Genome. 2012;23(9–10):680–692. doi: 10.1007/s00335-012-9411-5. [DOI] [PMC free article] [PubMed] [Google Scholar]
- Han B, Eskin E. Random-effects model aimed at discovering associations in meta-analysis of genome-wide association studies. Am J Hum Genet. 2011;88(5):586–598. doi: 10.1016/j.ajhg.2011.04.014. [DOI] [PMC free article] [PubMed] [Google Scholar]
- Han B, Eskin E. Interpreting meta-analyses of genome-wide association studies. PLoS Genet. 2012;8(3):e1002555. doi: 10.1371/journal.pgen.1002555. [DOI] [PMC free article] [PubMed] [Google Scholar]
- Hardy RJ, Thompson SG. A likelihood approach to meta-analysis with random effects. Stat Med. 1996;15(6):619–629. doi: 10.1002/(SICI)1097-0258(19960330)15:6<619::AID-SIM188>3.0.CO;2-A. [DOI] [PubMed] [Google Scholar]
- Hinds DA, McMahon G, Kiefer AK, Do CB, Eriksson N, Evans DM, St Pourcain B, Ring SM, Mountain JL, Francke U, Davey-Smith G, Timpson NJ, Tung JY (2013). A genome-wide association meta-analysis of self-reported allergy identifies shared and allergy-specific susceptibility loci. Nat Genet [DOI] [PMC free article] [PubMed]
- Huang Q, Tang J. Age-related hearing loss or presbycusis. Eur Arch Otorhinolaryngol. 2010;267(8):1179–1191. doi: 10.1007/s00405-010-1270-7. [DOI] [PubMed] [Google Scholar]
- Johnson KR, Erway LC, Cook SA, Willott JF, Zheng QY. A major gene affecting age-related hearing loss in c57bl/6j mice. Hear Res. 1997;114(1–2):83–92. doi: 10.1016/S0378-5955(97)00155-X. [DOI] [PubMed] [Google Scholar]
- Johnson KR, Zheng QY, Erway LC. A major gene affecting age-related hearing loss is common to at least ten inbred strains of mice. Genomics. 2000;70(2):171–180. doi: 10.1006/geno.2000.6377. [DOI] [PubMed] [Google Scholar]
- Johnson KR, Zheng QY, Bykhovskaya Y, Spirina O, Fischel-Ghodsian N. A nuclear-mitochondrial dna interaction affecting hearing impairment in mice. Nat Genet. 2001;27(2):191–194. doi: 10.1038/84831. [DOI] [PMC free article] [PubMed] [Google Scholar]
- Johnson KR, Zheng QY, Weston MD, Ptacek LJ, Noben-Trauth K. The mass1frings mutation underlies early onset hearing impairment in bub/bnj mice, a model for the auditory pathology of usher syndrome iic. Genomics. 2005;85(5):582–590. doi: 10.1016/j.ygeno.2005.02.006. [DOI] [PMC free article] [PubMed] [Google Scholar]
- Johnson KR, Longo-Guess C, Gagnon LH, Yu H, Zheng QY. A locus on distal chromosome 11 (ahl8) and its interaction with cdh23 ahl underlie the early onset, age-related hearing loss of dba/2j mice. Genomics. 2008;92(4):219–225. doi: 10.1016/j.ygeno.2008.06.007. [DOI] [PMC free article] [PubMed] [Google Scholar]
- Johnson KR, Gagnon LH, Longo-Guess C, Kane KL. Association of a citrate synthase missense mutation with age-related hearing loss in a/j mice. Neurobiol Aging. 2012;33(8):1720–1729. doi: 10.1016/j.neurobiolaging.2011.05.009. [DOI] [PMC free article] [PubMed] [Google Scholar]
- Kang HM, Zaitlen NA, Wade CM, Kirby A, Heckerman D, Daly MJ, Eskin E. Efficient control of population structure in model organism association mapping. Genetics. 2008;178(3):1709. doi: 10.1534/genetics.107.080101. [DOI] [PMC free article] [PubMed] [Google Scholar]
- Kang EY, Han B, Furlotte N, Joo JW, Shih D, Davis CR, Lusis JA, Eskin E. Meta-analysis identifies gene-by-environment interactions as demonstrated in a study of 4,965 mice. PLoS Genet. 2014;10(1):e1004022. doi: 10.1371/journal.pgen.1004022. [DOI] [PMC free article] [PubMed] [Google Scholar]
- Keller JM, Noben-Trauth K. Genome-wide linkage analyses identify hfhl1 and hfhl3 with frequency-specific effects on the hearing spectrum of nih swiss mice. BMC Genet. 2012;13:32. doi: 10.1186/1471-2156-13-32. [DOI] [PMC free article] [PubMed] [Google Scholar]
- Keller JM, Neely HR, Latoche JR, Noben-Trauth K. High-frequency sensorineural hearing loss and its underlying genetics (hfhl1 and hfhl2) in nih swiss mice. J Assoc Res Otolaryngol. 2011;12(5):617–631. doi: 10.1007/s10162-011-0270-7. [DOI] [PMC free article] [PubMed] [Google Scholar]
- Kirby A, Kang HM, Wade CM, Cotsapas C, Kostem E, Han B, Furlotte N, Kang EY, Rivas M, Bogue MA, Frazer KA, Johnson FM, Beilharz EJ, Cox DR, Eskin E, Daly MJ. Fine mapping in 94 inbred mouse strains using a high-density haplotype resource. Genetics. 2010;185(3):1081–1095. doi: 10.1534/genetics.110.115014. [DOI] [PMC free article] [PubMed] [Google Scholar]
- Lange K (2002) Mathematical and statistical methods for genetic analysis. Springer Verlag
- Latoche JR, Neely HR, Noben-Trauth K. Polygenic inheritance of sensorineural hearing loss (snhl2, -3, and -4) and organ of corti patterning defect in the alr/ltj mouse strain. Hear Res. 2011;275(1-2):150–159. doi: 10.1016/j.heares.2010.12.017. [DOI] [PMC free article] [PubMed] [Google Scholar]
- Lindblad-Toh K, Winchester E, Daly MJ, Wang DG, Hirschhorn JN, Laviolette JP, Ardlie K, Reich DE, Robinson E, Sklar P, Shah N, Thomas D, Fan JB, Gingeras T, Warrington J, Patil N, Hudson TJ, Lander ES. Large-scale discovery and genotyping of single-nucleotide polymorphisms in the mouse. Nat Genet. 2000;24(4):381–386. doi: 10.1038/74215. [DOI] [PubMed] [Google Scholar]
- Lippert C, Quon G, Kang EY, Kadie CM, Listgarten J, Heckerman D (2013) The benefits of selecting phenotype-specific variants for applications of mixed models in genomics. Scientific Reports, 3 [DOI] [PMC free article] [PubMed]
- Listgarten J, Lippert C, Kang EY, Xiang J, Kadie CM, Heckerman D. A powerful and efficient set test for genetic markers that handles confounders. Bioinformatics. 2013;29(12):1526–1533. doi: 10.1093/bioinformatics/btt177. [DOI] [PMC free article] [PubMed] [Google Scholar]
- Manolio TA, Collins FS, Cox NJ, Goldstein DB, Hindorff LA, Hunter DJ, McCarthy MI, Ramos EM, Cardon LR, Chakravarti A, Cho JH, Guttmacher AE, Kong A, Kruglyak L, Mardis E, Rotimi CN, Slatkin M, Valle D, Whittemore AS, Boehnke M, Clark AG, Eichler EE, Gibson G, Haines JL, Mackay TFC, McCarroll SA, Visscher PM. Finding the missing heritability of complex diseases. Nature. 2009;461(7265):747–753. doi: 10.1038/nature08494. [DOI] [PMC free article] [PubMed] [Google Scholar]
- Mott R, Flint J (2013) Dissecting quantitative traits in mice. Annu Rev Genomics Hum Genet [DOI] [PubMed]
- Newman DL, Fisher LM, Ohmen J, Parody R, Fong C-TT, Frisina ST, Mapes F, Eddins DA, Robert Frisina D, Frisina RD, Friedman RA. Grm7 variants associated with age-related hearing loss based on auditory perception. Hear Res. 2012;294(1–2):125–132. doi: 10.1016/j.heares.2012.08.016. [DOI] [PMC free article] [PubMed] [Google Scholar]
- Noben-Trauth K, Zheng QY, Johnson KR. Association of cadherin 23 with polygenic inheritance and genetic modification of sensorineural hearing loss. Nat Genet. 2003;35(1):21–23. doi: 10.1038/ng1226. [DOI] [PMC free article] [PubMed] [Google Scholar]
- Shin J-BB, Longo-Guess CM, Gagnon LH, Saylor KW, Dumont RA, Spinelli KJ, Pagana JM, Wilmarth PA, David LL, Gillespie PG, Johnson KR. The r109h variant of fascin-2, a developmentally regulated actin crosslinker in hair-cell stereocilia, underlies early-onset hearing loss of dba/2j mice. J Neurosci. 2010;30(29):9683–9694. doi: 10.1523/JNEUROSCI.1541-10.2010. [DOI] [PMC free article] [PubMed] [Google Scholar]
- Valdar W, Solberg LC, Gauguier D, Burnett S, Klenerman P, Cookson WO, Taylor MS, Rawlins JNP, Mott R, Flint J. Genome-wide genetic association of complex traits in heterogeneous stock mice. Nat Genet. 2006;38(8):879–887. doi: 10.1038/ng1840. [DOI] [PubMed] [Google Scholar]
- Van Laer L, Huyghe JR, Hannula S, Van Eyken E, Stephan DA, Mäki-Torkko E, Aikio P, Fransen E, Lysholm-Bernacchi A, Sorri M, Huentelman MJ, Van Camp G. A genome-wide association study for age-related hearing impairment in the saami. Eur J Hum Genet. 2010;18(6):685–693. doi: 10.1038/ejhg.2009.234. [DOI] [PMC free article] [PubMed] [Google Scholar]
- Voight BF, Pritchard JK. Confounding from cryptic relatedness in case-control association studies. PLoS Genet. 2005;1(3):e32. doi: 10.1371/journal.pgen.0010032. [DOI] [PMC free article] [PubMed] [Google Scholar]
- Wiltshire T, Pletcher MT, Batalov S, Barnes SW, Tarantino LM, Cooke MP, Wu H, Smylie K, Santrosyan A, Copeland NG, Jenkins NA, Kalush F, Mural RJ, Glynne RJ, Kay SA, Adams MD, Fletcher CF. Genome-wide single-nucleotide polymorphism analysis defines haplotype patterns in mouse. Proc Natl Acad Sci U S A. 2003;100(6):3380–3385. doi: 10.1073/pnas.0130101100. [DOI] [PMC free article] [PubMed] [Google Scholar]
- Yalcin B, Willis-Owen SAG, Fullerton J, Meesaq A, Deacon RM, Rawlins JNP, Copley RR, Morris AP, Flint J, Mott R. Genetic dissection of a behavioral quantitative trait locus shows that rgs2 modulates anxiety in mice. Nat Genet. 2004;36(11):1197–1202. doi: 10.1038/ng1450. [DOI] [PubMed] [Google Scholar]
- Yalcin B, Nicod J, Bhomra A, Davidson S, Cleak J, Farinelli L, Osterras M, Whitley A, Yuan W, Gan X, Goodson M, Klenerman P, Satpathy A, Mathis D, Benoist C, Adams DJ, Mott R, Flint J. Commercially available outbred mice for genome-wide association studies. PLoS Genet. 2010;6(9):e1001085. doi: 10.1371/journal.pgen.1001085. [DOI] [PMC free article] [PubMed] [Google Scholar]
- Yu J, Pressoir G, Briggs WH, Vroh Bi I, Yamasaki M, Doebley JF, McMullen MD, Gaut BS, Nielsen DM, Holland JB, Kresovich S, Buckler ES. A unified mixed-model method for association mapping that accounts for multiple levels of relatedness. Nat Genet. 2006;38(2):203–208. doi: 10.1038/ng1702. [DOI] [PubMed] [Google Scholar]
- Zheng QY, Johnson KR, Erway LC. Assessment of hearing in 80 inbred strains of mice by abr threshold analyses. Hear Res. 1999;130(1–2):94–107. doi: 10.1016/S0378-5955(99)00003-9. [DOI] [PMC free article] [PubMed] [Google Scholar]
- Zheng QY, Ding D, Yu H, Salvi RJ, Johnson KR. A locus on distal chromosome 10 (ahl4) affecting age-related hearing loss in a/j mice. Neurobiol Aging. 2009;30(10):1693–1705. doi: 10.1016/j.neurobiolaging.2007.12.011. [DOI] [PMC free article] [PubMed] [Google Scholar]