ABSTRACT
Recent psychophysical studies suggest that normal-hearing (NH) listeners can use acoustic temporal-fine-structure (TFS) cues for accurately discriminating shifts in the fundamental frequency (F0) of complex tones, or equal shifts in all component frequencies, even when the components are peripherally unresolved. The present study quantified both envelope (ENV) and TFS cues in single auditory-nerve (AN) fiber responses (henceforth referred to as neural ENV and TFS cues) from NH chinchillas in response to harmonic and inharmonic complex tones similar to those used in recent psychophysical studies. The lowest component in the tone complex (i.e., harmonic rank N) was systematically varied from 2 to 20 to produce various resolvability conditions in chinchillas (partially resolved to completely unresolved). Neural responses to different pairs of TEST (F0 or frequency shifted) and standard or reference (REF) stimuli were used to compute shuffled cross-correlograms, from which cross-correlation coefficients representing the degree of similarity between responses were derived separately for TFS and ENV. For a given F0 shift, the dissimilarity (TEST vs. REF) was greater for neural TFS than ENV. However, this difference was stimulus-based; the sensitivities of the neural TFS and ENV metrics were equivalent for equal absolute shifts of their relevant frequencies (center component and F0, respectively). For the F0-discrimination task, both ENV and TFS cues were available and could in principle be used for task performance. However, in contrast to human performance, neural TFS cues quantified with our cross-correlation coefficients were unaffected by phase randomization, suggesting that F0 discrimination for unresolved harmonics does not depend solely on TFS cues. For the frequency-shift (harmonic-versus-inharmonic) discrimination task, neural ENV cues were not available. Neural TFS cues were available and could in principle support performance in this task; however, in contrast to human-listeners’ performance, these TFS cues showed no dependence on N. We conclude that while AN-fiber responses contain TFS-related cues, which can in principle be used to discriminate changes in F0 or equal shifts in component frequencies of peripherally unresolved harmonics, performance in these two psychophysical tasks appears to be limited by other factors (e.g., central processing noise).
Keywords: temporal fine structure, temporal envelope, auditory nerve, phase locking, fundamental frequency, pitch
INTRODUCTION
The question of how the pitch of complex tones is encoded in the auditory system has been an active topic of research for at least half a century (Plack et al. 2005). According to “spectral” or “place-based” models, the auditory system estimates the pitch of complex tones using a form of spectral pattern matching that could be excitation based (Wightman 1973; Terhardt 1974; Cedolin and Delgutte 2010), or could be based on phase locking to individual harmonics (Goldstein 1973). One limitation of this type of model is that it requires the presence of detectable spectral peaks or temporal fine structure (TFS) related to individual harmonics in the peripheral representation. Due to the limited frequency resolution in the cochlea, salient spectral peaks in the peripheral representation are only observed for harmonics with relatively low ranks, which are then referred to as “resolved” (Houtsma and Smurzynski 1990; Shackleton and Carlyon 1994; Plack and Oxenham 2005; Moore and Gockel 2011). Another limitation of spectral-pattern models is that the physiological nature of the template matching procedure is unclear and somewhat hypothetical. In contrast, unresolved harmonics give rise to prominent oscillations in the temporal envelope (ENV) corresponding to the pitch period, i.e., temporal cues for pitch perception.
Temporal models of pitch perception rely on the fact that auditory-nerve (AN) fibers can phase lock to the TFS and the temporal ENV of stimulus waveforms, as reflected in the distributions of inter-spike intervals (ISIs; Rose et al. 1969; Moore 2012) or in the related autocorrelation function (ACF) (Meddis and Hewitt 1992; Cariani and Delgutte 1996; Meddis and O'Mard 1997). ISIs can be used to infer the fundamental frequency (F0) of resolved harmonics indirectly, by first estimating the frequency of each harmonic based on the distribution of ISIs in AN fibers that respond primarily—or exclusively—to this harmonic and then combining the individual harmonic-frequency estimates thus obtained to infer the F0 of the stimulus (Srulovicz and Goldstein 1983). ISIs can also be used, in principle, to infer the F0 of unresolved harmonics directly, using the fact that spikes coinciding with TFS peaks located under distinct ENV maxima are separated in time by approximately one F0 period, or an integer multiple thereof (Schouten et al. 1962; Moore et al. 2006b; Santurette and Dau 2011).
The results from several recent psychophysical studies have been interpreted as evidence that (a) normal-hearing (NH) listeners rely on TFS peaks under ENV maxima to accurately discriminate F0 or frequency shifts for unresolved harmonics (Moore et al. 2009; Moore and Sek 2009a, 2011) and (b) hearing-impaired (HI) listeners are less able to do so, suggesting a “TFS-processing deficit” in the latter (Moore et al. 2006a; Hopkins and Moore 2007). These studies have led to the development of clinical tests for the diagnosis of these deficits in HI listeners (Moore and Sek 2009b). However, the neurophysiological basis of the putative deficits is not clear (Kale and Heinz 2010; Henry and Heinz 2013). Moreover, the evidence that NH listeners actually rely on TFS peaks under ENV maxima when discriminating F0, or frequency shifts, has been questioned (Oxenham et al. 2009; Micheyl et al. 2010).
A quantitative evaluation of the temporal information present in AN responses to the stimuli used in these psychophysical studies may help to clarify the interpretation of the results of those studies in terms of TFS or ENV cues. To this aim, the responses of single AN fibers to bandpass-filtered complex tones differing either in F0 or by a constant frequency shift of all components, as in the psychoacoustical studies of Moore and colleagues (e.g., Moore et al. 2009), were recorded in NH chinchillas. Using shuffled correlogram analyses introduced in previous studies (Joris 2003), the TFS and ENV cues that were present in the neural responses were quantified to determine whether these cues could account for the levels and patterns of performance observed in the psychophysical studies.
METHODS
Single-fiber AN recordings were obtained in nine NH male chinchillas aged between 6 months and 2 years. All animal care and use procedures were approved by the Purdue Animal Care and Use Committee (PACUC).
Surgical procedures and neurophysiological recordings
Surgical procedures and single-unit recording methods similar to the ones described in Kale and Heinz (2010) were used and are thus only briefly described here. Animals were anesthetized by xylazine (1–1.5 mg/kg im) and ketamine (50–65 mg/kg im). Atropine (0.1 mg/kg im) was given to control mucus secretions, and eye ointment was used to prevent drying of the eyes. Following the anesthesia, a catheter was placed in the cephalic vein to allow intravenous injections of sodium pentobarbital (∼7.5 mg/kg/h iv) as supplemental anesthetic. Physiological saline (2–5 ml/h) and lactated Ringer’s solution (20–30 ml/24 h) were given intravenously to prevent dehydration. Animal temperature was maintained at 37 °C with a feedback-controlled heating pad. The bulla was vented with a 30-cm-long polyethylene tube to maintain the middle ear pressure (Guinan and Peake 1967). Following a tracheotomy, a craniotomy was performed in posterior fossa, and the cerebellum was partially aspirated. The remaining part of the cerebellum was retracted to expose the AN. AN-fiber recordings were made (with 10-μs resolution, in a sound-attenuating booth) with 10–30 MΩ glass micropipette electrodes filled with 3 M NaCl. Acoustic stimuli delivered monaurally through a hollow ear bar were calibrated within a few millimeters of the tympanic membrane. AN fibers were first isolated using a broadband-noise “search” stimulus with a level of approximately 20 dB re 20 μPa/√Hz. Tuning curves were measured using the algorithm described in Chintanpalli and Heinz (2007), and the fiber’s characteristic frequency (CF), threshold, and Q10 were estimated (see Kale and Heinz 2010 for details).
Stimuli
Neurophysiological data collection
The stimuli were complex tones, similar to those that have been used in recent psychophysical studies to investigate the role of TFS in F0- and frequency-shift discrimination (e.g., Moore et al. 2009). The “reference” (REF) stimulus was produced by summing harmonics two through 30 of an F0 that was adjusted based on the fiber’s CF, as described below. Stimuli were filtered through a fifth-order Butterworth filter with a 3-dB bandwidth that was approximately equal to 5F0. The passband was arithmetically centered on the CF of the fiber. The REF stimulus F0 was set to CF/(N + 2), so that the Nth component was the lowest in the passband of the stimulus filter, and the (N + 2)th component was at the CF. Harmonic rank values of N = 2, 4, 6, and 20 were tested. For example, for a fiber with a CF of 1,000 Hz and N = 2 (F0 = 250 Hz), the 3-dB passband of the Butterworth filter contained components with frequencies ranging from 500 to 1,500 Hz, while for N = 20 (F0 = 45.5 Hz), the 3-dB passband contained components with frequencies ranging from 909.1 to 1,090.9 Hz. The starting phases of the harmonics were either drawn at random from a uniform (0–2π) distribution (RAND phase) or were constant and equal to π/2 radians (COS phase, or 0 radians relative to cosine phase). When REF and test (TEST) stimuli had individual components added in random phase, the stimuli for neural recordings were frozen for 40–50 repetitions for each condition, i.e., for each change in F0 (for harmonic TEST stimuli) or each constant frequency shift of individual harmonics (when the TEST stimulus was inharmonic).
For each REF stimulus, two sets of TEST stimuli were generated. Each TEST stimulus set had three shift conditions. The TEST stimuli in the first set were produced by changing the F0 of the REF stimulus, e.g., by 0.04, 0.1, and 0.5 %. Thus, these TEST stimuli were harmonic. By contrast, the second set of TEST stimuli were generated by shifting the frequencies of all components in the REF stimulus upwards by a fixed amount in hertz, e.g., by 0.04, 0.1, and 0.5 % of the reference F0. Therefore, the TEST stimuli in this set were inharmonic. TEST stimuli were also bandpass filtered as described above, but with a different center frequency equal to the (N + 2)th component of the shifted stimulus. Although the center frequency of the bandpass filter was the same for REF and TEST stimuli in the psychophysical studies (e.g., Moore et al. 2009), the small shifts used in the present study minimize the significance of this difference.
The seven stimuli (one REF, three harmonic TEST, and three inharmonic TEST stimuli) were presented both in positive and negative polarity. Thus, a total of 56 stimulus conditions (7 stimuli × 2 polarities × 4 N values) were presented to each fiber in an interleaved manner, either in COS phase or in RAND phase. Moreover, in a subset of fibers (15), both phase conditions and only two N values (N = 2 and N = 20) were tested. Each stimulus was 500 ms long (including 10-ms cosine ramps) and was presented between 40 and 50 times (to a given fiber) with an inter-stimulus interval of 250 ms. When both REF and TEST stimuli were harmonic, the experimental design was similar to that used in a perceptual F0-discrimination task. When the REF stimulus was harmonic (H) and the TEST stimulus was inharmonic (I), the experimental design was similar to that used in a harmonic–inharmonic discrimination task, or frequency-shift discrimination task for complex tones (e.g., Hopkins and Moore 2007); the latter task is henceforth referred to as H–I discrimination.
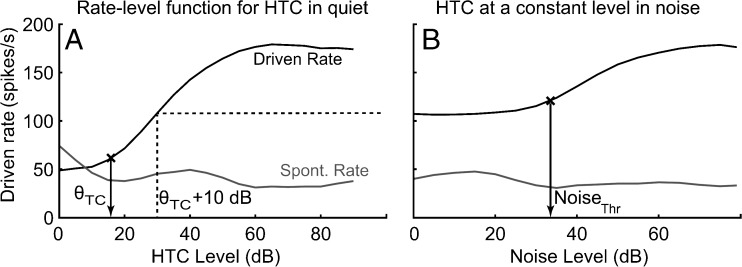
The stimuli were presented in a broadband (15-kHz bandwidth) white-noise background. Similar to a recent perceptual study (Moore and Sek 2009a), the noise level was set to 10 dB below a “masking” threshold. The threshold was determined by first measuring the level at which the REF stimulus produced a discharge rate 10 spikes/s higher than the spontaneous rate; this first threshold is denoted as θTC in Figure 1A. The REF stimulus was then presented at 10 dB above θTC, and the level of the broadband noise was then varied in 5-dB steps. The level corresponding to a change of 10 spikes/s from the REF-stimulus-evoked discharge rate was taken as the threshold (NoiseThr) at which the tone complex was just masked by the noise (Fig. 1B).
FIG. 1.
The noise level for neural recordings was chosen based on the noise threshold for masking, which was determined for each AN fiber from measured rate-level functions. A Illustrative rate-level function for a harmonic tone complex (HTC) in quiet. HTC threshold (θ TC) was defined as the sound level at which the REF-stimulus response was 10 spikes/s higher than the spontaneous rate. B Illustrative HTC-in-noise rate-level function; HTC level was constant at θ TC + 10 dB. The noise threshold for masking (NoiseThr) was defined as the noise level corresponding to a change of 10 spikes/s from the REF-stimulus-evoked discharge rate (horizontal dashed line).
AN-model simulations
In psychophysical studies in which complex tones with components added in random phase have been used, the component phases were usually randomized on each stimulus presentation (e.g., Moore and Sek 2009a). The purpose of such randomization is to eliminate envelope cues that could otherwise support above-chance performance in the task. This cannot be done on a trial-by-trial basis in physiological single-unit recording experiments, where each stimulus must be repeated for several tens of presentations (in this study, between 40 and 50) to obtain reliable estimates of relevant quantities, and each AN fiber can only be recorded from for a relatively short period of time (∼15 min/fiber on average). For example, for a harmonic tone complex where each of the individual components had different starting phases (i.e., random phase, or RAND condition), the stimulus is frozen for 40–50 repetitions to collect neural data. The 40–50 repetitions represent a single trial from a perceptual study. In contrast, in perceptual studies, phases are either constant, or randomized afresh on every trial.
To circumvent the problem of limited neural recording time, we used a phenomenological model of the auditory periphery, cochlea, and auditory nerve (Zilany and Bruce 2006, 2007). This model has been rigorously tested against physiological single-unit data and has been shown to capture most of the non-linear properties of AN-fiber responses, including those related to cochlear compression and two-tone suppression, as well as broadened tuning and BF shifts with increasing stimulus level (Zhang et al. 2001; Tan and Carney 2003). One limitation of the model version used here is that, although it captures the qualitative effects related to envelope coding, it somewhat underestimates the overall strength of envelope coding compared to physiological data (Zilany et al. 2009). However, these quantitative differences in envelope coding strength are not expected to produce qualitatively different conclusions in this study. The neural-ENV metric used here (described below) is self-normalized and therefore would not be greatly affected by a small increase in overall ENV coding strength.
The model input consisted of complex-tone stimuli generated in a way similar to that described above. The model output for a given fiber CF consisted of spike trains in response to those stimuli. The stimulus conditions that were used in the physiological experiments were also tested in the model, with a few modifications. In particular, a larger number of F0- and frequency-shift conditions were tested, with shifts ranging from 0.04 to 50 % of F0 (eight shifts in total). For each stimulus condition, 40 simulations were performed. Each simulation involved the generation of 45–50 spike trains, so that shuffled correlogram analyses (as described below) could be performed. For the random-phase condition, a different set of random starting phases was used for each simulation.
All stimuli were presented to the model at the pre-determined best modulation level (BML) calculated separately for each N condition and each fiber. The best modulation level is defined as the sound level yielding the maximum strength of phase locking to the envelope of the amplitude modulated stimulus (see Kale and Heinz 2010 for details). Presenting the stimuli at the BML ensures that phase locking to ENV is maximum and is not affected by the choice of the sound level. Secondly, since phase locking to TFS (or to the carrier) increases rapidly with sound level within the first 10–15 dB above threshold and then asymptotes near the maximum phase locking strength, using the BML also ensures strong phase locking to TFS. All stimuli were presented to the model in background noise. Noise levels were determined based on simulated rate-level functions for the complex tone in noise, as described earlier (see Fig. 1). As in the physiological experiments, the level of the background noise was set 10 dB below the noise level required to mask the responses of the model to the tone complexes.
Data analyses
Responses to harmonic and inharmonic tone complexes were analyzed using shuffled correlogram analyses, which allow for the separation of neural responses to the envelope and TFS of the stimulus (Joris 2003). Shuffled auto-correlograms (SACs) were computed by tallying inter-spike intervals across spike trains obtained in response to a single polarity of the stimulus. Shuffled cross-polarity correlograms (SCCs) were obtained by computing inter-spike intervals across spike trains obtained in response to the positive and negative polarities of the stimulus. The difcor functions, which represent the coding of TFS information in AN-fiber responses, were obtained by taking the arithmetic difference between the previously computed SACs and SCCs. The sumcor functions, which represent envelope-related information in AN-fiber responses, were obtained by averaging SACs and SCCs (Louage et al. 2004; Kale and Heinz 2010). Determination of the frequencies present in the TFS and ENV responses was facilitated by computing and examining the Fourier transforms of the difcor and sumcor functions, respectively, which represent the associated power spectral densities (PSDs).
To quantify the degree of similarity of TFS information between the responses of single AN fibers to the REF and TEST stimuli, a within-fiber across-stimulus neural cross-correlation coefficient for TFS (ρTFS) was computed (see Eq. 1 in Heinz and Swaminathan 2009). Each cross-correlation computation for one CF was between the responses of that single fiber to the REF and TEST conditions. The interpretation of the ρTFS computed from the difcors is similar to that of the Pearson correlation coefficient between two random variables. Values of ρTFS close to 1 indicated a higher degree of similarity in TFS responses (and hence poorer discriminability) between the REF and TEST stimuli based on the TFS information encoded by the AN fiber. Similarly, a neural cross-correlation coefficient for envelope (ρENV) was computed from the sumcor (see Eq. 2 in Heinz and Swaminathan 2009) to quantify the discriminability of REF and TEST based on envelope cues encoded by individual fibers. The “noise floor” for these correlation coefficients has been estimated to be equal to 0.1 or lower (see Fig. 3 in Heinz and Swaminathan 2009), meaning that ρTFS (or ρENV) values larger than 0.1 indicate significant correlations between the REF and TEST difcors (or sumcors).
RESULTS
Characterization of the AN fibers
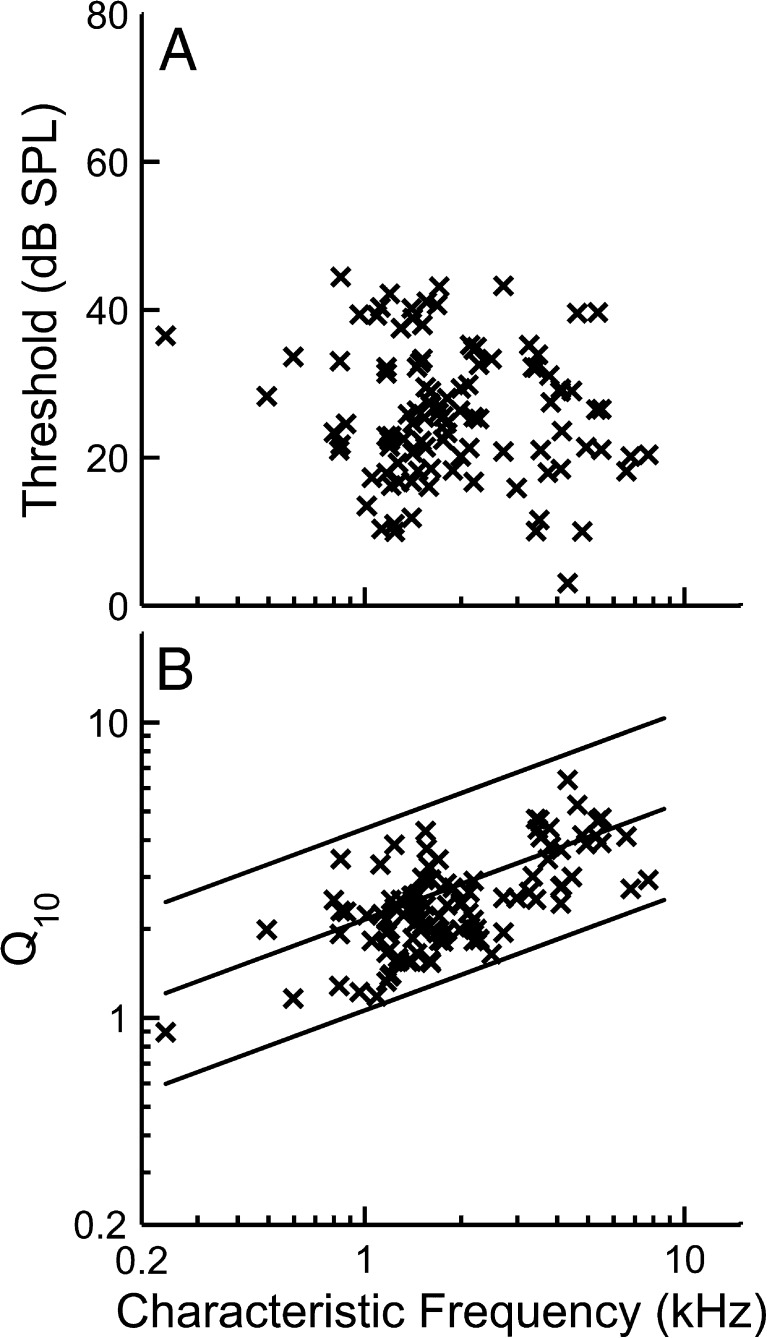
AN-fiber sensitivity and frequency selectivity were quantified by measuring fiber thresholds and tuning-curve bandwidths. Figure 2 shows the pure-tone thresholds (Fig. 2 A) and Q10 values (Fig. 2 B) that were computed based on the tuning curves measured in 95 AN fibers. The solid lines in Figure 2 B indicate 5, 50, and 95 % confidence intervals for normal-hearing fibers computed from a larger population of AN fibers obtained in our previous study (Kale and Heinz 2010).
FIG. 2.
Tuning-curve characteristics as a function of characteristic frequency (CF). A Fiber thresholds at CF. B Tuning-curve sharpness as represented by Q 10 (ratio of CF to bandwidth 10 dB above threshold). Solid lines represent the 5th, 50th, and 95th percentiles of a large normal-hearing population (Kale and Heinz 2010).
Examples of difcor and sumcor spectral density functions
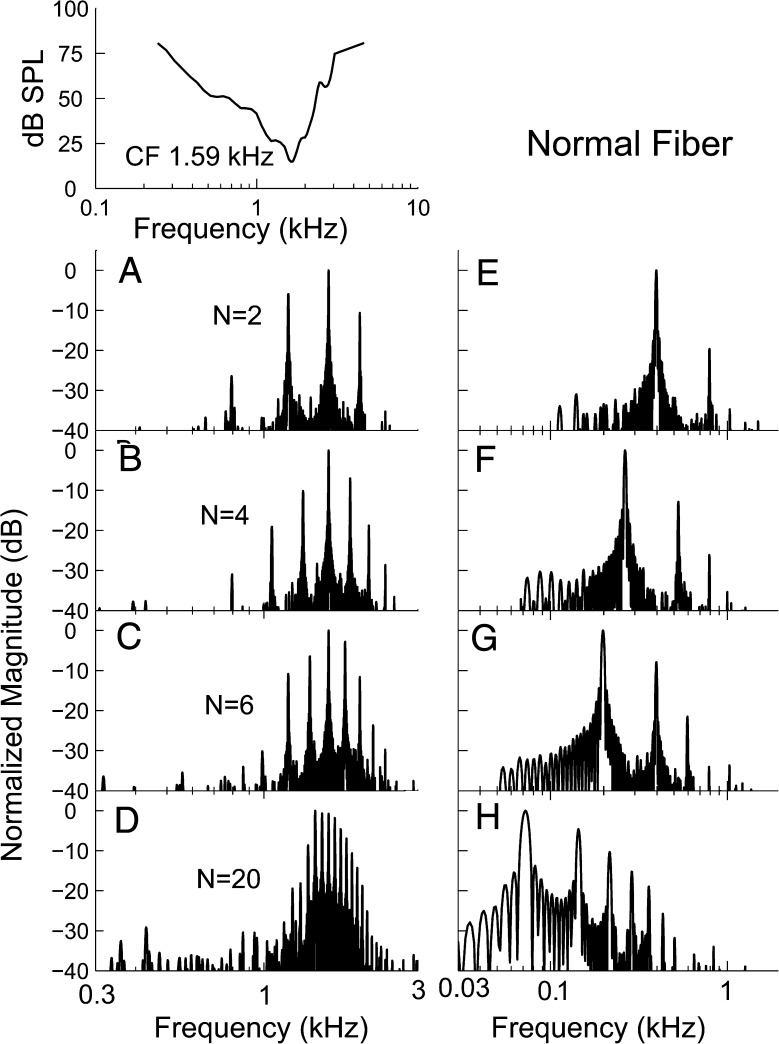
Figure 3 shows representative examples of difcor (left-hand column) and sumcor (right-hand column) PSDs computed using the responses of one AN fiber (CF = 1.59 kHz) to REF (harmonic) stimuli for N ranging from 2 (top) to 20 (bottom). For N = 2, three components, corresponding to the three stimulus components with frequencies closest to the CF of the fiber (1,192.5, 1,590, and 1,987.5 Hz), were apparent in the difcor PSD (Fig. 3 A). As N increased from 2 to 20, the number of components in the difcor PSD increased, reflecting an increase in the number of stimulus components falling within the passband of the fiber’s receptive field (Fig. 3 B–D). In all N conditions, the most prominent component in the difcor PSD corresponded to the stimulus component closest to the CF (1.59 kHz). The most prominent component in the sumcor PSD corresponded to the F0 (Fig. 3 E–H). As N increased from 2 to 20, the frequency of the largest component in the sumcor PSD shifted downward, reflecting the decrease in F0 from 397.5 Hz (for N = 2) to 72.3 Hz (for N = 20). In addition to this F0 component, the sumcor PSDs showed a second peak at 2F0, i.e., one octave above the F0 component (Fig. 3 E). For N values higher than 2 (Fig. 3 F–H), the sumcor PSD also contained other components, with frequencies corresponding to integer multiples of the F0. These sumcor components reflect beats between stimulus components interacting with each other in the cochlea. Thus, for every fiber we could successfully simulate the resolvability conditions in chinchillas ranging from “partial resolvability” (N = 2) of the components to “complete unresolvability” (N = 20). Although components are generally thought to be resolved in the human ear for N = 2 (Houtsma and Smurzynski 1990), broadened tuning in chinchillas compared to the tuning in humans (Shera et al. 2010) makes the N = 2 condition only partially resolved, consistent with recent perceptual data from chinchillas (Shofner 2011).
FIG. 3.
The most dominant TFS response component was near CF. A–D Normalized power spectra of difcor functions, representing the TFS response. E, F Normalized power spectra for sumcor functions, representing the ENV response. Each row represents a rank condition (N) shown in the middle of each of the panels A–D. The tuning curve for the fiber is shown above panel A.
Discriminability of F0 shifts in AN-fiber responses
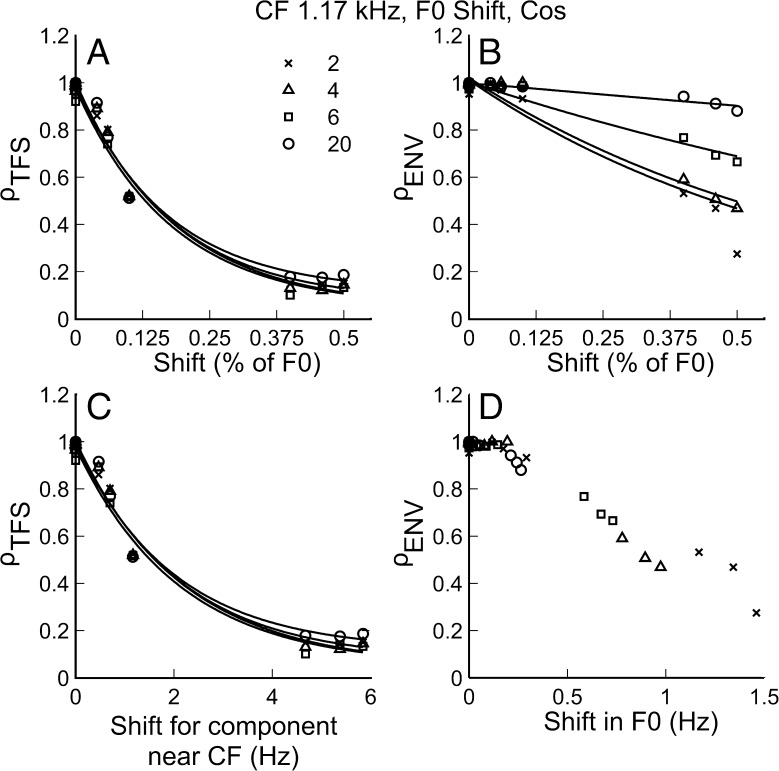
Figure 4 shows the neural cross-correlation coefficients, ρTFS (in panels A and C) and ρENV (in panels B and D), plotted as a function of F0 shift (ΔF0) for complex tones with harmonics in COS phase. The results shown are for a single fiber with CF = 1.17 kHz. The different harmonic rank (N) conditions are indicated by different symbols. In the upper two panels (A and B), ΔF0 is expressed as a percent of the F0, which is the unit most commonly used for reporting F0DLs in psychophysical studies (e.g., Moore et al. 2009). In the lower two panels (C and D), the coefficients are plotted as a function of the shift in hertz of the relevant frequency, i.e., the center component for ρTFS and F0 for ρENV. The similarity of panels A and C (ρTFS) can be explained simply by the fact that CF was the same for all values of N, and a shift in F0 of x% of F0 is equivalent to an x% shift in all component frequencies (e.g., the component at CF for each N).
FIG. 4.
Both envelope and TFS cues were available for F0 discrimination. A ρ TFS as a function of ΔF0 in percent of F0 (same as % of CF). C ρ TFS as a function of shift in hertz for a component near the CF of the fiber. B ρ ENV as a function of ΔF0 (in % of F0) and D ρ ENV as a function of ΔF0 in hertz. Different harmonic rank conditions are indicated by different symbols. Data in panels A, B, and C are fitted with two-term exponential functions just to emphasize general trends.
As expected, the correlation coefficients generally decreased as ΔF0 increased. This indicates that as the F0 difference between the REF and TEST stimuli became larger, the two stimuli induced more dissimilar temporal neural responses. Although this trend was observed for both ρTFS and ρENV, comparing panels A and B in Figure 4, it can be seen that ρTFS dropped more steeply with increasing ΔF0 (in % of F0) than did ρENV: For ΔF0 = 0.5 % of F0, ρTFS was at (or close to) the “noise floor” (0.1), whereas most measured ρENV values were still well above this floor. However, it is important to note that a given ΔF0 in percent of F0 corresponds to a larger shift (in Hz) of the frequency of the harmonic closest to CF than the shift (in Hz) of the envelope frequency (F0). When ρTFS and ρENV are plotted as a function of the shift in hertz of the relevant frequency for each cue (panels C and D), the decline in ρENV is as steep as, or steeper than, the decline in ρTFS.
Regardless of whether the shift was expressed in percent or in hertz, the decrease in ρTFS with increasing ΔF0 was similar across the different N conditions. By contrast, the decrease in ρENV with increasing ΔF0 was found to depend markedly on N (shallower for higher N values) when ΔF0 was expressed in percent of F0 (Fig. 4B). In contrast, the decrease in ρENV with increasing ΔF0 appeared to be quite similar across the different N values when ΔF0 was expressed in hertz. A simple explanation for these results is that both ρTFS and ρENV depend primarily on the absolute size (in Hz) of the shifts in their relevant frequency, i.e., the component frequency closest to CF for ρTFS and the F0 for ρENV. Thus, absolute shift in hertz of the relevant frequency provides a more appropriate predictor of these correlation coefficients.
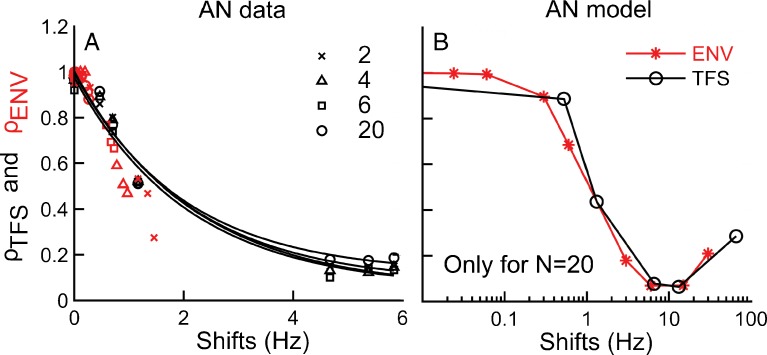
In Figure 5A, the ρENV data as a function of F0 shift in hertz (from Fig. 4D) are superimposed on the ρTFS data as a function of the shift in hertz of the center (near-CF) TFS component (from Fig. 4C). On this scale, ρTFS and ρENV values corresponding to the same change in hertz of the respective relevant frequency generally fall within the same range, i.e., data corresponding to different N conditions but with similar shifts in hertz are generally close together. Figure 5B also shows ρTFS and ρENV values as a function of the shift (in Hz) of the respective relevant frequency, except that the data shown in this plot were computed based on simulation results obtained using the AN model (as described in the “METHODS”). Since more ΔF0 conditions were simulated with the AN model than could be tested in a physiological experiment, ρENV and ρTFS values overlap over a wider range of shift conditions than observed in the physiological data. These simulation results provide further evidence that, when plotted as a function of the relevant frequency shift (in Hz), ρTFS and ρENV are approximately equal. In general, we can say that the ρ metric is directly related to the amount of change in hertz regardless of whether this change is in the TFS or ENV.
FIG. 5.
Neural cross-correlation metrics for ENV and TFS are equivalently sensitive to equal shifts in hertz of F0 and the near-CF component, respectively. A ρ ENV (red symbols) as a function of F0 shift in hertz and ρ TFS (black symbols and curves) as a function of shift in hertz of the TFS components near CF. Different symbols indicate data for different rank conditions. Data are from the same AN fiber as shown in Figure 4 (CF = 1.17 kHz). B Same as A, except data were collected from the auditory-nerve model (CF = 1.17 kHz, see “METHODS”) and are shown only for the N = 20 condition but with a wider range of shift conditions.
Neural discriminability of coherent frequency shifts
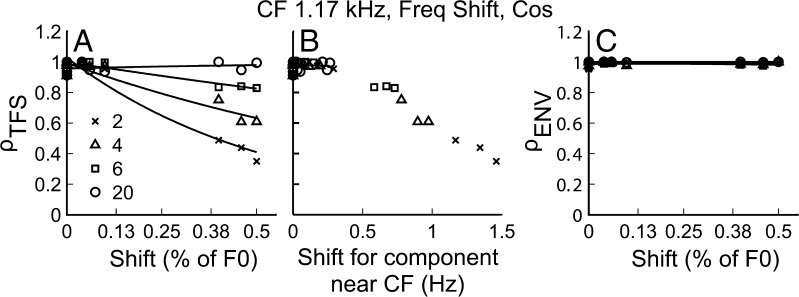
Figure 6 shows the neural cross-correlation coefficients for a single fiber (ρTFS and ρENV) for responses to harmonic and inharmonic tone complexes (COS condition) as a function of the frequency shift, ΔF (expressed in % of F0 in panels A and C, or in hertz of the near-CF component in panel B). As a reminder, the inharmonic stimuli were generated by shifting the frequencies of all the components of a harmonic tone complex by the same amount in hertz (see “METHODS”). The different symbols indicate data for different N conditions (as in Fig. 4).
FIG. 6.
Neural TFS cues are available for discrimination of harmonic and inharmonic tone complexes, but neural ENV cues are absent. A ρ TFS as a function of ΔF (in % of F0). B ρ TFS as a function of shift in hertz for a component near CF. C ρ ENV as a function ΔF (in % of F0). All symbols representing the different harmonic ranks are the same as in Figure 4.
As expected, ρTFS decreased as ΔF increased, and the decrease was steeper for low-N conditions than that for high-N conditions when considered as a function of shift in percent of F0 (Fig. 6A). This outcome can be explained simply by noting that for a given CF, the F0 was lower for the N = 20 condition than for the N = 2 condition. Thus, for a given ΔF (in % of F0), the resultant absolute frequency shift in the near-CF TFS components was much smaller for the N = 20 condition than for the N = 2 condition.
In Figure 6B, ρTFS is instead plotted as a function of ΔF in hertz. This plot makes it quite clear that ΔF of the near-CF component increased as N decreased and that this effect alone can account for why ρTFS was found to decrease more steeply as a function of ΔF (in % of F0) for low-N conditions than for high-N conditions (Fig. 6A).
Figure 6C shows that ρENV remained approximately constant and close to 1, independent of ΔF. This outcome can be understood by considering that a coherent frequency shift applied to all components in a signal does not alter the envelope of the signal (Hartmann 1997). However, it is worth pointing out that the situation could be different when the signal is passed through a narrow filter such as a cochlear filter. Frequency-dependent attenuation by a cochlear filter can result in different relative amplitudes of the stimulus components as they are frequency shifted, which could produce envelope differences between harmonic and inharmonic conditions (Micheyl et al. 2010). In this context, the finding that ρENV remained approximately constant and high independent of ΔF indicates that, even after cochlear filtering, the differences in neural envelope responses induced by the coherent frequency shifts were negligible.
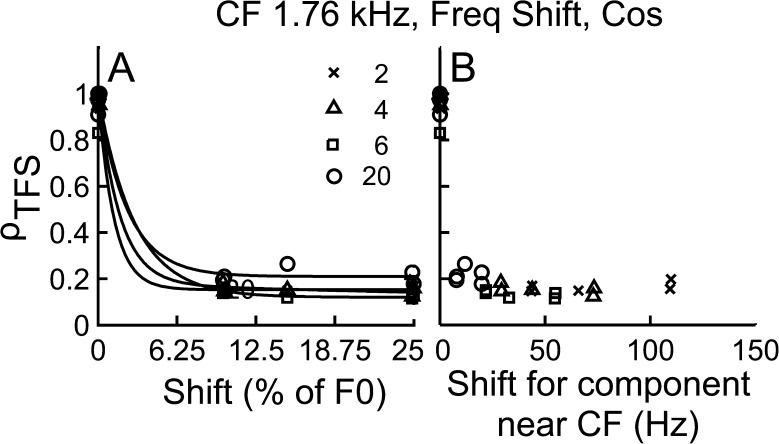
Figure 7 shows ρTFS as a function of a wider range of ΔF shifts expressed in percent of F0 (Fig. 7A) and in hertz of the near-CF TFS component (Fig. 7B). For all harmonic ranks, ρTFS dropped close to the noise floor as the magnitude of the frequency shift became large (e.g., ΔF > 10 % of F0, see Fig. 7). These results provide further evidence that at all harmonic ranks, TFS cues were available for the discrimination of harmonic and inharmonic tone complexes and furthermore that the dependence of ρTFS on N observed in Figure 6A was a by-product of the stimulus design.
FIG. 7.
TFS cues were available for the discrimination of harmonic and inharmonic stimuli even for “unresolved” conditions. Data shown are similar to Figure 6, but over a much wider range of frequency shifts and for a different AN fiber. A ρ TFS as a function ΔF (in % of F0). B ρ TFS as a function of shift for a component near CF (in Hz).
Influence of phase randomization on the neural discriminability of F0 and frequency shifts
The results presented so far were obtained using COS-phase stimuli. Figure 8 shows neural cross-correlation coefficients for F0 discrimination computed based on responses to harmonic complex tones with harmonics summed in RAND phase. As observed for COS-phase stimuli, ρTFS decreased with increasing ΔF0 (in % of F0) (Fig. 8A) for both of the two rank conditions shown. These results show that for harmonic tone complexes with components in random phase, TFS cues are available for F0 discrimination.
FIG. 8.
Phase-based differences in envelope shapes smear the envelope cues for F0 discrimination that are present in AN fibers. All panels are similar to Figure 4 except that the results are for the random-phase condition and data are shown for only two rank conditions. For the zero-shift condition, spike trains were not obtained for two sets of random phases from this fiber, and thus, the cross-correlation coefficients are equal to 1.0 by default.
ρENV is plotted as a function of ΔF0 in percent of F0 in Figure 8B and as a function of the shift in F0 in hertz in Figure 8D. Excluding the ΔF0 = 0 condition (discussed below), ρENV was essentially independent of ΔF0. This outcome indicates that the differences in stimulus envelope that resulted from the F0 shifts were “swamped” by the random differences in stimulus envelope that resulted from the randomization of the component starting phases.
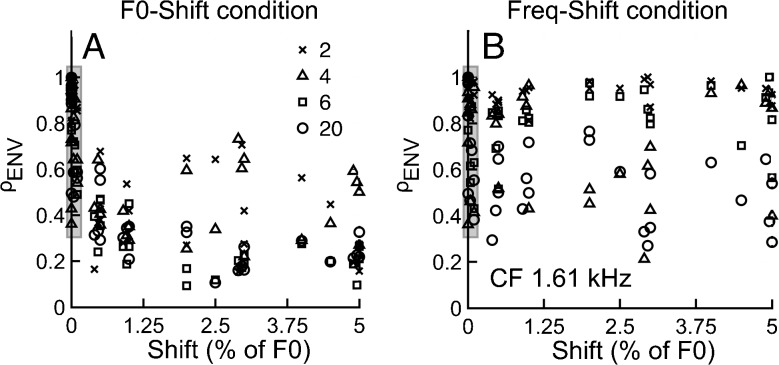
For the zero-shift condition, ρENV is somewhat of a misnomer for the fiber shown in Figure 8, since in this case ρENV was computed from two auto-correlation functions (i.e., REF and REF) using the same set of random component phases. However, if two different sets of random phases are used to generate two sets of REF stimuli (i.e., stimuli having the same F0 but a different set of random phases), ρENV is generally below 1 (illustrated in Fig. 9 shaded area for both F0- and frequency-shift conditions). In contrast, for the COS condition, ρENV was ∼1 for the zero-shift condition for both F0- and frequency-shift conditions as previously described (Figs. 4 and 6). These results are consistent with the idea that cochlear filtering of harmonic tone complexes preserves (in the neural domain) differences in envelope shapes created by randomizing the phases of individual components in the acoustic domain. These results (Figs. 8B and 9A, B) also suggest that ρENV is sensitive to differences in envelope shape (i.e., ρENV < 1 independent of ΔF0). This finding provides further support for the suggestion that ρENV being ∼1 for all frequency shifts in Figure 6C indicates the absence of neural (post-cochlear) envelope cues for the discrimination of harmonic and inharmonic complex tones even when COS-phase stimuli are used.
FIG. 9.
Cochlear filtering preserves phase-based envelope differences in AN fibers. ρ ENV is shown as a function of ΔF0 for F0-shift conditions (A) and Freq-shift conditions (B), for an AN fiber with CF = 1.61 kHz. Tone complexes had individual components with random starting phase, even for the zero-shift condition with this fiber. The shaded region adjacent to the ordinate emphasizes that ρ ENV values are scattered between 0.3 and 1 (even for zero-shift conditions). Given the independence of ρ ENV on ΔF0 or ΔF, no lines were fit to the data.
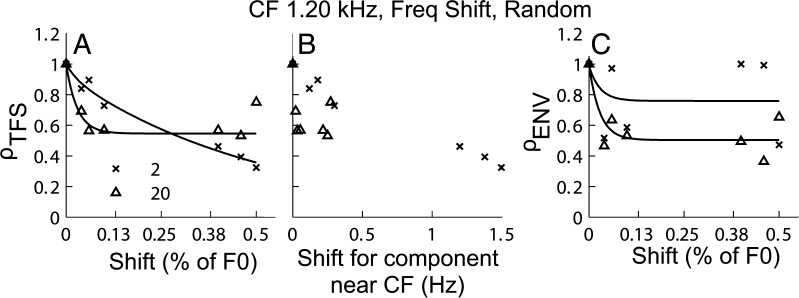
The effects of random phase on ρTFS values were negligible for F0 discrimination (Fig. 8A, C). This is likely because, for F0 discrimination, a given % shift in F0 results in a much larger change in hertz in the near-CF TFS component (and thus in ρTFS, Fig. 8C) than the change in hertz in the envelope periodicity (and thus in ρENV, Fig. 8D). With this larger change in TFS cues, the effects of phase randomization on TFS cues for F0 discrimination were negligible. In contrast, a more significant effect of phase randomization on TFS cues for frequency-shift conditions is seen in Figure 10A, which shows ρTFS as a function of ΔF (in % of F0) for two different harmonic-rank conditions (N = 2 and 20). For both conditions, ρTFS decreased as ΔF increased. However, the total decrease in ρTFS was substantially more marked for N = 2 than for N = 20 (Fig. 10A). This trend is partially consistent with the relatively smaller shift in hertz for components near CF for N = 20 than for N = 2 (Fig. 10B). However, unlike the trends previously observed for COS phase (Fig. 6B), ρTFS dropped to ∼0.6 even for very small shifts in hertz for N = 20 (triangles in Fig. 10B). These results suggest that phase-based differences in TFS (i.e., differences in fine-structure waveform shape) between REF and TEST contribute to ρ values when the inherent (acoustic) shift in TFS frequencies is negligible. However, the contribution from phase-based differences in TFS shape was found to be negligible when large enough shifts in TFS frequency were used (Fig. 11). ρENV was nearly a constant function of ΔF (Fig. 10C). Unlike the trends observed for COS phase (Fig. 6), ρENV values were generally below 1 (ranging from 0.4 to 1) and were independent of the frequency shift (Fig. 10C). The drop in ρENV below 1 resulted from phase-based differences in envelope shape between harmonic and inharmonic stimuli in the RAND condition since there were no inherent differences in envelope periodicity between the two due to the frequency shift. Thus, these results suggest that the differences in envelope shape between REF and TEST stimuli with random phase are more prominent when TEST stimuli are inharmonic and there are no inherent differences in F0 periodicity.
FIG. 10.
Phase-based differences in stimulus fine structure shape can affect TFS cues available for discrimination of harmonic and inharmonic tone complexes. All three panels and legends are similar to Figure 4 except that the results are for random-phase stimuli.
FIG. 11.
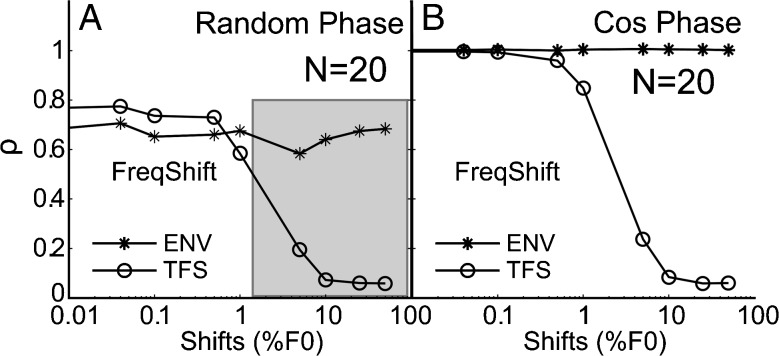
Harmonic and inharmonic tone complexes can be discriminated based on TFS cues. ρ ENV (asterisks) and ρ TFS (circles) from AN model responses are shown as functions of ΔF (in % of F0) for random-phase conditions (A) and cosine-phase conditions (B). Harmonic rank (N) was 20. Each data point is a mean of 40 realizations. Each realization used a separate set of random phases. Shaded region in A shows the range of shifts in F0 over which TFS could possibly be a cue with randomized phase since ρ TFS monotonically decreases with frequency shift, whereas the differences in the envelope are independent of frequency shift.
Differences in envelope shape are not potential cues for discrimination of harmonic and inharmonic tone complexes
Figure 11 compares the dependence of ρENV and ρTFS on frequency shift for AN-model responses to N = 20 stimuli for the random-phase (Fig. 11A) and cosine-phase (Fig. 11B) conditions. Each data point is a mean of 40 ρTFS or ρENV values. For the random-phase condition (Fig. 11A), random phase-induced differences in envelope shape across stimulus presentations resulted in a range of ρENV values, from approximately 0.55 to 0.90. This range is consistent with physiological data from individual fibers (see Figs. 9B and 10C), which can be thought of as representing a single realization based on one set of random phases. For this random-phase condition, the mean ρENV values (averaged over 40 realizations and represented by asterisks in Fig. 11A) were nearly constant (∼0.7) and independent of ΔF across the entire ΔF range (up to the maximum possible ΔF, i.e., 50 % of F0). For the cosine-phase condition (Fig. 11B), the mean ρENV (across 40 realizations) was equal to 1 for all ΔFs tested. A simple explanation for these results is that, in the cosine-phase condition, the stimulus envelope and, unsurprisingly, the neural responses to this envelope were essentially unchanged by the frequency shifting. For the random-phase condition, frequency shifting also had no significant influence on stimulus envelope nor on neural response to the envelope, and thus, the fact that ρENV was smaller than 1 on average can be explained by phase-induced changes in the envelope across stimulus presentations. In contrast to ρENV, the average value of ρTFS decreased markedly as ΔF increased, reaching the noise floor for ΔFs larger than 10 % of F0.
On the whole, these results indicate that randomizing the starting phases of the stimulus components across stimulus presentations induces salient differences in temporal neural responses corresponding to the envelope (as indicated by ρENV values well below 1). However, these envelope-related differences in neural responses do not provide a useful cue for the frequency-shift (or harmonic-versus-inharmonic) discrimination task because they are independent of ΔF (as indicated by the nearly flat ρENV functions in Fig. 11A). In contrast, neural responses to the TFS of harmonic and frequency-shifted (inharmonic) stimuli differ, and they do so increasingly as ΔF increases for both the RAND and COS conditions. This confirms that TFS cues are present in AN-fiber responses to these stimuli and can in principle be used for performance of the frequency-shift discrimination task, even when phase randomization is used.
Comparison with psychophysical data
So far, in the preceding sections, we have shown that (1) ρ is directly related to the amount of change in hertz in either ENV or TFS (see Fig. 5), (2) phase randomization prevents consistent envelope cues (Figs. 8, 9, and 10), and (3) the only consistent change across both F0- and frequency-shift (H–I) discrimination tasks and both phase conditions was in the neural TFS coding of the center component. Based on these findings and on the suggestion that F0 discrimination and H–I discrimination rely on temporal information, we hypothesize that perceptual thresholds in the F0- and H–I discrimination tasks may correspond to the same change (in Hz) in the center (TFS) component. Thus, if the change in center TFS component were used as a cue for discrimination in both perceptual tasks, then the perceptual discrimination thresholds for these two tasks should correspond to the same change in the center TFS component. In this section, we evaluate these hypotheses by (1) predicting neural F0- and H–I discrimination thresholds using an AN-fiber model and by (2) re-analyzing psychophysical data from a previous study (Moore et al. 2009). By comparing neural predictions with psychophysical data in terms of the frequency shift in hertz of the center component, we have evaluated whether physiological TFS responses are quantitatively consistent with psychophysical data concerning F0 and H–I discrimination in human listeners.
To this aim, we simulated neural thresholds of a virtual AN fiber based on the model responses for a CF of 1,170 Hz to REF and TEST stimuli generated in the same way as in the physiological experiments. As demonstrated above, the trends in the predicted neural metrics derived from model responses were generally very similar to those derived from the measured neural responses. To simulate the different harmonic-rank (N) conditions, the F0 of the REF stimulus was systematically varied while keeping the frequency of the center component constant at the CF of 1,170 Hz; therefore, the F0 varied with N. Different ΔF0s (ranging from 0.04 to 50 % of F0) were tested, resulting in multiple combinations of TEST and REF stimuli. For each TEST–REF pair, ρTFS was computed. Individual components of the tone complex were added with random starting phases.
The neural threshold for each condition was defined as the shift in hertz in the center TFS component corresponding to a fixed criterion value of ρTFS = 0.22. This choice of criterion threshold was not arbitrary. Perceptual studies have reported that F0 difference limens range from 0.5 to 1 % of F0 for low harmonic ranks (e.g., Bernstein and Oxenham 2003; Moore et al. 2006b). Hence, we computed the ρTFS value corresponding to a 0.5 % change in F0 for the N = 2 condition from the responses of the model AN fiber (CF = 1,170 Hz) described above and used this as a fixed criterion value for all conditions. Note that this approach assumes that discrimination performance was based on peripheral differences in neural TFS between the REF and TEST stimuli. It is important to acknowledge that central factors (such as central noise, or temporal jitter in the responses of central neurons) may also play a role in F0- and H–I discrimination tasks; we return to this issue later.
The chosen criterion value was then applied across all remaining harmonic ranks and for both tasks to determine the shift in hertz in the center TFS component corresponding to this fixed value of ρTFS, and these values in hertz were taken as the discrimination thresholds for all conditions. Taking the predicted discrimination thresholds corresponding to a fixed ρTFS value implies an assumption that threshold always corresponds to the same ρTFS value (i.e., the same degree of similarity between TFS responses to the REF and TEST stimuli), regardless of the nature of the task and of the harmonic number. Of course, thresholds predicted in this manner depend on the particular ρTFS chosen as the criterion; however, we were only interested in testing whether the same trends were present in the neural and psychophysical data. When we varied the criterion value between 0.2 and 0.8, the results were qualitatively similar to what is described below.
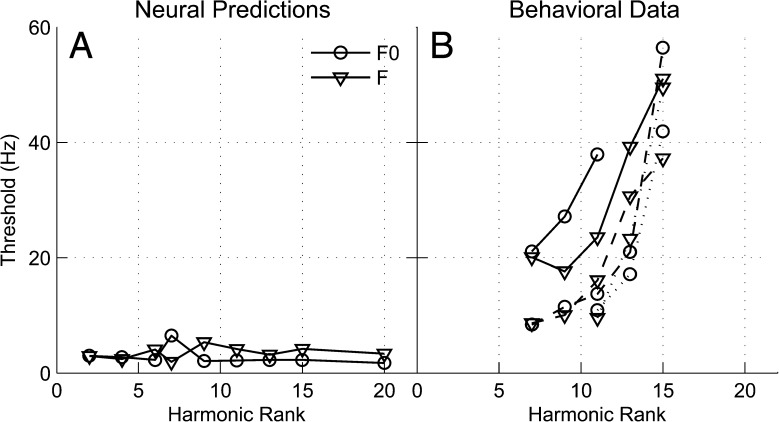
The predicted F0DLs and frequency-shift discrimination thresholds are shown in Figure 12A. These predicted neural thresholds were found to be independent of the harmonic rank. This result stands in sharp contrast to the psychophysical data (Moore et al. 2009), which are shown in Figure 12B. To allow direct comparisons between the physiological data and the model predictions, the psychophysical data of Moore et al. (2009) were converted into frequency shifts (in Hz) of the stimulus center component at threshold. For the frequency-discrimination task, this was achieved by dividing F0/2 (i.e., the size of the frequency shift used in the psychophysical experiment) by the mean d′ values measured in the corresponding F0 condition (Fig. 2 in Moore et al. 2009). These values were then multiplied by 1.63 (i.e., the d′ value corresponding to 70.7 % correct in the three-interval, three-alternative forced-choice (3AFC) paradigm used by Moore et al. (2009)). This calculation is based on the assumption that d′ is proportional to the magnitude of the frequency shift (see Moore et al. 2009). For the F0-discrimination task, the mean F0DLs (in % of F0) reported by Moore et al. (their Fig. 3) were divided by 100 to yield Weber fractions, which were then multiplied by N × F0 (i.e., the frequency of the center component in the “standard” interval). For both tasks, the calculation yielded an estimate of the mean frequency shift (in Hz) of the stimulus center component at threshold (corresponding to d′ = 1.63). Our decision to express the frequency shifts in hertz, rather than as a percentage, was motivated by the above-described observation that the physiological ρTFS and ρENV values were essentially the same when plotted as a function of the relevant frequency shift in hertz (an observation that was confirmed using model simulations, see Fig. 5B). We reasoned that this would facilitate a simpler interpretation of the human results in terms of their potential consistency with the use of neural TFS cues. Indeed, if the performance of the human listeners in the psychophysical experiments were as predicted based on ρTFS, thresholds expressed as frequency shifts of the center component, in hertz, should be approximately independent of F0 and of N. Moreover, under the same assumption regarding the use of TFS cues by human listeners, thresholds in the frequency-discrimination task and the F0-discrimination task should correspond approximately to the same frequency shift (in Hz).
FIG. 12.
A Neural thresholds in hertz for F0- and frequency-discrimination tasks predicted from the ρ TFS metric. Thresholds were defined as the shift in hertz at which ρ TFS dropped to a fixed criterion value (see text). Symbols indicate different shift paradigms. The data were obtained from a model AN fiber with a CF of 1,170 Hz, which matches the CF of the fiber shown in Figures 4 and 5. F0 varied with harmonic rank. B Thresholds for F0 and frequency discrimination of three-component complexes obtained from a perceptual study (Moore et. al. 2009), expressed in terms of the frequency shift in hertz of the center component. Data are shown for different combinations of center harmonic number (N) and F0. Solid lines represent an F0 of 35 Hz, dashed lines represent an F0 of 50 Hz, and the dotted lines represent an F0 of 100 Hz. Center-harmonic numbers are indicated underneath the x-axis. The thresholds shown are for random-phase stimuli.
The different combinations of F0 and N for which thresholds are shown in Figure 12B correspond to the conditions for which Moore et al. (2009) measured both frequency-discrimination thresholds and F0DLs. For the F0-discrimination task, the thresholds shown here were computed based on the F0DLs measured for conditions in which the starting phases of the stimulus components were independently randomized on each presentation to minimize the use of envelope cues. Random phases were also used by Moore et al. (2009) for their frequency-discrimination experiment. The following points are worth noting.
For the lowest N condition tested at a given F0 (i.e., N = 7 for the 35-Hz and 50-Hz F0s and N = 11 for the 100-Hz F0), the frequency shift (in Hz) of the center component corresponding to threshold (d′ = 1.63) in the frequency-discrimination task was almost exactly the same as the threshold in the F0-discrimination task. For the 50-Hz F0, very similar thresholds were also observed for N = 9 and N = 11. Thus, for these conditions, the psychophysical data appear to be consistent with the hypothesis that human listeners’ performance in both tasks was based on a cue, the salience of which was approximately proportional to the magnitude of the frequency shift (in Hz) of the center component. Since for both tasks the randomization of the component phases made ENV cues highly unreliable (see Figs. 8, 9, 10, and 11), it is unlikely that the discrimination thresholds shown in this figure were based on ENV cues. However, these thresholds could reflect the use of TFS cues, the use of place cues, or a combination of these two types of cues.
For other combinations of F0 and N, larger differences between thresholds for the frequency- and F0-discrimination tasks were observed. While we could not assess the statistical significance of these differences, for the 35-Hz F0, the differences in thresholds between the two tasks for N = 9 and N = 11 seem too large to be ascribed simply to measurement error or to across-subject variability, especially considering that in the conditions mentioned above thresholds for the two tasks agreed very closely. Thus, for these combinations of F0 and N, performance in the frequency- and F0-discrimination tasks appears to have been based on, at least partly, different cues. For example, consistent with our above neurophysiological and simulation data, performance in the frequency-shift task may have been based on TFS cues alone, while performance in the F0-discrimination task may have been based on a combination of (and/or interaction between) TFS and ENV cues, as suggested by Moore et al. (2009). Alternatively, performance could be based on place cues in the frequency-discrimination task and on a combination of place and ENV cues in the F0-discrimination task—we return to these different interpretations in the “DISCUSSION.”
Importantly, Figure 12B shows that, for both tasks and for all three F0s, the center-component frequency shift (in Hz) that was needed to reach threshold increased markedly with N. This outcome is inconsistent with our predictions (Fig. 12A) based on the hypothesis that performance in the frequency-discrimination and F0-discrimination tasks is inversely related to ρTFS. Based on the physiological and simulation results that showed a dependence of ρTFS on the shift in hertz of the near-CF component that was independent of N, if performance in these tasks were inversely related to ρTFS, threshold should have been reached for the same frequency shift (in Hz) independent of N. However, the fact that the psychophysical data do not conform to this prediction does not necessarily contradict the hypothesis that the performance of human listeners in the two considered psychophysical experiments was based on TFS cues. In the “DISCUSSION,” we consider factors that can limit performance in F0- or frequency-shift discrimination as N increases, even if performance were based on TFS cues.
Generality of the results across the population of AN fibers
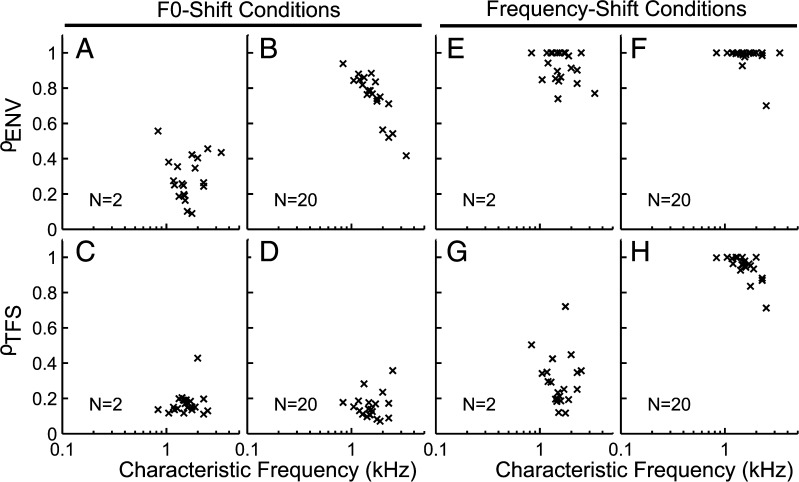
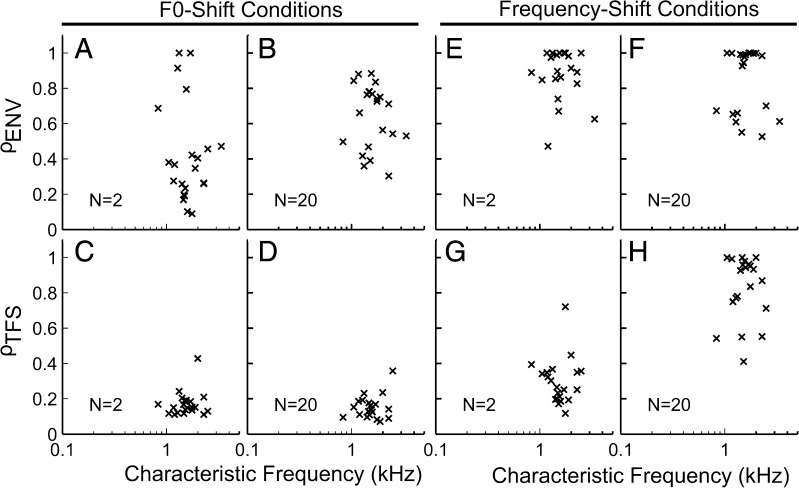
Figure 13 shows ρTFS and ρENV across the population of AN fibers for the cosine-phase conditions. These results are for a shift corresponding to 0.5 % of F0. All of the trends described previously for both the F0- and frequency-shift conditions were found to be consistent across the population. To summarize, these results indicate that (1) TFS cues were generally available for F0 discrimination (Fig. 13 C, D, low ρTFS indicating higher discriminability based on TFS); (2) however, only ρENV varied as a function of N in a way consistent with the perceptual studies that found poorer discriminability for higher harmonic ranks (Fig. 13 A, B); (3) ENV cues were generally not available for the discrimination of harmonic and inharmonic stimuli, particularly so for the unresolved N = 20 condition (Fig. 13 E, F); and (4) TFS cues for the discrimination of harmonic and inharmonic stimuli were available at all harmonic ranks, but appeared to be less salient for higher harmonic ranks and this relatively small frequency shift due to the stimulus design (see Fig. 7 and its corresponding text).
FIG. 13.
Envelope and TFS cues available for F0- and frequency-discrimination tasks were generally consistent across the AN-fiber population. ρ ENV (top row) and ρ TFS (bottom row) for individual AN fibers are plotted as a function of characteristic frequency. A–D F0-shift conditions. E–H Frequency-shift conditions. All results are for cosine-phase conditions with a shift corresponding to 0.5 % of F0.
Figure 14 summarizes the AN-fiber population results for random-phase conditions. The results may be summarized as follows: (1) The randomization of component starting phases resulted in smeared envelope cues for F0 discrimination (compare Figs. 13 A, B and 14 A, B), but did not affect TFS cues (compare Figs. 13 C, D and 14 C, D), and (2) differences in ENV due to phase randomization were reflected in the neural responses (compare Fig. 13 E, F to Fig. 14 E, F). Additional effects of phase randomization on neural responses have already been outlined in preceding sections, and will not be revisited here. The important point is that the trends observed in the single-fiber results illustrated in previous sections are representative of the general trends observed in the population.
FIG. 14.
The effects of phase randomization on neural ENV and TFS cues were consistent across the AN-fiber population. All panels are identical to Figure 13 except that the data are for random-phase conditions.
DISCUSSION
The contribution of neural TFS and neural ENV cues to listeners’ performance in F0- and H–I discrimination experiments is a much-debated question in hearing research. As mentioned in the “INTRODUCTION,” recent psychophysical studies have concluded that listeners rely on TFS cues rather than on ENV cues when discriminating F0 or frequency shifts of unresolved or partially unresolved harmonics when the harmonic rank N ≤ 14 (Moore et al. 2006a, 2009). The results of the present study yield some insight into the TFS and ENV cues that are actually present in single AN fibers for discriminating between complex tones differing in F0 or frequency.
ρTFS and ρENV as measures of F0- and frequency-shift discriminability based on neural TFS and ENV information
The main goal of the present study was to assess temporal cues available in the responses of normal AN fibers for the discrimination of tone complexes differing in either F0 or by a constant frequency shift of all components. Neural TFS and ENV cues were quantified using two metrics based on shuffled spike-train correlograms, ρTFS and ρENV (Heinz and Swaminathan 2009). If performance in the F0- and frequency-shift (H-versus-I) discrimination tasks were based on the ENV or TFS information contained in the all-order ISIs of AN fibers, ρTFS and ρENV should vary across stimulus conditions in a way that parallels discrimination performance. In particular, since sensitivity (d′) for the F0- and frequency-shift (H-versus-I) discrimination tasks has been observed to decrease as the lowest harmonic number present in the stimulus increases (Moore et al. 2009), we predicted that ρTFS and ρENV corresponding to a given F0 or frequency shift between REF and TEST stimuli would increase as N increased. Instead, we found that when the TEST stimulus was an inharmonic complex, which differed from the (harmonic) REF complex by a coherent frequency shift, ρTFS and ρENV values corresponding to a given frequency shift remained approximately constant as N was increased from 2 to 20. This result suggests that performance in frequency-shift discrimination experiments (e.g., Moore et al. 2009) is not limited by temporal (TFS or ENV) information alone at the level of single AN fibers.
When the REF and TEST stimuli were both harmonic and differed in F0, ρTFS and ρENV increased with increasing N. This effect is qualitatively consistent with psychophysical findings, which show a decrease in F0-discrimination performance (d′), or an increase in F0-discrimination thresholds (in Hz or % of F0), with increasing N (Moore et al. 2006b). However, simulations obtained using a physiologically realistic AN model (Zilany and Bruce 2006, 2007) revealed that this effect could be explained entirely by the fact that, as N increased, the frequency shift in hertz of the near-CF center component decreased.
To determine whether this effect could account quantitatively for the psychophysical data, the latter were re-plotted in terms of the shift (in Hz) in the frequency of the center component at threshold (Fig. 12B). The resulting plots showed marked increases in F0-discrimination thresholds (in Hz) with increasing N. This outcome is inconsistent with the thresholds (in Hz) predicted from the neural data (Fig. 12A) because the ρTFS and ρENV metrics were both found to be essentially independent of N. Thus, to account for increasing thresholds with increasing N observed in the psychophysical data, one would have to assume that F0- and frequency-discrimination thresholds do not correspond to a constant ρTFS, or a constant ρENV, across different N conditions. The metrics ρTFS and ρENV are inversely related to the amount of statistical information contained in neural representations of TFS and ENV in single AN fibers for discriminating between the REF and TEST stimuli (Kale et al. 2013). In this context, our finding that F0-discrimination thresholds do not correspond to a constant ρTFS or ρENV across different N conditions implies that behavioral F0- and frequency-discrimination performance is not limited only by the precision of neural representations of TFS or ENV at the level of single AN fibers.
Temporal cues in peripheral neural responses for F0- and frequency-shift discrimination: TFS or ENV?
F0 discrimination
ρTFS was found to decrease much more steeply than ρENV as the F0 difference between the REF and TEST stimuli increased. Even for very small F0 shifts (e.g., 0.5 % of F0), ρTFS was markedly lower than ρENV. As previously noted, this effect can be explained by the fact that for a given F0 shift, the frequency of the stimulus center component (i.e., the dominant TFS component) shifts by a larger amount (in Hz) than the F0 (i.e., the dominant ENV component). Thus, although both TFS and ENV cues are present in the responses of single AN fibers for F0 discrimination, for a given change in F0 (in % of F0, as often considered in perceptual studies), neural TFS cues are larger than ENV cues. Secondly, the present physiological data and model simulations show that neural TFS cues for N = 20 are at least as strong as those for N = 2 (see Fig. 4A, C, where for a given ΔF0 we see the same drop in ρTFS across all harmonic ranks). If listeners were to rely on neural TFS cues for F0 discrimination, then their thresholds would be independent of N. Yet, listeners’ performance worsens with increasing N suggesting that they might not be relying on TFS cues.
Several psychophysical studies have found that F0DLs for unresolved harmonics were larger when the starting phases of the harmonics were randomized than when they were constant; however, phase effects are not always found for partially resolved conditions (Houtsma and Smurzynski 1990; Shackleton and Carlyon 1994; Bernstein and Oxenham 2003). In the present study, phase randomization was found to degrade neural ENV cues for F0 discrimination (Fig. 8B, D), while leaving neural TFS cues essentially unchanged (Fig. 8A, C). One interpretation of these results would be that, for unresolved harmonics, F0 discrimination depends more on ENV cues than on TFS cues, consistent with our previous suggestion that listeners seemed not to rely on the more robust TFS cues. However, in light of previous suggestions by Moore et al. (2006a), it is important to consider the distinction between TFS cues corresponding to individual component frequencies (i.e., ISIs corresponding to the period of individual components in the complex) and TFS cues corresponding to the F0 (i.e., ISIs corresponding to TFS peaks separated by one ENV period). This distinction is potentially important because the latter cues could be affected by random changes in the ENV due to randomization of the component starting phases; however, these cues do not appear to be strictly neural TFS cues because the F0 is not represented in the difcor PSDs (Fig. 3 A–D). It is important to note that, due to differences in cochlear frequency selectivity between chinchillas and humans (Shera et al. 2010), the stimulus components may have been more unresolved in the former than in the latter, even for relatively low N values.
Frequency-shift discrimination
For the case of frequency-shift (H–I) discrimination, we found that neural ENV and TFS coding were both dependent on whether the starting phases of individual components were randomized or not. When all components were added in the same (cosine) starting phase, the neural responses contained no ENV cues for performing the task (Fig. 6C). This result can be explained based on the mathematical fact that shifting all frequency components in a complex sound by the same amount (in Hz) leaves the stimulus ENV unchanged (Hartmann 1997). However, it is important to note that while this mathematical fact holds for the original signal, it does not necessarily hold (strictly) when considering the outputs of peripheral (cochlear) bandpass filters in response to the signal (Micheyl et al. 2010). This is why in psychophysical studies of H–I discrimination, the starting phases of the components have usually been randomized as an added precaution against the potential presence of any consistent ENV cues (Moore and Sek 2009a). For such random-phase stimuli, ENV shapes can differ markedly between the harmonic and inharmonic stimuli, but ENV periodicity remains the same. It has been suggested that subtle differences in the statistical distribution of ENV shapes might provide useable cues for H–I discrimination (Micheyl et al. 2010). The results of the present study confirm that random-phase stimuli produce markedly different ENV shapes at the level of AN fibers (Fig. 10C). However, since these differences do not depend in a consistent manner on the frequency shift (Figs. 10C and 11), they are unlikely to provide a reliable cue for H–I discrimination (Fig. 11A asterisks). A similar conclusion that H–I discrimination does not rely on envelope cues was reached by Jackson and Moore (2014), based on their finding that psychophysical thresholds were the same for cosine- and random-phase tones. Accordingly, performance in the psychophysical H–I discrimination task seems more likely to rely on neural TFS cues than on ENV cues.
However, the problem remains that H–I discrimination thresholds predicted based on the TFS information present in the responses of single AN fibers (as quantified by ρTFS) did not show any dependence on N, in sharp contrast to the psychophysical results. Secondly, it is not clear why listeners would use different sets of cues (i.e., ENV and TFS) for two different tasks (i.e., ENV for F0 discrimination and TFS for H–I discrimination) when more robust TFS cues are available for both tasks and for both cosine and random-phase conditions. Finally, additional physiological evidence questioning the isolated role of TFS cues for frequency- (and F0-) discrimination tasks comes from the effects of sensorineural hearing loss on the temporal coding of complex tones. Although human listeners with sensorineural hearing loss show marked deficits in these tasks particularly for low harmonic rank conditions (Moore et al. 2006a, b), neural discriminability based on the ρTFS and ρENV metrics was found to be unaffected by noise-induced hearing loss for all harmonic ranks (Kale et al. 2013).
Based on the considerations above, we are led to the conclusion that either (1) listeners’ performance in psychophysical H–I discrimination experiments is not based on temporal (TFS or ENV) cues or (2) if performance is based on TFS cues, then it is not based solely on the amount of TFS information in single AN fibers; performance must be influenced by factors (e.g., central processing and/or internal noise) that vary with harmonic rank in such a way that performance decreases as N increases. One possible processing scheme, which we have not explored in this study but that would be interesting to test in future work, relates to the availability of across-channel timing cues for F0 (Cedolin and Delgutte 2010).
Implications for models of F0 and H–I discrimination
Although the predictions of a temporal model for pure-tone frequency discrimination have been found to match the trends in human performance at frequencies above ∼2 kHz (Heinz et al. 2001), the model predicts that frequency-difference limens (in Hz) should be approximately constant (independent of frequency) at lower frequencies (Siebert 1970; Heinz et al. 2001) where phase locking is strong (∼0.8–0.9) and frequency-independent in the mammalian species studied to date (e.g., Johnson 1980). This low-frequency prediction is not entirely consistent with the psychophysical data, which generally show some increase in frequency-difference limens as a function of frequency even for frequencies lower than 1 kHz (e.g., Wier et al. 1977; Nelson et al. 1983; Micheyl et al. 2012). For simple tones, first-order interval TFS cues can improve the predicted trends in frequency-difference limens as a function of stimulus frequency and duration (Goldstein and Srulovicz 1977); however, some discrepancies remain particularly at low frequencies and short durations, where accurate physiological models that include adaptation effects are important but have yet to be fully tested with the first-order interval model (Heinz et al. 2001). Thus, even for simple tones, there remains some doubt as to whether TFS cues can fully account for human performance trends at low frequencies.
For complex tones, when plotted in terms of the absolute shift (in Hz) in the frequency of the near-CF component, human thresholds for F0 or frequency discrimination increase with harmonic rank (Fig. 12B; also see Fig. 4 in Moore et al. 2009). In contrast, thresholds predicted based on the temporal metrics used in the present study were independent of the harmonic rank (Fig. 12A). A fixed neural jitter limiting the temporal precision of TFS peaks under ENV maxima could be thought to produce worsening performance as harmonic rank increases (e.g., as more TFS peaks occur under each ENV maxima, the fixed jitter would become more relevant, Moore and Glasberg 2010). This appears unlikely at the level of the AN since physiological noise was already included in both the recorded and modeled responses analyzed in the present study. However, it is conceivable that additional noise with this property could be added central to the AN (Moore et al. 2009; Moore and Glasberg 2010).
Taken together, these results suggest that temporal models that rely on TFS phase locking and ISI information alone are not sufficient to explain the dependence of F0- and frequency-shift discrimination performance on harmonic number. Rate-place models that rely on a reduction in resolvability with increasing harmonic number, temporal-place models modified to include CF-dependent coding of F0, or across-channel temporal models (e.g., Bernstein and Oxenham 2005; Cedolin and Delgutte 2005, 2010), may be needed to account for the dependence of F0-discrimination and H–I discrimination performance on harmonic number observed in perceptual studies.
Acknowledgments
This research was supported by National Institutes of Health (NIH) grants R01-DC009838 (SK and MGH) and R01-DC05216 (CM). The authors thank Kenneth Henry and Jon Boley for help with data collection. We also acknowledge the helpful and thorough reviews from Associate Editor Chris Plack, Brian Moore, and an anonymous reviewer.
Contributor Information
Sushrut Kale, Email: sk3646@cumc.columbia.edu.
Christophe Micheyl, Email: christophe_micheyl@starkey.com.
Michael G. Heinz, Phone: +1-765-4966627, FAX: +1-765-4940771, Email: mheinz@purdue.edu
REFERENCES
- Bernstein JG, Oxenham AJ. Pitch discrimination of diotic and dichotic tone complexes: harmonic resolvability or harmonic number? J Acoust Soc Am. 2003;113:3323–3334. doi: 10.1121/1.1572146. [DOI] [PubMed] [Google Scholar]
- Bernstein JG, Oxenham AJ. An autocorrelation model with place dependence to account for the effect of harmonic number on fundamental frequency discrimination. J Acoust Soc Am. 2005;117:3816–3831. doi: 10.1121/1.1904268. [DOI] [PMC free article] [PubMed] [Google Scholar]
- Cariani PA, Delgutte B. Neural correlates of the pitch of complex tones. I. Pitch and pitch salience. J Neurophysiol. 1996;76:1698–1716. doi: 10.1152/jn.1996.76.3.1698. [DOI] [PubMed] [Google Scholar]
- Cedolin L, Delgutte B. Pitch of complex tones: rate-place and interspike interval representations in the auditory nerve. J Neurophysiol. 2005;94:347–362. doi: 10.1152/jn.01114.2004. [DOI] [PMC free article] [PubMed] [Google Scholar]
- Cedolin L, Delgutte B. Spatiotemporal representation of the pitch of harmonic complex tones in the auditory nerve. J Neurosci. 2010;30:12712–12724. doi: 10.1523/JNEUROSCI.6365-09.2010. [DOI] [PMC free article] [PubMed] [Google Scholar]
- Chintanpalli A, Heinz MG (2007) The effect of auditory-nerve response variability on estimates of tuning curves. J Acoust Soc Am 122:EL203–EL209 [DOI] [PMC free article] [PubMed]
- Goldstein J. An optimum processor theory for the central formation of the pitch of complex tones. J Acoust Soc Am. 1973;54:1496–1516. doi: 10.1121/1.1914448. [DOI] [PubMed] [Google Scholar]
- Goldstein JL, Srulovicz P. Auditory-nerve spike intervals as an adequate basis for aural frequency measurement. In: Evans EF, Wilson JP, editors. Psychophysics and physiology of hearing. London: Academic; 1977. pp. 337–346. [Google Scholar]
- Guinan JJ, Jr, Peake WT. Middle-ear characteristics of anesthetized cats. J Acoust Soc Am. 1967;41:1237–1261. doi: 10.1121/1.1910465. [DOI] [PubMed] [Google Scholar]
- Hartmann WM. Signals, sound, and sensation. Woodbury: American Institute of Physics; 1997. [Google Scholar]
- Heinz MG, Swaminathan J. Quantifying envelope and fine-structure coding in auditory-nerve responses to chimaeric speech. J Assoc Res Otolaryngol. 2009;10:407–423. doi: 10.1007/s10162-009-0169-8. [DOI] [PMC free article] [PubMed] [Google Scholar]
- Heinz MG, Colburn HS, Carney LH. Evaluating auditory performance limits: I. One-parameter discrimination using a computational model for the auditory nerve. Neural Comput. 2001;13:2273–2316. doi: 10.1162/089976601750541804. [DOI] [PubMed] [Google Scholar]
- Henry KS, Heinz MG. Effects of sensorineural hearing loss on temporal coding of narrowband and broadband signals in the auditory periphery. Hear Res. 2013;303:39–47. doi: 10.1016/j.heares.2013.01.014. [DOI] [PMC free article] [PubMed] [Google Scholar]
- Hopkins K, Moore BCJ. Moderate cochlear hearing loss leads to a reduced ability to use temporal fine structure information. J Acoust Soc Am. 2007;122:1055–1068. doi: 10.1121/1.2749457. [DOI] [PubMed] [Google Scholar]
- Houtsma AJM, Smurzynski J. Pitch identification and discrimination for complex tones with many harmonics. J Acoust Soc Am. 1990;87:304–310. doi: 10.1121/1.399297. [DOI] [Google Scholar]
- Jackson HM, Moore BCJ (2014) The role of excitation-pattern, temporal-fine-structure, and envelope cues in the discrimination of complex tones. J Acoust Soc Am. In press [DOI] [PubMed]
- Johnson DH. The relationship between spike rate and synchrony in responses of auditory-nerve fibers to single tones. J Acoust Soc Am. 1980;68:1115–1122. doi: 10.1121/1.384982. [DOI] [PubMed] [Google Scholar]
- Joris PX. Interaural time sensitivity dominated by cochlea-induced envelope patterns. J Neurosci. 2003;23:6345–6350. doi: 10.1523/JNEUROSCI.23-15-06345.2003. [DOI] [PMC free article] [PubMed] [Google Scholar]
- Kale S, Heinz MG. Envelope coding in auditory nerve fibers following noise-induced hearing loss. J Assoc Res Otolaryngol. 2010;11:657–673. doi: 10.1007/s10162-010-0223-6. [DOI] [PMC free article] [PubMed] [Google Scholar]
- Kale S, Micheyl C, Heinz MG. Effects of sensorineural hearing loss on temporal coding of harmonic and inharmonic tone complexes in the auditory nerve. Adv Exp Med Biol. 2013;787:109–118. doi: 10.1007/978-1-4614-1590-9_13. [DOI] [PMC free article] [PubMed] [Google Scholar]
- Louage DH, Van Der Heijden M, Joris PX. Temporal properties of responses to broadband noise in the auditory nerve. J Neurophysiol. 2004;91:2051–2065. doi: 10.1152/jn.00816.2003. [DOI] [PubMed] [Google Scholar]
- Meddis R, Hewitt MJ. Modeling the identification of concurrent vowels with different fundamental frequencies. J Acoust Soc Am. 1992;91:233–245. doi: 10.1121/1.402767. [DOI] [PubMed] [Google Scholar]
- Meddis R, O'Mard L. A unitary model of pitch perception. J Acoust Soc Am. 1997;102:1811–1820. doi: 10.1121/1.420088. [DOI] [PubMed] [Google Scholar]
- Micheyl C, Dai H, Oxenham AJ. On the possible influence of spectral- and temporal-envelope cues in tests of sensitivity to temporal fine structure. J Acoust Soc Am. 2010;127:1809–1810. doi: 10.1121/1.3384106. [DOI] [Google Scholar]
- Micheyl C, Xiao L, Oxenham AJ. Characterizing the dependence of pure-tone frequency difference limens on frequency, duration, and level. Hear Res. 2012;292:1–13. doi: 10.1016/j.heares.2012.07.004. [DOI] [PMC free article] [PubMed] [Google Scholar]
- Moore BCJ. Introduction to the psychology of hearing. 6. Leiden: Brill; 2012. [Google Scholar]
- Moore BCJ, Glasberg BR. The role of temporal fine structure in harmonic segregation through mistuning. J Acoust Soc Am. 2010;127:5–8. doi: 10.1121/1.3268509. [DOI] [PubMed] [Google Scholar]
- Moore BCJ, Gockel HE. Resolvability of components in complex tones and implications for theories of pitch perception. Hear Res. 2011;276:88–97. doi: 10.1016/j.heares.2011.01.003. [DOI] [PubMed] [Google Scholar]
- Moore BCJ, Sek A. Sensitivity of the human auditory system to temporal fine structure at high frequencies. J Acoust Soc Am. 2009;125:3186–3193. doi: 10.1121/1.3106525. [DOI] [PubMed] [Google Scholar]
- Moore BCJ, Sek A. Development of a fast method for determining sensitivity to temporal fine structure. Int J Audiol. 2009;48:161–171. doi: 10.1080/14992020802475235. [DOI] [PubMed] [Google Scholar]
- Moore BCJ, Sek A. Effect of level on the discrimination of harmonic and frequency-shifted complex tones at high frequencies. J Acoust Soc Am. 2011;129:3206–3212. doi: 10.1121/1.3570958. [DOI] [PubMed] [Google Scholar]
- Moore BCJ, Glasberg BR, Hopkins K. Frequency discrimination of complex tones by hearing-impaired subjects: evidence for loss of ability to use temporal fine structure. Hear Res. 2006;222:16–27. doi: 10.1016/j.heares.2006.08.007. [DOI] [PubMed] [Google Scholar]
- Moore BCJ, Glasberg BR, Flanagan HJ, Adams J. Frequency discrimination of complex tones; assessing the role of component resolvability and temporal fine structure. J Acoust Soc Am. 2006;119:480–490. doi: 10.1121/1.2139070. [DOI] [PubMed] [Google Scholar]
- Moore BCJ, Hopkins K, Cuthbertson S. Discrimination of complex tones with unresolved components using temporal fine structure information. J Acoust Soc Am. 2009;125:3214–3222. doi: 10.1121/1.3106135. [DOI] [PubMed] [Google Scholar]
- Nelson DA, Stanton ME, Freyman RL. A general equation describing frequency discrimination as a function of frequency and sensation level. J Acoust Soc Am. 1983;73:2117–2123. doi: 10.1121/1.389579. [DOI] [PubMed] [Google Scholar]
- Oxenham AJ, Micheyl C, Keebler MV. Can temporal fine structure represent the fundamental frequency of unresolved harmonics? J Acoust Soc Am. 2009;125:2189–2199. doi: 10.1121/1.3089220. [DOI] [PMC free article] [PubMed] [Google Scholar]
- Plack CJ, Oxenham AJ. The psychophysics of pitch. In: Plack CJ, Fay RR, Oxenham AJ, Popper AN, editors. Pitch: neural coding and perception. New York: Springer; 2005. pp. 7–55. [Google Scholar]
- Plack CJ, Fay RR, Oxenham AJ, Popper AN. Pitch: neural coding and perception. New York: Springer; 2005. [Google Scholar]
- Rose JE, Brugge JF, Anderson DJ, Hind JE. Some possible neural correlates of combination tones. J Neurophysiol. 1969;32:402–423. doi: 10.1152/jn.1969.32.3.402. [DOI] [PubMed] [Google Scholar]
- Santurette S, Dau T. The role of temporal fine structure information for the low pitch of high-frequency complex tones. J Acoust Soc Am. 2011;129:282–292. doi: 10.1121/1.3518718. [DOI] [PubMed] [Google Scholar]
- Schouten JF, Ritsma RJ, Cardozo BL. Pitch of the residue. J Acoust Soc Am. 1962;34:1418–1424. doi: 10.1121/1.1918360. [DOI] [Google Scholar]
- Shackleton TM, Carlyon RP. The role of resolved and unresolved harmonics in pitch perception and frequency modulation discrimination. J Acoust Soc Am. 1994;95:3529–3540. doi: 10.1121/1.409970. [DOI] [PubMed] [Google Scholar]
- Shera CA, Guinan JJ, Jr, Oxenham AJ. Otoacoustic estimation of cochlear tuning: validation in the chinchilla. J Assoc Res Otolaryngol. 2010;11:343–365. doi: 10.1007/s10162-010-0217-4. [DOI] [PMC free article] [PubMed] [Google Scholar]
- Shofner WP. Spectral processing does not give rise to behaviorally relevant cues for pitch perception in mammals. J Acoust Soc Am. 2011;129:2592–2593. doi: 10.1121/1.3588584. [DOI] [Google Scholar]
- Siebert WM. Frequency discrimination in the auditory system: place or periodicity mechanisms? Proc IEEE. 1970;58:723–750. doi: 10.1109/PROC.1970.7727. [DOI] [Google Scholar]
- Srulovicz P, Goldstein JL. A central spectrum model: a synthesis of auditory-nerve timing and place cues in monaural communication of frequency spectrum. J Acoust Soc Am. 1983;73:1266–1276. doi: 10.1121/1.389275. [DOI] [PubMed] [Google Scholar]
- Tan Q, Carney LH. A phenomenological model for the responses of auditory-nerve fibers. II. Nonlinear tuning with a frequency glide. J Acoust Soc Am. 2003;114:2007–2020. doi: 10.1121/1.1608963. [DOI] [PubMed] [Google Scholar]
- Terhardt E. Pitch, consonance, and harmony. J Acoust Soc Am. 1974;55:1061–1069. doi: 10.1121/1.1914648. [DOI] [PubMed] [Google Scholar]
- Wier CC, Jesteadt W, Green DM. Frequency discrimination as a function of frequency and sensation level. J Acoust Soc Am. 1977;61:178–184. doi: 10.1121/1.381251. [DOI] [PubMed] [Google Scholar]
- Wightman FL. The pattern-transformation model of pitch. J Acoust Soc Am. 1973;54:407–416. doi: 10.1121/1.1913592. [DOI] [PubMed] [Google Scholar]
- Zhang X, Heinz MG, Bruce IC, Carney LH. A phenomenological model for the responses of auditory-nerve fibers: I. Nonlinear tuning with compression and suppression. J Acoust Soc Am. 2001;109:648–670. doi: 10.1121/1.1336503. [DOI] [PubMed] [Google Scholar]
- Zilany MSA, Bruce IC. Modeling auditory-nerve responses for high sound pressure levels in the normal and impaired auditory periphery. J Acoust Soc Am. 2006;120:1446–1466. doi: 10.1121/1.2225512. [DOI] [PubMed] [Google Scholar]
- Zilany MSA, Bruce IC. Representation of the vowel /ε/ in normal and impaired auditory nerve fibers: model predictions of responses in cats. J Acoust Soc Am. 2007;122:402–417. doi: 10.1121/1.2735117. [DOI] [PubMed] [Google Scholar]
- Zilany MSA, Bruce IC, Nelson PC, Carney LH. A phenomenological model of the synapse between the inner hair cell and auditory nerve: long-term adaptation with power-law dynamics. J Acoust Soc Am. 2009;126:2390–2412. doi: 10.1121/1.3238250. [DOI] [PMC free article] [PubMed] [Google Scholar]


