Abstract
This paper presents in vivo experimental measurements of vibrations on the pars flaccida, along the manubrium and at several points on the pars tensa in the gerbil with open middle-ear cavity. The effects of progressive opening of the middle-ear cavity are presented, with up to five different extents of opening. In all manubrial, pars-tensa and pars-flaccida responses, opening the cavity causes an increase in the low-frequency magnitude and a shift of the main middle-ear resonance to lower frequencies and introduces an antiresonance. However, opening the cavity has little or no effect on either the mode of vibration of the manubrium or the breakup frequency of the pars tensa. When the opening is gradually widened, the antiresonance frequency moves to higher frequencies. When the opening is made as wide as anatomically possible, the antiresonance moves to almost 10 kHz. The main increase in the low-frequency response magnitude happens upon making the smallest hole in the cavity wall, and further progressive enlarging of the opening has little or no effect on the low-frequency magnitude. The antiresonance interferes with the response shapes. An identification method is suggested for eliminating the effect of the antiresonance in order to estimate the ideal open-cavity response. The method is validated and then applied to manubrial and pars-tensa responses. Estimating the ideal open-cavity responses will simplify comparison of the data with numerical models which do not include the air cavity. The data collected at intermediate stages of opening will be useful in validating models that do include the cavity.
Keywords: air cavity, pars tensa, pars flaccida, manubrium, middle ear, vibration pattern, laser Doppler vibrometry
INTRODUCTION
In auditory research on the mechanical response of the ear, it is usually the condition with a naturally closed middle-ear air cavity that is of interest but there are many instances where the methodology of the study demands opening of the cavity. Examples include removing some parts of the cavity wall to expose the ossicles, to study artificial otitis media with effusion or to expose the round window membrane, or manipulating the cochlea. In some preparations, it is possible to easily reverse the effects of the opening by resealing, for example with a glass coverslip, but in other cases it would be very difficult and time-consuming. Understanding the effects that the opening has on frequency responses and on spatial vibration patterns is essential in deciding whether to spend effort resealing the opening.
When the cavity is opened, different sizes of the opening may be involved, ranging from a very small hole made in the cavity wall to an almost complete removal of the cavity wall. To permit comparison of experimental results with different sizes of opening, it is important to know how they affect the results.
The effects of the middle-ear cavity on the response of the ear have been investigated using admittance, impedance and other measurements in human (Zwislocki, 1962), guinea pig (Zwislocki, 1963), rabbit (Møller, 1965), cat (Møller, 1965; Guinan & Peake, 1967; Lynch et al., 1994), lion (Huang et al., 1997), gerbil (Ravicz et al., 1992; Teoh et al., 1997) and chinchilla (Rosowski et al., 2006). In these studies, it was found that opening the middle-ear cavity has the following effects on the response of the middle ear: (1) the stiffness of the middle ear at low frequencies is reduced; (2) the middle-ear resonance moves to lower frequencies; (3) an antiresonance is introduced in the admittance; (4) at high frequencies, there is not much difference between open-cavity and closed-cavity admittances (except for the antiresonance); and (5) in species with large pars flaccida (like the gerbil, cf. Teoh et al., 1997), the admittance peak associated with the pars flaccida becomes more prominent.
In Maftoon et al. (2013), we briefly summarized previous studies that dealt with vibration patterns of the tympanic membrane (TM) and presented our closed-cavity measurements. However, there have been no measurements reported for the effects of opening the middle-ear cavity on the vibration patterns of the TM and manubrium. The present study explores how opening the middle-ear cavity and the extent of the opening affect the vibration patterns of the TM.
Models of the middle ear without the cavity are less complex and require fewer parameters than models including the cavity. Validating these simpler models is an important step in developing comprehensive models that include the cavity. For this purpose, experimental data with a completely open middle-ear cavity should be used but usually only a partial opening of the cavity is possible. There is a need, therefore, for a method that can exclude the effects of the partial opening on the responses and estimate the ideal open-cavity responses. This paper demonstrates a method for estimating an ideal open-cavity response from measurements made with a partial cavity opening.
MATERIALS AND METHODS
Preparation and measurement
The materials and methods used in this study are similar to those described in detail in Maftoon et al. (2013), with additional steps for studying the effects of opening the middle-ear cavity. Here we briefly summarize what is common to this and the closed-cavity study and then explain the steps specific to this study. TM vibration was measured in vivo in 12 ears of 11 female Mongolian gerbils (Meriones unguiculatis) supplied by Charles River Laboratories (St-Constant, Québec). Body weights were from 64 to 100 g. The study protocol was approved by the McGill University Animal Care Committee. Analgesics and anaesthetics were administered, and once the animal reached an appropriate level of anaesthesia, the bulla was exposed by removing soft tissue. Then, using a surgical ear drill, the bony ear canal was removed and the TM was exposed. A wooden block attached to the skull using dental cement (IRM, Dentsply Caulk) was used to fix the head under an operating microscope (OPMI 1-H, Zeiss) equipped with the sensor head of a single-point LDV (HLV-1000, Polytec). Measurements were performed from a single viewing direction. In order to equalize pressure in the bulla, a ventilation hole was made on the bulla about 3 mm away from the TM; to cancel the acoustical effects of the hole, a 15-cm-long polyethylene tube with an inner diameter of 0.58 mm and an outer diameter of 0.96 mm was inserted into the hole.
The TM was stimulated by 128-ms sinusoidal sweeps from 0.2 to 12.5 kHz delivered to the ear canal by an ER-2 tubephone (Etymōtic Research) through an aluminum acoustic coupler. The measured vibration amplitudes are normalized by the sound pressure measured about 2–3 mm away from the TM by an ER-7C (Etymōtic Research) probe microphone connected through a hole in the coupler wall. The upper limit of the frequency range of interest in this study is 10 kHz. Within that range, replacement of the normal ear-canal wall by a coupler is not expected to have a significant effect on the normalized vibration measurements.
Glass-coated plastic beads of diameter of 90 to 150 μm (Sigma-Aldrich, model G4519) were used to increase reflection of the laser beam and mark the measurement locations. In each ear, three or four target beads were placed on the manubrium. One bead was placed approximately at the centre of the pars flaccida. Up to three beads were placed on each of the posterior and anterior parts of the pars tensa at the level of the middle of the manubrium, and a few more were placed in the region just posterior, anterior and inferior to the umbo. Images of the TM with beads were shown in Figure 2 of Maftoon et al. (2013).
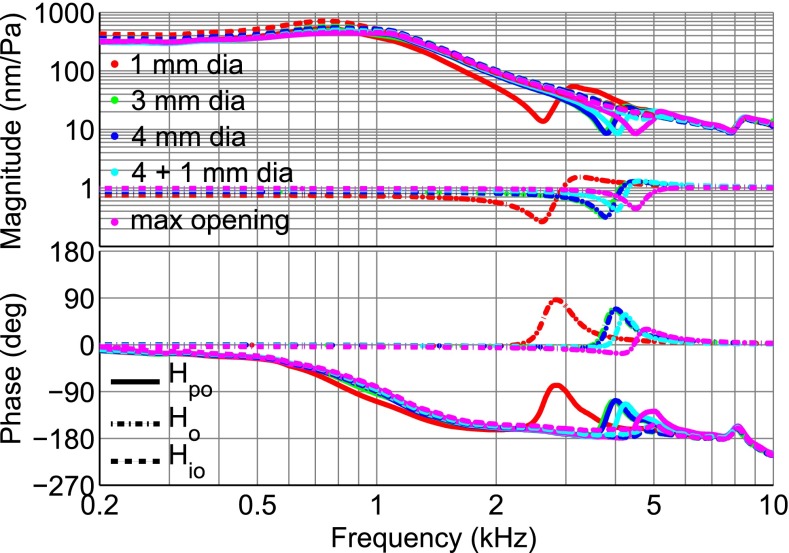
FIG. 2.
Closed and open-cavity umbo displacement responses, normalized by sound pressure, for various sizes of the cavity-wall opening in gerbil J. In this ear, the pars flaccida was retracted.
A 1600-line FFT was used to transform the recorded vibrometer and microphone time-domain signals to the frequency domain. A two-pass (forward and reverse) moving-average filter with a window length of 5 was applied to the real and imaginary parts of the complex signal and the magnitude and phase responses were then calculated.
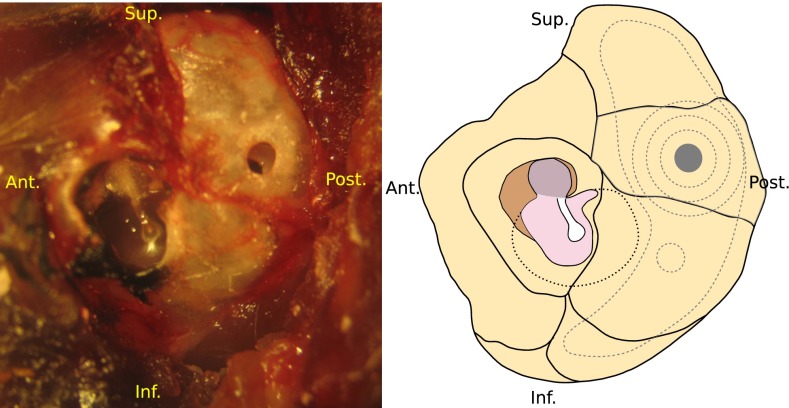
As mentioned above, in the ‘closed-cavity’ condition, the cavity wall had a small ventilation hole and a ventilation tube in place. After finishing the closed-cavity data collection, as reported in Maftoon et al. (2013), the cavity was opened to varying extents. To start, we simply removed the ventilation tube from the cavity wall, which left a hole about 1 mm in diameter. This hole can be seen in the cavity wall shown in the left panel of Figure 1 and it is shown as a grey-filled circle in the right panel of that figure. The umbo response was recorded several times at this stage, and again after replacing the ventilation tube, and then after removing it again, to ensure repeatability of this process. The hole was then enlarged progressively, as shown schematically in the right panel of Figure 1 by concentric circles and an additional 1-mm circle (grey dashed lines), and finally the cavity wall was removed as much as possible, shown by the large irregular closed curve (grey dashed line) in the figure. The approximate boundary of the pars tensa is indicated by a dashed black curve in the figure. The figure also indicates the approximate positions of the internal compartment borders of the middle-ear cavity (solid black lines). As can be seen in this figure, even at the maximum possible opening, some portion of the walls of the middle ear remained intact. The complete removal of the middle-ear cavity wall was impossible due to surgical constraints. At each intermediate stage, measurements were taken several times. To speed up the process and thus avoid temporal effects, these intermediate measurements were done only at the umbo. As in Maftoon et al. (2013), responses are reported for two different pars-flaccida conditions: when it is naturally flat (gerbils D, E and K) and when it is retracted into the middle-ear cavity. The state of the pars flaccida is not affected by opening the middle-ear cavity, as discussed in the above-mentioned article: if a pars flaccida is retracted in the closed-cavity condition, then it remains retracted after the cavity is opened, and if flat, then it remains flat.
FIG. 1.
Left panel: lateral view of the gerbil middle-ear cavity wall and the tympanic membrane. A ventilation hole of about 1 mm in diameter has been made in the cavity wall. Right panel: a schematic representation of the cavity wall, the tympanic membrane and our progressive opening of the cavity wall. The ventilation hole (about 1 mm in diameter) is shown as a grey-filled circle. Progressive enlargement of the hole is shown by concentric circles and an additional 1 mm circle (grey dashed lines). The final maximal opening is shown by the large irregular closed curve (grey dashed line). The approximate boundary of the pars tensa is indicated by a dashed black curve and the approximate positions of the internal compartment borders of the middle-ear cavity are indicated by solid black lines.
Estimation of ideal open-cavity responses
The major feature added to the frequency responses upon partially opening the middle-ear cavity is a minimum, or notch, which is the acoustical signature of the opening and is seen in results from all measurement points. To estimate the ideal open-cavity response, this feature (referred to below as the ‘opening feature’) should be identified and removed. One way to approach this problem is to (1) develop a model for the middle ear which is based on physical and physiological properties of the structures and which includes a representation of the opening in the cavity wall (e.g. Ravicz et al., 1992); (2) adjust the model parameters to fit the model to the experimental data; and then (3) eliminate the part of the model that corresponds to the opening. The disadvantage of this approach is that motions in the middle ear are complex and the development of a model that can closely fit all of the experimental results over the entire frequency range in each individual ear is very difficult, and indeed may not be possible in principle. Another approach for estimating the ideal open-cavity response, which we follow here, consists of direct mathematical identification and removal of the specific feature that corresponds to the partial opening.
We propose a method for finding the frequency-response function Ho corresponding to the opening feature, such that if the measured frequency response with a partially open cavity (Hpo) is divided by Ho then the response Hio of a cavity with an ideal complete opening is obtained:
 |
1 |
The method described here was implemented using MATLAB and the Signal Processing Toolbox (version 2012a, The MathWorks Inc.). The identification is performed by curve fitting to Hpo in the frequency range where the targeted feature resides. We employed the ‘rational fraction polynomials (RFP) method’ developed by Richardson and Formenti (1982) to perform the frequency-domain curve fitting. The RFP method is extensively used in identification of vibrating systems (e.g. Maia & Ewins, 1989; Formenti & Richardson, 2002; Meruane, 2013). Fitting by a rational fraction of polynomials results in a system of equations that is generally ill-conditioned (Richardson & Formenti, 1982). The use of orthogonal polynomials improves the numerical robustness of the method, in part by uncoupling the equations for the numerator and denominator coefficients. It also permits the use of the Hermitian symmetry of the frequency responses about the origin to reduce the size of the problem by half. Furthermore, the method of Richardson and Formenti uses the Forsythe orthogonal polynomial (Forsythe, 1957). Rolain et al. (1995) proved that, in the rational-fraction frequency-response form, no other polynomial basis can provide a better conditioning than the Forsythe polynomials do. We have used a MATLAB implementation of the RFP method by Gutiérrez Acuña (2003). In this method, the frequency response within a frequency range is fitted by a rational fraction of orthogonal polynomials:
 |
2 |
where L is the number of positive-frequency data points, and ck and dk are polynomial coefficients to be found in the curve fitting process. Each of φi and θi is a set of orthogonal polynomial functions generated recursively with a simplified version of the method of Forsythe (1957), using real polynomials instead of complex ones. Each polynomial in the φ and θ sets is orthogonal to the other polynomials in its set with respect to a weighting function defined at each frequency. In the RFP method, the weighting functions are equal to 1 for φi and to the magnitude squared of the frequency-response data for θi. The curve fitting involves minimizing the squared error between the fitted curve and the experimental response over a specified frequency range. Once the polynomial coefficients are found, the frequency response is converted to the ordinary rational fraction polynomial form (Kelly, 1967, chapter 5):
 |
3 |
where j2 = −1 and ω is the angular frequency.
In our application of the method, in order to facilitate the subsequent removal of the opening feature, we convert Eq. 3 to the pole-zero form (e.g., Chen, 2010; Funnell et al., 2012), leading to
 |
4 |
where g is the gain; m and n are the same as in Eqs. 2 and 3; and zk and pk are zeroes and poles, respectively, which either are real-valued or occur in complex-conjugate pairs  and
and  . The conversion is done using the tf2zp MATLAB function.
In this paper, the quality of the fit (Q) in a frequency range between ωa and ωb is assessed by the normalized root-mean-square error:
 |
5 |
where Hf is the fitted curve, the overbar indicates the mean, and ║•║ is the L2 norm. To find the appropriate number of poles and zeroes, the fitting was always done starting from the lowest order for the polynomials and only if the quality of the fit was not acceptable (Q ≤ 90 %) was the order increased. Some of the poles and zeroes of the fitted curve are used to construct the frequency-response function Ho of the opening feature, as will be described below. A good fit (Q > 90 %) to the opening feature can be obtained with polynomials of orders m = 3, n = 4. Using Eq. 4, the pole-zero form of Hf can then be written as
 |
6 |
Hf usually consists of a real zero, a complex-conjugate pair of zeroes and two complex-conjugate pairs of poles. In some cases, the fitting algorithm produces two real poles and one complex conjugate pair of poles instead of two complex-conjugate pairs of poles. For constructing Ho, we keep only the poles and zeroes that are close to the fitting frequency range. The complex-conjugate pair of zeroes, to be denoted here as ( ), occurs at the central frequency of the opening feature. This is consistent with our expectation that such a sharp minimum in the response should be related to a complex-conjugate pair of zeroes at that frequency. Therefore, za and
  are taken as two constituents of Ho. The pair of zeroes is always accompanied by a complex-conjugate pair of poles at a slightly higher frequency (
 ). Including this pair of poles ensures that the magnitude of Ho approaches 1 and that its phase approaches 0 at low and high frequencies, as required. Based on the selected poles and zeroes, Ho can be written as
 |
7 |
This function generates a minimum and a maximum at the frequencies of the zero and pole, respectively, as will be seen in the section “Estimated Ideal Open-Cavity Responses”. Once Ho is known, the ideal open-cavity response Hio can be found using Eq. 1.
We assume that the opening feature is shared among all pars-tensa and manubrial responses and that it can be identified from any of these responses. Since other features in the manubrium responses are less prominent than those of the pars-tensa responses (e.g. Figure 5 vs. Figure 7 in Maftoon et al., 2013, and similar results in this paper), identification of the opening feature is done based on the response of a manubrial point. The identified frequency response of the opening feature is then removed from all pars-tensa and manubrium frequency responses.
FIG. 5.
Frequency of the notch due to the acoustical effect of the opening in the cavity wall, as a function of cavity-wall hole size, for recordings made at the umbo. Data from ears with a flat pars flaccida are indicated by triangles.
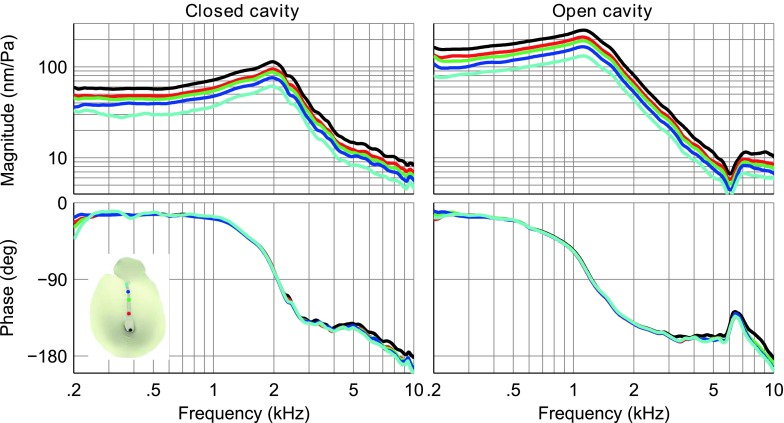
FIG. 7.
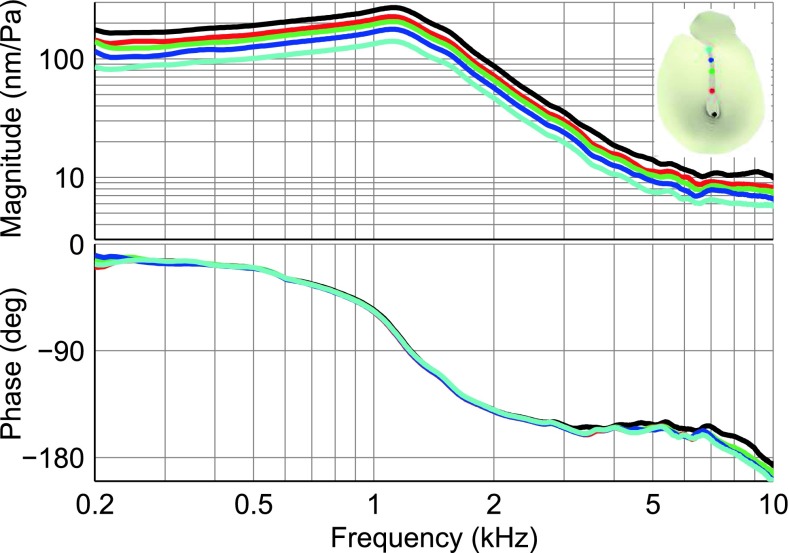
Manubrial displacement responses with closed cavity and maximally open cavity, normalized by sound pressure, in gerbil H. Response of each point along the manubrium is shown in the colour of the corresponding the location in the TM schema inset.
RESULTS
Umbo vibrations
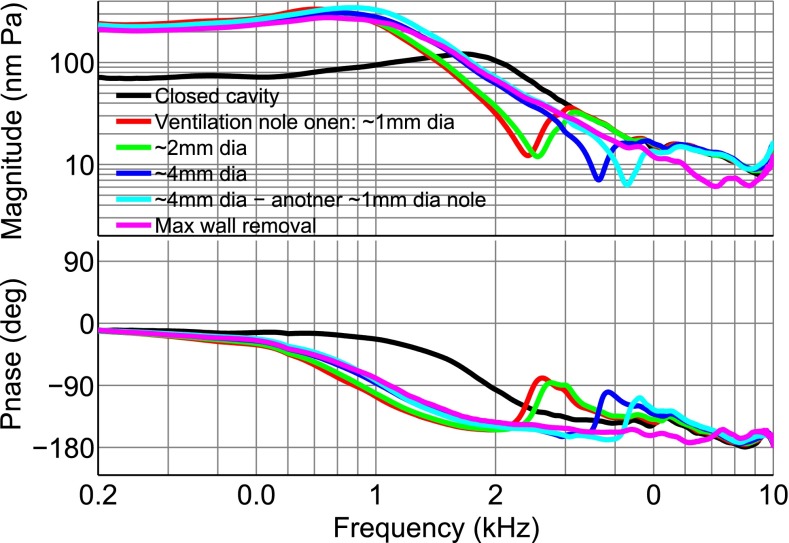
As seen in the typical result shown in Figure 2 for an ear with a retracted pars flaccida, removing the ventilation tube from the cavity wall and leaving a hole of about 1 mm in diameter causes a jump in the low-frequency umbo response from about 70 to 230 nm/Pa. In all ears, to ensure that the observed changes were due to removal of the ventilation tube, the tube was removed and replaced a few times to check for repeatability. Progressive enlarging of the opening does not cause much further change to the response at low frequencies.
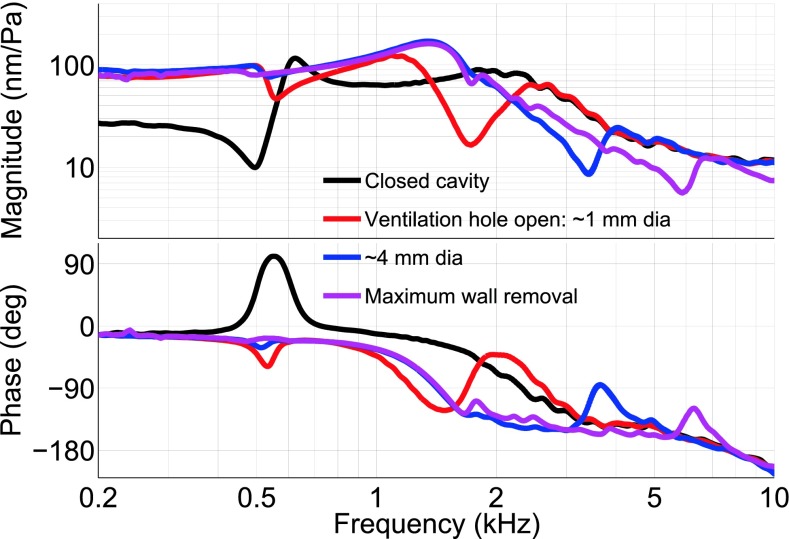
To illustrate the more complicated case of a flat pars flaccida, Figure 3 shows the results of progressive opening in gerbil E. As for the case with a retracted pars flaccida, there is a low-frequency magnitude jump due to opening the middle-ear cavity, from 26 to 76 nm/Pa in this ear. In the maximally open-cavity condition, the pars flaccida affects the umbo response in a narrower frequency range (440 to 650 Hz, with a minimum at 490 Hz) than in the closed-cavity condition (in which it affects the umbo response from the lowest frequency up to about 900 Hz). When the middle-ear cavity is progressively opened, the minimum corresponding to the pars flaccida contribution to the umbo response becomes progressively shallower.
FIG. 3.
Closed and open-cavity umbo displacement responses, normalized by sound pressure, for various sizes of the cavity-wall opening in gerbil E. In this ear, the pars flaccida was flat.
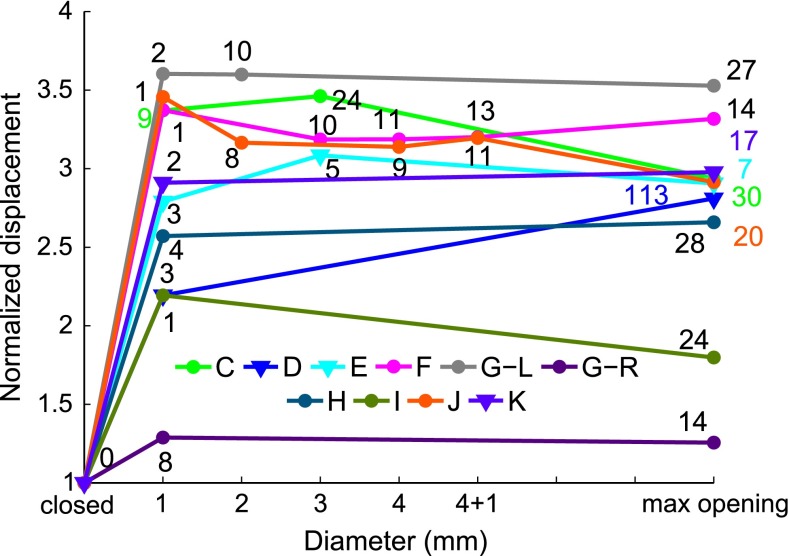
The effect of the size of the opening on the low-frequency (297 Hz) displacement magnitude is shown in Figure 4. In all ears except the right ear of gerbil G, the magnitude with the smallest opening (1 mm in diameter) is from 2.1 to 3.5 times the closed-cavity magnitude. The displacement magnitude with the smallest opening in the right ear of gerbil G is only 1.3 times the closed-cavity value. In most cases, enlarging the opening further does not influence the responses much, the magnitude difference between the largest and smallest hole being less than 5 % (0.4 dB). In three ears, this difference is from 15 to 30 % (1.2 to 2.3 dB). Data from ears with flat and retracted pars flaccida are indicated by different symbols and it is seen that the patterns are the same.
FIG. 4.
Effect of the size of the hole in the cavity wall on the low-frequency displacement magnitude of the umbo. The horizontal axis gives the hole diameter. The vertical axis gives the open-cavity umbo displacement magnitude, normalized by the closed-cavity response, at 297 Hz. Labels on the curves show the time difference to the initial closed-cavity measurement in minutes. Data from ears with a flat pars flaccida are indicated by triangles.
In Figure 2 (with a retracted pars flaccida), opening the middle-ear cavity causes a shift in the apparent middle-ear resonance frequency (reflected in both the magnitude and phase curves) from about 1,650 to 700 Hz and increases the resonance peak magnitude from 120 to 335 nm/Pa. In Figure 3 (with a flat pars flaccida), maximal opening of the cavity shifts the apparent middle-ear resonance from about 1,600 Hz, in the closed-cavity condition, down to about 1,350 Hz, and increases the resonance peak magnitude from 90 to 170 nm/Pa. In Figure 2, the middle-ear resonance frequency with a maximum possible opening appears to be at 950 Hz, but with a hole 1 mm in diameter it appears to be at 700 Hz. This point can be seen more clearly in Figure 3, where the middle-ear resonance frequency with a maximum possible opening appears to be at 1,350 Hz, while with a hole 1 mm in diameter it appears to be at 1,100 Hz.
Our observations in ears with a maximally opened middle-ear cavity and a flat pars flaccida (gerbils D, E and K) are summarized in Table 1 along with data from Rosowski et al. (1997, 1999). (The velocity data of Rosowski et al. have been converted to displacements.) The open-cavity umbo magnitudes reported by Rosowski et al. for low frequencies and at the resonance peak are within the ranges of the values observed in this study. After opening the cavity, in all flat pars-flaccida ears, the frequency of the minimum of the pars-flaccida contribution either remained the same or shifted slightly higher (about 50 Hz) in frequency. We verified the independence of this frequency shift from drying effects by recording the displacement with the ventilation tube in its place, recording after removing the ventilation tube and then again after replacing it, and observing that the frequency shift was reversible. All ears in this study, and also the ear from Rosowski et al., show a shift of the resonance to lower frequencies and an increase in the resonance peak magnitude.
TABLE 1.
Effects of maximal opening of the middle-ear cavity on umbo displacements for three ears with flat pars flaccida, compared with one ear from Rosowski et al. (1997, 1999)
| Gerbil D | Gerbil E | Gerbil K | Rosowski et al. (1997, 1999) | |||||
|---|---|---|---|---|---|---|---|---|
| Closed | Open | Closed | Open | Closed | Open | Closed | Open | |
| Low-frequency magnitudes (nm/Pa) | 40 | 120 | 26 | 76 | 65 | 190 | 55 | 160 |
| Frequency of the minimum of the pars-flaccida contribution (Hz) | 720 | 800 | 490 | 490 | 870 | 920 | 350 | 400 |
| Resonance frequency (kHz) | 1.8 | 1.4 | 1.6 | 1.4 | 1.8 | 1.1 | 2.1 | 0.9 |
| Magnitudes at resonance (nm/Pa) | 85 | 200 | 90 | 170 | 126 | 250 | 110 | 205 |
At higher frequencies, the pars flaccida has little effect and the umbo responses of ears with either flat or retracted pars flaccida share similar features. As shown in Figure 2, an antiresonance emerges at about 2.4 kHz due to the addition of a 1-mm hole in the cavity wall. (In all ears, for a hole of 1 mm in diameter, the antiresonance was observed to be between 1.7 and 2.6 kHz.) The increases in the diameter from 1 to 4 mm, and then the addition of another hole of 1 mm in diameter, cause the antiresonance in this ear to be at about 2.4, 2.6, 3.6 and 4.3 kHz, respectively, and when the cavity wall was opened as much as possible, the antiresonance was pushed beyond 7 kHz. A progressive shift of the antiresonance due to progressively enlarging the opening is also seen in Figure 3 for a flat pars flaccida. (In order to reduce possible temporal effects, the results in Fig. 3 were recorded with only two intermediate stages between the closed condition and the maximum possible opening. The time between the initial and final stages was reduced from 20 min for Fig. 2 to 7 min for Fig. 3.)
Antiresonance frequencies as a function of hole size are shown for ten ears in Figure 5. Leaving the ventilation hole open (1 mm in diameter) caused antiresonances between 1.7 and 2.6 kHz, and enlarging the opening always caused the antiresonance to be shifted to higher frequencies. The frequency of the antiresonance with maximal opening was quite variable, ranging from 3.7 to 9.5 kHz. Different surgical constraints (e.g. body size and weight, fixation angle of the head in the positioning device under the microscope, extent of removal of soft tissues and position and angle of the coupler and of the dental cement used for fixing it) resulted in different sizes of opening for different animals. Data from ears with flat and retracted pars flaccida are indicated by different symbols and again it is seen that the patterns are the same. Unlike the low-frequency magnitude, which is not affected much by the extent of opening, the notch moves to higher frequencies as the opening gets bigger.
Pars-flaccida vibrations
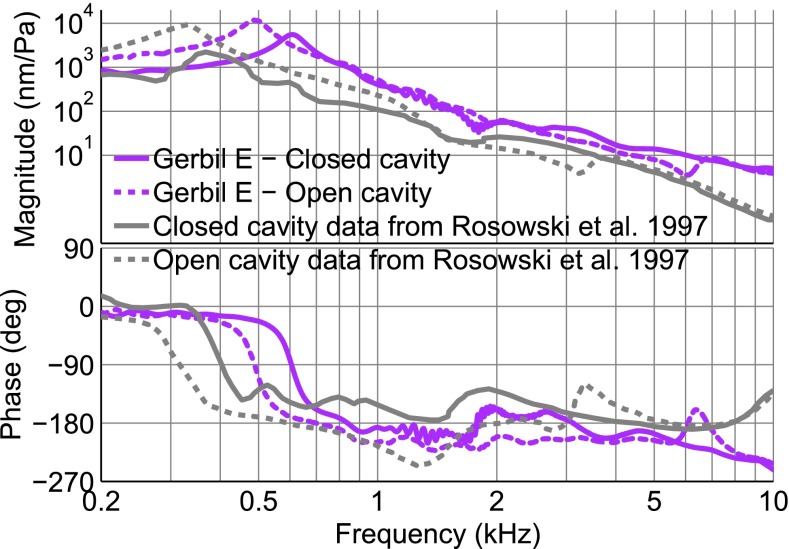
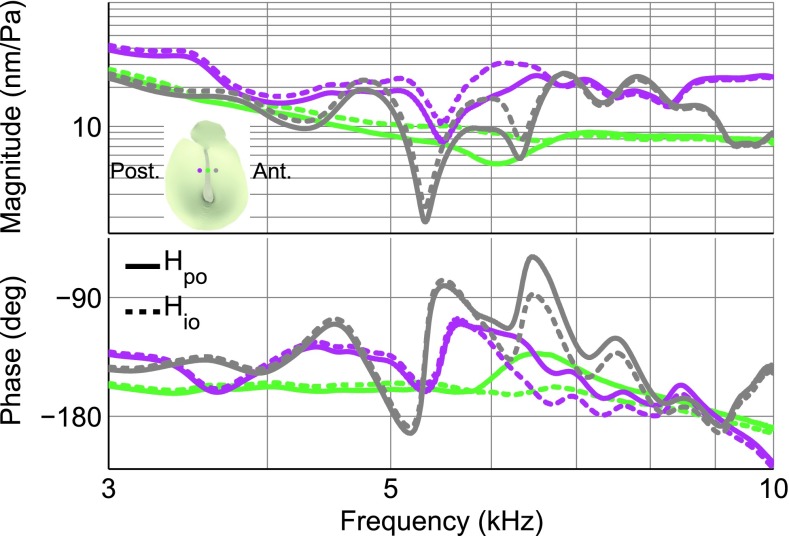
We obtained reliable open-cavity pars-flaccida measurements in only one of the three animals that had a flat pars flaccida. The effect of opening the middle-ear cavity on the pars-flaccida response in that ear is illustrated in Figure 6. The data were collected when the cavity wall had been removed as much as possible. Opening the middle-ear cavity caused an increase in the low-frequency magnitude and a shift of the pars-flaccida resonance to a lower frequency. Above this frequency, the open-cavity response approached the closed-cavity response except in the region of the antiresonance at about 6 kHz that is due to the opening of the cavity. The pars-flaccida resonance in this ear shifted from about 610 to about 490 Hz. The magnitudes at 200 Hz and at the resonance almost doubled (from 0.8 to 1.6 μm/Pa and from 5.5 to 11.6 μm/Pa, respectively), but the ratio stayed approximately the same. In ears with a retracted pars flaccida, opening the middle-ear cavity did not change the resonance frequency of the pars flaccida, but did cause increases of 4 to 10 dB in the low-frequency displacement magnitude, comparable to the increases in the ear with a flat pars flaccida.
FIG. 6.
Closed-cavity and open-cavity pars-flaccida displacement responses, normalized by sound pressure, in gerbil E (magenta curves). In this ear, the pars flaccida was flat and the open-cavity data were collected when the cavity wall had been removed as much as possible. For comparison, closed-cavity and open-cavity displacements of the pars flaccida of Rosowski et al. (1997), with a 1.2-mm hole in diameter in the cavity wall, are also shown (grey curves).
Manubrial vibrations
Typical results for vibrations along the manubrium are provided in Figure 7. The responses were recorded with the maximum possible removal of the cavity wall, and the antiresonance due to the opening is located at about 6 kHz. Comparison of the panels on the left (closed cavity) and on the right (open cavity) demonstrates that opening of the middle-ear cavity affects the responses of all of the manubrial points in the same way. The closed-cavity low-frequency magnitudes for points from the short process of the malleus to the umbo vary from 30 to 57 nm/Pa in this ear, a ratio of 1.9; the open-cavity magnitudes vary from 80 to 155 nm/Pa, larger but still with a ratio of 1.9. At the resonance, the magnitudes from the short process to the umbo, which were from 62 to 113 nm/Pa (a ratio of 1.8) for the closed cavity, became 131 to 253 nm/Pa (a ratio of 1.9) when the cavity was opened. Across all ears, in the closed-cavity condition, the umbo-to-short-process displacement magnitude ratios were between 1.60 and 1.90 at low frequencies and between 1.64 and 1.86 at resonance. When the cavity was opened, the umbo-to-short-process magnitude ratios changed by less than 8 % at low frequencies and by less than 11 % at resonance in all ears. As described in Maftoon et al. (2013), in the closed-cavity condition, the umbo starts to have a different phase than the other manubrial points for frequencies as low as 5 kHz. After opening the cavity, the same behaviour is present in Figure 7, but due to the interference with the opening feature, it is less noticeable between 5 and 7 kHz. The phase difference reaches about 14 ° at 10 kHz.
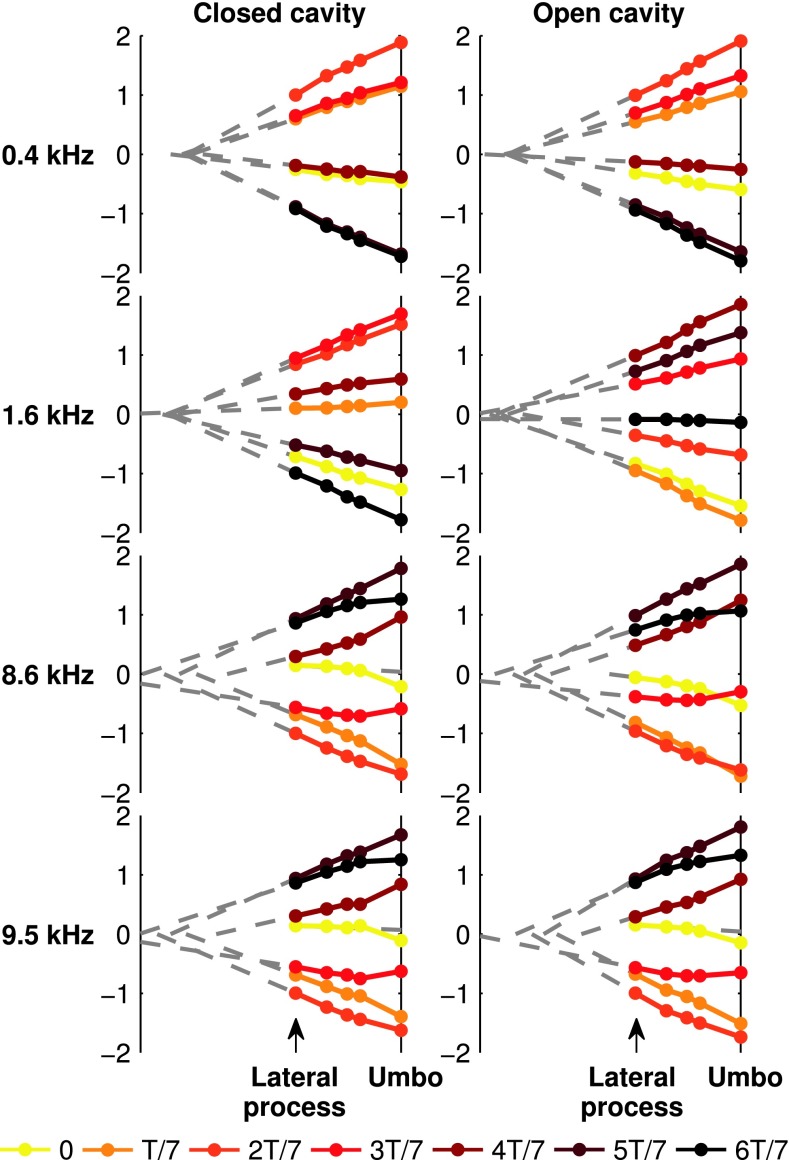
Figure 8 shows how opening the middle-ear cavity affects the vibration modes of the manubrium. In this figure, the displacements of the points on the manubrium, normalized by the displacement of the lateral process of the malleus, are drawn for four frequencies and for seven equally spaced time instants within each cycle. This figure shows that the manubrium behaves similarly in the open-cavity and closed-cavity conditions. The displacements at the lowest frequencies (400 and 1,600 Hz) are typical for an almost rigid body (say a rod) that rotates in a plane about a nearly fixed point. (In reality the manubrium vibrates in 3-D space—in the plane of the figure and in two planes perpendicular to this plane—but our 1-D observation does not capture the displacements in the planes perpendicular to the plane of the figure. This ‘point of rotation’ is the point where the instantaneous 3-D axis of rotation crosses the plane of the figure.) Note that at 1,600 Hz the temporal order of appearance is different in the closed-cavity and open-cavity results. This is because of the shift in the middle-ear resonance after opening the cavity, which caused a significant phase change. At this frequency, the phases of manubrium points are about −45 ° with an open cavity (Fig. 7) and about −125 ° with a closed cavity (Figure 5 in Maftoon et al. 2013). The point of rotation remains almost unchanged after opening the cavity. At 8,600 and 9,500 Hz, closed- and open-cavity measurements show varying points of rotation and similar non-straight lines. As pointed out by Maftoon et al. (2013) for the closed-cavity condition, these characteristics can be attributed to flexing in the region of the umbo, changes in the 3-D rigid-body vibration mode of the malleus, or both.
FIG. 8.
Sinusoidal motion of the manubrium at seven time instants (multiples of T/7) throughout the cycle in gerbil H at frequencies of 400, 1,600, 8,600 and 9,500 Hz, with closed cavity (left) and open cavity (right).
Pars-tensa vibrations
Generally, the changes in the pars-tensa response when the middle-ear cavity is opened are similar to the changes that occur in the umbo response. These changes include the low-frequency magnitude increase, the shift of the main resonance to lower frequencies and the appearance of an antiresonance. However, unlike the main resonance, the break-up of the pars-tensa vibration pattern still happens at about the same frequency as with a closed cavity.
Since the high-frequency pars-tensa response shapes are very complicated, and differences between open-cavity and closed-cavity measurements at any specific point may involve a combination of cavity and temporal effects, a detailed analysis of response features is very difficult. However, by a close point-to-point comparison between the two conditions, as shown in Figure 9, one can appreciate that, although the detailed shapes of the curves change somewhat, opening of the middle-ear cavity does not shift high-frequency response features to lower frequencies, as is the case with the shift of the main resonance. In this figure, each arrow follows the shift of a feature from the closed-cavity response (upper panel) to the maximally open response (lower panel). The arrows have the same colour as the responses that they track. As an example, the grey arrow tracks a feature in the responses recorded at a point just anterior to the manubrium; this feature shifted upward by about 300 Hz. The time intervals between measuring at one point on the pars tensa in the closed-cavity condition and measuring at same point in the open-cavity condition were between 25 and 75 min (average 50 min). The small (100–300 Hz) frequency-dependent and location-dependent shifts toward higher frequencies that are seen in Figure 9 may be related to drying effects. The shifts look more prominent than in previous figures because of the expanded frequency scale in this figure.
FIG. 9.
Pars-tensa displacement responses with closed cavity (top) and maximally open cavity (bottom), normalized by sound pressure, in the left ear of gerbil G. Each coloured arrow shows how a feature in the response at a specific location on the pars tensa changed after opening the middle-ear cavity. Each arrow has the same colour as the responses that it tracks. Each curve colour represents a pars-tensa point as marked in the TM schema inset.
Estimated ideal open-cavity responses
Validation of the method
In this section, we validate the method using frequency responses in which the ideal open-cavity responses are known. First, we synthesize a frequency-response function Hpo that is designed to be similar to an umbo response when an opening exists in the cavity wall. The synthesis is done by combining six pairs of complex-conjugate poles and five pairs of complex-conjugate zeroes (shown in Table 2) using Eq. 4. The synthesized frequency response has the same frequency resolution as the present experimental data.
TABLE 2.
Parameters used for synthesizing the frequency responses plotted in Figure 10. See Eqs. 1 and 4 for notations
| g | 109 | ||||
|---|---|---|---|---|---|
| Ideal open-cavity poles | (3 ± 13.7j) × 103 | (6 ± 32.1j) × 103 | (7 ± 30.1j) × 103 | (50 ± 27j) × 103 | (3 ± 6j) × 103 |
| Ideal open-cavity zeroes | (2 ± 15j) × 103 | (8 ± 32j) × 103 | (9 ± 30j) × 103 | (10 ± 25j) × 103 | |

|
(1.2 ± 12j) × 103 | ||||

|
(0.4 ± 11j) × 103 | ||||
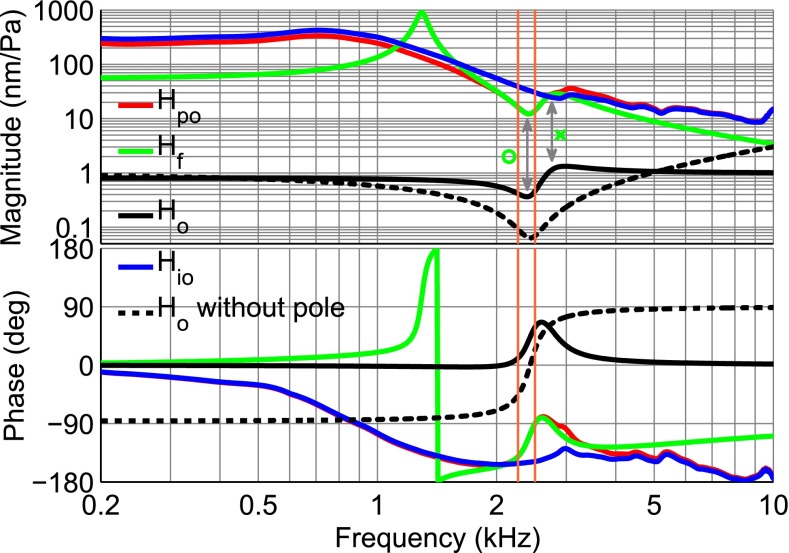
Figure 10 shows the synthesized Hpo in red. The ideal open-cavity response Hio (blue) is synthesized by ignoring the known complex-conjugate pairs of poles and zeroes  and
and  that form the opening feature in the response. The method described in the section “Estimation of Ideal Open-Cavity Responses” was applied to the synthesized Hpo (red) in order to estimate the ideal open-cavity response. A curve Hf was fitted to the Hpo using only the data in a narrow frequency range around the notch, indicated by the two vertical orange lines. Hf is shown in green and was plotted over the entire frequency range. Hf is used to define the poles and zeros within the fitting range, and the deviations from Hpo at higher and lower frequencies are irrelevant to this analysis. The black curve is the estimated Ho obtained from Hf by keeping only the poles and zeroes that are close to the frequency range over which the fitting was done. As can be seen in this figure, the estimated ideal open-cavity response Hio (cyan) is essentially the same as the expected response (blue).
FIG. 10.
Estimation of the ideal open-cavity response H io of a frequency response synthesized from poles and zeroes as described in the text, using the parameters in Table 2.
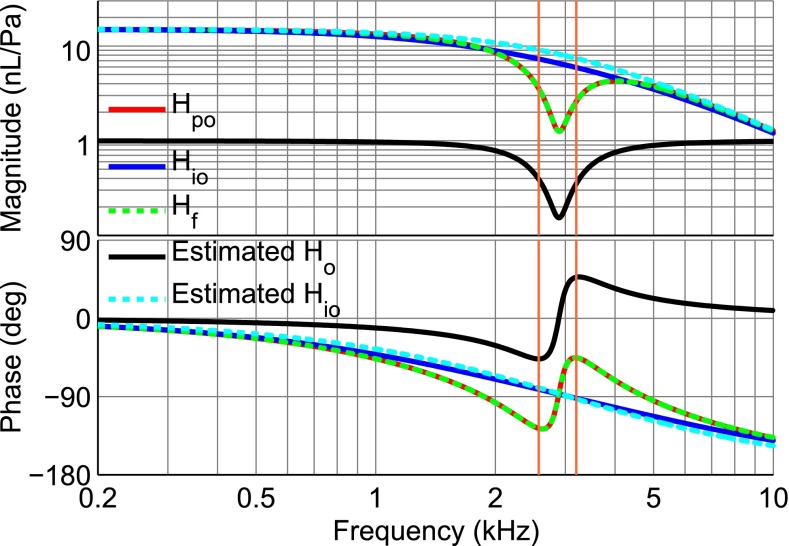
Next, we evaluate our method using a circuit model suggested by Teoh et al. (1997) for the gerbil middle ear based on their admittance measurements. The red line in Figure 11 shows the response of their circuit model with an immobilized pars flaccida and an opening in the cavity wall (their switch positions B and 3), with the parameters for their B8 right ear. We have expressed the circuit response as acoustic receptance (volume displacement/sound pressure), comparable to our normalized vibration displacement measurements. By short-circuiting the cavity and the opening in the cavity wall (their switch positions B and 2), the ideal open-cavity response is obtained (blue). To apply the method suggested in “Estimation of Ideal Open-Cavity Responses”, a curve (green) was fitted to the response in the frequency range shown by the two vertical orange lines, and the ideal open-cavity response (cyan) was estimated. The estimation shows a maximum error of less than 2 dB in magnitude and 6 ° in phase.
FIG. 11.
Estimation of the ideal open-cavity response H io of a gerbil middle-ear circuit model (blue) suggested by Teoh et al. (1997). With a hole, the circuit produces H po (red). An RFP frequency response H f (green) is fitted to the measured response in the frequency range indicated by the two parallel orange lines. The estimated H o (solid black) was used to estimate H io (cyan).
Umbo response
Figure 12 illustrates the application of our method for correcting for the effect of opening the middle-ear cavity, in this case for the umbo response of gerbil J with the smallest opening in the cavity wall (in red and the same as Fig. 2). The centre frequency of the opening feature is at 2.4 kHz. The green line shows Hf (Eq. 6), plotted over the entire frequency range but obtained from the fit over the narrow frequency range shown by two parallel vertical orange lines (2.27 to 2.5 kHz). Figure 13 depicts the poles and zeroes of Hf. The poles and zeroes shown in green are the ones that are used in constructing Ho and are marked in Figure 12 as well. The other poles and zeroes, shown in red in Figure 13, are far from the frequency range over which the fitting was performed. The blue curve shows the ideal open-cavity response Hio estimated using Eq. 1.
FIG. 12.
Estimation of the ideal open-cavity umbo response H
io (blue) based on the measurement with the smallest size of cavity-wall opening H
po (red) in gerbil J. An RFP frequency response H
f (green) is fitted to the measured response in the frequency range indicated by the two parallel orange lines. From this fitted frequency response, the complex conjugate pair of zeroes  at the central frequency of the opening feature (marked with an arrow and open circle) and the complex conjugate pair of poles
  at a slightly higher frequency (marked with an arrow and a cross) were taken to form H
o (solid black). The dashed black line is what would result if H
o included only the complex conjugate pair of zeroes.
FIG. 13.
Pole-zero diagram of the fitted RFP frequency response H f of Figure 11. Each open circle corresponds to a zero and each cross symbol corresponds to a pole. The poles and zeroes shown in green are the ones used in the definition of H o, while the ones shown in red are excluded.
In Eq. 6, the complex-conjugate zeroes are mainly responsible for providing the sharp minimum. As designed, the magnitude of Ho (black curve in Fig. 12) tends to 1 and its phase tends to 0 at both low and high frequencies. If only the complex-conjugate zeroes were included in the definition of Ho, the high-frequency part of the magnitude of Ho would grow with frequency (see the dashed line in Fig. 12). The complex-conjugate poles ( ) are responsible for making the high-frequency magnitude approach a value of 1 and for making both the low-frequency phase and the high-frequency phase approach 0.
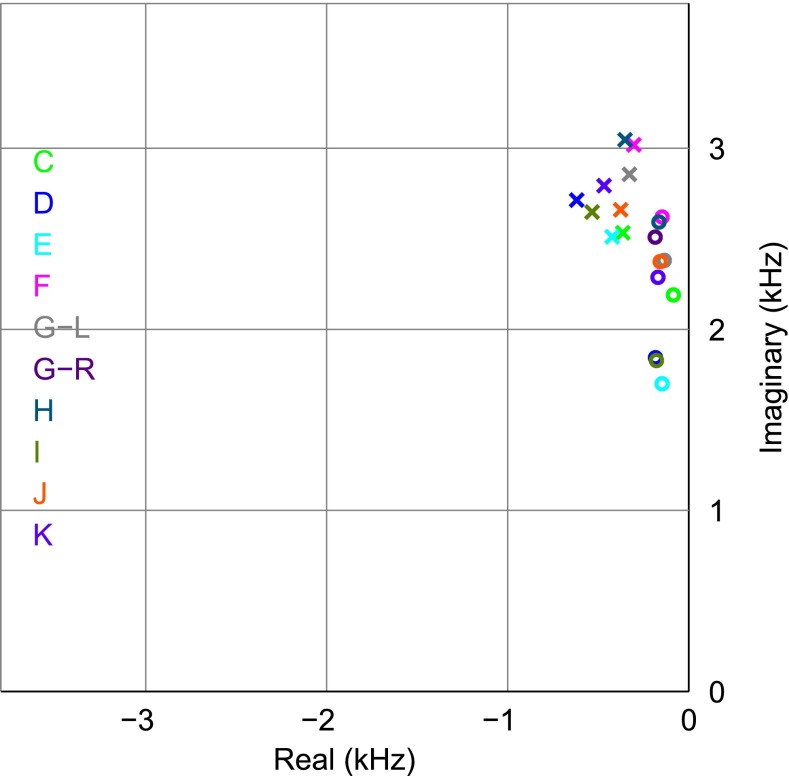
Figure 14 shows the pa and za calculated for the umbo responses with a 1-mm opening in the cavity wall, for all ears. This figure shows only the poles and zeroes with positive frequencies; their negative-frequency counterparts (complex conjugates  ) can be imagined by mirroring the figure around the real axis (see Fig. 13). The imaginary parts of the complex values of the zeroes (1.7 to 2.6 kHz) are very similar to the antiresonance frequencies shown in Figure 5. In that figure, the frequency of an antiresonance was taken to be the frequency at which the notch has its minimum. The differences between the antiresonance frequencies estimated using the two methods are less than 2 %. The real parts of the complex values are related to the damping of the system. The real parts of the zeroes from all ears are located within a rather narrow band of about 0.1 kHz. This shows that the ears exhibited similar damping characteristics at frequencies in the vicinity of the antiresonance.
FIG. 14.
Pole-zero diagram of the positive-frequency complex poles (p a) and zeroes (z a) for the first size of opening (1 mm) in the cavity wall for all ears. Each open circle corresponds to a zero and each cross symbol corresponds to a pole.
Sensitivity to the fitting range
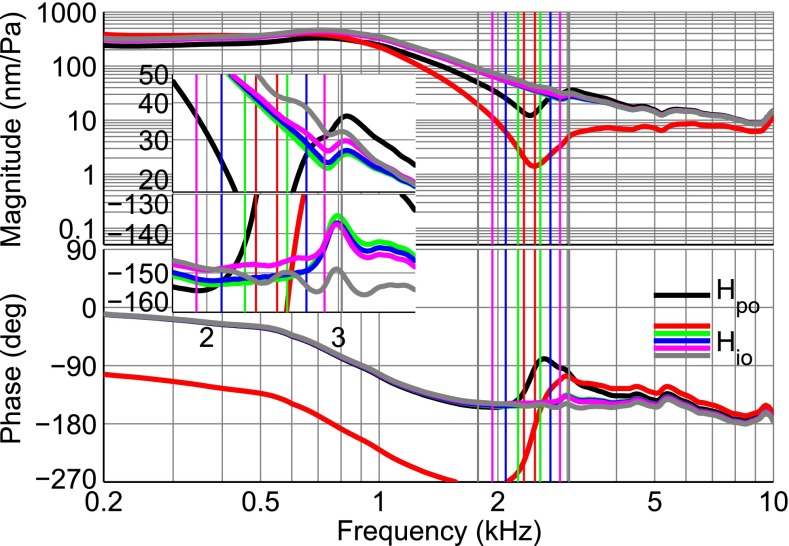
To assess the effects of the frequency range over which the fitting is done, in Figure 15, we have applied the method to the same data as presented in Figure 12 but now with five different fitting frequency ranges, with widths of 155 to 1,250 Hz (20 to 160 FFT lines), centred at the frequency of the opening feature. Each frequency range is indicated by a pair of vertical lines of the same colour, the narrowest range being shown in red. The estimated ideal open-cavity responses are shown in the same colours as their respective frequency ranges. Except for the narrowest frequency range (red), the estimated responses are very similar. At mid and high frequencies, the umbo response displays irregularities that have bandwidths of a few hundred Hertz, magnitude changes of a few decibels and phase changes of a few tens of degrees, as discussed by Maftoon et al. (2013). The second and third frequency ranges (green and blue lines) do not include major irregularities. Between these two ranges, the maximum difference is 0.48 dB and the average difference is 0.04 dB over the entire frequency spectrum. For the first three ranges, Q > 99 %, but as the frequency range expands, it includes more of the irregularities in the umbo frequency response so the quality of the fit decreases (Q = 97.9 and 94.4 % for the two widest ranges, magenta and grey, respectively) and the estimated ideal open-cavity responses become slightly different: the maximum differences between the frequency responses for the second range and those for the two widest ranges, magenta and grey, are 1.24 and 2.85 dB, respectively, and the average differences are 0.11 and 0.31 dB, respectively.
FIG. 15.
Effect of the range of fitting on the estimation of the ideal open-cavity H io and opening H o frequency responses. The measured response in gerbil J with partially open cavity H po (1 mm hole) is shown in black. The estimated ideal open-cavity response H io based on the narrowest range (155 Hz, indicated by two parallel vertical red lines) is shown in red. The results for four other ranges (up to 1,250 Hz, each indicated by two parallel vertical lines of the same colour) are also shown. The estimated ideal open-cavity response H io corresponding to each range is shown in the same colour as the pair of vertical lines. The insets show a zoomed-in view of the responses in the frequency range of 1.8 to 3.8 kHz.
Effect of enlarging the opening
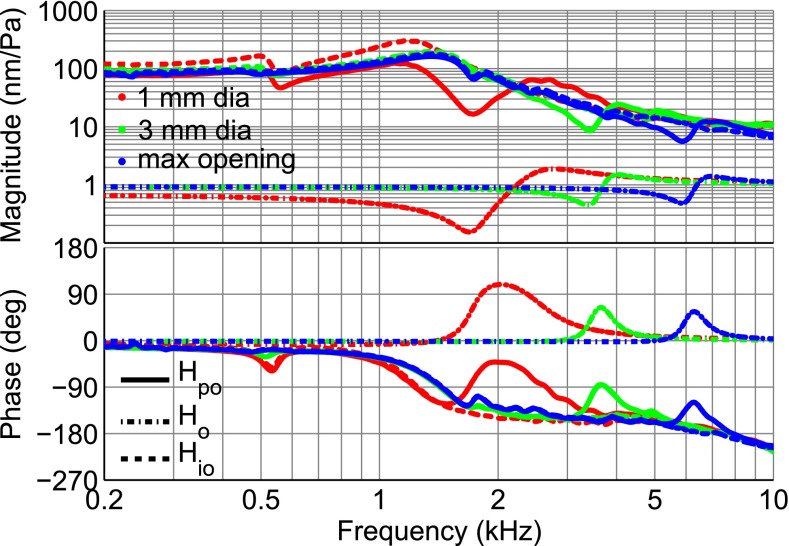
The ideal open-cavity responses estimated from measurements in the same ear with different sizes of opening should theoretically be the same. Figure 16 explores this hypothesis by applying the method to the umbo measurements of ear F with five sizes of opening, from 1 mm diameter to the maximal opening in the cavity wall. The solid curves represent the measured responses and the dashed curves represent the estimated ideal open-cavity responses. At frequencies below the middle-ear resonance, the estimated ideal open-cavity response based on the smallest opening (red dashed curve) shows differences from the others of up to about 4 dB. At higher frequencies, the estimated ideal open-cavity responses obtained for different opening sizes are within 2 dB, with the greatest differences occurring at mid-frequencies. Part of the differences seen between ideal open-cavity estimates based on different opening sizes might be due to drying effects.
FIG. 16.
Effect of the size of opening on the estimated ideal open-cavity frequency response H io in gerbil F. All responses corresponding to each opening size are shown in the same colour. The measured H po and estimated H io responses are indicated by solid and dashed lines, respectively. H o responses are shown with dash-dotted lines.
Figure 17 illustrates an example of the application of the method to the more complex responses resulting from an ear with a flat pars flaccida. The measured displacements (solid curves) in this figure are identical to those presented in Figure 3. Compared with the estimated ideal open-cavity responses calculated for ears in which the pars flaccida was retracted, bigger magnitude differences can be seen here at low frequencies: at frequencies below the middle-ear resonance, the ideal open-cavity responses estimated based on the smallest opening (red dashed curve) differ by up to 5 dB from those based on the larger openings. At higher frequencies, the differences are similar to those for ears with a retracted pars flaccida (maximum 2 dB at mid-frequencies).
FIG. 17.
Estimation of ideal open-cavity response H io in an ear with a flat pars flaccida (gerbil E) and different sizes of the opening.
Manubrium response
In the section “Manubrial Vibrations”, we presented responses with a partially open cavity at different positions on the manubrium and pointed out that from 5 to 7 kHz the opening feature interferes with the responses. To remove the effects of the cavity opening on the data shown in Figure 7 (gerbil H), the method described in “Estimation of Ideal Open-Cavity Responses” was applied and all manubrial responses were corrected with the same Ho, obtained by fitting to the response at the middle of the manubrium (green curve in Fig. 7) in the range of 5.6 to 6.6 kHz. The results in Figure 18 are similar for the different manubrial points, except that a phase difference between the umbo and the rest of the manubrium starts to become evident above 5 kHz, as in the closed-cavity case.
FIG. 18.
Estimated ideal open-cavity manubrial response H io in gerbil H, corresponding to measurements shown in Figure 6, using an H o identified from the mid-manubrium response.
Pars-Tensa response
In Figure 19, the responses measured with a maximal cavity opening (solid curves) and the estimated ideal open-cavity responses (dashed curves) are presented for two points on the pars tensa and for a reference point on the manubrium, for gerbil H. As can be seen in Figure 19, and as discussed in “Estimation of Ideal Open-Cavity Responses”, a plethora of features in the pars-tensa responses makes the direct identification of the notch from those responses very difficult if not impossible, so the same mid-manubrium-based Ho used in the previous section was applied to correct the pars-tensa responses. The ideal open-cavity estimates exhibit response patterns that differ from the measured data by up to about 4.8 dB and 30 ° in the frequency range of 5.5 to 8.8 kHz, the neighbourhood of the notch. These differences are much bigger than the changes seen when varying the frequency range of fitting (as discussed in “Sensitivity to the Fitting Range”). They presumably reflect the actual effects on the pars tensa due to the antiresonance at 6 kHz that results from the opening in the cavity wall.
FIG. 19.
Estimated ideal open-cavity pars-tensa responses H io in gerbil H, using an H o identified from the mid-manubrium response.
DISCUSSION
Effects of opening the middle-ear cavity on manubrium and TM vibrations
Measurements on the manubrium, pars tensa and pars flaccida with an open cavity caused increases in the low-frequency magnitudes and also shifted the middle-ear and pars-flaccida resonance frequencies to lower frequencies. These shifts happen because of the reduction in the stiffness of the system at low frequencies due to the opening of the cavity (cf. model of Ravicz et al., 1992).
In impedance measurements, Ravicz et al. (1992) observed an antiresonance peak at about 2 to 3 kHz in different ears with a hole of about 1 mm in diameter, similar to our range of 1.7 to 2.6 kHz. In admittance measurements, Teoh et al. (1997) observed an antiresonance at about 3 kHz with a hole of about 1.2 mm in diameter. Rosowski et al. (1997, 1999), also with a 1.2-mm hole, reported a hole antiresonance at about 3.1 kHz in LDV measurements. The frequencies of the antiresonance with holes of about 1.2 mm in diameter (Teoh et al., 1997; Rosowski et al., 1997, 1999) were somewhat higher than the highest antiresonance frequency shown in Figure 5 for a hole of 1 mm in diameter, which is consistent with the increase that we observe in the antiresonance frequency when the opening is progressively enlarged. Ravicz et al. (1992) and Teoh et al. (1997) reported a frequency of 6 kHz for the antiresonance with maximal opening, which is within our range of 3.7 to 9.5 kHz. No previous measurements for the intermediate openings are available.
The pars-flaccida vibration data reported by Rosowski et al. (1997, Figure 6A) are also included in Figure 6 and show the same trends of a low-frequency increase, a shift in the resonance frequency and a lack of change at higher frequencies except for the antiresonance (in their case at about 3.2 kHz).
In the present study, we have demonstrated that, in ears with a flat pars flaccida, when the middle-ear cavity is progressively opened, the minimum corresponding to the pars-flaccida contribution to the umbo response becomes progressively shallower. We have also demonstrated that the main increase in the low-frequency response magnitude happens upon making the smallest (1 mm) hole in the cavity wall and that further progressive enlarging of the opening has little or no effect on the low-frequency magnitude. The latter observation is particularly important for modelling and experimental studies that are concerned with static or low-frequency behaviour of the system. In this case, two ears (from an experiment and a model or from two experiments) with open cavities can be safely compared independent of the extent of the openings. For instance, static or low-frequency results from a model without a cavity can be safely compared with experimental results from an ear with a very small hole in its cavity wall.
In experimental data not reported here, we have observed that, when the main resonance frequency is shifted to a higher frequency because of drying, the break-up frequency is also shifted to a higher frequency. In contrast, opening of the cavity shifts the main resonance frequency to lower frequencies but does not shift the breakup frequency, nor the response features above this frequency, to lower frequencies. Consistent with this observation, Ishihara (1989) reported that the break-up frequency of the human TM ‘was not affected much’ by the volume of the middle-ear cavity.
The opening also causes the addition of an antiresonance to the response (Teoh et al., 1997). In contrast to the almost constant low-frequency magnitude for different hole sizes, progressive enlarging of the cavity-wall opening progressively shifts the related antiresonance to higher frequencies. We have shown (“Umbo Vibrations” section) for different sizes of opening how the resulting antiresonance interferes with the frequency-response shape. For example, the maximum related to the middle-ear resonance appears at a different frequency with different sizes of opening. This is presumably because the frequency-response curve is deflected downward in the vicinity of the antiresonance (e.g. at 2.4 and 1.8 kHz in Figs. 2 and 3, respectively) so the main middle-ear resonance frequency appears to be located at a lower frequency (700 instead of 950 Hz and 1,100 instead of 1,350 Hz in Figs. 2 and 3, respectively). When the opening is large enough (diameters of 4 mm and more), the hole antiresonance moves far beyond the region of the maximum of the magnitude and its effect on this region becomes very small. In this case, the maximum has a higher magnitude than when the hole is smaller.
The different effects of different opening sizes can cause errors of interpretation when the results of one experiment are compared with those of another experiment with a different size of opening. Elimination of such artefacts may be especially important for the pars-tensa: because of the complexity of its responses, more features can be obscured in the frequency neighbourhood of the antiresonance. The ideal open-cavity condition is also important for validating mathematical models of a simplified system (without the cavity) as a step toward making a comprehensive model of the middle-ear which also includes the cavity
Estimation of ideal open-cavity responses
The notch caused by opening the cavity obscures pars-tensa and manubrium responses in its frequency neighbourhood. To avoid this problem, either the notch should be at a frequency beyond the frequency range of interest or it should be corrected for. Moving the notch out of the frequency range of interest is not always possible, especially when responses at higher frequencies are of interest. We have presented here a method for correcting for the opening feature by estimating ideal open-cavity responses based on measurements collected with partial opening in the cavity. In this method, a frequency response is fitted to the experimental response in a frequency range that includes the opening feature. The frequency response corresponding to the opening feature is then constructed and utilized to estimate the ideal open-cavity response.
We have experimented with a variety of continuous-time and discrete-time methods to estimate the transfer function of the opening feature. For continuous-time transfer-function estimation, in addition to the RFP method described here, we tried the prediction-error minimization (PEM) approach with parameter initialization using either output-error (OE) or state-space algorithms, followed by nonlinear least-squares search-based updates to minimize a weighted prediction error norm. For discrete-time transfer-function estimation, we tried autoregressive with exogenous input (ARX), instrumental variable (IV), OE and state-space methods. In discrete-time form, we also experimented with PEM based on the OE algorithm and nonlinear least-squares search-based updates. Details about all these non-RFP methods can be found in Ljung (1999) and all of them are available in the MATLAB System Identification Toolbox. With other continuous-time transfer-function methods, the quality of the fit was always much inferior (10 % < Q < 66 %) to RFP (Q > 94 %). With some of the discrete-time methods (especially OE and the discrete-time OE-based PEM), we have reached the same quality of fit as with RFP. However, because our method is intended for continuous-time frequency responses, the identified discrete-time transfer function would need to be converted to continuous-time form. Discrete-to-continuous conversion with the zero-pole matching method (Franklin, 1990) is not always possible if there are identified poles or zeroes at the origin. If other conversion methods are used, the control on poles and zeroes in the conversion process is lost and, for example, an additional zero may be present in the converted continuous-time form, or the model order may be changed. We did not try, however, to perform the complete process in the discrete-time domain instead of the continuous-time domain.
We have validated our RFP-based method against a synthesized frequency response and against a frequency response calculated using a middle-ear circuit model and have studied the robustness of the method in handling different opening sizes and various frequency ranges for the fitting. The analysis showed that the method should not be used with fitting ranges of less than about 155 Hz. If the range is too narrow, the required complex-conjugate pair of poles (at a slightly higher frequency than the centre frequency of the opening feature) is not captured correctly, and therefore a correct response shape does not form. The method was found to be robust for wider fitting frequency ranges even in the presence of other response features within the selected fitting range.
Implications of ideal open-cavity responses
Although the ideal open-cavity responses estimated based on different sizes of opening are very similar, they do show some differences (“Effect of Enlarging the Opening”). At low frequencies, estimates based on the smallest opening size exhibit larger magnitudes than the ones based on other opening sizes. These differences are larger in ears with a flat pars flaccida (Fig. 17) than in ears with a retracted pars flaccida (Fig. 16). The differences are probably due to a residual influence of the cavity on the low-frequency acoustical coupling between the pars tensa and the pars flaccida. This coupling is more pronounced with the smallest opening and in ears with a flat pars flaccida, as seen in the section “Umbo Vibrations”. If it is desired to avoid this low-frequency artefact, the opening in the cavity wall should be made at least about 4 mm in diameter before attempting to estimate ideal open-cavity responses.
The method was applied to pars-tensa responses measured in ears with partial cavity opening. The method corrects the responses in the opening-feature frequency neighbourhood. We have demonstrated that, compared with the measured responses with partial cavity opening, in the ideal open-cavity responses, both the frequencies and excursions of the local minima and maxima are different.
The estimated ideal open-cavity results also have practical value because they are better suited than the directly measured data for comparison with the results from middle-ear finite-element models with no cavity. Such models are a valuable intermediate step in refining methods and parameters to be used later in more complete models.
Acknowledgments
The authors would like to thank Ms. Shruti Nambiar and Ms. Zinan He for their contributions to the development of the surgical and measurement techniques; Dr. Jim Gourdon for advice on the anaesthesia procedure; and Dr. Dan Citra for his help dealing with the animals. This work was supported in part by the Canadian Institutes of Health Research, the Fonds de recherche en santé du Québec, the Natural Sciences and Engineering Research Council of Canada, the Montréal Children’s Hospital Research Institute, the McGill University Health Centre Research Institute and the Research Fund of Flanders (Belgium).
References
- Chen C.-T (2010) Signals and systems: a fresh look. Retrieved August 21, 2013, from http://www.ece.sunysb.edu/~ctchen/media/freshlook.pdf
- Formenti D, Richardson M (2002) Parameter estimation from frequency response measurements using rational fraction polynomials (twenty years of progress). Proceedings of the 20th International Modal Analysis Conference, Orlando, Florida. Retrieved from http://systemplus.co.jp/support/data/techpaper/mescope/tech/39.pdf
- Forsythe GE. Generation and use of orthogonal polynomials for data-fitting with a digital computer. J Soc Ind Appl Math. 1957;5(2):74–88. doi: 10.1137/0105007. [DOI] [Google Scholar]
- Franklin GF (1990) Digital control of dynamic systems (2nd ed.). Reading: Addison-Wesley
- Funnell WRJ, Maftoon N, Decraemer WF (2012) Mechanics and modelling for the middle ear. Retrieved March 3, 2013, from http://audilab.bme.mcgill.ca/~funnell/AudiLab/mammie/mammie.pdf
- Guinan JJ, Peake WT. Middle-ear characteristics of anesthetized cats. J Acoust Soc Am. 1967;41(5):1237–1261. doi: 10.1121/1.1910465. [DOI] [PubMed] [Google Scholar]
- Gutiérrez Acuña C (2003) Rational fraction polynomial method, MATLAB Central File Exchange. Retrieved July 13, 2011
- Huang GT, Rosowski JJ, Flandermeyer DT, Iii TJL, Peake WT. The middle ear of a lion: comparison of structure and function to domestic cat. J Acoust Soc Am. 1997;101(3):1532–1549. doi: 10.1121/1.418107. [DOI] [PubMed] [Google Scholar]
- Ishihara M. Experimental study of vibration analysis in middle ear models by holographic interferometry. Effects of the cross-sectioned area of aditus on the vibration of tympanic membrane. Nihon Jibiinkoka Gakkai Kaiho. 1989;92(5):726–735. doi: 10.3950/jibiinkoka.92.726. [DOI] [PubMed] [Google Scholar]
- Kelly LG (1967) Handbook of numerical methods and applications. Reading, Addison-Wesley
- Ljung L. System identification: theory for the user. Prentice-Hall information and system sciences series. 2. Upper Saddle River: Prentice Hall PTR; 1999. [Google Scholar]
- Lynch TJ, III, Peake WT, Rosowski JJ. Measurements of the acoustic input impedance of cat ears: 10 Hz to 20 kHz. J Acoust Soc Am. 1994;96(4):2184–2209. doi: 10.1121/1.410160. [DOI] [PubMed] [Google Scholar]
- Maftoon N, Funnell WRJ, Daniel SJ, Decraemer WF. Experimental study of vibrations of gerbil tympanic membrane with closed middle-ear cavity. JARO J Assoc Res Otolaryngol. 2013;14(4):467–481. doi: 10.1007/s10162-013-0389-9. [DOI] [PMC free article] [PubMed] [Google Scholar]
- Maia NMM, Ewins DJ. A new approach for the modal identification of lightly damped structures. Mech Syst Signal Process. 1989;3(2):173–193. doi: 10.1016/0888-3270(89)90015-0. [DOI] [Google Scholar]
- Meruane V. Model updating using antiresonant frequencies identified from transmissibility functions. J Sound Vib. 2013;332(4):807–820. doi: 10.1016/j.jsv.2012.10.021. [DOI] [Google Scholar]
- Møller AR. An experimental study of the acoustic impedance of the middle ear and its transmission properties. Acta Otolaryngol. 1965;60(1–6):129–149. doi: 10.3109/00016486509126996. [DOI] [PubMed] [Google Scholar]
- Ravicz ME, Rosowski JJ, Voigt HF. Sound-power collection by the auditory periphery of the Mongolian gerbil Meriones unguiculatus. I: middle-ear input impedance. J Acoust Soc Am. 1992;92(1):157–177. doi: 10.1121/1.404280. [DOI] [PubMed] [Google Scholar]
- Richardson MH, Formenti DL (1982) Parameter estimation from frequency response measurements using rational fraction polynomials. Proceedings of the 1st International Modal Analysis Conference (Vol. 1, pp. 167–186)
- Rolain Y, Pintelon R, Xu KQ, Vold H. Best conditioned parametric identification of transfer function models in the frequency domain. IEEE Trans Autom Control. 1995;40(11):1954–1960. doi: 10.1109/9.471223. [DOI] [Google Scholar]
- Rosowski JJ, Ravicz ME, Songer JE. Structures that contribute to middle-ear admittance in chinchilla. J Comp Physiol A Neuroethology Sens Neural Behav Physiol. 2006;192(12):1287–1311. doi: 10.1007/s00359-006-0159-9. [DOI] [PMC free article] [PubMed] [Google Scholar]
- Rosowski JJ, Ravicz ME, Teoh SW, Flandermeyer D. Measurements of middle-ear function in the Mongolian gerbil, a specialized mammalian ear. Audiol Neurotology. 1999;4(3–4):129–136. doi: 10.1159/000013831. [DOI] [PubMed] [Google Scholar]
- Rosowski JJ, Teoh SW, Flandermeyer DT. The effect of the pars flaccida of the tympanic membrane on the ear’s sensitivity to sound. In: Lewis ER, Long GR, Lyon RF, Narins PM, Steele CR, Hect-Poiner E, editors. Diversity in Auditory Mechanics. New Jersey: World Scientific; 1997. pp. 129–135. [Google Scholar]
- Teoh SW, Flandermeyer DT, Rosowski JJ. Effects of pars flaccida on sound conduction in ears of Mongolian gerbil: acoustic and anatomical measurements. Hear Res. 1997;106(1–2):39–65. doi: 10.1016/S0378-5955(97)00002-6. [DOI] [PubMed] [Google Scholar]
- Zwislocki J. Analysis of the middle-ear function. Part I: input impedance. J Acoust Soc Am. 1962;34(9B):1514–1523. doi: 10.1121/1.1918382. [DOI] [Google Scholar]
- Zwislocki J. Analysis of the middle-ear function. Part II: guinea-pig ear. J Acoust Soc Am. 1963;35(7):1034–1040. doi: 10.1121/1.1918650. [DOI] [Google Scholar]


