Abstract
Regions of cardiac tissue that have a combination of focal activity and poor, heterogeneous gap junction coupling are often considered to be arrhythmogenic; however, the relationship between the properties of the cardiac microstructure and patterns of abnormal propagation is not well understood. The objective of this study was to investigate the effect of microstructure on the initiation of reentry from focal stimulation inside a poorly coupled region embedded in more well-coupled tissue. Two-dimensional discrete computer models of ventricular monolayers (1 × 1 cm) were randomly generated to represent heterogeneity in the cardiac microstructure. A small, central poorly coupled patch (0.40 × 0.40 cm) was introduced to represent the site of focal activity. Simulated unipolar electrogram recordings were computed at various points in the tissue. As the gap conductance of the patch decreased, conduction slowed and became increasingly complex, marked by fractionated electrograms with reduced amplitude. Near the limit of conduction block, isolated breakthrough sites occurred at single cells along the patch boundary and were marked by long cell-to-cell delays and negative deflections on electrogram recordings. The strongest determinant of the site of wavefront breakthrough was the connectivity of the brick wall architecture, which enabled current flow through small regions of overlapping cells to drive propagation into the well-coupled zone. In conclusion, breakthroughs at the size scale of a single cell can occur at the boundary of source-load mismatch allowing focal activations from slow conducting regions to produce reentry. These breakthrough regions, identifiable by distinct asymmetric, reduced amplitude electrograms, are sensitive to tissue architecture and may be targets for ablation.
Keywords: focal activity, source-load mismatch, cardiac reentry, gap junction uncoupling, unipolar electrogram recording
pathological changes, such as decreased expression of connexin43 and high levels of fibrosis, create regions of slow conduction that can facilitate arrhythmogenesis in the heart (13, 26, 33). In regions of slow conduction, gap junction uncoupling reduces electrical load, making it easier for focal (ectopic) beats to form while at the same time increasing the likelihood of tortuous, “zig-zag” conduction and unidirectional conduction block, two major mechanisms underlying reentry in diseased cardiac tissue (8, 20, 35, 40). In particular, the boundary between poorly coupled diseased tissue and well-coupled healthy tissue has been identified as a critical region of high source-load mismatch, and a number of experimental studies (11, 32, 34, 41) have been used to understand how the interplay between focal activations and the underlying tissue structure of the diseased region affects the development of complex patterns of wavefront propagation. In one in vitro study, Arutunyan et al. (2) used a tissue engineering approach to create a small poorly coupled region that was surrounded by a larger, well-coupled quiescent region. They found that regions with low, heterogeneous coupling, which they called the ectopic nexus, support spontaneous activity and that spatiotemporal variations in coupling at the boundary between well-coupled and poorly coupled tissue can strongly influence the dynamics of propagating beats (1, 2, 32). Other studies (3, 23) in patterned cardiac cell monolayers with a region of slow or zig-zag conduction have shown that intrinsic heterogeneities in microscale tissue structure at the boundary of the central zone can be unmasked by loading effects during rapid pacing, leading to unidirectional conduction block and spiral wave formation. These in vitro studies are consistent with recent microstructural modeling studies demonstrating that in critical regimes near the onset of conduction block, microscopic variations in source-load mismatch at the boundary between well-coupled and poorly coupled regions can facilitate the escape of focal wavefronts that may increase the likelihood of reentry (16).
Because these heterogeneous regions of slow conduction have been viewed as potential triggers of arrhythmia, their identification as possible sites for catheter ablation (24, 28, 42) is important. Unfortunately, the nature of conduction inside and near these regions is tortuous, giving rise to complex fractionated electrograms (CFEs) whose features are a consequence of wavefront collisions, conduction slowing, and wavebreak (9, 22), making it difficult to determine which area to target. Nonuniform conduction due to the microheterogeneity also makes it difficult to relate the measured electrograms to the underlying activity and thus help elucidate mechanisms. In this study, we use a computer model of a ventricular monolayer to investigate 1) how microstructural variations at the boundary of small patches affect the escape and subsequent dynamics of ectopic activity inside the region and 2) whether the ectopic activity and escape can be identified with extracellular signals. The results show that as the gap junction conductance (gj) of a poorly coupled region decreases, propagation inside the region initiated from a focal beat becomes increasingly tortuous, marked by smaller and more fractionated electrograms due to wavefront microcollisions in the region. The increasing source-load mismatch at the boundary magnifies variation in conduction delays across the boundary, and at critical values of gj, complete conduction block can occur everywhere along the boundary except for a single breakthrough site dynamically unmasked at the level of a single cell. These single cell breakthroughs, identifiable by a negative deflection in the electrograms, are shown to be capable of producing reentry. The location of the breakthroughs and the resulting dynamics are very sensitive to small changes in tissue microstructure and electrical properties.
METHODS
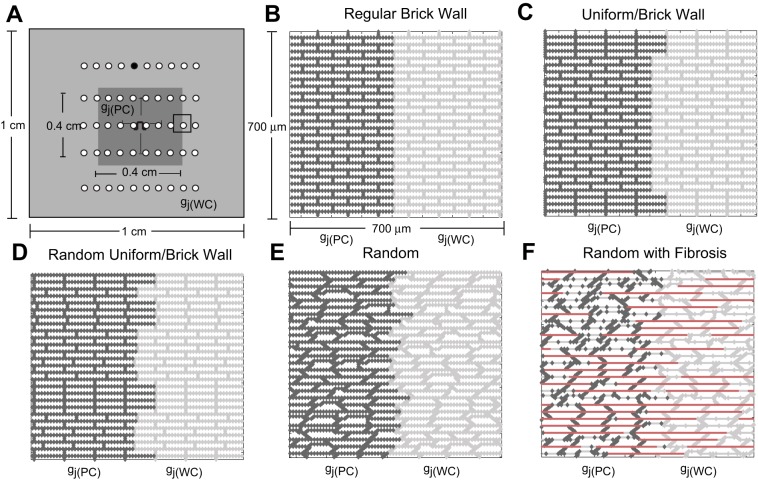
We used a two-dimensional discrete monodomain model developed by Hubbard and Henriquez that represents the microstructural tissue structure (16, 17). Throughout this study, the resistivity within the cell (ρi) was set equal to 150 Ω·cm, and gj was incorporated into the intracellular resistivity as a function of space (4). Inhomogeneous microstructural models (1 × 1 cm) with a central region of poor coupling (0.40 × 0.40 cm) surrounded by moderately well-coupled tissue (Fig. 1A) were created to investigate the effect of microstructural heterogeneity on the escape of ectopic beats and the initiation of microreentry. The inhomogeneous control tissue models (Δx = 10 μm, Δy = 10 μm) had no fibrosis and one of the following structures: a regular brick wall structure (Fig. 1B), a combination uniform and brick wall structure with uniform cell length (Fig. 1C), a random brick wall structure with random cell lengths (Fig. 1D), and a completely randomly generated tissue structure with a stairstep jutting pattern along the cell boundaries (Fig. 1E). In the outer regions of the tissue, all properties were set to nominal values [gj(WC) = 0.10 μS]. The poorly coupled central region was created by uniformly decreasing all of the longitudinal and transverse gj values [gj(PC)] in the region over a range from gj = 0.10 μS to gj = 0.003 μS (21). The lower value of gj was chosen to bring about the onset of complete conduction block similarly to the one-dimensional studies by Shaw and Rudy (36) and Wang and Rudy (41). In the control tissues described above, gap junctions were distributed uniformly around each cell to mimic the lateralized gap junction patterns observed in diseased tissue. In all tissue models, the average cell length was 100 μm and the width was 30 μm.
Fig. 1.
A: schematic of the inhomogeneous 1 × 1-cm microstructural tissue model that includes a 0.4 × 0.4-cm poorly coupled central region [where gj(PC) is the gap junction conductance (gj) in this region]. The sites of recording electrodes are indicated with white circles. The electrograms recorded for wavefronts propagating along the longitudinal and transverse axes in control tissue (see Fig. 9) were taken at the black recording electrode. B–F: magnified views of the transition region between the well-coupled region [where gj(WC) is gj in this region] and poorly coupled region for the regular brick wall model (B), the combination uniform-brick wall model with a single brick wall section (C), the random brick wall model (D), the random model with cell jutting (E), and the random model with fibrosis (F). The poorly coupled cells [gj(PC) = 0.10–0.004 μS] are outlined in dark gray, the well-coupled cells are outlined in light gray, and the lateral decoupling caused by fibrosis is indicated with bold, red lines. The stimulus site is indicated with a current source symbol.
To slow conduction and facilitate sustained reentry, we also created two additional inhomogeneous fibrotic tissue models representing different realizations of the same microstructure statistics (cell shape, size, coupling, fibrosis, etc.; Fig. 1F). Fibrosis was introduced into both the central region and surrounding tissue by randomly decoupling 40% of the lateral borders (18, 37). An interstitial space was introduced into the fibrotic models using a two-dimensional discrete equivalent monodomain approach developed by Hubbard and Henriquez that approximates the bidomain by combining the intracellular and the interstitial properties into a single space to represent the microstructural tissue structure and allows for the computation of both transmembrane and extracellular potentials (15, 16). The effective interstitial resistivity (Re/fe) was set equal to 0.50 kΩ·cm, with an interstitial volume fraction (fe) equal to 0.10 (4).
The Luo-Rudy dynamic model of guinea pig myocytes was used to calculate the ionic current (27). A line stimulus was generated in the central region by applying intracellular current pulses along a central vertical line in the central region of the tissue. Point stimuli (representing focal beats) were generated in the inhomogeneous mesh shown in Fig. 1A by applying intracellular current pulses to a 110 node-square area in the center of the tissue at a basic cycle length of 200 ms. All stimuli were 2 ms in duration and ∼1.5–2 times threshold. Activation times were recorded at the time the membrane voltage initially reached −40 mV, and recovery times were recorded at the time the membrane voltage returned to −60 mV. Conduction velocities in the ectopic nexus were calculated by taking a linear regression of the activation times in the entire poorly coupled region. Simulated electrograms were computed from 50 unipolar disc electrodes (0.960-mm diameter) on a rectangular grid located at sites within the poorly coupled region, at the border between the well-coupled and poorly coupled region, and within the well-coupled region, as shown by the white circles in Fig. 1A. The interelectrode distance was 0.50 mm, and the electrode-tissue distance (z) was set to 8.24 μm. As in an earlier study by Jacquemet et al. (19), the Geselowitz formulation was used to compute the electrode potential (10):
where ϕe is the electrode potential measured at point y above the monolayer, Im represents membrane current sources in the monolayer, and dv is the volume element. The transfer function (Z) for a disk electrode of diameter de is as follows (29):
where r is the distance between a point in the monolayer (x) and the projection of point y onto the monolayer and σe is the conductivity of the volume conductor (set equal to 1 ms/cm in this case).
A semi-implicit scheme with a conjugate gradient solver was used to solve the system of equations (6). The time step (Δt) was kept constant at 5 μs, output data were recorded every 10 μs, and data for the activation maps were recorded at a minimum of every 100 μs. All simulations used the CardioWave software platform (31).
RESULTS
Breakthroughs at decreased conductance.
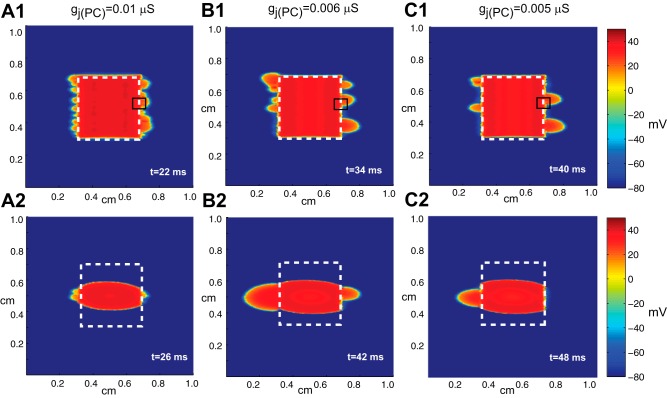
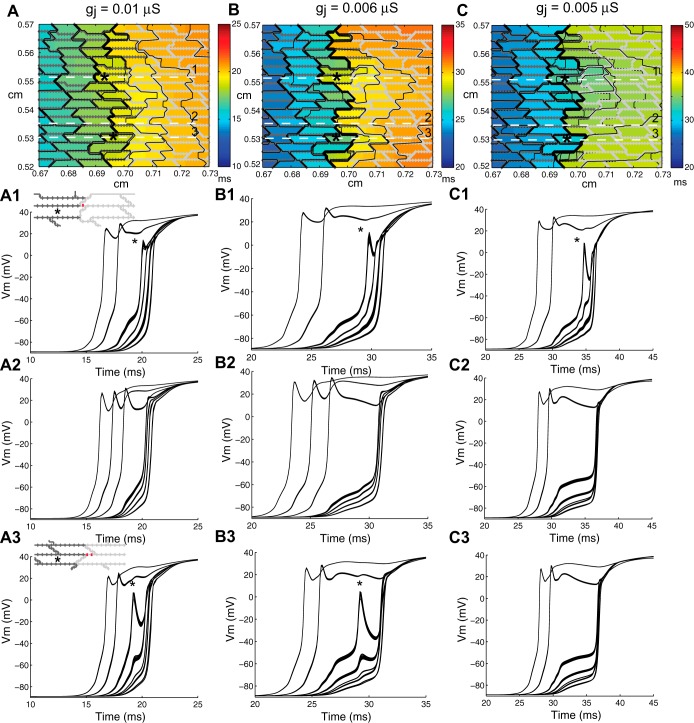
In the first part of this study, we tested the response of the random tissue with no fibrosis (Fig. 1E) to a line and point stimulus in the middle of the central region as gj was uniformly reduced over a range between 0.10 to 0.004 μS. As gj in the poorly coupled region was decreased, the patterns of propagation observed in activation maps of the inhomogeneous two-dimensional tissue resulting from a line stimulus in the central region fell into three major groups: 1) symmetric propagation for gj > 0.01 μS, 2) heterogeneous wavefront breakthrough for gj between 0.01 and 0.004 μS (Fig. 2), and 3) complete conduction block for gj < 0.004 μS. Figure 2, A,1, B,1, and C,1, shows that near the limit of conduction block (gj between 0.01 and 0.004 μS), the number of distinct wavefront breakthroughs decreases. Magnified views of the activation map for the right central breakthrough selected from Fig. 2 are shown in Fig. 3 with action potentials measured along horizontal lines in the tissue. In the schematics of the underlying microstructure, the cells that experience the greatest source-load mismatch are indicated with an asterisk. The measured action potentials near the site of wavefront breakthrough show that the source-load mismatch at individual cells at the boundary between well-coupled and poorly coupled tissue modulates the transition to block as gj decreases. Sites of escape occur at individual connections between cells in a brick wall architecture with staggered overlap between rows of cells (shown with red gap junctions in Fig. 3). The staggered overlap between cells provides an alternative route for the current to flow around the single cells that experience the greatest source-load mismatch. As the boundary cell charges the neighboring cells, the action potential at that individual cell displays a long delay and a sharp dip in membrane voltage followed by an increase in membrane voltage once the surrounding cells activate (Fig. 3, A,1, B,1, and C,1). At sites where conduction initially blocks, the action potential shows a long conduction delay followed by fast activation once the cells are activated by current from the outer well-coupled region (Fig. 3, A,2, B,2, and C,2). In the last case shown in Fig. 3, a site of breakthrough (Fig. 3, A,3 and B,3) converts to a site of block and is activated by current from the outer region (Fig. 3C,3).
Fig. 2.
Voltage maps showing wavefront breakthrough during stimulation with a line stimulus (A1–C1) and a point stimulus (A2–C2) in inhomogeneous tissue with different levels of coupling, gj(PC), in the central region: gj(PC) = 0.01 μS (1), gj(PC) = 0.006 μS (2), and gj(PC) = 0.005 μS (3). In all cases, gj(WC) = 0.10 μS. t, time.
Fig. 3.
Magnified views of the activation map for the right central breakthrough selected from Fig. 2 along with action potentials measured along horizontal lines in the tissue. A: gj(PC) = 0.01 μS; B: gj(PC) = 0.006 μS; C; gj(PC) = 0.005 μS. The tissue models in the inset show a magnified view of the gap junction configuration at the interface between the well-coupled and poorly coupled region at the site of escape.
When the stimulus was changed from a line stimulus to a point stimulus, the wavefront exited at the breakthrough sites that were closest to the origin of the stimulus. For the cases shown in Fig. 2, A,2, B,2, and C,2, where gj(PC) = 0.01, 0.006, and 0.005 μS and gj(WC) = 0.10 μS, the ectopic beat was able to break out of the central zone through a small subset of cells at the boundary between the well-coupled and poorly coupled regions. In the case where gj(PC) = 0.005 μS, only one wavefront escaped out of the lefthand side of the tissue, indicating that the wavefront direction and shape may play a role in determining wavefront breakthrough (Fig. 2C,2).
To elucidate the underlying structural heterogeneity associated with the sites of wavefront breakthrough, we compared the inhomogeneous random tissue model with models with more idealized cellular architecture, namely, 1) a regular brick wall model (Fig. 1B), 2) a combination uniform-brick wall model (Fig. 1C) in which brick wall regions with the same degree of overlap were interspersed with regions with uniform structure, and 3) a random brick wall model in which the brick wall structures have varying degrees of random overlap. In all models, the central region had gap conductances of gj = 0.006 μS.
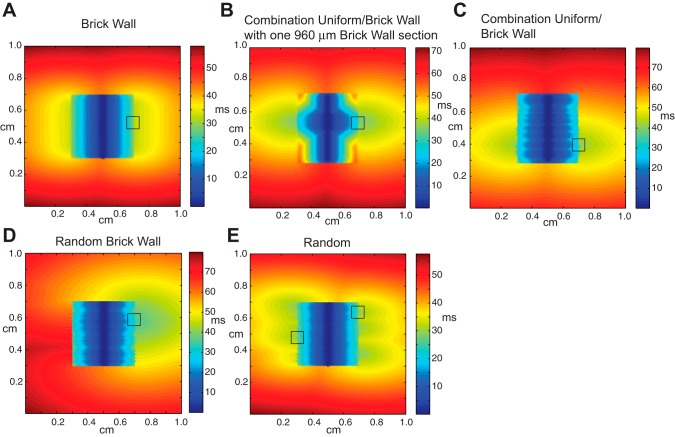
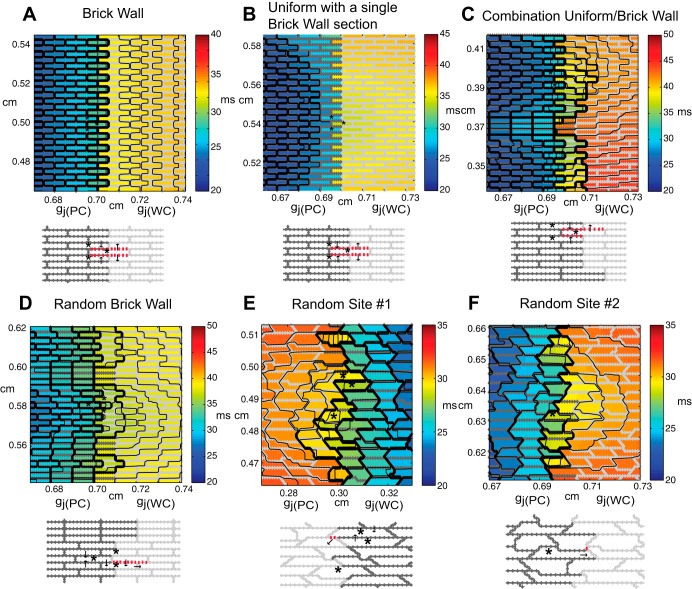
In the case of the regular brick wall model, the wavefront exited uniformly at the boundary between the poorly coupled region and well-coupled region (Fig. 4A). The brick wall architecture allowed neighboring rows of cells to contribute additional transverse current to cells that were in an earlier stage of activation (Fig. 5A). In the combination uniform-brick wall model, the width of the brick wall region was varied from 360 to 960 μm and the uniform regions separating the brick wall regions varied from 120 to 150 μm in width. In the case of the combination uniform-brick wall model with a single 960-μm brick wall section in the center of the poorly coupled region (Fig. 4B), the wavefront exited from the poorly coupled central regions at two sites located on the boundary of the brick wall section (Fig. 5B). When the width of the brick wall region was <960 μm, propagation blocked at the boundary between the well-coupled and poorly coupled regions, indicating that there is a critical width of brick wall tissue needed to support conduction in regions with source-load mismatch. Despite the uniformity of the line stimulus, the conduction in the brick wall region was faster than in the uniform section due to cell overlap. In the case of the combination uniform-brick wall model with multiple brick wall regions of different widths (Fig. 4C), simulations showed that the wavefront exited at two locations where closely spaced brick wall sections spanned a region >960 μm wide (Fig. 5C). In the random brick wall structure, the wavefront only exited at one site (Fig. 4D) that was composed of three brick wall regions of tissue that spanned a region ∼990 μm wide. The exit site was concentrated around a single cell located within the middle of the brick wall region (Fig. 5D). In the completely random case, the wavefront escaped at six sites (Fig. 4E). Figure 5, E and F, shows a magnified view of two exit sites selected from Fig. 4. The exit sites occur at locations with a small amount of brick wall overlap between a poorly coupled cell on the boundary and a neighboring cell in the well-coupled region. Even small amounts of brick wall overlap provide alternate routes to circumvent cells with the highest source load mismatch or to provide additional charge to cells located in the transition zone.
Fig. 4.
Activation maps taken during line stimulation in the central region of inhomogeneous tissues with gj(PC) = 0.006 μS and the following varied cell arrangements: regular brick wall tissue (A), a combination uniform-brick wall model with a single brick wall section with a width of 960 μm (B), a combination uniform-brick wall model with closely spaced brick wall sections (C), a random brick wall model (D), and a random model with cell jutting (E).
Fig. 5.
Magnified view of activation maps shown in Fig. 4 during line stimulation in the central region of inhomogeneous tissues with gj(PC) = 0.006 μS and the following varied cell arrangements: brick wall tissue with uniform escape (A), a combination uniform-brick wall model with a brick wall section (B), a combination uniform/brick wall model with closely spaced brick wall sections covering a width of ∼960 μm (C), and a random brick wall model (D). E and F: two different sites of wavefront breakthrough in the random model with cell jutting. Contour lines are shown every 0.2 ms. The arrows indicate the direction of current flow. *Boundary cells with high levels of source-load mismatch. The red gap junctions in the microstructural models indicate areas of brick wall overlap in the transition zone.
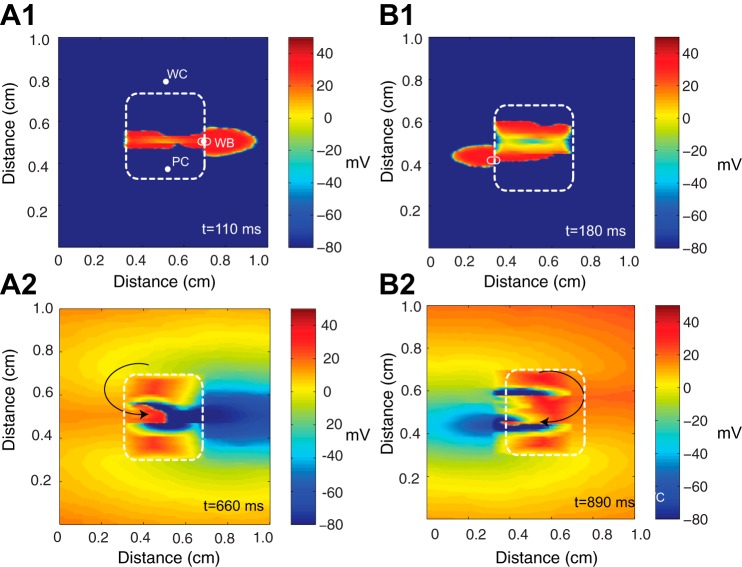
Sustained reentry was not observed in inhomogeneous tissue with a poorly coupled central region because conduction was not slow enough. To explore whether the isolated breakthroughs could produce reentry, fibrosis and an interstitial space were added to both the poorly and well-coupled regions in two different realizations of the random model with gj(PC) = 0.003 μS and gj(WC) = 0.10 μS (Fig. 1F). In two separate randomly generated tissues shown in Fig. 6, A,1 and B,1, the ectopic beat was able to break out of the central zone through a small subset of cells at the boundary between the well-coupled and poorly coupled regions. The voltage maps in Fig. 6 show the initial breakthrough from the poorly coupled regions at t = 110 ms in Fig. 6A,1 and t = 180 ms in Fig. 6A,2. The longitudinal conduction velocity in the central region was 3.0 cm/s, and the transverse conduction velocity was 0.58 cm/s. Slow transverse conduction caused by fibrosis in the outer region enabled the escaped beat to propagate around the poorly coupled region, reenter into the region from the other side, and then exit through the breakthrough site. Voltage maps of the pattern of reentry in the two meshes at a specific moment in time are shown in Fig. 6, A,2 and B,2.
Fig. 6.
A,1 and B,1: wavefront escape through a subset of cells at the boundary between the poorly coupled region (PC) and well-coupled region (WC) for two comparable meshes at a given moment in time. The boundary of the poorly coupled region is indicated by a white dashed line. WB, wavefront breakthrough. A,2 and B,2: reentrant circuits are shown for two comparable microstructural meshes that have a poorly coupled central region with gj(PC) = 0.003 μS.
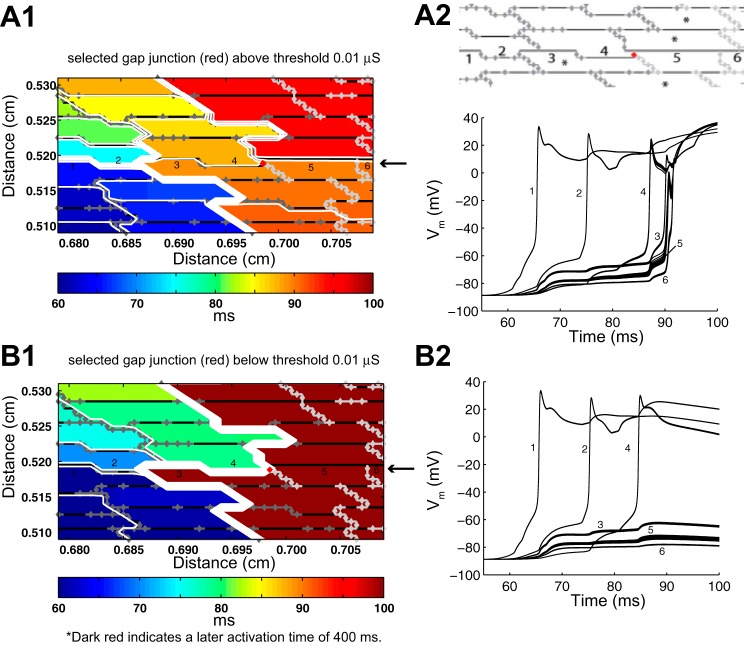
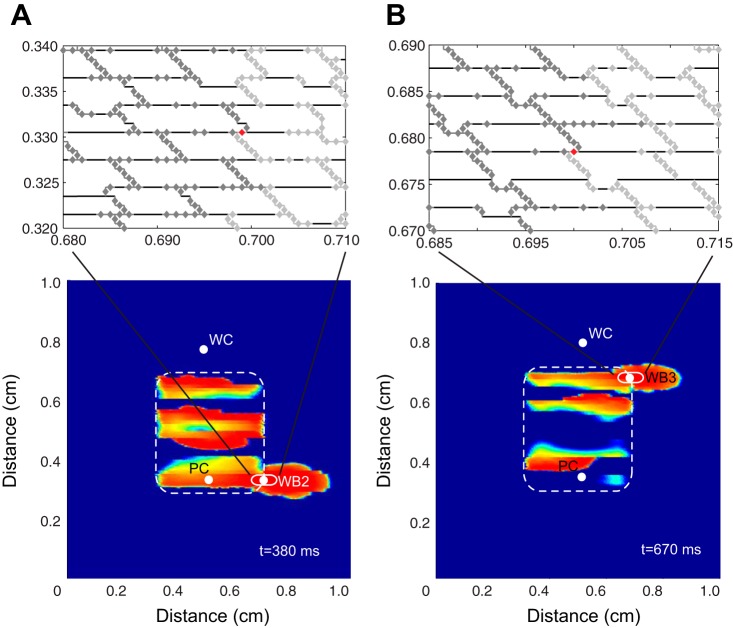
The activation maps and voltage traces shown in Fig. 3 indicate that the transition to block at sites of source-load mismatch is highly localized to single cells on the transition boundary. We tested the hypothesis that variations in the conductances of individual gap junctions, gj(PC), in the transition zone near the site of wavefront breakthrough in the randomly generated tissue structure shown in Fig. 7A,1 would affect the onset of conduction block. Individual conductances were perturbed while all other conductances were kept the same. In Fig. 7, the poorly coupled region of the tissue is indicated by dark gray gap junctions, the well-coupled region is indicated by light gray gap junctions, and the perturbed gap junction connection at the site of wavefront breakthrough is shown in red. The transition cells that experience the greatest source-load mismatch (Achilles' heels of propagation, as termed by Wang and Rudy) are indicated with a star (41). As shown in Fig. 7A, when the selected gj was set equal to 0.05 or 0.10 μS, cell 5, a current sink, was charged by current from both cells 3 and 4, enabling the wavefront to break through to the surrounding tissue. When the conductance of the selected gap junction in cell 4 was set below 0.01 μS, the site of wavefront breakthrough was completely eliminated. Because of this gap junction modification, cell 4 provided less current to cell 5, and both cells 3 and 5 blocked at that point in the tissue (Fig. 7B,2). The selected gap junction in cell 4 is a point of interest because its location in the brick wall architecture provides an alternate connection between a cell that is a current source in the poorly coupled region and a cell that is a current sink in the neighboring well-coupled region. Similar overlapping cell arrangements that provide alternate gap junction connections between a poorly coupled cell on the transition boundary and a well-coupled cell were also observed at other sites throughout the tissue. Consequently, once the original site of breakthrough was eliminated, two new breakthrough sites were unmasked at other points along the boundary between the poorly coupled and well-coupled regions (Fig. 8, A and B). The second breakthrough site shown in Fig. 8B resulted in a new pattern of sustained reentry.
Fig. 7.
A,1: the site of breakthrough that occurs when the perturbed gap junction shown in red is set above gj = 0.01 μS. A,2: action potentials at the numbered cell segments (1–6) along the horizontal axis where the wave breaks through. B,1: conduction block that occurs at the same site when the perturbed gap junction is set below gj = 0.01 μS. B,2: action potentials at the numbered cell segments during block. The poorly coupled region is indicated by dark gray gap junctions, the well-coupled region is indicated by light gray gap junctions, and the perturbed gap junction at the site of wavefront breakthrough is indicated in red.
Fig. 8.
A and B: the new sites of wavefront breakthrough (WB2 and WB3) that occur when the original site of breakthrough is blocked. The magnified inset is the underlying microstructure at the site of escape, and the red gap junction highlights the gap junction connection between a poorly coupled cell (current source) and well-coupled cell (current sink).
Simulated electrograms at sites of wavefront breakthrough.
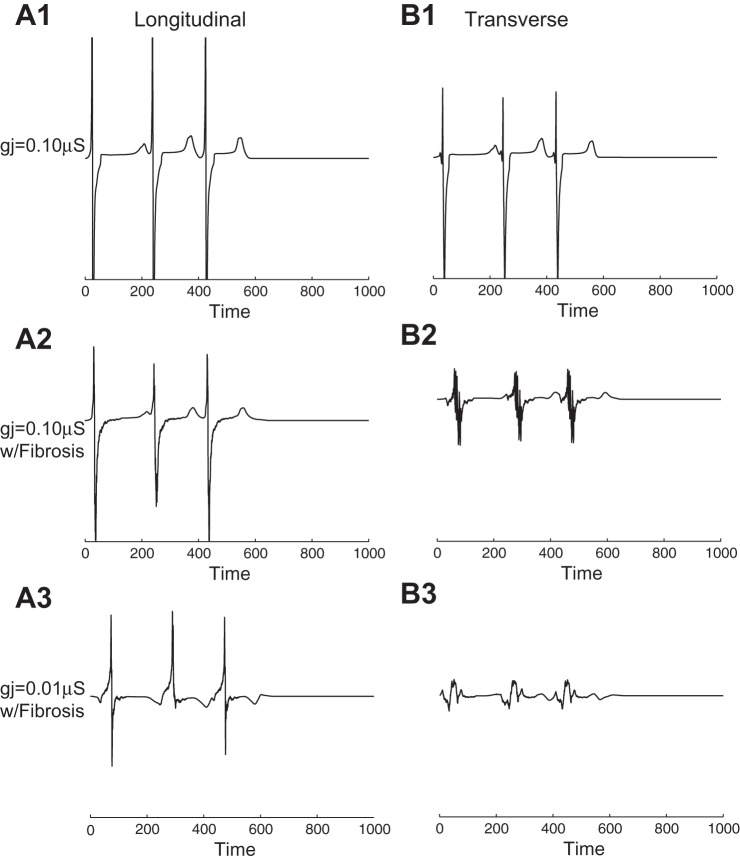
Simulated electrograms were computed in well-coupled and poorly coupled regions as gj of the central region was gradually decreased to the point of block. In the control case with no fibrosis and gj = 0.10 μs in both the poorly coupled region and surrounding well-coupled region, three large-amplitude deflections (one for each stimulus) were recorded extracellularly (Fig. 9, A,1 and B,1) at the black electrode in Fig. 1A for wavefronts propagating along the longitudinal and transverse axes. When fibrosis was added to the tissue, electrogram fractionation occurred during transverse propagation due to an increase in wavefront collisions (Fig. 9B,2). When gj was decreased 10-fold to gj = 0.01 μs, positive deflections occurred in the longitudinal direction due to wavefront collisions (Fig. 9A,3), and the magnitude of electrograms recorded along the transverse direction decreased and remained fractionated (Fig. 9B,3).
Fig. 9.
A: electrograms taken with 960-μm disk electrodes for wavefronts propagating along the longitudinal and transverse directions in control tissue with no fibrosis and gj(WC) = 0.10 μS. B: electrograms taken in the longitudinal and transverse directions in inhomogeneous tissue with fibrosis and gj(WC) = 0.10 μS. C: electrograms taken in the longitudinal and transverse directions in the central region of inhomogeneous tissue with fibrosis and gj(PC) = 0.01 μS. The position of the recording electrode is indicated by the black electrode in Fig. 1A.
Simulated electrograms were computed at discrete sites in the tissue for the case of wavefront breakthrough and reentry in fibrotic inhomogeneous tissue shown in Fig. 6A,1, where the locations of the recording electrodes are shown with white circles. Five biphasic deflections were recorded in the well-coupled region of the tissue after wavefront breakthrough from the poorly coupled region (Fig. 10A). Three of the deflections were in response to stimuli, whereas the last two deflections were in response to a sustained reentrant wavefront that was facilitated by the site of wavefront breakthrough (shown with an asterisk in Fig. 10). Five reduced-amplitude fractionated deflections were measured in the poorly coupled region (Fig. 10B). Near the site of wavefront breakthrough, the electrograms showed five monophasic negative deflections, an asymmetric pattern commonly observed at stimulus sites or at sites with abrupt decreases in conductivity (Fig. 10C) (7, 19).
Fig. 10.

Electrogram recordings taken with 960-μm disk electrodes at observation points in the inhomogeneous tissue during the case of focal stimulation shown in Fig. 6A,1. A: recording in the well-coupled region. B: recording in the poorly coupled region. C: recording at the site of wavefront breakthrough. *Electrograms arising from reentry. The recording electrodes are indicated with white circles in Fig. 6A.
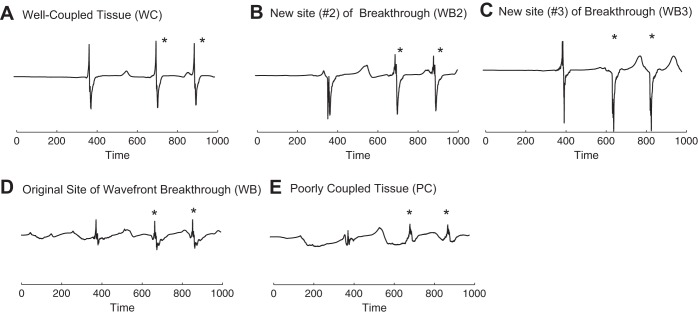
Electrograms were also computed at discrete sites in the tissue for the new case of wavefront breakthrough and reentry shown in Fig. 8, A and B, where the original site of breakthrough was eliminated. The electrogram recordings in the well-coupled tissue showed three deflections, one deflection associated with a stimulus at t = 0 ms, a subsequent breakthrough at t = 380 ms, and wavefront reentry, and two deflections associated with the reentrant wavefront, which broke through at t = 660 ms and t = 850 ms (Fig. 11A). The first biphasic deflection recorded in the well-coupled region (Fig. 11A) was in response to a wave breakthrough at the bottom right corner of the poorly coupled region at t = 380 ms shown in Fig. 8A. This wavefront was the only stimulated beat to propagate out of the poorly coupled region and reenter. The electrogram recording at the first site of breakthrough (Fig. 11B) showed one asymmetric downward deflection and two biphasic deflections, indicating that the site of the breakthrough moved to a different location after the first escape. As shown in Fig. 8B, the breakthrough site moved to the upper right corner of the poorly coupled region. The electrograms computed at the site of the second breakthrough (Fig. 11C) showed one initial biphasic deflection and two asymmetric downward deflections once the second alternate site became the breakthrough location. The second breakthrough site enabled sustained reentry that contributed to the last two biphasic deflections in the well-coupled region shown in Fig. 11A. The electrogram recordings at the original breakthrough site showed three small biphasic deflections rather than the five large monophasic negative deflections seen previously (Fig. 10C). In the poorly coupled region, the deflections in the electrograms (Fig. 11E) had reduced amplitude and varied in shape depending on the direction of the propagating wavefront and the timing of wavefront collisions during reentry.
Fig. 11.
Electrogram recording taken with 960-μm disk electrodes at observation points in the inhomogeneous tissue after the original site of wavefront breakthrough was eliminated. A: recording in the well-coupled region. B and C: recordings at the new sites of wavefront breakthrough. D: recording at the original site of wavefront breakthrough. E: recording in the poorly coupled region. *Electrograms arising from reentry. The recording electrodes are indicated with white circles in Fig. 8, A and B.
DISCUSSION
This modeling study using randomly generated tissues demonstrates that cardiac microstructure can influence the escape of focal beats from poorly coupled, fibrotic patches of tissue. Independently of changes in ion channel properties, variations in microstructure at the boundary between the poorly coupled region of cardiac tissue and surrounding tissue that is more well coupled can enable the formation of isolated wavefront breakthroughs that can give rise to sustained reentrant circuits in fibrotic tissue. These cases are an extension of a recent modeling study by Hubbard and Henriquez (16), which has shown that the border zone between well-coupled and poorly coupled regions of diseased tissue is a critical regime where source-sink mismatch leads to pronounced spatial variability in conduction delays, Na+ current, and isolated wavefront breakthrough. The simulations in this report were run at a very small spatial step (dx =10 μm) inside the domain to reduce numeric artifacts caused by spatial discretization. We did not run a full convergence study, but studies in one dimension by our group and others have shown that a resolution this fine is sufficient. The localized breakthrough of focal beats at the boundary between well-coupled and poorly coupled regions of tissue is a reproducible phenomena that has been observed using a number of tissue models both in this study and in a previously published study by our laboratory (16).
Several in vitro studies (23, 38) of spiral wave dynamics of tissue-engineered cardiac monolayers provide additional experimental evidence that in critical regimes near the onset of block caused either by structural properties or rapid pacing, small variations in microstructure create variations in source load that can increase the likelihood of unidirectional conduction block, reentry, and possibly wave breakup. An image-based three-dimensional modeling study of the structurally heterogeneous infarct border zone by Smaill et al. (34) has also shown that the complex pathways created by strands of viable myocytes (as thin as 1 cell) interspersed with collagen can lead to unidirectional block, prolonged activation, action potentials with a slow rising foot, and, in a few cases, reentry during rapid pacing. The simplified microstructural models used in this study show that variations in the brick wall cell arrangement, a feature not usually included in continuous computer models of cardiac tissue, create local variations in conduction delay and wavefront escape at the boundary between the poorly coupled and well-coupled region. The correlation between the brick wall cell arrangement and local sites of wavefront breakthrough is consistent with a microstructural modeling study (17) in homogeneous tissue that has shown that overlap between rows of cells increases the effective longitudinal conductivity and longitudinal conduction velocity. The local increase in the effective longitudinal conductivity reduces source-load mismatch, enabling wavefront escape to occur at discrete sites with a greater degree of brick wall overlap. The pattern of escape at sites of source-load mismatch can become increasingly complex, including escapes along the transverse boundary and variable responses to premature stimuli given at different basic cycle lengths.
In this microstructural modeling study, the behavior at the transition between conduction and block was very sensitive and could be modulated by changes in gj as small as 0.001 μS (Fig. 2). A previous microstructural modeling study of premature stimulation in aging atrial bundles by Spach et al. (37) has shown that spatial differences in Na+ current caused by variations in tissue microstructure near the stimulus site can lead to incremental and decremental propagation and arrhythmogenic responses such as microreentry and lateral shifts in conduction. In both modeling studies and the corresponding experimental studies in aging atrial bundles, the pattern of propagation was extremely sensitive and could be modulated by a change as small as 1 μs in the premature stimulus interval (37). Sensitivity to Na+ current near the limit of block may explain why small, random variations in cell arrangement and gap junction coupling in small regions of tissue can alter the onset of conduction block near individual cells along the transition boundary. The onset of wavefront breakthrough may also be sensitive to small changes in repolarizing currents, leading to variations in the pattern of the wavefront breakthrough after multiple beats. We expect that modifying the membrane model would not change the underlying mechanism but would affect the parameters for which conduction block takes place. Additional studies that also incorporate the electrophysiological changes that occur in diseased tissue would be useful for probing the sensitivity of the tissue to changes in Na+, K+, and Ca2+ handling.
The size scale at which the wavefront breakthroughs occur in this study suggests that patterns of propagation created by the underlying microstructure should be considered when targeting regions of abnormal electrical activity using techniques such as cardiac ablation. Current approaches for atrial ablation focus on targeting relatively large regions (i.e., the openings of pulmonary veins) that are known to harbor ectopic activity or on modifying the underlying diseased substrate (5, 12, 30). More recent clinical and experimental studies have suggested that targeting sites of CFEs may help improve the efficacy of current ablation therapies. A number of underlying passive and active mechanisms can contribute to the formation of CFEs, which can make it difficult to determine which CFE sites actively contribute to arrhythmia initiation and formation (22, 28). In healthy tissue, electrogram recordings show a positive deflection as the wavefront moves toward the recording electrode and a closely spaced negative deflection as the wavefront moves away from the recording electrode. In diseased tissue, the pattern of propagation as the wavefront approaches the electrode is more complex, leading to electrogram fractionation or electrogram asymmetry. Negative asymmetric electrograms are correlated with excitation onset, where the wavefront only moves away from the electrode, whereas positive asymmetric electrograms are correlated with excitation termination, where the wavefront only moves toward the electrode (7). This modeling study of heterogenous tissue demonstrates that 1) structural heterogeneity in the border zone between well-coupled and poorly coupled tissue may actively facilitate the formation of reentrant circuits and 2) electrogram asymmetry, particularly a single negative deflection, combined with small, fractionated signals may be reliable indicator for locating the dynamic microscopic sites of wavefront breakthrough that lead to microreentry. This “S wave” electrogram morphology (negative deflection) has been observed clinically at recording sites in the arrhythmogenic pulmonary veins and at a site of ectopic activation and breakthrough (14, 25). In a recent three-dimensional computational study (39) of a human atrial model with fiber orientation, electrode recordings using surface electrodes have shown negative deflections at the macroscopic level near sites of ectopic foci. Monophasic negative deflections have also been observed in computational studies (7, 19) at stimulus sites, at boundary collisions, and at sites of abrupt changes in conductivity, all instances in which source current is greater than load current at the electrode recording site. In this study, the negative deflections at the site of escape from the poorly coupled region are primarily attributed to abrupt changes in coupling; however, changes in source-load mismatch caused by a transition from a narrow isthmus of surviving cells to a larger mass of healthy tissue may also lead to changes in electrogram shape recorded at the boundary between poorly coupled and well-coupled tissue. Comprehensive studies that combine realistic microstructural computer models with patterned cultures of cardiomyocytes may be a valuable resource for understanding the link between cardiac microstructure, abnormal propagation, and features of electrograms observed in experimental studies of diseased tissue (18, 19).
The findings in this study were based on a two-dimensional computer model while the initiation and propagation of ectopic foci occur in a three-dimensional structure with increased variations in cell arrangement as well as in gj and distribution. In three dimensions, the propagation of buried ectopic sources is more complex, and the increase in the number of cell-to-cell connections may lead to an increase in the number of wavefront breakthroughs, making it more difficult to localize the exact placement of wavefront breakthrough, particularly if the tissue is fibrotic. Additional experimental and computational studies investigating the role of electrode size and placement in locating the site of wavefront breakthrough may lead to more efficient ways to characterize electrogram morphology in multiple dimensions (18). The ectopic beats in this study were simulated using a point stimulus rather than changing the underlying ionic currents of a group of cells in the ectopic nexus. Simulating ectopic activity and reentry using a spontaneous source would require a greater critical mass of cells and a larger overall tissue size; however, the dynamics of source-load mismatch at the boundary between the poorly coupled and well-coupled regions of the tissue would be similar to that observed in this study. The focal activations (basic cycle length = 200 ms) in this study were simulated in the absence of sinus rhythm. Focal activations that occur at a faster frequency than the sinus rhythm may give rise to wavefront breakthroughs that interact with the sinus beat, whereas focal activations that occur at a slower frequency may be masked by the sinus beat. Future studies will investigate the both the effect of coupling interval and action potential duration on the pattern of wavefront breakthrough in the presence and absence of sinus rhythm.
GRANTS
This work was supported by National Heart, Lung, and Blood Institute Grant HL-093711-01A2 (to C. S. Henriquez).
DISCLOSURES
No conflicts of interest, financial or otherwise, are declared by the author(s).
AUTHOR CONTRIBUTIONS
Author contributions: M.L.H. conception and design of research; M.L.H. performed experiments; M.L.H. analyzed data; M.L.H. and C.S.H. interpreted results of experiments; M.L.H. prepared figures; M.L.H. drafted manuscript; M.L.H. and C.S.H. edited and revised manuscript; C.S.H. approved final version of manuscript.
REFERENCES
- 1.Arutunyan A, Pumir A, Krinsky V, Swift L, Sarvazyan N. Behavior of ectopic surface: effects of β-adrenergic stimulation and uncoupling. Am J Physiol Heart Circ Physiol 285: H2531–H2542, 2003 [DOI] [PMC free article] [PubMed] [Google Scholar]
- 2.Arutunyan A, Swift LM, Sarvazyan N. Initiation and propagation of ectopic waves: insights from an in vitro model of ischemia-reperfusion injury. Am J Physiol Heart Circ Physiol 283: H741–H749, 2002 [DOI] [PMC free article] [PubMed] [Google Scholar]
- 3.Bian WN, Tung L. Structure-related initiation of reentry by rapid pacing in monolayers of cardiac cells. Circ Res 98: E29–E38, 2006 [DOI] [PubMed] [Google Scholar]
- 4.Cascio WE, Yan GX, Kléber AG. Passive electrical properties, mechanical activity, and extracellular potassium in arterially perfused and ischemic rabbit ventricular muscle. Effects of calcium entry blockade or hypocalcemia. Circ Res 66: 1461–1473, 1990 [DOI] [PubMed] [Google Scholar]
- 5.Cox JL. Surgical treatment of atrial fibrillation: a review. Europace 5: S20–S29, 2003 [DOI] [PubMed] [Google Scholar]
- 6.Crank J, Nicolson P. A practical method for numerical evaluation of solutions of partial differential equations of the heat-conduction type. Adv Comput Math 6: 207–226, 1996 [Google Scholar]
- 7.de Bakker JM, Wittkampf FH. The pathophysiologic basis of fractionated and complex electrograms and the impact of recording techniques on their detection and interpretation. Circ Arrhythm Electrophysiol 3: 204–213, 2010 [DOI] [PubMed] [Google Scholar]
- 8.Debakker JMT, Vancapelle FJL, Janse MJ, Tasseron S, Vermeulen JT, Dejonge N, Lahpor JR. Slow conduction in the infarcted human heart–zigzag course of activation. Circulation 88: 915–926, 1993 [DOI] [PubMed] [Google Scholar]
- 9.Gardner PI, Ursell PC, Fenoglio JJ, Wit AL. Electrophysiologic and anatomic basis for fractionated electrograms recorded from healed myocardial infarcts. Circulation 72: 596–611, 1985 [DOI] [PubMed] [Google Scholar]
- 10.Geselowitz DB, Barr RC, Spach MS, Miller WT. The impact of adjacent isotropic fluids on electrograms from anisotropic cardiac muscle. A modeling study. Circ Res 51: 602–613, 1982 [DOI] [PubMed] [Google Scholar]
- 11.Gutstein DE, Danik SB, Lewitton S, France D, Liu FY, Chen FL, Zhang J, Ghodsi N, Morley GE, Fishman GI. Focal gap junction uncoupling and spontaneous ventricular ectopy. Am J Physiol Heart Circ Physiol 289: H1091–H1098, 2005 [DOI] [PMC free article] [PubMed] [Google Scholar]
- 12.Haissaguerre M, Jais P, Shah DC, Takahashi A, Hocini M, Quiniou G, Garrigue S, Le Mouroux A, Le Metayer P, Clementy J. Spontaneous initiation of atrial fibrillation by ectopic beats originating in the pulmonary veins. N Engl J Med 339: 659–666, 1998 [DOI] [PubMed] [Google Scholar]
- 13.Hocini M, Ho SY, Kawara T, Linnenbank AC, Potse M, Shah D, Jais P, Janse MJ, Haissaguerre M, de Bakker JM. Electrical conduction in canine pulmonary veins–electrophysiological and anatomic correlation. Circulation 105: 2442–2448, 2002 [DOI] [PubMed] [Google Scholar]
- 14.Houben RP, de Groot NM, Smeets JL, Becker AE, Lindemans FW, Allessie MA. S-wave predominance of epicardial electrograms during atrial fibrillation in humans: Indirect evidence for a role of the thin subepicardial layer. Heart Rhythm 1: 639–647, 2004 [DOI] [PubMed] [Google Scholar]
- 15.Hubbard ML, Henriquez CS. Increased interstitial loading reduces the effect of microstructural variations in cardiac tissue. Am J Physiol Heart Circ Physiol 298: H1209–H1218, 2010 [DOI] [PMC free article] [PubMed] [Google Scholar]
- 16.Hubbard ML, Henriquez CS. Microscopic variations in interstitial and intracellular structure modulate the distribution of conduction delays and block in cardiac tissue with source-load mismatch. Europace 14: v3–v9, 2012 [DOI] [PMC free article] [PubMed] [Google Scholar]
- 17.Hubbard ML, Ying W, Henriquez CS. Effect of gap junction distribution on impulse propagation in a monolayer of myocytes: a model study. Europace 9: vi20–vi28, 2007 [DOI] [PubMed] [Google Scholar]
- 18.Jacquemet V, Henriquez CS. Genesis of complex fractionated atrial electrograms in zones of slow conduction: a computer model of microfibrosis. Heart Rhythm 6: 803–810, 2009 [DOI] [PMC free article] [PubMed] [Google Scholar]
- 19.Jacquemet V, Virag N, Ihara Z, Dang LAM, Blanc O, Zozor S, Vesin JM, Kappenberger L, Henriquez C. Study of unipolar electrogram morphology in a computer model of atrial fibrillation. J Cardiovasc Electrophysiol 14: S172–S179, 2003 [DOI] [PubMed] [Google Scholar]
- 20.Joyner RW, Wang YG, Wilders R, Golod DA, Wagner MB, Kumar R, Goolsby WN. A spontaneously active focus drives a model atrial sheet more easily than a model ventricular sheet. Am J Physiol Heart Circ Physiol 279: H752–H763, 2000 [DOI] [PubMed] [Google Scholar]
- 21.Lal R, Arnsdorf MF. Voltage-dependent gating and single-channel conductance of adult mammalian atrial gap junctions. Circ Res 71: 737–743, 1992 [DOI] [PubMed] [Google Scholar]
- 22.Latchamsetty R, Morady F. Complex fractionated atrial electrograms. Circ Arrhythm Electrophysiol 4: 117–118, 2011 [DOI] [PubMed] [Google Scholar]
- 23.Lin JW, Garber L, Qi YR, Chang MG, Cysyk J, Tung L. Reion of slowed conduction acts as core for spiral wave reentry in cardiac cell monolayers. Am J Physiol Heart Circ Physiol 294: H58–H65, 2008 [DOI] [PubMed] [Google Scholar]
- 24.Liu X, Shi H, Tan H, Wang X, Zhou L, Gu J. Decreased connexin 43 and increased fibrosis in atrial regions susceptible to complex fractionated atrial electrograms. Cardiology 114: 22–29, 2009 [DOI] [PubMed] [Google Scholar]
- 25.Lo LW, Higa S, Lin YJ, Chang SL, Tuan TC, Hu YF, Tsai WC, Tsao HM, Tai CT, Ishigaki S, Oyakawa A, Maeda M, Suenari K, Chen SA. The novel electrophysiology of complex fractionated atrial electrograms: insight from noncontact unipolar electrograms. J Cardiovasc Electrophysiol 21: 640–648, 2010 [DOI] [PubMed] [Google Scholar]
- 26.Luke RA, Saffitz JE. Remodeling of ventricular conduction pathways in healed canine infarct border zones. J Clin Invest 87: 1594–1602, 1991 [DOI] [PMC free article] [PubMed] [Google Scholar]
- 27.Luo CH, Rudy Y. A dynamic model of the cardiac ventricular action potential. 1. Simulations of ionic currents and concentration changes. Circ Res 74: 1071–1096, 1994 [DOI] [PubMed] [Google Scholar]
- 28.Nademanee K, McKenzie J, Kosar E, Schwab M, Sunsaneewitayakul B, Vasavakul T, Khunnawat C, Ngarmukos T. A new approach for catheter ablation of atrial fibrillation: mapping of the electrophysiologic substrate. J Am Coll Cardiol 43: 2044–2053, 2004 [DOI] [PubMed] [Google Scholar]
- 29.Oosterom A, Strackee J. Computing the lead field of electrodes with axial symmetry. Med Biol Eng Comput 21: 473–481, 1983 [DOI] [PubMed] [Google Scholar]
- 30.Oral H, Knight BP, Tada H, Ozaydin M, Chugh A, Hassan S, Scharf C, Lai SW, Greenstein R, Pelosi F, Strickberger SA, Morady F. Pulmonary vein isolation for paroxysmal and persistent atrial fibrillation. Circulation 105: 1077–1081, 2002 [DOI] [PubMed] [Google Scholar]
- 31.Pormann J. A Modular Simulation System for the Bidomain Equations (PhD thesis). Durham, NC: Duke University, 1999 [Google Scholar]
- 32.Pumir A, Arutunyan A, Krinsky V, Sarvazyan N. Genesis of ectopic waves: role of coupling, automaticity, and heterogeneity. Biophys J 89: 2332–2349, 2005 [DOI] [PMC free article] [PubMed] [Google Scholar]
- 33.Rohr S, Kucera JP, Kleber AG. Slow conduction in cardiac tissue, I. Circ Res 83: 781–794, 1998 [DOI] [PubMed] [Google Scholar]
- 34.Rutherford SL, Trew ML, Sands GB, LeGrice IJ, Smaill BH. High-resolution 3-dimensional reconstruction of the infarct border zone: impact of structural remodeling on electrical activation. Circ Res 111: 301–311, 2012 [DOI] [PubMed] [Google Scholar]
- 35.Saiz J, Ferrero JM, Monserrat M, Ferrero JM, Thakor NV. Influence of electrical coupling on early afterdepolarizations in ventricular myocytes. IEEE Trans Biomed Eng 46: 138–147, 1999 [DOI] [PubMed] [Google Scholar]
- 36.Shaw RM, Rudy Y. Ionic mechanisms of propagation in cardiac tissue–roles of the sodium and L-type calcium currents during reduced excitability and decreased gap junction coupling. Circ Res 81: 727–741, 1997 [DOI] [PubMed] [Google Scholar]
- 37.Spach MS, Heidlage JF, Dolber PC, Barr RC. Mechanism of origin of conduction disturbances in aging human atrial bundles: experimental and model study. Heart Rhythm 4: 175–185, 2007 [DOI] [PMC free article] [PubMed] [Google Scholar]
- 38.Steinberg BE, Glass L, Shrier A, Bub G. The role of heterogeneities and intercellular coupling in wave propagation in cardiac tissue. Philos Trans A Math Phys Eng Sci 364: 1299–1311, 2006 [DOI] [PubMed] [Google Scholar]
- 39.Tobón C, Ruiz-Villa CA, Heidenreich E, Romero L, Hornero F, Saiz J. A three-dimensional human atrial model with fiber orientation. electrograms and arrhythmic activation patterns relationship. PLOS ONE 8: e50883, 2013 [DOI] [PMC free article] [PubMed] [Google Scholar]
- 40.Wagner MB, Golod D, Wilders R, Verheijck EE, Joyner RW, Kumar R, Jongsma HJ, van Ginneken AC, Goolsby WN. Modulation of propagation from an ectopic focus by electrical load and by extracellular potassium. Am J Physiol Heart Circ Physiol 272: H1759–H1769, 1997 [DOI] [PubMed] [Google Scholar]
- 41.Wang Y, Rudy Y. Action potential propagation in inhomogeneous cardiac tissue: safety factor considerations and ionic mechanism. Am J Physiol Heart Circ Physiol 278: H1019–H1029, 2000 [DOI] [PubMed] [Google Scholar]
- 42.Yamabe H, Morihisa K, Koyama J, Enomoto K, Kanazawa H, Ogawa H. Analysis of the mechanisms initiating random wave propagation at the onset of atrial fibrillation using noncontact mapping: role of complex fractionated electrogram region. Heart Rhythm 8: 1228–1236, 2011 [DOI] [PubMed] [Google Scholar]


