Abstract
Dietary potassium loading results in rapid kaliuresis, natriuresis, and diuresis associated with reduced phosphorylation (p) of the distal tubule Na+-Cl− cotransporter (NCC). Decreased NCC-p inhibits NCC-mediated Na+ reabsorption and shifts Na+ downstream for reabsorption by epithelial Na+ channels (ENaC), which can drive K+ secretion. Whether the signal is initiated by ingesting potassium or a rise in plasma K+ concentration ([K+]) is not understood. We tested the hypothesis, in male rats, that an increase in plasma [K+] is sufficient to reduce NCC-p and drive kaliuresis. After an overnight fast, a single 3-h 2% potassium (2%K) containing meal increased plasma [K+] from 4.0 ± 0.1 to 5.2 ± 0.2 mM; increased urinary K+, Na+, and volume excretion; decreased NCC-p by 60%; and marginally reduced cortical Na+-K+-2Cl− cotransporter (NKCC) phosphorylation 25% (P = 0.055). When plasma [K+] was increased by tail vein infusion of KCl to 5.5 ± 0.1 mM over 3 h, significant kaliuresis and natriuresis ensued, NCC-p decreased by 60%, and STE20/SPS1-related proline alanine-rich kinase (SPAK) phosphorylation was marginally reduced 35% (P = 0.052). The following were unchanged at 3 h by either the potassium-rich meal or KCl infusion: Na+/H+ exchanger 3 (NHE3), NHE3-p, NKCC, ENaC subunits, and renal outer medullary K+ channel. In summary, raising plasma [K+] by intravenous infusion to a level equivalent to that observed after a single potassium-rich meal triggers renal kaliuretic and natriuretic responses, independent of K+ ingestion, likely driven by decreased NCC-p and activity sufficient to shift sodium reabsorption downstream to where Na+ reabsorption and flow drive K+ secretion.
Keywords: potassium homeostasis, hyperkalemia, feedback, sodium transport regulation
extracellular fluid (ECF) potassium concentration ([K+]) normally ranges between 3.8 and 5 mM and constitutes <5% of the whole body potassium. The remaining potassium is mainly localized to intracellular fluid (ICF), where [K+] ranges from 120 to 140 mM (36, 40), or bone. ECF [K+] is a determinant of the membrane potential and critical for normal excitability of nerves and muscles (1, 19). Hyperkalemia is a life-threatening problem that affects between 1 and 10% of hospitalized patients (39). On the other hand, a potassium-rich diet lowers blood pressure and improves cardiovascular health (16, 25). Potassium has a very high ratio of daily intake to extracellular pool size. Because a single K+-rich meal (e.g., 2 bananas) can contain the same amount of potassium found in the entire ECF (∼100 mmol), the K+ homeostatic system must be very efficient at clearing plasma K+ to avoid a life-threatening rise in ECF [K+].
The K+ homeostatic system consists of components that sense K+ intake, regulate K+ distribution between ECF and ICF, and regulate K+ excretion to match K+ intake. Regarding sensing of K+ intake, there is evidence for both feedback and feed-forward regulation. In sheep, infusing 50 mmol KCl over 1 h provoked a kaliuresis that paralleled the increase in plasma [K+] to 6 meq/l (31), yet, K+ excretion remained elevated even after plasma [K+] returned to normal suggesting that factor(s) besides plasma [K+] are important. In rats, systemic infusion of 1.5 mmol KCl over 2 h increased plasma [K+] from 4 to 5.3 mM and increased renal K+ excretion, evidence for feedback regulation (29). However, when the same amount of potassium was infused into the stomach along with a K+-free meal, a significant kaliuresis ensued although there was no significant rise in plasma K+, providing evidence for feed-forward regulation of K+ excretion (29). The regulation of K+ distribution between ECF and ICF, an important parameter not directly addressed in this study, can be affected by insulin, catecholamines, plasma K+ itself, and lactic acid production (4, 6, 45).
Regarding regulation of K+ excretion, a recent study (37) established that feeding mice a 2%K meal for 1 h increased plasma [K+] from 4 to 7 mM and provoked a rapid dephosphorylation of the renal distal convoluted tubule (DCT) NaCl cotransporter (NCC), as well as kaliuresis and natriuresis. Since NCC transport activity is increased by phosphorylation(33, 44), less NCC-phosphorylation (p) and activity would likely shift sodium downstream to the cortical collecting duct where reabsorption through epithelial Na+ channels (ENaC) generates a lumen-negative potential that drives K+ secretion through K+ channels in that region. Additionally, the increased volume flow could activate K+ secretion through the flow-sensitive large conductance Ca2+-activated K+ channels (BK) (13). The significant natriuresis and diuresis that accompany the NCC dephosphorylation, analogous to a thiazide diuretic, may explain the blood pressure lowering effects of high-K+ intake (26).
The goal of the current study was to test, in rats, whether raising plasma [K+] by intravenous infusion, to the level observed after a single K+-rich meal, can reduce NCC-p and drive kaliuresis. Our findings indicate that raising plasma [K+] by either meal feeding or intravenous infusion provokes similar decreases in NCC-p and that both of these routes of potassium delivery drive kaliuresis, diuresis, and natriuresis.
METHODS
Animal Protocols and Physiologic Measurements
All animal procedures were approved by the Institutional Animal Care and Use Committee of the Keck School of Medicine of the University of Southern California and were conducted in accordance with the National Institutes of Health Guide for the Care and Use of Laboratory Animals. Experiments were performed on male Sprague-Dawley rats (225–280 g body wt) purchased from Harlan Laboratories (San Diego, CA).
Feeding experiments.
Rats were placed in metabolic cages with water but no food at 3 PM. At 7 AM, overnight urine was collected and rats were given gelled diet prepared from powdered chow (TD 88239; Harlan-Teklad, Madison, WI) supplemented with KCl (2%K contains 4% KCl, roughly double that found in standard rat chow, and 0.74% NaCl) or a diet with no KCl added (0%K diet contains 0% KCl and 0.74% NaCl). After 3 h of free access to diet and saccharin-sweetened water (to encourage fluid intake), rats were removed (at 10 AM) and anesthetized as described below.
Infusion experiments.
As described previously (7), animals were placed in individual cages with wire floors and acclimated (4 days) to having the distal one-third of their tails tethered through a hole in the cage to protect the tail blood vessel catheters. A tail venous infusion catheter was inserted the day before the experiment, rats were fasted starting at 8 PM, and the next morning a tail arterial sampling catheter was inserted and rats returned to their cages to recover for 4 h with tails secured and catheters protected; rats were free to move about during the experiments. Arterial catheter patency was maintained with heparinized saline infusion (0.016 ml/min). Rats were divided into three groups (n = 5 each): the KCl infusion group was infused with 150 mM KCl at a variable rate to elevate and maintain the plasma [K+] to 5.5 mM and normal saline was concurrently infused to maintain an overall volume infusion rate of 4 ml/h over 3 h. The NaCl infusion group received the amount of NaCl infused into the KCl rats, in a pairwise fashion. An uninfused group was prepared and tethered in the same manner but not infused. Plasma [Na+] and [K+], sampled from arterial cannula every 15 min, were measured by flame photometry in the KCl and NaCl infused groups but not the uninfused (to avoid volume depletion).
Sample collection.
After either the 3-h feeding or infusion experiments, rats were anesthetized intramuscularly with 1:1 (vol:vol) mixture of ketamine (Phoenix Pharmaceuticals, St. Joseph, MO) and xylazine (Lloyd laboratories, Shenandoah, IA). Urine was collected from the bladder and combined with that collected in the metabolic cage or infusion cage, then kidneys were removed and processed as described below, blood was collected by cardiac puncture, and plasma was prepared and quick frozen in aliquots.
Assays
Urine volume was measured with a serological pipette. Urine and plasma [Na+] and [K+] were measured by flame photometry. Plasma aldosterone levels were determined by radioimmunoassay (Coat-A-Count, TKAL kit; Siemens Healthcare Diagnostics).
Homogenate Preparation
As described (28), cortex and medulla were separated by dissection, homogenized [5% sorbitol containing 25 mM histidine-imidazole (pH 7.5), 100 mM Na2EDTA, 20 mg/ml aprotinin, 167 mM PMSF, and a phosphatase inhibitor cocktail (Sigma P0044)] with an Ultra-Turrax T25 (IKA-Labortechnik) at a low setting for 5 min, and centrifuged at 2,000 g for removal of debris, and the supernatant was retained, the pellet was rehomogenized, and both supernatants (2,000 g supernatant = “homogenate”) pooled, quick frozen, and stored at −80°C. Protein concentration was determined by BCA assay (Pierce Thermo, Rockford, IL).
Preparation of Intracellular and Plasma Membranes
Intracellular membranes (ICM) and plasma membranes (PM) were enriched by differential centrifugation as described (35) and illustrated previously (28). In brief, the 2,000 g supernatant, prepared as above, was centrifuged at 17,000 g and the resultant 17,000-g pellet, enriched in PM, was resuspended in homogenization buffer; the 17,000-g supernatant was spun at 150,000 g and the resultant pellet, enriched in ICM, was also resuspended in homogenization buffer. Both were stored in aliquots at −80°C.
Quantitative Immunoblotting and Reagents
Homogenates were denatured in SDS-PAGE sample buffer (20 min at 60°C). Traditional SDS-PAGE “loading controls” (e.g., b-actin and GAPDH) are very abundant in kidney homogenates and typically not in the same linear range of detection as transporter proteins. Thus they are not reliable loading controls. For this reason, we employed a very direct method in which 10 μg of each prepared sample was resolved by SDS-PAGE and stained with Coomassie blue, and multiple stained bands were quantified to assess equivalent protein/lane. If a sample was under or over represented by >10%, it was clearly evident from the relative abundance of the multiple bands assayed; if not uniform, samples were reprepared and reassessed. Specific protein abundance and phosphorylation was assessed by immunoblot using antibodies as described in detail (27). Samples were analyzed at 1 and ½ volumes on the same gel to verify linearity of the detection system (amounts specified in the figure legends). Primary antibodies used included the following: anti-NHE3 (1:2,000; McDonough laboratory; Ref. 43); anti-NHE3 phosphorylated at Ser552 (NHE3pS552, 1:1,000; Millipore; Ref. 18); monoclonal anti-NKCC (1:1,000; C. Lytle, UCR; Ref. 23); anti-NKCC phosphorylated at Thr96 and Thr101 (NKCCpT96T101, 1:2,000; B. Forbush, Yale University; Ref. 9); anti-NCC (1:5,000; McDonough laboratory; Ref. 27); anti-NCC phosphorylated at Thr53, Ser71, and Ser89 (NCCpT53, NCCpS71, NCCpS89, 1:5,000; Loffing, Zurich; Ref. 37); anti-ENaC α (1:5,000) and anti-ENaC β (1:15,000; Loffing, Zurich; Ref. 37); anti-renal outer medullary K+ channel (anti-ROMK; 1:2,000; Alomone); anti-COOH-terminal STE20/SPS1-related proline alanine-rich kinase (SPAK; 1:3,000; Delpire laboratory; see Supplemental Fig. S13: Supplemental Material for this article is available online at the Am J Physiol Renal Physiol website; Ref. 12); and anti-SPAK phosphorylated at Ser373 (SPAKpS373; 1:1,000; DSTT; Dundee, UK; Ref. 33). These antibodies have been characterized in recent publications (11, 27). Polyclonal anti-SGK1 isoform antiserum (1:1,000; Sigma Aldrich SAB2104902; Ref. 38). Secondary antibodies were tagged with either Alexa Fluor 680 (Invitrogen) or IRDye 800 (LI-COR, Lincoln, NE). Signals were detected with Odyssey Infrared Imaging System (LI-COR) and quantified by accompanying software. Arbitrary density units were normalized to mean intensity of control group, defined as 1.0. Since the samples were run twice (at 1 and ½), the normalized values were averaged and mean values compiled for statistical analysis.
Antibody specificity.
Since NCC and NKCC are highly homologous transporters with analogous phosphorylation motifs and similar mobility on SDS-PAGE, antibody specificity must be experimentally validated. In a recent study (20), we assessed antibody specificity using these same antibody reagents and methods in rat renal cortex. Specifically, we immunoprecipitated NCC and NKCC, resolved both by SDS-PAGE, and transferred to PVDF for immunoblot. The resulting blots were probed with antibodies to the total and phosphorylated forms of NCC and NKCC, and the results (Fig. 4 in Ref. 20) demonstrated that 1) the anti-total NCC and NKCC antibodies were very specific with little cross reactivity; 2) anti-NCCpT58 cross reacted with NKCC (by immunoblot and immunohistochemistry); as a result, anti-NCCpT58 was not used in this study; 3) anti-NCCpT53 was quite specific for NCC with very little detection of the homologous site at NKCCpT96; 4) anti-NCCpS71 was completely specific for NCC over NKCC (there is no homologous site on NKCC); and 5) anti-NKCCpT96pT101 exhibited high degree of specificity for NKCC over NCC despite homologous sites at NCCpT53pT58. These findings established that these antisera directed against total NCC, NCCpT53, NCCpS71, NKCC, and NKCCpT96pT101 were sufficiently specific to use as probes to quantitate relative abundance of the targets. We also used NCCpS89 in this study which, like NCCpS71 has no homologous site with NKCC and detects its target in cortex but not medulla. Likewise, the recently produced anti-NCC detect NCC in cortex and not in medulla (which is highly enriched in NKCC; see Fig. 5 in Ref. 27).
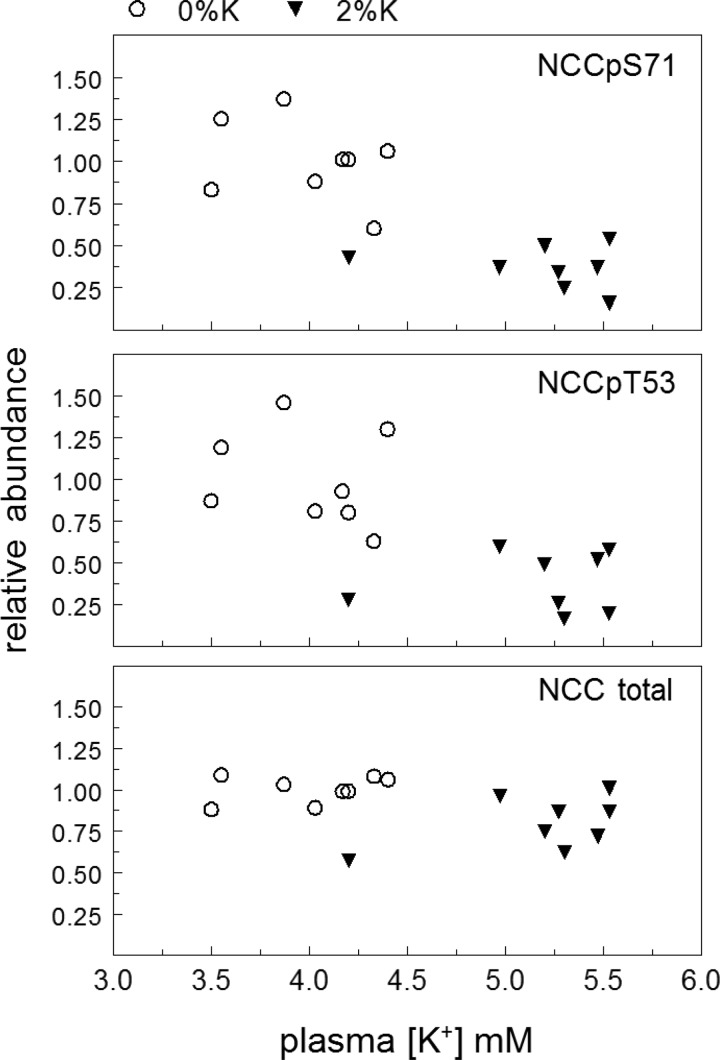
Fig. 4.
Analysis of the relationship between plasma [K+] and NCC, NCCpS71, and NCCpT53 abundance in rats fed either 0%K or 2%K meals for 3 h. Data are from Figs. 2 and 3.
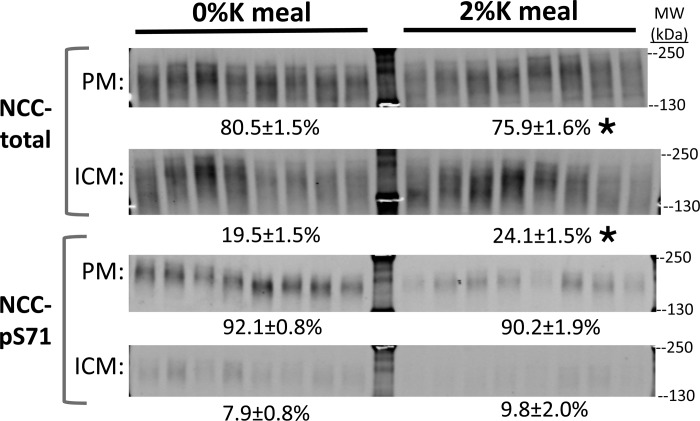
Fig. 5.
Effect of 2%K vs. 0%K meal on subcellular distribution of NCC and NCC-p. The fraction of NCC total and NCCpS71 in plasma membranes (PM) vs. intracellular membranes (ICM; n = 8) was assessed after a differential fractionation protocol that enriches for PM vs. ICM (see methods). Samples were run at a constant amount of protein/lane (6 μg) of PM and ICM. Although they are shown as distinct panels, samples of PM and ICM from both 0%K and 2%K groups were run and transferred to the same piece of PVDF so that they could be probed and compared directly to each other. The percentage of transporters in PM vs. ICM was calculated from the signal intensity corrected for the recovery of PM and ICM membrane protein in each sample (average recovery from 34.4 ± 1.2 mg starting homogenate: 9.3 ± 1.3 mg of PM and 2.8 ± 0.8 mg of ICM), and expressed as percentage of transporter abundance in total kidney homogenates. Using this method, >90% of the NCCpS71 was localized to PM, confirming previous immunohistochemistry findings and validating this approach. After the 2%K meal, ∼5% of the NCC total redistributed from PM to ICM. Values are means ± SE. *P < 0.05 vs. 0%K group.
Quantification and Statistical Analysis
The range for linearity of signal intensity with sample loading was established for each protein on each blot by loading 1 and ½ amounts of each sample side by side to verify doubling of signal intensity with doubling of sample volume. Absorbance values of 2%K diet groups were normalized to the mean intensity of the 0%K diet groups defined as 1.0. The normalized values for the 1 and ½ protein loading lanes were averaged. The difference in total abundance and phosphorylation of transporters, and their associated proteins were assessed by unpaired two-tailed Student's t-test, assuming unequal variance. Data were expressed as means ± SE. Differences were regarded significant at P < 0.05. Bonferroni correction for multiple comparisons was applied for data in Fig. 1.
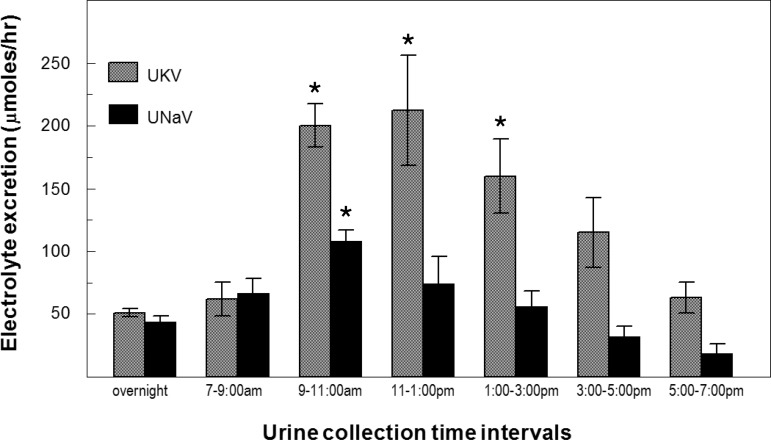
Fig. 1.
Time course of change in urinary Na+ (UNaV) and K+ (UKV) after a meal. Rats were fasted overnight (urine collected) and then fed a 2% potassium containing meal for 3 h. Urine was collected over 2-h intervals for 12 h. Urinary K+ excretion ([K+] × volume) and Na+ excretion ([Na+] × volume) measured by flame photometry indicated as means ± SE (n = 8). *P < 0.05.
RESULTS
Potassium Feeding
A recent report established the effects of potassium ingestion on renal transporter regulation and K+ excretion in mice (37). We chose to study rats, instead of mice, because raising plasma [K+] by intravenous infusion in conscious animals requires indwelling tail vein cannulas, which are quite feasible in rats. Thus it was necessary to establish the effects of K+ ingestion in rats. An initial experiment, in overnight fasted Sprague Dawley rats, established the time courses of change in urine Na+ and K+ excretion (UNaV and UKV) to a single 3-h ad libitum meal of 2% potassium diet (Fig. 1). K+ excretion increased fourfold at the 2–4 h after in initiating the meal (P < 0.005) and remained elevated for 6 h after food was removed. Na+ excretion was also significantly increased at the 2- to 4-h collection (P < 0.05) and remained elevated after food was removed. Based on these excretion patterns we chose to examine renal transporter regulation at the end of the 3-h feeding period.
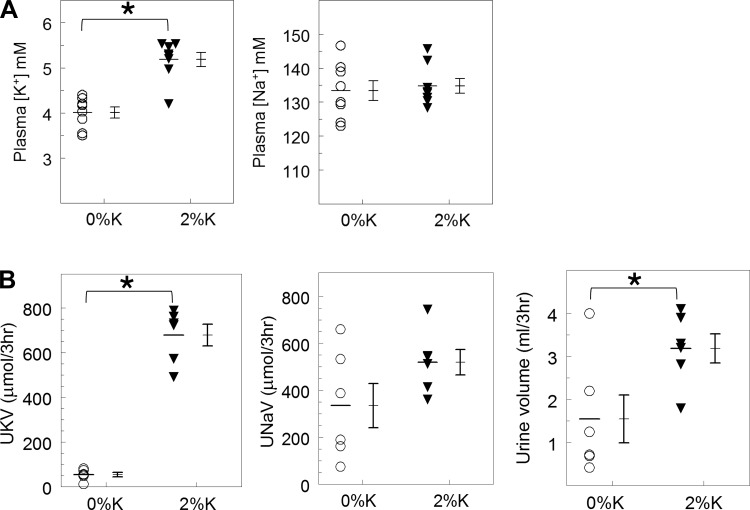
The physiological responses to feeding overnight fasted rats a 3-h ad libitum 2%K or 0%K meal (14.4 ± 1 vs. 15.2 ± 2 g consumed, respectively), measured at the end of the feeding period are summarized in Fig. 2. Plasma [K+] was 4.01 ± 0.12 mM in the 0%K group and rose to 5.18 ± 0.16 mM in the 2%K group; plasma Na+ was 134 mM in both groups. In 2%K fed rats vs. the 0%K group, UKV rose more than 10-fold (678.0 ± 48.4 vs. 54.74 ± 9.9 μmol/3 h, P < 0.001); urine volume was doubled (P = 0.03) during this 3-h feeding, evidence of a potassium diet-induced diuresis; and mean UNaV increased in the 2%K fed rats but did not reach statistical significance (unlike in Fig. 1).
Fig. 2.
Effects of a 3-h 2%K vs. 0%K meal on plasma and urinary electrolytes. Rats were fasted overnight and then fed either 2%K diet (15.2 ± 2.5 g consumed) or 0%K diet (14.4 ± 1.2 g consumed) in metabolic cages before death. A: individual plasma [K+] and [Na+] values, means ± SE; n = 8 per group. B: individual urinary electrolytes and volume measured in urine collected in metabolic cage + bladder urine, individual values, and means ± SE; n = 6 per group. *P < 0.05.
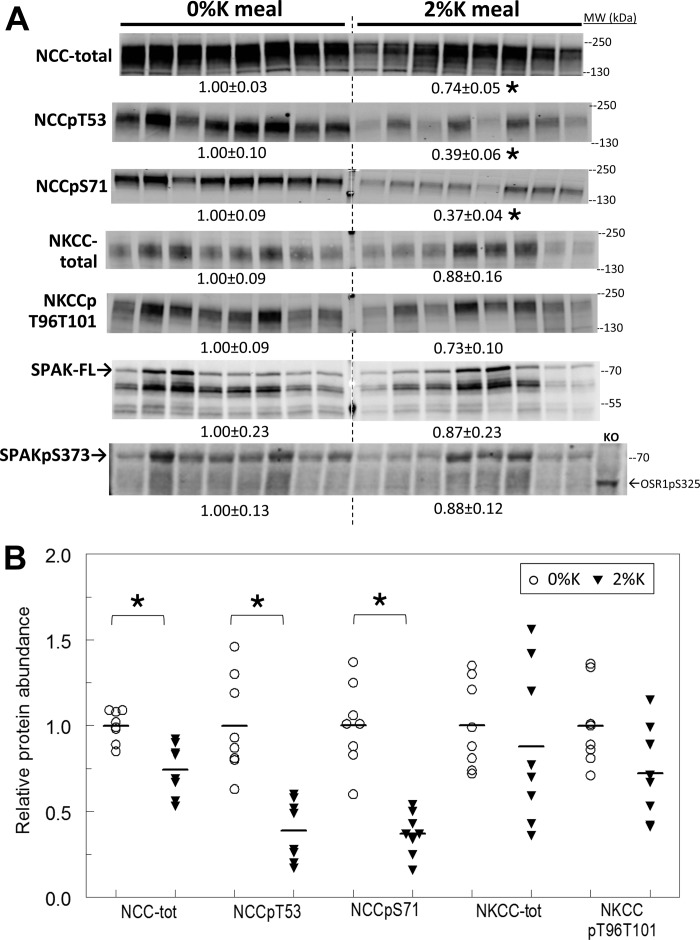
Renal cortical homogenates, prepared immediately after the 3-h feeding, were analyzed by immunoblot (see Figs. 3 and 6). Rapid renal adaptations to 2%K diet are apparent in the DCT: pool size of NCC phosphorylated at Thr 53 and/or at Ser 71 decreased 60%, and total NCC abundance decreased 25% (Fig. 3). When abundance of NCCpS71, NCCpT53 or NCC is plotted vs. plasma [K+] (Fig. 4), no evidence of a relationship between the fall in abundance and the rise in plasma [K+] emerged within the 2%K diet group, that is, the K+-rich meal depresses NCC-p apparently independent of the magnitude of rise in plasma K+.
Fig. 3.
Effect of 2%K vs. 0%K meal on Na+-Cl− cotransporter (NCC), Na+-K+−2Cl− cotransporter (NKCC), and STE20/SPS1-related proline alanine-rich kinase (SPAK) in renal cortex homogenates. A: immunoblots of renal cortex homogenates. To ensure linearity of the detection system, 1.0 and 0.5 amounts of each sample were loaded for each animal (only one amount shown): 30, 60 μg for NCC total and NCCpS71; 40, 80 μg for NCCpT53; 10, 20 μg for NKCC total and NKCCpT96T101; 10, 20 μg for SPAK-full length (SPAK-FL); and 40, 80 μg for SPAKpS373 and OSR1pS325 (detected with the same antiserum). OSR1 was not detected at levels sufficient for quantitation. Density values, normalized to mean density of 0%K group defined as 1.00, are displayed under respective blots as means ± SE. KO indicates homogenate from a SPAK knockout mouse kidney 80 μg. B: individual normalized values for NCC and NKCC are displayed with means. *P < 0.01 vs. 0%K group.
Fig. 6.
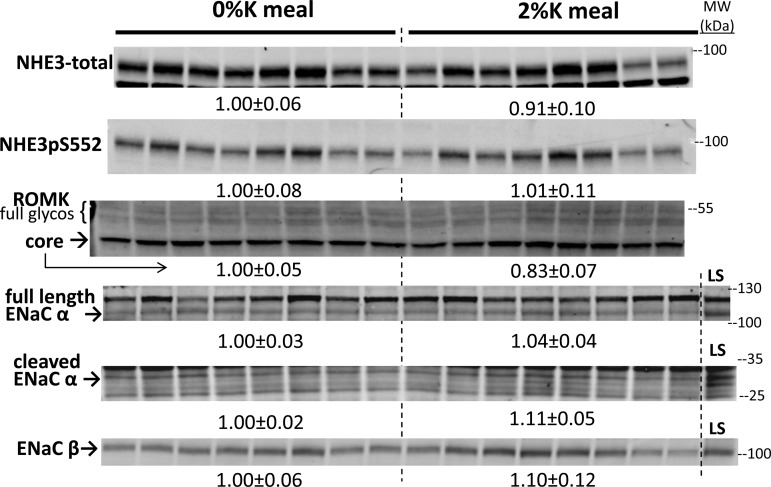
Effect of 2%K vs. 0%K meal on proximal tubule NHE3, cortical collecting duct renal outer medullary K+ channel (ROMK) and ENaC abundance in renal cortex homogenates. To ensure linearity of the detection system, 1.0 and 0.5 amounts of each sample were loaded for each animal (only one amount shown): 7.5, 15 μg for NHE3 and NHE3pS552; 30, 60 μg for ROMK and ENaC-β; and 40, 80 μg for ENaC-α. Density values, normalized to mean density of 0%K group defined as 1.00, are displayed under respective blots as means ± SE. Arrows indicate core glycosylated ROMK (core) and putative fully glycosylated ROMK (full glycos) based on expected mobility. LS indicates a sample from a rat fed nominally Na+ free diet for 1 wk to increase ENaC expression and cleavage.
To assess whether the large decrease in NCC-p was association with an internalization or redistribution of NCC or NCC-p out of the plasma membrane during the 2%K meal, a differential centrifugation strategy was applied to enrich for renal cortical PM vs. ICM (Fig. 5). Samples of PM and ICM from both groups were analyzed on the same immunoblot. Phosphorylated NCC was analyzed with anti-NCCpS71 because this site has no homologous phosphorylation site in NKCC (34). Results, expressed as percentage of total abundance in PM + ICM = 100%, indicate that 1) virtually all of the NCC-p remains in the PM during 2%K feeding, despite the large reduction in abundance; and 2) there was a small, albeit significant, redistribution of total NCC from PM into ICM in response to the 2%K meal. These findings suggest that the changes in NCC-p occur at the PM rather than subsequent to internalization.
The anti-NKCC antibody reagents used in this study recognize not only the abundant apical thick ascending limb (TAL) NKCC isoform 2 but also the basolateral secretory NKCC isoform 1 detected in collecting duct (22). In a recent analysis of rat kidneys from this lab (27), we failed to detect any basolateral staining by immunohistochemistry in cortex or medulla confirming that the abundance of NKCC1 is quite low in kidney; with this caveat, we assume the signals detected are emanating from NKCC2. In cortex, TAL NKCC was not altered by 3-h 2%K feeding but NKCC phosphorylated at Thr 96 and Thr 101 was marginally decreased ∼25% (P = 0.055) (Fig. 3). In medulla, neither NKCC nor NKCC-p were altered (P > 0.15, not shown). Since renal SPAK can phosphorylate both NCC and NKCC and is localized to the TAL and DCT, full-length SPAK (SPAK-FL) abundance and phosphorylation (SPAKpS373) were assayed (Fig. 3). In the cortex, there were insignificant decreases in both SPAK-FL and SPAKpS373 after the 2%K meal and a high degree of animal-to-animal variation (same animal order on each blot) was evident. Phosphorylated oxidative-stress-responsive kinase 1 OSR1pS35, which also phosphorylates NCC and NKCC, detected with the same anti-SPAKpS373 antibody, was not visualized at levels sufficient for quantitation.
Since an early report (2) implicated a direct inhibitory effect of elevated peritubular [K+] on proximal tubule Na+ reabsorption, we assessed the abundance of NHE3 as well as NHE3 phosphorylated at Ser 552 (a marker for redistribution of NHE3 to the base of the PT microvilli; Ref. 17). Neither NHE3 nor NHE3pS552 was altered by the 2%K meal (Fig. 6). Abundance of the transporters driving K+ secretion in the cortical collecting duct, namely epithelial sodium channel (ENaC) subunits and principal cell secretory K+ channels (ROMK), were similarly unchanged by the 2%K meal (Fig. 6).
Potassium Infusion
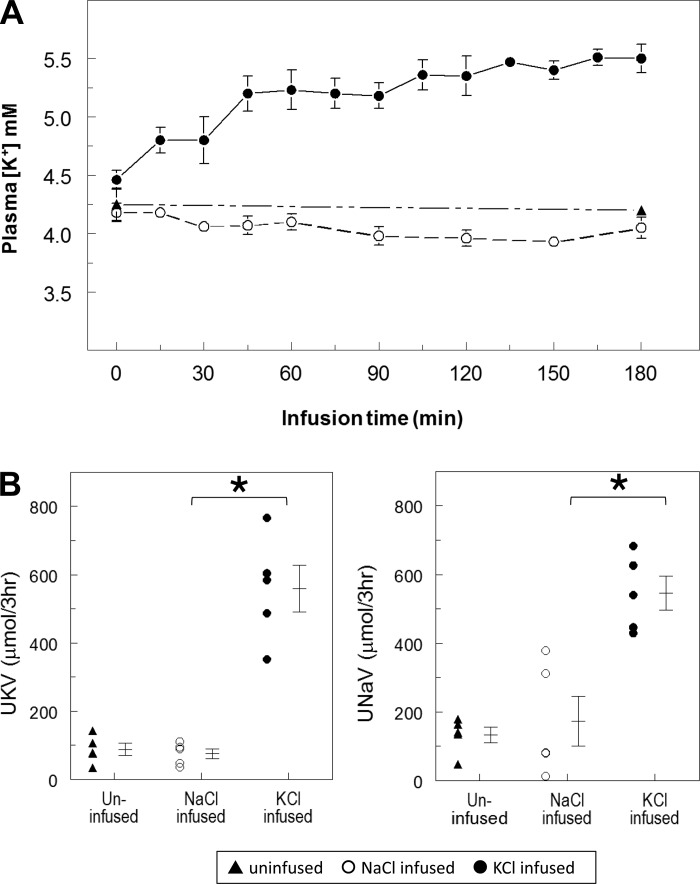
We next aimed to determine whether raising plasma [K+] to 5.5 mM by direct venous infusion (without meal feeding) over 3 h could drive the decrease in NCC-p observed after feeding. We used an established protocol (7) to tether the tails of conscious rats to their cages to allow for variable infusion of KCl to elevate plasma [K+]; saline was concurrently infused to maintain an overall volume infusion rate of 4 ml/h for 3 h. A “NaCl infused” control group was infused with the same amount of NaCl infused into the KCl rats in a paired fashion and a third group was tethered in the same manner but not infused (uninfused). Table 1 summarizes the physiological responses. Twelve ml total volume was infused into the KCl + NaCl infused group, compared with 3 ml in the NaCl-infused group. These infusions acutely expanded ECF volume as evidenced by the lower hematocrit, which was not observed in the uninfused group. Urine volume was not significantly elevated by the NaCl infusion but was fourfold higher in the KCl + NaCl-infused group, as expected from the volume expansion. Plasma [Na+] remained unchanged in all three groups, while plasma [K+] was raised, as planned, in the KCl + NaCl infused group (Fig. 7A). Urine K+ (UKV) and Na+ (UNaV) increased sixfold and threefold, respectively, during KCl + NaCl infusion but were unchanged in the NaCl infused vs. the uninfused group (Fig. 7B). We conclude that direct KCl infusion, sufficient to raise plasma K+ to 5.5 mM, provokes significant kaliuresis and natriuresis. The UKV responses were similar in magnitude in response to K+ feeding (678 ± 48 μmol/3 h) vs. K+ infusion (559 ± 68 μmol/3 h).
Table 1.
Physiologic responses to infusions of KCl and NaCl
| Uninfused | KCl Infused | NaCl Infused | |
|---|---|---|---|
| Infusion volume, ml/3 h | 0 | 12 ± 0 | 2.92 ± 0.36 |
| Infused K, mmol | 0 | 1363 ± 54 | 0 |
| Infused Na+, mmol | 0 | 452 ± 56 | 452 ± 56 |
| Urinary volume, ml/3 h | 0.96 ± 0.17 | 4.9 ± 0.64 * | 1.1 ± 0.3 |
| Hematocrit, % | |||
| Initial | 45.3 ± 1.4 | 45.8 ± 0.5 | 44.6 ± 0.7 |
| After 3 h | 45.0 ± 1.5 | 38.6 ± 1.0† | 41.8 ± 0.7† |
Values are means ± SE. KCl infusion group was infused with 150 mM KCl at a variable rate to elevate and maintain the plasma K+ concentration to 5.5 mM and 0.9% saline was concurrently infused to maintain an overall volume infusion rate of 4 ml/h over 3 h. NaCl infusion group received the same amount of NaCl that was infused into the KCl rats in a paired fashion. Uninfused group was prepared in the same manner but not infused. Infused K+ and Na+ and volumes were calculated from the infusion rate, recorded every 15 min, and the concentrations infused.
P < 0.05 in KCl infused vs. NaCl infused.
P < 0.05 before vs. after infusion.
Fig. 7.
Effects of raising plasma [K+] to 5.5 mM by tail vein infusion on plasma [K+] and urinary electrolyte excretion. Rats were fasted overnight and then infused with either 150 mM KCl plus a small amount of normal saline at variable rates to raise plasma [K+] to 5.5 mM, mimicking the changes observed after feeding 2%K diet. Controls were infused with normal saline (NaCl infused) alone matched to the volume of saline infused in the KCl infused group, or uninfused over a period of 3 h. All groups had no food and free access to drinking water (n = 4–5/group). A: plasma [K+] values in rats infused with KCl, NaCl, or uninfused. B: effects of raising plasma [K+] on urinary electrolytes in conscious rats, n = 5 per group. *P < 0.01 vs. NaCl infused group.
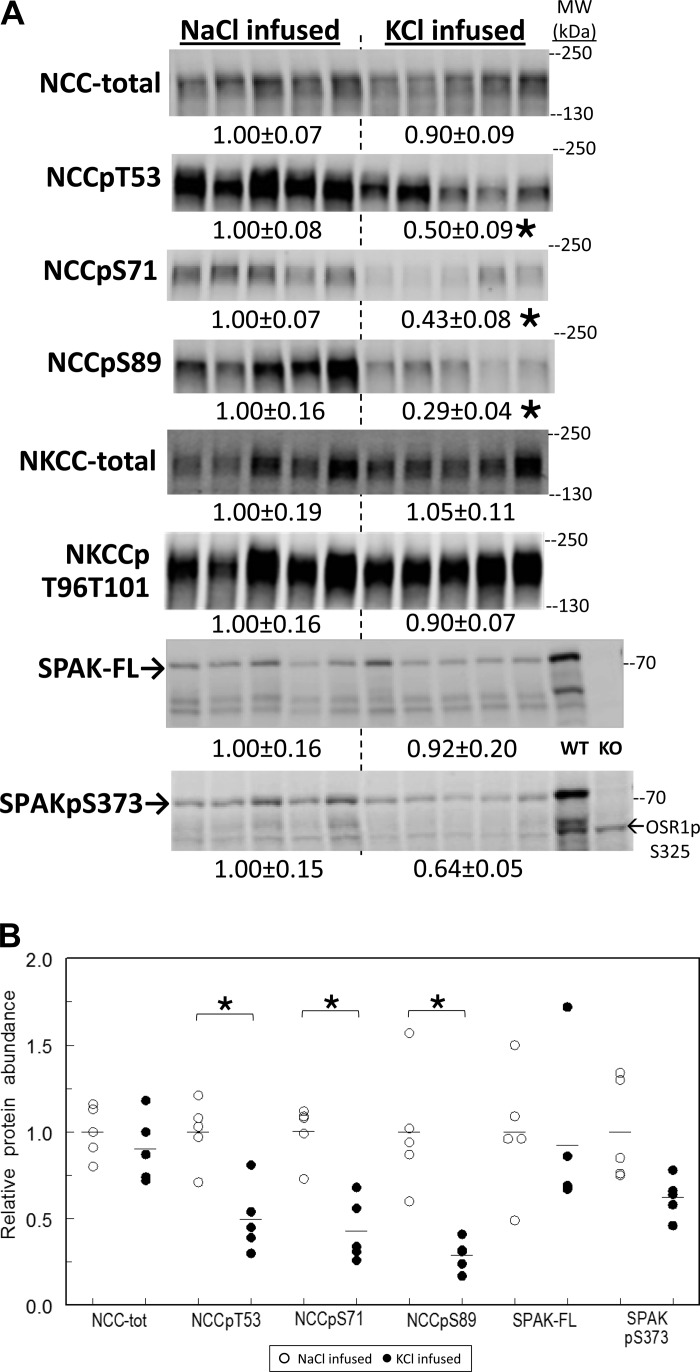
Renal cortical homogenates were prepared immediately after the infusions, and transporters were analyzed by immunoblot (Fig. 8). The total pool size of NCC was not altered by KCl infusion, while NCC phosphorylated at Thr 53, Ser 71, and/or Ser 89 decreased 50% or more, similar in magnitude to the decreases in NCC-p abundance measured after a 3-h K+- rich meal. There were no significant changes in NHE3 or NHE3-p (not shown), NKCC, NKCC-p, or SPAK and a borderline significant decrease in SPAKpS373 (P = 0.052). Thus abundance of phosphorylated NCC specifically decreased as a consequence of deliberately raising plasma [K+] to 5.5 mM by infusion, indistinguishable from the decrease in NCC-p measured after a 2%K meal, which raised plasma [K+] to a similar level. The finding indicates that the decrease in NCC-p does not require ingestion of K+ and/or activation of a gut signal.
Fig. 8.
Effects of raising plasma [K+] to 5.5 mM by tail vein infusion on NCC, NKCC and SPAK abundance and phosphorylation in renal cortex homogenates. A: immunoblots of renal cortex homogenate samples. To ensure linearity of the detection system, 1.0 and 0.5 amounts of each sample were loaded for each animal (only one amount shown): 30, 60 μg for NCC total and NCCpT53; 15, 30 μg for NCCpS71; 40, 80 μg for NCCpS89; 10, 20 μg for NKCC total and NKCCpT96T101; 10, 20 μg for SPAK total; and 40, 80 μg for SPAKpS373 and OSR1pS325 (detected with the same antiserum). Density values were normalized to mean density of the NaCl infused group (defined as 1.00) displayed under respective blots as means ± SE. Kidney samples from wild-type (WT) and SPAK KO mice were run as controls. B: individual normalized values for NCC and SPAK displayed with means. *P < 0.01 vs. NaCl-infused group.
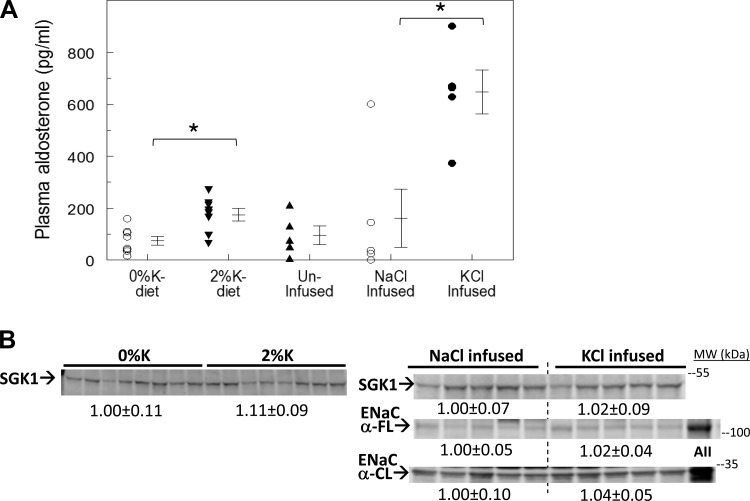
A rise in plasma [K+] stimulates aldosterone production, which increases transcription and accumulation of SGK isoform 1 (SGK1, from late DCT through collecting duct), which, in turn, activates ENaC activity which drives urinary K+ excretion (30). Interestingly, the aldosterone-SGK1 axis can also increase NCC-p in late DCT (30) which could promote K+ retention. Given this background, we assessed the changes in plasma aldosterone and renal cortical SGK1 abundance in kidneys in rats fed a potassium-rich diet and in rats infused with potassium (Fig. 9). Plasma aldosterone levels were similar in rats fed 0%K meal (75 ± 17 pg/ml) and uninfused rats (96 ± 35 pg/ml); aldosterone levels were significantly elevated in rats fed a 2%K meal (175 ± 24 pg/ml) and were highest in rats infused with KCl (648 ± 84 pg/ml). Renal cortical SGK1 levels were not altered by any of the treatments, not unexpected since SGK1 is expressed all along the nephron and regulated by aldosterone only in the distal nephron. Neither ENaC-α subunit abundance nor cleavage was increased by 3-h KCl infusion despite the elevated levels of aldosterone in rats infused with KCl (Fig. 9).
Fig. 9.
Effects of consuming a 2%K meal vs. KCl infusion on plasma aldosterone and abundance of the aldosterone early response gene SGK1 in renal cortex. A: plasma aldosterone, measured by RIA in samples taken at death from rats fed 0%K vs. 2%K diets for 3 h (n = 8; left), and measured in uninfused, NaCl infused and KCl infused for 3 h (n = 5; right). *P < 0.01. B: immunoblots of renal cortical homogenates were run at 40 and 80 μg/lane (shown is 80 μg/lane) for SGK1 and ENaC α subunit (FL, full length; CL, cleaved). Samples from rats treated chronically with angiotensin II (AII; Ref. 30) run as control. Density values were normalized to mean density of the control group (defined as 1.00) displayed under respective blots as means ± SE.
DISCUSSION
The physiological mechanisms that control potassium homeostasis after a meal (which can contain as much potassium as found in the entire ECF) remain to be thoroughly defined. Recent studies in mice determined that NCC phosphorylation, a marker of apically active NCC (20), is acutely depressed after potassium ingestion (37), which would increase flow and sodium delivery to collecting duct regions where these stimuli drive K+ secretion. Our study asked whether the rise in plasma potassium that accompanies a potassium-rich meal is sufficient to decrease the abundance of NCC-p and increase K+ excretion independent of K+ ingestion. We employed a rat model because in-dwelling tail catheters can be employed. We first determined that plasma [K+] increased to 5.0–5.5 mM after a 3-h ad libitum potassium-rich meal. In comparison, an analogous meal in mice increased plasma K+ to 7 mM, likely reflecting a higher ratio of food intake to body weight in mice vs. rats (37). In a second series, we increased plasma [K+] to 5.5 mM by intravenous infusion in conscious, overnight fasted rats. We found that whether plasma [K+] was increased by ingestion or by infusion, NCC-p was depressed more than 50%, and renal K+ excretion was increased more than sevenfold. The results establish that K+ intravenous infusion provokes a decrease in NCC-p. Whether the signal is the rise in plasma [K+] or KCl infusion per se, remains to be established.
In contrast to the findings of this current study, a previous report failed to observe an effect of raising extracellular [K+] from 5 to 10 mM on NCC-p assayed in an ex vivo incubation of purified mouse renal distal tubules. This negative finding led the investigators to conclude that a rise in [K+] per se was not sufficient to drive the drop in NCC-p (37). An explanation for the discrepancy between this result in mouse DCT and our results in rat renal cortex may lie in the levels of extracellular [K+] studied. In the current study, we found that raising plasma [K+] from 4.25 to 5.5 mM is sufficient to depress NCC-p to the same level observed after a meal to stimulate aldosterone production (and, perhaps, other factors that may depress NCC-p indirectly). The ex vivo study of distal tubules used 5 mM as the baseline ECF [K+]. This level may be high enough to either depress NCC-p directly or indirectly (see Fig. 4). Before ruling out direct effects of ECF [K+], investigators should study lower baseline concentrations of ECF [K+] on ex vivo distal tubule NCC-p.
We can estimate the compartmentalization of the infused potassium: 1,363 ± 54 μmol KCl was infused, and 40% (559 ± 68 μmol) was excreted in the urine over 3 h. The remaining 60% would partition between ECF and ICF. Assuming the starting ECF volume is 20% of body weight, and adjusting for the increase in ECF volume predicted by the decreased hematocrit (19 ± 4% expansion), the K+ present in the ECF before infusion is 193 ± 6 μmol and after infusion is 284 ± 20 μmol. This indicates that 6.7% (91 ± 2 μmol) of the infused potassium partitions into the ECF, and the remaining 52.3% is taken up by the ICF. This estimation reveals the strength of the homeostatic buffering of an ECF [K+] load by both cellular uptake (50%) and urinary excretion (40%) leaving <10% in the ECF. For comparison, the amount of K+ in a human's ECF is ∼1 g (14 liters × 0.004 M × 19 gm/mol) and the Institute of Medicine recommends consuming ∼5 g potassium per day (16). In the feeding experiments, the K+ remaining unabsorbed in the gut was not measured, preventing an analogous calculation. Nonetheless, after the 3-h 2%K meal, the rats excreted 678 ± 48 μmol into the urine and 62 ± 2 μmol partitioned into the ECF (256 ± 5 g body wt × 20% = 51.3 ml ECF; 1.2 mM increase in ECF [K+]). Previous studies provided evidence that a meal-induced gut signal plays a significant role in urinary K+ clearance after K+ ingestion (3, 21, 29). Our estimation suggests that rats fed a K-rich meal exhibit a greater increase in urinary K+ excretion (678 ± 48 μmol/3 h) to increase in ECF K+ (62 ± 2 μmol) ratio than rats directly infused with KCl (urinary K+ excretion = 559 ± 68 μmol/3 h, increase in ECF K+ = 91 ± 2 μmol). Nonetheless, the results demonstrate that a meal induced gut signal is not requisite for postprandial urinary K+ excretion.
The fact that increasing plasma [K+] by intravenous infusion provokes the same renal transporter change(s) as ingesting a potassium-rich meal suggests that the same regulatory pathway may be activated by both and that the two routes of K+ delivery converge on the same stimulus: a rise in plasma [K+] or, alternatively, KCl addition to the ECF per se. A classic study by Brandis et al. (2) suggested that the proximal tubule, where K+ reabsorption is proportional to Na+ reabsorption, is a target for increasing K+ excretion: proximal tubule reabsorption rate decreased 33% in anesthetized rats when ECF [K+] was elevated to 5–7 mM by infusion. NHE3 is the primary route for Na+ reabsorption in the proximal tubule, and NHE3-p is a marker for its redistribution out of the body of the microvilli and a marker for depressed transport activity (8, 17, 18). In this study we observed no change in abundance or phosphorylation of NHE3 after K+ feeding or infusion. A careful analysis of lithium clearance, a measure of proximal Na+ clearance, in conscious rats will be required to determine whether the proximal nephron plays a key role in this response or not. A 2-wk 10% KCl diet has previously been reported to significantly reduce cortical TAL Na+ reabsorption (5), a response that would increase sodium and volume flow to the collecting duct and promote K+ secretion. In this study, loop of Henle NKCC abundance was unchanged, yet cortical NKCC-p was marginally depressed 25% (P = 0.055) by the 2%K meal and not at all by KCl infusion. This raises the likely possibility that chronic high-potassium diet recruits mechanisms distinct from those observed in response to a single meal.
The marked decrease in phosphorylation of NCC in DCT led us to ask whether NCC-p was internalized out of the plasma membranes: virtually all (>90%) remained in the enriched plasma membrane fraction (Fig. 5), indicating that NCC was either dephosphorylated (or phosphorylation inhibited) at the plasma membrane. Interestingly, in response to the potassium-rich meal, we did detect a small but significant decrease in total NCC abundance associated with a significant redistribution of the remaining NCC from plasma membranes to intracellular membranes. Interestingly, NCC total and surface expression has been reported to decrease in response to chronic high-potassium diet (10, 41, 42); thus this acute redistribution may be an early indicator of the chronic response. A careful analysis of response to K+-rich diet at time points intermediate between 3 h and days, as well as analysis of NCC trafficking between ICM and PM, will be necessary to reconcile these findings. Cortical SPAK-p tended to decrease in both the feeding and infusion experiments, but the magnitude of the decrease and the high variability do not support the idea that a decrease in SPAK-p drives the much greater decrease in NCC-p. A more likely potential relationship is that the pathway that provokes the reduction in NCC-p in the DCT also reduces SPAK-p colocalized with NCC-p. The band pattern observed in our SPAK blots is distinct from that observed by other groups (24, 32) in which bands corresponding to SPAK-2 and SPAK-KS predominate and the full-length SPAK band is weaker. We have recently fully characterized the SPAK isoform detection (11; see Supplemental Fig. S13) and believe the difference can be accounted for by the very mild homogenization procedure employed in our studies.
Sorensen et al. (37) reported, in their study of mice given KCl gavage that the acute decrease in NCC-p occurred before any rise in plasma aldosterone and that the response was still observed in aldosterone synthase-deficient mice. In our study in rats, we measured plasma aldosterone at the 3-h time point of K+ feeding or infusion and discovered that levels were doubled after K+ feeding and increased fourfold after direct K+ infusion. The reason behind the higher levels of aldosterone after infusion vs. feeding may include the following: the difference in the route of K+ delivery to the adrenals, impact of postprandial factors during the meal, and time course of elevation in plasma K+. Despite these very different aldosterone levels, there were very similar decreases in NCC-p as well as elevations UKV after K+ feeding or K+ infusion supporting the findings of Sorensen et al. (37) in mice that the acute drop in NCC-p and kaliuresis are independent of the rise in aldosterone. Although there are significant increases in aldosterone levels, there were no changes in collecting duct transporters that would facilitate K+ excretion detected at this early time point in response to the acute K+ challenge. This finding concurs with that of Sorensen et al. (37), who observed activation of ENaC only 6 h after gastric KCl gavage (actually following the peak of K+ excretion) leading to the conclusion that aldosterone is involved in long term, rather than acute, regulation of K+ excretion. Eight days of high-K+ diet is reported to increase the fully glycosylated ROMK and the cleavage of ENaC γ (42). Interestingly, mice that lack SGK1 exhibit a blunted kaliuretic response to an acute 1-h K+ infusion that increases plasma [K+] by 1.5 mM (15), yet they also exhibit an augmented suppression of NCC in response to chronic high-K+ diet (41). In our study, rapid kaliuresis, diuresis, and natriuresis ensued without any of these aldosterone-dependent changes, leaving us to conclude that the basal abundance of the ENaC and ROMK (and perhaps BK) channels in the cortical collecting duct can adjust sufficiently to respond acutely to the increased Na+ delivery and flow. The mechanisms remain to be determined.
Future studies of the acute K+ adaptation response should be aimed at 1) refining the definition of the “signal,” specifically, the dose response connecting the potassium load infused, the subsequent rise in plasma [K+] and the decrease in NCC-p; 2) determining whether ingesting K+ increases the gain of the response; 3) the nature of the signal perceived by the distal convoluted tubule; 4) the molecular target(s) that leads to the rapid depression of NCC-p, including the role of the kinases that influence phosphorylation such as WNKs, SPAK and SGK1 (5, 14, 15, 32); and 5) effects of an acute K+ load (ingestion or infusion) on ENaC, ROMK, and BK activity. Understanding these fundamental responses can be useful in both treating hyperkalemia and in developing new natriuretic and diuretic therapies.
GRANTS
This research was supported by National Institute of Diabetes and Digestive and Kidney Diseases Grant DK-083785 (to A. A. McDonough) and DK-093501 (to E. Delpire).
DISCLOSURES
No conflicts of interest, financial or otherwise, are declared by the author(s).
AUTHOR CONTRIBUTIONS
Author contributions: S.R., J.H.Y., and A.A.M. conception and design of research; S.R., D.H.L., Y.T.O., and A.A.M. performed experiments; S.R., D.H.L., Y.T.O., and A.A.M. analyzed data; S.R., E.D., J.H.Y., and A.A.M. interpreted results of experiments; S.R., D.H.L., and A.A.M. prepared figures; S.R. and A.A.M. drafted manuscript; S.R., D.H.L., E.D., J.H.Y., and A.A.M. edited and revised manuscript; S.R., D.H.L., Y.T.O., E.D., J.H.Y., and A.A.M. approved final version of manuscript.
REFERENCES
- 1.Bia MJ, DeFronzo RA. Extrarenal potassium homeostasis. Am J Physiol Renal Fluid Electrolyte Physiol 240: F257–F268, 1981 [DOI] [PubMed] [Google Scholar]
- 2.Brandis M, Keyes J, Windhager EE. Potassium-induced inhibition of proximal tubular fluid reabsorption in rats. Am J Physiol 222: 421–427, 1972 [DOI] [PubMed] [Google Scholar]
- 3.Calo L, Borsatti A, Favaro S, Rabinowitz L. Kaliuresis in normal subjects following oral potassium citrate intake without increased plasma potassium concentration. Nephron 69: 253–258, 1995 [DOI] [PubMed] [Google Scholar]
- 4.Cheema-Dhadli S, Chong CK, Kamel KS, Halperin ML. An acute infusion of lactic acid lowers the concentration of potassium in arterial plasma by inducing a shift of potassium into cells of the liver in fed rats. Nephron Physiol 120: 7–15, 2012 [DOI] [PubMed] [Google Scholar]
- 5.Cheng CJ, Baum M, Huang CL. Kidney-specific WNK1 regulates sodium reabsorption and potassium secretion in mouse cortical collecting duct. Am J Physiol Renal Physiol 304: F397–F402, 2013 [DOI] [PMC free article] [PubMed] [Google Scholar]
- 6.Choi CS, Lee FN, McDonough AA, Youn JH. Independent regulation of in vivo insulin action on glucose versus K(+) uptake by dietary fat and K(+) content. Diabetes 51: 915–920, 2002 [DOI] [PubMed] [Google Scholar]
- 7.Choi CS, Thompson CB, Leong PK, McDonough AA, Youn JH. Short-term K+ deprivation provokes insulin resistance of cellular K+ uptake revealed with the K+ clamp. Am J Physiol Renal Physiol 280: F95–F102, 2001 [DOI] [PubMed] [Google Scholar]
- 8.Crajoinas RO, Oricchio FT, Pessoa TD, Pacheco BP, Lessa LM, Malnic G, Girardi AC. Mechanisms mediating the diuretic and natriuretic actions of the incretin hormone glucagon-like peptide-1. Am J Physiol Renal Physiol 301: F355–F363, 2011 [DOI] [PubMed] [Google Scholar]
- 9.Flemmer AW, Gimenez I, Dowd BF, Darman RB, Forbush B. Activation of the Na-K-Cl cotransporter NKCC1 detected with a phospho-specific antibody. J Biol Chem 277: 37551–37558, 2002 [DOI] [PubMed] [Google Scholar]
- 10.Frindt G, Palmer LG. Effects of dietary K on cell-surface expression of renal ion channels and transporters. Am J Physiol Renal Physiol 299: F890–F897, 2010 [DOI] [PMC free article] [PubMed] [Google Scholar]
- 11.Gonzalez-Villalobos RA, Janjoulia T, Fletcher NK, Giani JF, Nguyen MT, Riquier-Brison AD, Seth DM, Fuchs S, Eladari D, Picard N, Bachmann S, Delpire E, Peti-Peterdi J, Navar LG, Bernstein KE, McDonough AA. The absence of intrarenal ACE protects against hypertension. J Clin Invest 123: 2011–2023, 2013 [DOI] [PMC free article] [PubMed] [Google Scholar]
- 12.Gonzalez-Villalobos RA, McDonough AA. The absence of intrarenal ACE protects against hypertension. J Clin Invest 123: 2011–2023, 2013 [DOI] [PMC free article] [PubMed] [Google Scholar]
- 13.Holtzclaw JD, Grimm PR, Sansom SC. Role of BK channels in hypertension and potassium secretion. Curr Opin Nephrol Hypertens 20: 512–517, 2011 [DOI] [PMC free article] [PubMed] [Google Scholar]
- 14.Huang CL, Yang SS, Lin SH. Mechanism of regulation of renal ion transport by WNK kinases. Curr Opin Nephrol Hypertens 17: 519–525, 2008 [DOI] [PubMed] [Google Scholar]
- 15.Huang DY, Wulff P, Volkl H, Loffing J, Richter K, Kuhl D, Lang F, Vallon V. Impaired regulation of renal K+ elimination in the sgk1-knockout mouse. J Am Soc Nephrol 15: 885–891, 2004 [DOI] [PubMed] [Google Scholar]
- 16.Institute of Medicine. Dietary Reference Intakes for Water, Potassium, Sodium, Chloride, and Sulfate. Washington, DC: The National Academies Press, 2004 [Google Scholar]
- 17.Kocinsky HS, Dynia DW, Wang T, Aronson PS. NHE3 phosphorylation at serines 552 and 605 does not directly affect NHE3 activity. Am J Physiol Renal Physiol 293: F212–F218, 2007 [DOI] [PubMed] [Google Scholar]
- 18.Kocinsky HS, Girardi AC, Biemesderfer D, Nguyen T, Mentone S, Orlowski J, Aronson PS. Use of phospho-specific antibodies to determine the phosphorylation of endogenous Na+/H+ exchanger NHE3 at PKA consensus sites. Am J Physiol Renal Physiol 289: F249–F258, 2005 [DOI] [PubMed] [Google Scholar]
- 19.Kurtzman NA, Gonzalez J, DeFronzo R, Giebisch G. A patient with hyperkalemia and metabolic acidosis. Am J Kidney Dis 15: 333–356, 1990 [DOI] [PubMed] [Google Scholar]
- 20.Lee DH, Maunsbach AB, Riquier-Brison AD, Nguyen MT, Fenton RA, Bachmann S, Yu AS, McDonough AA. Effects of ACE inhibition and ANG II stimulation on renal Na-Cl cotransporter distribution, phosphorylation, and membrane complex properties. Am J Physiol Cell Physiol 304: C147–C163, 2013 [DOI] [PMC free article] [PubMed] [Google Scholar]
- 21.Lee FN, Oh G, McDonough AA, Youn JH. Evidence for gut factor in K+ homeostasis. Am J Physiol Renal Physiol 293: F541–F547, 2007 [DOI] [PubMed] [Google Scholar]
- 22.Liu W, Schreck C, Coleman RA, Wade JB, Hernandez Y, Zavilowitz B, Warth R, Kleyman TR, Satlin LM. Role of NKCC in BK channel-mediated net K+ secretion in the CCD. Am J Physiol Renal Physiol 301: F1088–F1097, 2011 [DOI] [PMC free article] [PubMed] [Google Scholar]
- 23.Lytle C, Xu JC, Biemesderfer D, Forbush B., 3rd Distribution and diversity of Na-K-Cl cotransport proteins: a study with monoclonal antibodies. Am J Physiol Cell Physiol 269: C1496–C1505, 1995 [DOI] [PubMed] [Google Scholar]
- 24.McCormick JA, Mutig K, Nelson JH, Saritas T, Hoorn EJ, Yang CL, Rogers S, Curry J, Delpire E, Bachmann S, Ellison DH. A SPAK isoform switch modulates renal salt transport and blood pressure. Cell Metab 14: 352–364, 2011 [DOI] [PMC free article] [PubMed] [Google Scholar]
- 25.McDonough AA, Nguyen MT. How does potassium supplementation lower blood pressure? Am J Physiol Renal Physiol 302: F1224–F1225, 2012 [DOI] [PMC free article] [PubMed] [Google Scholar]
- 26.McDonough AA, Youn JH. Need to quickly excrete K(+)? Turn off NCC. Kidney Int 83: 779–782, 2013 [DOI] [PMC free article] [PubMed] [Google Scholar]
- 27.Nguyen MT, Lee DH, Delpire E, McDonough AA. Differential regulation of Na+ transporters along nephron during ANG II-dependent hypertension: distal stimulation counteracted by proximal inhibition. Am J Physiol Renal Physiol 305: F510–F519, 2013 [DOI] [PMC free article] [PubMed] [Google Scholar]
- 28.Nguyen MT, Yang LE, Fletcher NK, Lee DH, Kocinsky H, Bachmann S, Delpire E, McDonough AA. Effects of K+-deficient diets with and without NaCl supplementation on Na+, K+, and H2O transporters abundance along the nephron. Am J Physiol Renal Physiol 303: F92–F104, 2012 [DOI] [PMC free article] [PubMed] [Google Scholar]
- 29.Oh KS, Oh YT, Kim SW, Kita T, Kang I, Youn JH. Gut sensing of dietary K+ intake increases renal K+ excretion. Am J Physiol Regul Integr Comp Physiol 301: R421–R429, 2011 [DOI] [PMC free article] [PubMed] [Google Scholar]
- 30.Pao AC. SGK regulation of renal sodium transport. Curr Opin Nephrol Hypertens 21: 534–540, 2012 [DOI] [PubMed] [Google Scholar]
- 31.Rabinowitz L, Sarason RL, Yamauchi H. Effects of KCl infusion on potassium excretion in sheep. Am J Physiol Renal Fluid Electrolyte Physiol 249: F263–F271, 1985 [DOI] [PubMed] [Google Scholar]
- 32.Rafiqi FH, Zuber AM, Glover M, Richardson C, Fleming S, Jovanovic S, Jovanovic A, O'Shaughnessy KM, Alessi DR. Role of the WNK-activated SPAK kinase in regulating blood pressure. EMBO Mol Med 2: 63–75, 2010 [DOI] [PMC free article] [PubMed] [Google Scholar]
- 33.Richardson C, Rafiqi FH, Karlsson HK, Moleleki N, Vandewalle A, Campbell DG, Morrice NA, Alessi DR. Activation of the thiazide-sensitive Na+-Cl− cotransporter by the WNK-regulated kinases SPAK and OSR1. J Cell Sci 121: 675–684, 2008 [DOI] [PubMed] [Google Scholar]
- 34.Richardson C, Sakamoto K, de Los Heros P, Deak M, Campbell DG, Prescott AR, Alessi DR. Regulation of the NKCC2 ion cotransporter by SPAK-OSR1-dependent and -independent pathways. J Cell Sci 124: 789–800, 2011 [DOI] [PMC free article] [PubMed] [Google Scholar]
- 35.Sachs AN, Pisitkun T, Hoffert JD, Yu MJ, Knepper MA. LC-MS/MS analysis of differential centrifugation fractions from native inner medullary collecting duct of rat. Am J Physiol Renal Physiol 295: F1799–F1806, 2008 [DOI] [PMC free article] [PubMed] [Google Scholar]
- 36.Sejersted OM, Sjogaard G. Dynamics and consequences of potassium shifts in skeletal muscle and heart during exercise. Physiol Rev 80: 1411–1481, 2000 [DOI] [PubMed] [Google Scholar]
- 37.Sorensen MV, Grossmann S, Roesinger M, Gresko N, Todkar AP, Barmettler G, Ziegler U, Odermatt A, Loffing-Cueni D, Loffing J. Rapid dephosphorylation of the renal sodium chloride cotransporter in response to oral potassium intake in mice. Kidney Int 83: 811–824, 2013 [DOI] [PubMed] [Google Scholar]
- 38.Soundararajan R, Ziera T, Koo E, Ling K, Wang J, Borden SA, Pearce D. Scaffold protein connector enhancer of kinase suppressor of Ras isoform 3 (CNK3) coordinates assembly of a multiprotein epithelial sodium channel (ENaC)-regulatory complex. J Biol Chem 287: 33014–33025, 2012 [DOI] [PMC free article] [PubMed] [Google Scholar]
- 39.Stevens MS, Dunlay RW. Hyperkalemia in hospitalized patients. Int Urol Nephrol 32: 177–180, 2000 [DOI] [PubMed] [Google Scholar]
- 40.Thompson CB, Choi C, Youn JH, McDonough AA. Temporal responses of oxidative vs. glycolytic skeletal muscles to K+ deprivation: Na+ pumps and cell cations. Am J Physiol Cell Physiol 276: C1411–C1419, 1999 [DOI] [PubMed] [Google Scholar]
- 41.Vallon V, Schroth J, Lang F, Kuhl D, Uchida S. Expression and phosphorylation of the Na+-Cl− cotransporter NCC in vivo is regulated by dietary salt, potassium, and SGK1. Am J Physiol Renal Physiol 297: F704–F712, 2009 [DOI] [PMC free article] [PubMed] [Google Scholar]
- 42.van der Lubbe N, Moes AD, Rosenbaek LL, Schoep S, Meima ME, Danser AH, Fenton RA, Zietse R, Hoorn EJ. K+-induced natriuresis is preserved during Na+ depletion and accompanied by inhibition of the Na+-Cl− cotransporter. Am J Physiol Renal Physiol 305: F1177–F1188, 2013 [DOI] [PubMed] [Google Scholar]
- 43.Yang L, Leong PK, Chen JO, Patel N, Hamm-Alvarez SF, McDonough AA. Acute hypertension provokes internalization of proximal tubule NHE3 without inhibition of transport activity. Am J Physiol Renal Physiol 282: F730–F740, 2002 [DOI] [PubMed] [Google Scholar]
- 44.Yang SS, Fang YW, Tseng MH, Chu PY, Yu IS, Wu HC, Lin SW, Chau T, Uchida S, Sasaki S, Lin YF, Sytwu HK, Lin SH. Phosphorylation regulates NCC stability and transporter activity in vivo. J Am Soc Nephrol 24: 1587–1597, 2013 [DOI] [PMC free article] [PubMed] [Google Scholar]
- 45.Youn JH, McDonough AA. Recent advances in understanding integrative control of potassium homeostasis. Annu Rev Physiol 71: 381–401, 2009 [DOI] [PMC free article] [PubMed] [Google Scholar]


