

Abstract
Context:
In animal models of obesity, chronic inflammation and dysregulated extracellular matrix remodeling in adipose tissue leads to insulin resistance. Whether similar pathophysiology occurs in humans is not clear.
Objective:
The aim of this study was to test whether 10% weight gain induced by overfeeding triggers inflammation and extracellular matrix remodeling (gene expression, protein, histology) in skeletal muscle and sc adipose tissue in humans. We also investigated whether such remodeling was associated with an impaired metabolic response (hyperinsulinemic-euglycemic clamp).
Design, Setting, Participants, and Intervention:
Twenty-nine free-living males were fed 40% over their baseline energy requirements for 8 weeks.
Results:
Ten percent body weight gain prompted dramatic up-regulation of a repertoire of extracellular matrix remodeling genes in muscle and to a lesser degree in adipose tissue. The amount of extracellular matrix genes in the muscle were directly associated with the amount of lean tissue deposited during overfeeding. Despite weight gain and impaired insulin sensitivity, there was no change in local adipose tissue or systemic inflammation, but there was a slight increase in skeletal muscle inflammation.
Conclusion:
We propose that skeletal muscle extracellular matrix remodeling is another feature of the pathogenic milieu associated with energy excess and obesity, which, if disrupted, may contribute to the development of metabolic dysfunction.
Over the past 2 decades, the essential role of adipose tissue in whole-body energy homeostasis and metabolic health has been fully recognized. Due to its unique ability to rapidly and dynamically expand and contract through adipocyte hypertrophy and hyperplasia, adipose tissue represents an important buffer both in terms of energy storage but, more importantly, metabolic health during energy excess or deprivation (1). Adipose tissue remodeling is a continuous process, which is accelerated in the obese state, leading to pathological features such as impaired angiogenesis, local hypoxia, extracellular matrix overproduction and fibrosis, immune cell infiltration, and chronic low-grade inflammation, all contributing to the development of insulin resistance (1). Such pathological disturbances have typically been described in individuals with morbid obesity (2) and obese mouse models in which a high-fat diet (60% calories as lard) provokes a nearly complete remodeling of the epididymal fat depot (3). In contrast, studies in lean and overweight individuals after less severe degrees of weight gain (4, 5) or loss (6) have not demonstrated such profound pathological impairment. Whether adipose tissue remodeling and fibrosis occurs after rapid weight gain in humans is not known.
In parallel with significant advances occurring in the field of adipose tissue remodeling (1), there is growing evidence that skeletal muscle, the major site for insulin-stimulated glucose uptake, may be similarly adversely affected. Acute lipid oversupply induces robust increases in the expression of extracellular matrix (ECM) genes (collagens, fibronectin, proteoglycans, connective tissue growth factor) in the skeletal muscle of healthy individuals (7). Furthermore, total collagen and collagens I and III are higher in skeletal muscle from subjects with type 2 diabetes and obese individuals (8). Supporting the role of muscle extracellular matrix remodeling in the development of insulin resistance, both insulin resistance and muscle collagen (III and IV) deposition are rescued by pharmacological or genetic manipulation targeting the extracellular matrix in mice fed a high-fat diet (9, 10). It is not known whether ECM remodeling in skeletal muscle occurs during weight gain and is associated with development of insulin resistance in humans.
The main purpose of this study was to examine whether 8-week overfeeding (40% above energy requirements) as an experimental model to mimic early weight gain, induces inflammation and extracellular matrix remodeling in skeletal muscle and sc adipose tissue in free-living lean to overweight healthy males and whether this response was associated with impaired insulin sensitivity, measured by hyperinsulinemic-euglycemic clamp.
Materials and Methods
Participants
Twenty-nine healthy, weight-stable males aged 20–40 years, with a body mass index (BMI) (calculated as weight in kilograms divided by height in meters squared) between 22 and 32 kg/m2, were recruited from the Baton Rouge, Louisiana community using advertisements approved by an institutional review board. Subjects were excluded if they reported a history of chronic disease (diabetes, heart or liver disease, high blood pressure, gastrointestinal disorder), recent weight loss or gain (>2.5 kg over the past 6 months), had abnormal blood or urine values or had reported having a BMI of 32 kg/m2 or greater at any point in their lifetime. This study was approved by the Pennington Biomedical Research Center Institutional Review Board. All participants provided written and informed consent before screening and participation in the study (clinicaltrials.gov: identifier NCT 01672632).
Baseline weight stabilization and overfeeding
Prior to the 56-day overfeeding period, participants completed a 14-day measurement of free-living energy expenditure by doubly labeled water (DLW) (11) to determine baseline energy requirements. During the second week of DLW participants consumed an isocaloric diet (60% carbohydrate, 25% fat, 15% protein). Baseline energy requirements were calculated as the average of the measured 2-week energy expenditure by DLW and the 1-week calorie level provided during feeding at weight maintenance and was multiplied by 1.4 to determine the overfeeding prescription.
Diets
Diets were prepared by the metabolic kitchen and meals were provided in a 5-day rotation with overfeeding calories in proportion to run-in energy requirements (baseline energy requirement × 1.4). Meals were comprised of 41% carbohydrate, 44% fat, and 15% protein, and meal times were supervised by clinic staff in the Inpatient Unit, Pennington Biomedical Research Center to ensure that all foods were eaten.
Experimental procedures at baseline and after overfeeding
Body composition and ectopic fat deposition
Body composition was measured using dual x-ray absorptiometry (Hologic QDR 4500A whole body scanner), and scans were analyzed with QDR software version 11.1 (Hologic). Abdominal sc and visceral adipose tissue volumes were measured using a 3.0 T scanner (Excite HD System; General Electric) by obtaining 240–340 images from the highest point of the liver through the pubic symphysis. Images were analyzed by a single trained technician using Analyze software (AnalyzeDirect).
Hyperinsulinemic-euglycemic clamps
Insulin sensitivity was measured by a two-step hyperinsulinemic-euglycemic clamp. Insulin was infused for 180 minutes at 10 mU/min·m2 (adipose/hepatic sensitivity), immediately followed by 150 minutes at 50 mU/min·m2 (skeletal muscle sensitivity). Euglycemia (plasma glucose is 90 mg/dL) was maintained by infusion of 20% dextrose enriched to 1% with [6,6-2H2]glucose. The last 30 minutes of each insulin infusion dose was considered the glucose infusion rate (GIR), expressed per kilogram of estimated metabolic body size [GIR/fat-free mass (FFM) + 17.7] (12). From studies of metabolic rate in the Pima Indians, Lillioja and Bogardus (12) showed that metabolic rate is directly proportional to FFM + 17.7 kg, suggesting that this measure can be equated to metabolic size. The adjusted glucose disposal rate for the low and high insulin dose are termed GIR1adj (10 mU) and GIR2adj (50 mU).
Adipose and muscle tissue biopsies
Subcutaneous abdominal adipose and vastus lateralis muscle tissue samples were obtained by percutaneous biopsy. Biopsy sites were cleaned and draped. After anesthetizing the skin and underlying tissues with lidocaine and bupivicaine, adipose tissue was aspirated from the periumbilical area using a Bergstrom needle, and vastus lateralis samples were collected using the Bergstrom technique. Samples were immediately stored in fixative for immunohistochemistry or frozen in liquid nitrogen and stored at −80°C. Subsequent biopsies were obtained no less than 1 cm from the previous biopsy incision site, in compliance with standard clinical practice at our center. Adipose tissue and skeletal muscle biopsies were available from 24 and 28 individuals, respectively, at baseline and after overfeeding.
Analysis of skeletal muscle and adipose tissue
Isolation of mRNA and quantitative PCR
RNA was isolated using the miRNAeasy kit (QIAGEN) and the yield determined by spectrophotometry (NanoDrop Technologies). From each RNA sample, 200 ng was reverse transcribed to cDNA by using the high-capacity cDNA reverse transcription kit (Applied Biosystems). Relative quantification of mRNA expression was analyzed using ABI PRISM 7900 (Applied Biosystems) and custom Taqman gene expression microfluidic cards (adipose) and Taqman gene expression assays (muscle) for extracellular matrix and fibrosis-related genes [(COL1a1, COL3a1, COL4a1, COL5a1, COL6a1, COL6a3, SPARC, fibronectin, integrin αX (complement component 3 receptor 4 subunit)], VEGF, TGFβ, SMAD2 and SMAD3) and inflammation genes (CD68, IL6, NFkB, CCL2, adiponectin, VCAM, TNF-α). Primer details are listed in Supplemental Table 1. Samples were run in duplicate, and expression levels were normalized to large ribosomal protein using the ΔΔ cycle threshold calculation method (adipose) or standard curve method (muscle). In the adipose tissue and skeletal muscle, inflammation gene expression was detectable in 75%–100% and 96%–100% of available samples, respectively.
Protein analysis
For collagens 3 and 6 and CD68, 20 μg protein per sample was run on 4%–15% Criterion Tris-HCl gels (Bio-Rad Laboratories). For TGFβ3V, 40 μg of protein per sample was run on a10% SDS-PAGE gel (Bio-Rad Laboratories). Membranes were incubated at 4°C overnight with antibodies against COL3 (AbCam; number 3829), COL6 (Santa Cruz Biotechnology; SC-20649), CD68 (Abcam; ab31630), TGFβ3V (Santa Cruz Biotechnology; SC-82), glyceraldehyde-3-phosphate dehydrogenase (MCA2427; AbD Serotec), or α-tubulin (2148; Cell Signaling). The bands were visualized using the Odyssey 9120 infrared imaging system and quantified using Odyssey application software, version 3.0 (LI-COR).
Histology and immunohistochemistry
Subcutaneous adipose biopsies were fixed in 4% paraformaldehyde, dehydrated, paraffin embedded, and sectioned (4 μm). Adipocyte size was measured using the osmium tetroxide method as previously described (13). Cells were counted using the Multisizer 3 Coulter Counter (Beckman Counter) using a 400-μm aperture. Mean fat cell size was calculated from the average of two runs (1000–3000 cells/run). To examine total collagen content, Mallorys Trichrome staining and/or picrosirius red staining was performed. Picrosirius red staining was performed using Polysciences, Inc. Picrosirius red stain kit (24901–500) following the suppliers' instructions on a Leica automated slide stainer (ST5020). CD68 immunoreactivity was examined on paraffin embedded sections using primary antibodies against human CD68 (DAKO M0814, DK). All observations were performed with a Nikon Eclipse 80i light microscopy (Nikon). CD68 density was obtained by counting the total number of CD68+ macrophages in each section compared with the total number of adipocytes (total adipocytes area per mean adipocyte area) and expressed as CD68+ macrophages per 1000 adipocytes.
Electron microscopy
Adipose tissue fragments were fixed in 2% glutaraldehyde-2% formaldehyde in 0.1 M phosphate buffer overnight, postfixed in 1% osmium tetroxide, and resin embedded. Semithin sections were stained with toluidine blue for choosing the best area and thin sections were obtained with an MT-X ultratome (RCM), counterstained with lead citrate, and examined with a CM10 transmission electron microscopy (FEI).
Serum analysis
Plasma glucose concentrations during the clamp were measured using the YSI2700 STAT Analyzer (Yellow Springs Instruments). Insulin and high-sensitivity C-reactive protein was measured by immunoassay with chemiluminescent detection (Siemens; Immulite 2000XPi). Adiponectin and leptin were measured by a RIA (Millipore), and high-molecular-weight adiponectin was measured by ELISA according to kit instructions (Millipore). IL-6, IL-8, IL-10, IL-1β, and TNF-α were measured on the Luminex LabMap100 (Millipore). TGFβ1 concentrations were measured by ELISA according to the kit instructions (R&D Systems).
Statistics
All analyses were performed using the Statistical Package for Social Sciences (SPSS 20.0; SPSS Inc), and P values reported are two tailed with statistical significance set at P < .05. Data are presented as mean ± SD. Comparisons before and after overfeeding were examined using paired-samples t test and Wilcoxon signed-rank test for normally and nonnormally distributed data, respectively. Then we examined correlations between the following: 1) baseline body composition (body weight, fat mass, and FFM, percentage fat, visceral and sc adipose tissue mass) and insulin sensitivity (GIR1adj, GIR2adj) and baseline inflammation and ECM markers (serum, adipose and muscle tissue), 2) baseline inflammation and ECM markers and changes in body composition and insulin sensitivity; and 3) changes in ECM and inflammation markers and changes in body composition and insulin sensitivity after overfeeding.
Results
Weight gain increased total and ectopic fat deposition and impaired insulin sensitivity
Twenty-nine males (19 Caucasian, 10 African American, 26.8 ± 5.4 y; BMI 25.5 ± 2.3 kg/m2) completed 8 weeks of 40% overfeeding. Baseline energy requirements were 3054 ± 394 kcal/d, increasing to 4235 ± 470 kcal/d during overfeeding. Participants consumed an excess of 66156 ± 9960 kcal/d above baseline requirements over the 8-week period (range 42 476–80 052 kcal). The average weight gain was 7.6 ± 2.1 kg (range 2.3–11.0 kg), 9.7% ± 2.8% of initial body weight (range 3–15%) of which 4.2 ± 1.4 kg (55%) consisted of fat and 3.4 ± 1.5 kg (45%) consisted of FFM. Abdominal adipose tissue volume increased by 31% in the sc depot and 62% in the visceral depot. Fasting glucose levels were not different after overfeeding. However, glucose infusion rate (adjusted for estimated metabolic size) during a hyperinsulinemic-euglycemic clamp significantly decreased during both the low (10 mU/min·m2; 2.87 ± 0.94 to 2.35 ± 0.75 mg/kg·min; P < .001) and the high insulin infusion (50 mU/min·m2; 11.51 ± 2.54 to 10.91 ± 2.46 mg/kg·min, P < .05), indicating overfeeding-induced insulin resistance. There was no change in physical activity level, calculated using total daily energy expenditure (DLW) divided by 24-hour energy expenditure (metabolic chamber), after overfeeding (data not shown). Changes in body composition and metabolic health are summarized in Table 1.
Table 1.
Clinical Characteristics and Metabolic and Inflammation Measures Before and After 8 Weeks of Overfeeding
| Before Overfeeding | After Overfeeding | |
|---|---|---|
| Anthropometry and body composition | ||
| Weight, kg | 81.9 ± 10.3 | 89.5 ± 9.4a |
| Waist circumference, cm | 84.6 ± 6.6 | 92.0 ± 7.2b |
| Body fat, % | 19.4 ± 4.9 | 22.3 ± 5.2b |
| Fat mass, kg | 16.0 ± 4.8 | 20.2 ± 5.6b |
| FFM, kg | 65.9 ± 7.3 | 69.4 ± 7.3b |
| Subcutaneous adipose tissue, kg | 4.1 ± 1.5 | 5.4 ± 1.8b |
| Visceral adipose tissue, kg | 0.58 ± 0.49 | 0.94 ± 0.58b |
| Insulin sensitivity | ||
| Fasting insulin, μU/mL | 5.4 ± 4.0 | 8.3 ± 7.8a |
| Fasting glucose, mg/dL | 91.0 ± 6.7 | 92.7 ± 6.9 |
| GIR, mg/min·(FFM + 17.7) | ||
| Insulin infusion at 10 mU/min·m2 | 2.87 ± 0.94 | 2.35 ± 0.75b |
| Insulin infusion at 50 mU/min·m2 | 11.51 ± 2.54 | 10.91 ± 2.46a |
| Serum metabolic markers | ||
| Triglycerides, mg/dL | 87 ± 42 | 96 ± 68 |
| Free fatty acids, nmol/L | 0.26 ± 0.08 | 0.30 ± 0.11 |
| Total cholesterol, mg/dL | 171 ± 25 | 196 ± 31b |
| HDL to LDL ratio | 0.59 ± 0.20 | 0.50 ± 0.16b |
| Leptin, ng/mL | 6.4 ± 4.9 | 11.1 ± 6.4b |
| Circulating inflammatory markers | ||
| High-sensitivity C-reactive protein, mg/L | 0.6 (0.3–1.7) | 0.7 (0.5–1.6) |
| Total adiponectin, μg/mL | 3.6 (1.1–3.6) | 4.5 (2.2–7.1) |
| High-molecular-weight adiponectin, ng/mL | 8352 (4724–9653) | 8746 (4514–12865) |
| TNF-α, pg/mL | 6.6 (4.4–7.8) | 6.8 (4.8–8.0) |
| IL-6, pg/mL | 1.01 (0.7–1.6) | 1.2 (0.5–2.3) |
| IL-8, pg/mL | 4.8 (4.1–6.3) | 5.4 (3.6–6.7) |
| IL-10, pg/mL | 9.4 (6.9–13.1) | 10.0 (6.0–18.0) |
HDL, high-density lipoprotein cholesterol; LDL, low-density lipoprotein cholesterol. Data are presented as mean ± SD or median (interquartile range).
P < .001.
P < .05.
Dramatic increases in ECM remodeling in both skeletal muscle and adipose tissue
To investigate whether weight gain induced alterations in the ECM of skeletal muscle and adipose tissue, we measured ECM remodeling genes associated with tissue architecture, cell adhesion and angiogenesis. We found a 4- to 30-fold increase in mRNA levels of a range of collagens (COL1, COL3, COL4, COL5, COL6) and ECM genes (Figure 1A) including secreted protein acidic and rich in cysteine (SPARC) and integrin-αX. COL3 and COL6 protein levels were unchanged (Supplemental Figure 1). These results demonstrate robust up-regulation of ECM remodeling gene expression in skeletal muscle after overfeeding. The changes in skeletal muscle ECM mRNA levels (COL1, COL3, COL4, COL5, COL6, SPARC) were highly positively associated with changes in inflammation mRNA levels (CD68, CCL2) (all P < .001, r2 = 0.8–0.9; data not shown).
Figure 1.
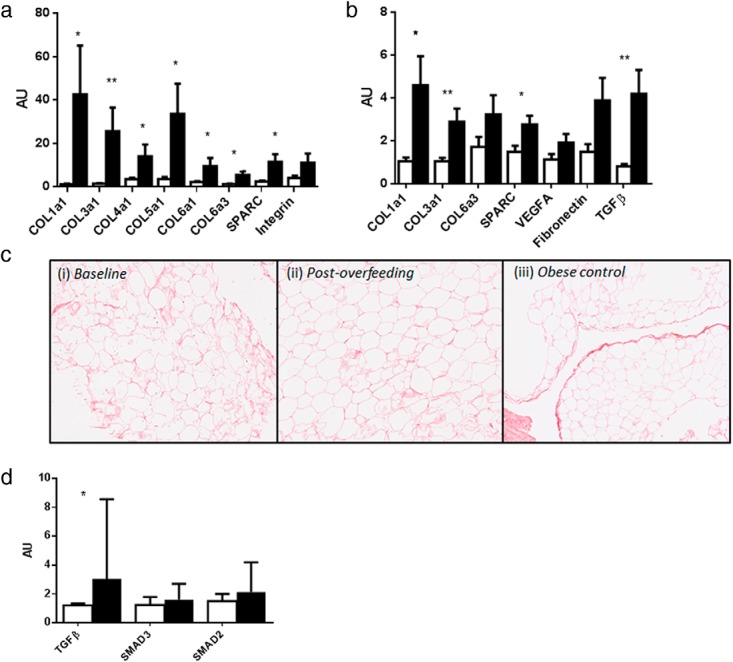
Skeletal muscle and adipose tissue ECM remodeling and fibrosis gene expression and histology before and after overfeeding. Muscle ECM remodeling mRNA levels (COL1a1, COL3a1, COL4a1, COL5a1, COL6a1, COL6a3, SPARC) were dramatically up-regulated after overfeeding. Integrin alpha X mRNA levels were unchanged (A). Similarly, in sc adipose tissue, we saw significant increases ECM remodeling genes (COL1a1, COL3a1, SPARC, TGFβ) after overfeeding (B). Picrosirius red staining for collagen in sc adipose tissue in representative samples from a male at baseline and after overfeeding and a morbidly obese positive control showed no difference in collagen staining (C). In muscle, TGFβ mRNA levels, a classical marker of fibrosis, was significantly increased after overfeeding, but there were no effects on downstream signaling of SMAD2 or SMAD3 (D). Unfilled and filled bars represent baseline and postoverfeeding values. **, P < .001; *, P < .05.
Consistent with previous studies (5), weight gain also induced significant increases in ECM remodeling (COL1, COL3, and SPARC) in sc adipose tissue (Figure 1B). Picrosirius staining for total collagen content in adipose tissue was unchanged after weight gain, potentially explained by loss of ECM architecture using the needle biopsy technique, compared with biopsy samples excised during surgery (14) (Figure 1C). We saw no evidence of pericellular fibrosis in our samples at baseline or after overfeeding. There were no significant correlations between mRNA levels of ECM markers in skeletal muscle and adipose tissue with measures of body composition and metabolic health at baseline.
Pathological markers of fibrosis in muscle
Given the striking increases in muscle ECM remodeling in response to overfeeding, we evaluated whether the TGFβ signaling pathway, the canonical pathway of fibrosis, was similarly up-regulated. After weight gain, TGFβ mRNA levels were 2-fold higher (P = .04) with a trend toward increased phosphorylated mothers against decapentaplegic (SMAD)-3, (P = .08). No differences were observed in SMAD2 expression (Figure 1D). Protein levels of muscle TGFβ were slightly decreased (P = .01), and circulating TGFβ concentrations were unchanged after overfeeding (Supplemental Figure 1). There was a positive association between the change in COL3 and TGFβ protein levels (P = .03, r2 = 0.46).
Raised inflammation in skeletal muscle but not adipose tissue after weight gain
After overfeeding, CD68 (P = .01), CCL2 (P = .02), and CD40 (P = .02) mRNA levels were 2-fold higher and nuclear factor-κB (NFκB) mRNA levels were 4-fold higher (P = .01) in skeletal muscle; there was no change in muscle TNF-α expression (Figure 2A). Inflammation, as measured by CD68, IL6, CCL2, adiponectin, NFκB, and vascular cell adhesion molecule mRNA expression levels, was unchanged in sc adipose tissue despite 10% body weight gain (Figure 2B). Supporting our gene expression data, we observed sparse numbers of CD68+ macrophages and few crown-like structures in adipose tissue before and after overfeeding (Figure 2C). Intravascular inflammation was evidenced by neutrophils located inside blood vessels in three males prior to overfeeding (Supplemental Figure 2). However, no intravascular inflammation was seen after overfeeding. As expected, sc abdominal fat cell size increased after overfeeding (0.76 ± 0.40 to1.06 ± 0.33 nL; P < .001). Circulating high-sensitivity C-reactive protein, total and high-molecular-weight adiponectin, TNF-α, IL-6, IL-8, and IL-10 concentrations were not altered by overfeeding and were detectable in 97%–100% of samples. IL-1β concentrations were not detectable at baseline or after overfeeding (Table 1). At baseline, the amount of visceral adipose tissue positively correlated with CD68 (P = .002, r2 = 0.62) and NFκb mRNA levels (P = .013, r2 = 0.54) in adipose tissue.
Figure 2.
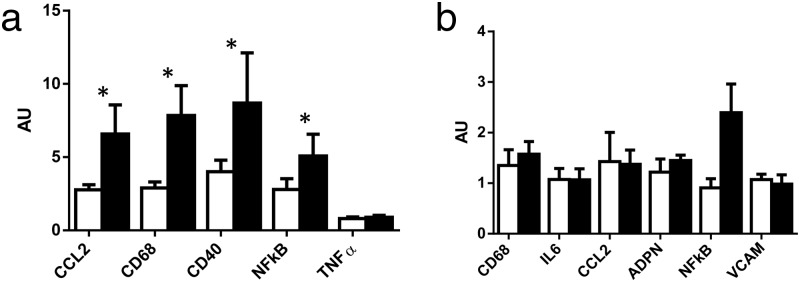
Skeletal muscle and adipose tissue inflammation gene expression before and after overfeeding. Inflammation (CD68, CCL2, CD40, NFkB) mRNA levels in vastus lateralis were significantly increased after 8 weeks of overfeeding (A) but were unchanged in sc abdominal adipose tissue (B). Unfilled and filled bars represent baseline and postoverfeeding values; *, P < .05. Light microscopy of CD68+ macrophages were located in a crown-like structure in adipose tissue. This picture is of one of the few crown-like structures observed in the current study (C).
Associations between ECM and inflammation markers at baseline and the metabolic response to overfeeding
Next, we evaluated whether baseline ECM and inflammation markers in muscle, adipose tissue or systemic circulation were associated with adverse metabolic responses with overfeeding. In skeletal muscle, baseline mRNA levels of a wide range of ECM remodeling genes (COL1, COL3, COL4, COL5, SPARC, integrin) were positively associated with the change in FFM (absolute and percentage change) after overfeeding, suggesting that skeletal muscle ECM may play a critical role during energy excess (Figure 3). Interestingly, TGFβ mRNA levels showed the inverse association. There were no associations between ECM and inflammation markers in muscle, adipose tissue, or the circulation and changes in insulin sensitivity after overfeeding.
Figure 3.

Correlations between muscle ECM gene mRNA levels prior to overfeeding and change in FFM. We saw significant associations between muscle COL1a1, COL3a1, COL4a1, COL5a1, SPARC, and integrin mRNA levels and the absolute change in FFM (kilograms).
Discussion
Our data demonstrated that rapid weight gain coupled with impaired insulin sensitivity in healthy young males (7.6 ± 2.1 kg in 8 wk) prompted robust increases in a repertoire of extracellular matrix remodeling genes in skeletal muscle and to a lesser degree in sc adipose tissue. To our knowledge, this is the first time that skeletal muscle ECM remodeling has been documented after weight gain in humans. Skeletal muscle ECM mRNA levels prior to the intervention were directly associated with the amount of FFM gained during overfeeding, highlighting the significance of skeletal muscle extracellular matrix in potentially buffering nutrient excess and maintaining energy homeostasis. Interestingly, despite this large weight gain in healthy male volunteers, there was no evidence of local adipose tissue or systemic inflammation, complementary to findings in previous overfeeding studies in humans (4, 5) and rodent models of high-fat feeding (15).
Robust increases in skeletal muscle ECM remodeling after overfeeding
The ECM is essential for tissue architecture and regulating intercellular communication. ECM accumulation leads to fibrosis in a wide variety of tissues, which may irreversibly alter the structure and function of affected tissues and whole-body homeostasis. Our data revealed robust increases in a repertoire of muscle ECM remodeling genes but little changes in classical pathways of fibrosis after weight gain, nor did we replicate our gene expression findings at the protein level. These findings suggest that ECM remodeling in muscle may be indicative of a physiological response related to short-term energy excess, as opposed to a pathological fibrotic response as seen in chronic fibrotic diseases in the liver, kidney (16), and more recently described obese adipose tissue (17).
The ECM in skeletal muscle provides an important role in muscle fiber force transmission, maintenance, and repair (18), and defects in key ECM components can lead to loss of physical function such as in muscular dystrophy conditions (19). There is growing evidence that muscle ECM remodeling has a unique role contributing to muscle insulin resistance (7–10). In high-fat fed mice with insulin resistance and higher muscle collagens III and IV, rescue of muscle insulin resistance by genetic muscle-specific catalase overexpression or pharmacological treatment reversed high-fat feeding effects on ECM remodeling, demonstrating that muscle ECM collagen expansion and muscle insulin resistance are tightly associated (9). Further mechanistic insight is provided by studies in integrin α2β1-null mice, in which the link between muscle insulin resistance and increased collagen is uncoupled (9). In addition, high muscle collagen content is characteristic of insulin-resistant muscle in obese individuals and in subjects with type 2 diabetes (8).
Interestingly, similar to adipose tissue (20–22), there appears to be a close interplay between ECM and inflammation in skeletal muscle evidenced by the significant associations between changes in gene expression of ECM remodeling genes after overfeeding and changes in inflammation genes. The evidence from our study and previous studies (9, 10) suggest a key role for muscle ECM in regulating muscle metabolism. Although we did not see associations between skeletal muscle ECM and impaired insulin sensitivity in the relatively lean and healthy males in the current study, we speculate that dysregulated muscle ECM may be another feature of the pathogenic milieu contributing to the development of insulin resistance and type 2 diabetes. Indeed, it is well known that diabetes deteriorates muscle contractibility and induces muscle atrophy, although the underlying mechanisms are unclear (23). The ability of the muscle ECM to adapt to energy excess may be a mediator influencing muscle metabolism.
Evidence of ECM remodeling but no inflammation in adipose tissue after overfeeding
In recent years, it has been well described that ECM remodeling is crucial for adipogenesis and adipose tissue growth and that excessive ECM accumulation (ie, fibrosis) is a hallmark of sc and visceral adipose tissue in obese humans (1). Furthermore, sc adipose tissue fibrosis in obese individuals persists, even after bariatric surgery-induced loss weight loss (20, 22). The importance of the ECM in regulating whole-body energy homeostasis is demonstrated by studies in COL6−/− mice, which have demonstrated uninhibited adipose tissue expansion without impaired metabolic responses when on a high-fat diet or on an ob/ob background (17). In the present study, we observed consistent increases in mRNA levels of collagens I and III, SPARC, and TGFβ, suggesting that sc adipose tissue in healthy lean males is remodeled to adapt to energy excess. Notably, despite 10% of body weight gain and decreased peripheral insulin sensitivity, we did not observe any evidence of systemic or local sc adipose tissue inflammation after overfeeding; we cannot comment on the potential influence of visceral adipose tissue.
Our results, in conjunction with findings from previous overfeeding studies in humans (4, 5, 24) and rodents (15), strongly suggest that adipose tissue inflammation may occur secondary to weight gain and insulin resistance in humans. Furthermore, our data lend support to the hypothesis that the initiation and propagation of adipose tissue low-grade inflammation may require repeated bouts of energy excess over an extended period to time to reach a critical threshold where such an inflammatory response is maintained (25). Indeed, weight cycling in mice enhances the inflammatory response in adipose tissue and in the circulation, which may contribute to metabolic dysfunction (26, 27). It may also be that adipose tissue inflammation contributes more toward the maintenance and exacerbation of insulin resistance once it is initiated (15, 28).
Strengths and limitations
A main strength of our study was the rigorously controlled feeding protocol. During the intervention, all meals were prepared by the metabolic kitchen and consumed under supervision at our research center. Second, our study used gold standard techniques for measuring insulin sensitivity (hyperinsulinemic-euglycemic clamp) and also DLW for determining energy requirements during energy balance and overfeeding. Possible limitations may be that the interpretation of our findings are limited to sc adipose tissue; the dynamics of the inflammatory and ECM response in other fat depots, particularly visceral adipose tissue, cannot be addressed in this study. Despite robust increases in mRNA levels of ECM remodeling genes in muscle, we did not see changes in protein levels of collagens 3 and 6, indicating that there could be either increased synthesis or decreased degradation by matrix metalloproteinases; this was not able to be addressed in the current study due to the small size of the muscle biopsy. Furthermore, it would be interesting to measure factors that regulate muscle growth such as myostatin, activins, and follistatin in future studies.
In conclusion, results from our overfeeding study provide unique insights into skeletal muscle and adipose tissue dynamics after 10% body weight gain in healthy, lean males. We have uncovered a novel facet of the skeletal muscle response to weight gain, demonstrating robust increases in extracellular matrix remodeling genes that are directly associated with the amount of lean tissue mass deposited during overfeeding. There is no doubt that our findings trigger many further questions and future investigations addressing the regulation and cellular composition of the muscle extracellular matrix are required to elucidate the potential significance of the skeletal muscle ECM in regulating insulin resistance and whole-body homeostasis and function.
Acknowledgments
We thank all the participants for kindly being involved in this study and Associate Professor Leonie Heilbronn for critical feedback on the manuscript.
This work was supported by National Institute of Diabetes and Digestive and Kidney Diseases Grants R01DK060412 (to E.R.), K01DK089005 (to D.L.J.), and 2P30DK072476 (to E.R.). C.S.T. is supported by a National Health and Medical Research Centre Early Career Fellowship (Grant 1037275). This work used the facilities of the Cell Biology and Bioimaging Core that are supported in part by Centers of Biomedical Research Excellence (National Institutes of Health Grant 8 P20-GM103528) and Nutrition Obesity Research Center (National Institutes of Health Grant 2P30-DK072476) center grants from the National Institutes of Health.
Disclosure Summary: The authors have nothing to disclose.
Footnotes
- BMI
- body mass index
- DLW
- doubly labeled water
- ECM
- extracellular matrix
- FFM
- fat free mass
- GIR
- glucose infusion rate
- NFκB
- nuclear factor-κB
- SMAD
- phosphorylated mothers against decapentaplegic
- SPARC
- secreted protein acidic and rich in cysteine.
References
- 1. Sun K, Tordjman J, Clement K, Scherer PE. Fibrosis and adipose tissue dysfunction. Cell Metab. 2013;18(4):470–477 [DOI] [PMC free article] [PubMed] [Google Scholar]
- 2. Cancello R, Tordjman J, Poitou C, et al. Increased infiltration of macrophages in omental adipose tissue is associated with marked hepatic lesions in morbid human obesity. Diabetes. 2006;55(6):1554–1561 [DOI] [PubMed] [Google Scholar]
- 3. Strissel KJ, Stancheva Z, Miyoshi H, et al. Adipocyte death, adipose tissue remodeling, and obesity complications. Diabetes. 2007;56(12):2910–2918 [DOI] [PubMed] [Google Scholar]
- 4. Tam CS, Viardot A, Clement K, et al. Short-term overfeeding may induce peripheral insulin resistance without altering subcutaneous adipose tissue macrophages in humans. Diabetes. 2010;59(9):2164–2170 [DOI] [PMC free article] [PubMed] [Google Scholar]
- 5. Alligier M, Meugnier E, Debard C, et al. Subcutaneous Adipose Tissue Remodeling during the Initial Phase of Weight Gain Induced by Overfeeding in Humans. J Clin Endocrinol Metab. 2011;. [DOI] [PubMed] [Google Scholar]
- 6. Tam CS, Covington JD, Ravussin E, Redman LM. Little evidence of systemic and adipose tissue inflammation in overweight individuals. Front Genet. 2012;3:58. [DOI] [PMC free article] [PubMed] [Google Scholar]
- 7. Richardson DK, Kashyap S, Bajaj M, et al. Lipid infusion decreases the expression of nuclear encoded mitochondrial genes and increases the expression of extracellular matrix genes in human skeletal muscle. J Biol Chem. 2005;280(11):10290–10297 [DOI] [PubMed] [Google Scholar]
- 8. Berria R, Wang L, Richardson DK, et al. Increased collagen content in insulin-resistant skeletal muscle. Am J Physiol Endocrinol Metab. 2006;290(3):E560–E565 [DOI] [PubMed] [Google Scholar]
- 9. Kang L, Ayala JE, Lee-Young RS, et al. Diet-induced muscle insulin resistance is associated with extracellular matrix remodeling and interaction with integrin α2β1 in mice. Diabetes. 2011;60(2):416–426 [DOI] [PMC free article] [PubMed] [Google Scholar]
- 10. Kang L, Lantier L, Kennedy A, et al. Hyaluronan accumulates with high-fat feeding and contributes to insulin resistance. Diabetes. 2013;62(6):1888–1896 [DOI] [PMC free article] [PubMed] [Google Scholar]
- 11. Redman LM, Heilbronn LK, Martin CK, et al. Metabolic and behavioral compensations in response to caloric restriction: implications for the maintenance of weight loss. PLoS ONE. 2009;4(2):e4377. [DOI] [PMC free article] [PubMed] [Google Scholar]
- 12. Lillioja S, Bogardus C. Obesity and insulin resistance: lessons learned from the Pima Indians. Diabetes Metab Rev. 1988;4(5):517–540 [DOI] [PubMed] [Google Scholar]
- 13. Heilbronn LK, Rood J, Janderova L, et al. Relationship between serum resistin concentrations and insulin resistance in nonobese, obese, and obese diabetic subjects. J Clin Endocrinol Metab. 2004;89(4):1844–1848 [DOI] [PubMed] [Google Scholar]
- 14. Mutch DM, Tordjman J, Pelloux V, et al. Needle and surgical biopsy techniques differentially affect adipose tissue gene expression profiles. Am J Clin Nutr. 2009;89(1):51–57 [DOI] [PubMed] [Google Scholar]
- 15. Turner N, Kowalski GM, Leslie SJ, et al. Distinct patterns of tissue-specific lipid accumulation during the induction of insulin resistance in mice by high-fat feeding. Diabetologia. 2013;56(7):1638–1648 [DOI] [PubMed] [Google Scholar]
- 16. Wynn TA, Ramalingam TR. Mechanisms of fibrosis: therapeutic translation for fibrotic disease. Nat Med. 2012;18(7):1028–1040 [DOI] [PMC free article] [PubMed] [Google Scholar]
- 17. Khan T, Muise ES, Iyengar P, et al. Metabolic dysregulation and adipose tissue fibrosis: role of collagen VI. Mol Cell Biol. 2009;29(6):1575–1591 [DOI] [PMC free article] [PubMed] [Google Scholar]
- 18. Gillies AR, Lieber RL. Structure and function of the skeletal muscle extracellular matrix. Muscle Nerve. 2011;44(3):318–331 [DOI] [PMC free article] [PubMed] [Google Scholar]
- 19. Rahimov F, Kunkel LM. The cell biology of disease: cellular and molecular mechanisms underlying muscular dystrophy. J Cell Biol. 2013;201(4):499–510 [DOI] [PMC free article] [PubMed] [Google Scholar]
- 20. Henegar C, Tordjman J, Achard V, et al. Adipose tissue transcriptomic signature highlights the pathological relevance of extracellular matrix in human obesity. Genome Biol. 2008;9(1):R14. [DOI] [PMC free article] [PubMed] [Google Scholar]
- 21. Spencer M, Yao-Borengasser A, Unal R, et al. Adipose tissue macrophages in insulin resistant subjects are associated with collagen VI, fibrosis and demonstrate alternative activation. Am J Physiol Endocrinol Metab. 2010;299(6):E1016–1027 [DOI] [PMC free article] [PubMed] [Google Scholar]
- 22. Divoux A, Tordjman J, Lacasa D, et al. Fibrosis in human adipose tissue: composition, distribution and link with lipid metabolism and fat mass loss. Diabetes. 2010;59(11):2817–2825 [DOI] [PMC free article] [PubMed] [Google Scholar]
- 23. Vignaud A, Ramond F, Hourde C, Keller A, Butler-Browne G, Ferry A. Diabetes provides an unfavorable environment for muscle mass and function after muscle injury in mice. Pathobiology. 2007;74(5):291–300 [DOI] [PubMed] [Google Scholar]
- 24. Cornford AS, Hinko A, Nelson RK, Barkan AL, Horowitz JF. Rapid development of systemic insulin resistance with overeating is not accompanied by robust changes in skeletal muscle glucose and lipid metabolism. Appl Physiol Nutr Metab. 2013;38(5):512–519 [DOI] [PMC free article] [PubMed] [Google Scholar]
- 25. Gregor MF, Hotamisligil GS. Inflammatory mechanisms in obesity. Annu Rev Immunol. 2011;29:415–445 [DOI] [PubMed] [Google Scholar]
- 26. Barbosa-da-Silva S, Fraulob-Aquino JC, Lopes JR, Mandarim-de-Lacerda CA, Aguila MB. Weight cycling enhances adipose tissue inflammatory responses in male mice. PLoS One. 2012;7(7):e39837. [DOI] [PMC free article] [PubMed] [Google Scholar]
- 27. Anderson EK, Gutierrez DA, Kennedy A, Hasty AH. Weight cycling increases T cell accumulation in adipose tissue and impairs systemic glucose tolerance. Diabetes. 2013;62(9):3180–3188 [DOI] [PMC free article] [PubMed] [Google Scholar]
- 28. Lee YS, Li P, Huh JY, et al. Inflammation is necessary for long-term but not short-term high-fat diet-induced insulin resistance. Diabetes. 2011;60(10):2474–2483 [DOI] [PMC free article] [PubMed] [Google Scholar]