

Summary
Deregulated expression or activity of kinases can lead to melanomas, but often the particular kinase isoform causing the effect is not well established, making identification and validation of different isoforms regulating disease development especially important. To accomplish this objective, an siRNA screen was undertaken that which identified glycogen synthase kinase 3α (GSK3α) as an important melanoma growth regulator. Melanocytes and melanoma cell lines representing various stages of melanoma tumor progression expressed both GSK3α and GSK3β, but analysis of tumors in patients with melanoma showed elevated expression of GSK3α in 72% of samples, which was not observed for GSK3β. Furthermore, 80% of tumors in patients with melanoma expressed elevated levels of catalytically active phosphorylated GSK3α (pGSK3αY279), but not phosphorylated GSK3β (pGSK3βY216). siRNA-mediated reduction in GSK3α protein levels reduced melanoma cell survival and proliferation, sensitized cells to apoptosis-inducing agents and decreased xenografted tumor development by up to 56%. Mechanistically, inhibiting GSK3α expression using siRNA or the pharmacological agent AR-A014418 arrested melanoma cells in the G0/G1 phase of the cell cycle and induced apoptotic death to retard tumorigenesis. Therefore, GSK3α is a key therapeutic target in melanoma.
Keywords: GSK3 α, GSK3 β, malignant melanoma, siRNA library screening, kinase targets
Introduction
Identification of key kinase isoforms regulating melanoma tumor development, chemoresistance and metastasis remains an important part of melanoma research (Dummer and Flaherty, 2012; Inamdar et al., 2010). Particular kinase isoforms of proteins in the MAP and PI3 kinase pathways have been identified as key therapeutic targets in melanoma cells (Cheung et al., 2008; Dummer and Flaherty, 2012; Gray-Schopfer et al., 2007; Katipamula and Markovic, 2008; Madhunapantula and Robertson, 2008, 2009; Madhunapantula et al., 2007; Sharma et al., 2005; Stahl et al., 2003, 2004). Certain kinase isoforms in these pathways can be targeted to trigger a better response or prevent resistance development (Bonet et al., 2012; Flaherty et al., 2012; Johannessen et al., 2010; Nazarian et al., 2010; Villanueva et al., 2010; Werzowa et al., 2011). However, in certain instances, it is not known which kinase isoform should be targeted, as culture conditions might have led to the activation of unnatural isoforms leading to study of the wrong protein (Eberle et al., 2010; Gazdar et al., 2010).
Expression and activity of GSK3 kinases are regulated by phosphorylation, intracellular localization and interactions with binding partner proteins (Rayasam et al., 2009). GSK3 kinases are considered oncogenic, and targeted inhibition can moderate the growth of tumor cells (Garcea et al., 2007; Luo, 2009; Naito et al., 2010; Ougolkov and Billadeau, 2006). GSK3α, one of two isoforms of glycogen synthase kinase-3, is a serine-threonine protein kinase that regulates diverse cellular processes such as cellular structure, function, proliferation and survival (Forde and Dale, 2007; Rayasam et al., 2009). Prior studies have shown that inhibition of GSK3β can sensitize melanoma cells to sorafenib-induced apoptosis (Panka et al., 2008). Inhibiting GSK3 activity using the pharmacological agent AR-A014418 reduced cell proliferation and increased apoptotic cell death in human colon cancer cells (Shakoori et al., 2007). Mechanistically, targeting GSK3 decreased cell proliferation by up-regulating p27 expression and increased apoptosis by down-modulating NFkB activity in cancer cells (Kotliarova et al., 2008; Mamaghani et al., 2009; Wang et al., 2008).
Although GSK3α and GSK3β are known to share a high degree of homology in kinase domains and perform similar functions, recent studies suggest isoform-specific roles (Ali et al., 2001; Force and Woodgett, 2009). Targeting GSK3β sensitized melanoma cells to sorafenib treatment and induced melanin production (Bellei et al., 2008; Panka et al., 2008). Use of selective GSK3β inhibitors also induced p53 expression and decreased melanoma cell proliferation rates (Smalley et al., 2007). Focal expression of GSK3β has also been reported in the invasive portions of 12 and 33% of primary and metastatic melanomas and targeted inhibition decreased cellular motility (John et al., 2012). GSK3α has also been reported to have unique roles in regulating the growth and proliferation of pancreatic cancer cells through maintenance of NFkB activity, but it has no reported role in melanoma development (Wilson and Baldwin, 2008).
Cell lines can evolve when grown in culture, and certain kinase isoforms might be activated in this environment but might not be key to the development of the cancer in humans, necessitating validation of kinase candidate isoforms in tumors derived from patients (Eberle et al., 2010; Gazdar et al., 2010; Gremel et al., 2009). siRNA-based screening can be used to identify particular kinase isoforms that might be important in the development of melanoma but requires validation in tumors from patients (Ganesan et al., 2008; Sharma et al., 2013). siRNA libraries are available for all the known kinases; and there are efficient approaches for introducing siRNA into cells with high transfection efficacy (Falschlehner et al., 2010; Iorns et al., 2009; Liu et al., 2009; Micklem and Lorens, 2007).
In this study, an siRNA kinase library was screened to identify particular kinase isoforms playing important roles in melanoma development. GSK3α, but not GSK3β, was identified as a potentially important kinase regulating melanoma development, which seemed odd because most work on melanomas had been undertaken on GSK3β in cell line-based studies (Bellei et al., 2008; Huang et al., 2007; Panka et al., 2008; Smalley et al., 2007). To confirm the initial identification of GSK3α, but not GSK3β as a target, GSK3α protein levels were examined in tumors from patients, showing 72% of patients with melanoma expressing only GSK3α, but not GSK3β. Melanoma cell lines also had higher levels of GSK3α than observed in melanocytes. Decreasing GSK3α protein levels using siRNA increased sensitivity to apoptosis-inducing agents and decreased melanoma tumor development by up to 56%. Pharmacological agents targeting GSK3 inhibited melanoma development in a manner similar to that observed when targeting GSK3α using siRNA. Thus, GSK3α should be targeted in melanomas to retard the development of this disease.
Results
siRNA kinase screen identified GSK3α as a therapeutic target in melanomas
To identify particular kinase isoforms regulating melanoma development, a stealth siRNA library consisting of a pool of three siRNAs targeting each of the 636 kinases was nucleofected into the UACC 903 melanoma cell line. After 48 h of recovery in DMEM containing 10% FBS, cells were fed with media lacking serum for an additional 3 days and viability was measured using the MTS assay. siRNA-mediated targeting of GSK3α decreased cell viability by 33.6%, while targeting GSK3β had no effect on cell viability (Figure 1A, left panel). For the secondary screen, each of the three individual siRNA targeting GSK3α in the original pool was independently nucleofected into UACC 903 cells and effect on viability was measured. Inhibition by two siRNAs was required to pass the secondary screen. SiRNAs #1 and #3 decreased viability of UACC 903 cells by 48 and 30%, respectively (Figure 1A, middle panel). In case of GSK3β, only siRNA #2 led to growth inhibition compared with scrambled siRNA and nucleofection buffer controls (Figure S1). The tertiary screen involved measuring the efficacy of GSK3α siRNAs #1 and #3 in two additional cell lines. Both siRNAs reduced viability of A375M (Figure 1A right panel) and 1205 Lu cells (data not shown). To confirm that the siRNAs were decreasing protein levels, UACC 903 cells were nucleofected with siGSK3α #1 and siGSK3α #3 and expression and activity levels evaluated by Western blotting. siRNAs specifically decreased GSK3α expression and activity without changing GSK3β protein levels (Figure 1B). siRNA #1 to GSK3β, which had no effect on cell viability (Figure S1), similarly decreased the expression and activity of that isoform without moderating GSK3α.
Figure 1.

Identification of GSK3α as a therapeutic target in melanomas. (A) siRNA kinase library screening identified GSK3α as a target in melanomas. In the primary screen, UACC 903 cells were transfected with a pool of three siRNAs targeting each kinase and cell viability measured after 3 days of growth in serum-free medium. Compared with low-, medium- and high- or untransfected controls cells, those nucleofected with the GSK3α siRNA pool had 35% fewer viable cells (A, left panel). Targeting GSK3 β had no effect on melanoma cell viability. The secondary screen testing the efficacy of individual siRNAs identified siRNA #1 and siRNA #3, as effective siRNAs for inhibiting melanoma cell growth (A, middle panel). Tertiary screen validated the efficacy of siRNA #1 and siRNA #3 in the A375M cell lines (A, right panel). (B) SiRNAs targeting GSK3α and GSK3β specifically inhibited the expression and activity of each respective protein. UACC 903 cells were transfected with siRNAs targeting GSK3α (#1 and #3) and GSK3β (#1) and cell lysates analyzed by Western blotting for the expression as well as activity of each respective protein. A significant decrease in GSK3α, GSK3β and phosphorylated GSK3α/β (pGSK3α/βY279/Y216) was observed when each target was inhibited. α-Enolase served as a control for equal protein loading. (C, D) Expression and activity of GSK3α but not GSK3β were increased in melanoma cell lines and patient tumors. Protein lysates from cell lines representing radial-, vertical- and metastatic-phase melanoma cells, and tumors (n = 39) from patients with melanoma were analyzed by Western blotting for the expression of GSK3α, GSK3β and phosphorylated GSK3α/β (pGSK3α/βY279/Y216). Levels were normalized to α-enolase using IMAGE-J software and fold increase compared with normal human melanocyte. Greater than 70% tumors expressed high GSK3α and/or phosphorylated GSK3α/β (pGSK3α/βY279/Y216).
GSK3α protein expression and activity were observed in cell lines derived from advanced-stage melanomas; and higher expression as well as activity levels was observed in tumors from patients with melanoma compared with melanocytes
As the screening results suggested, the involvement of GSK3α, but not GSK3β, in melanoma, the expression of GSK3α and GSK3β was next examined in control melanocytes (NHEM) compared with melanoma cell lines from the different stages of disease progression. Very low GSK3α protein expression was observed in normal human melanocytes, while all melanoma cells had relatively higher levels (Figure 1C). In contrast, variable levels of GSK3β were observed in the same cells with most having equal levels of protein expression to that observed in melanocytes (Figure 1C). Next, GSK3α protein expression was compared by Western blotting to GSK3β in protein lysates derived from tumor biopsies in patients with malignant and metastatic melanoma, and normalized protein expression levels were compared to those observed in melanocytes (Sharma et al., 2013). Increased levels of GSK3α protein expression were seen in 72% (28/39) of tumors removed from patients with melanoma (Figure 1D). In contrast, levels of GSK3β protein were consistently lower than those observed in melanocytes (Figure 1D, left panel). Furthermore, high levels of pGSK3α(Y279), the active form of GSK3α (Rayasam et al., 2009), was observed in 80% of tumors in patients (Figure 1D, right panel), while low levels of active GSK3β(Y216) (Rayasam et al., 2009) were seen in the same samples.
Targeting GSK3α inhibited melanoma cellular proliferation and induced apoptosis
The mechanistic basis for decreased melanoma cell survival following GSK3α inhibition was identified by measuring proliferation and apoptosis rates. siRNA #1 mediated reduction in GSK3α protein levels (Figure 2A) decreased BrdUrd incorporation by 40–75%, resulting in fewer proliferating cells (Figure 2B). Similar results were also observed with siRNA #3 (data not shown). Cell cycle analysis of propidium iodide-stained cells nucleofected with siRNAs targeting GSK3α showed a significant increase in the sub-G0-G1 cell population representing apoptotic cells and rise in the G0/G1 cell population indicating inhibition of cellular proliferation (Figure 2C, Table S1), compared with cells nucleofected with a scrambled siRNA control. A consistent decrease was also observed in the S-phase population. In contrast, siRNA-mediated reduction in GSK3β protein levels had no significant or consistent effect on the various phases of the cell cycle (Figure S2).
Figure 2.
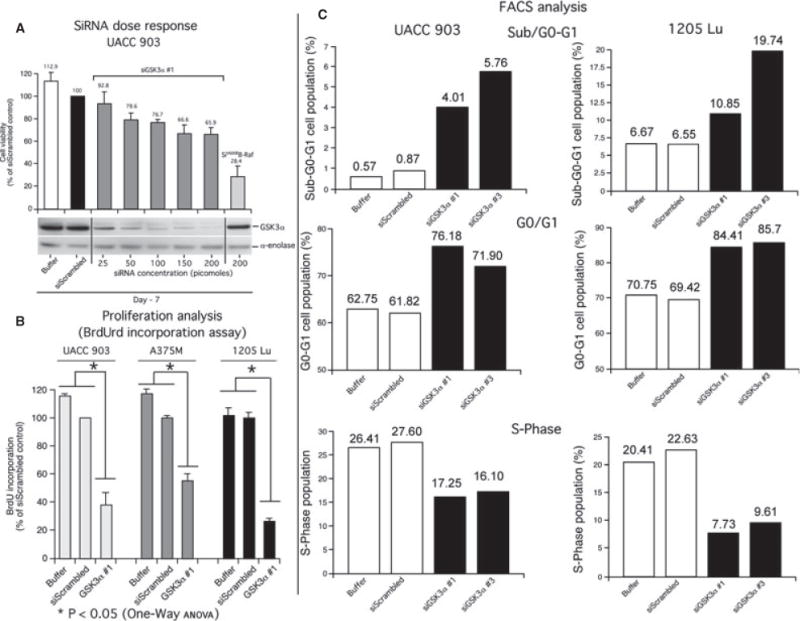
Targeting GSK3α inhibited melanoma cell growth by inducing a G0/G1 block in the cell cycle. (A) siRNA targeting GSK3α led to dose-dependent growth inhibition. UACC 903 cells were nucleofected with 25, 50, 100, 150 and 200 picomoles siRNA and 2 days later 1 × 10⁴ cells seeded in 96-well plates. Viability of cells was measured after 5 days of growth in serum-free media using MTS assay. A dose-dependent decrease in cell viability and GSK3α protein expression was observed with increasing siRNA concentration. (B, C) Targeting GSK3α reduced melanoma cell proliferation and induced apoptosis by triggering G0/G1 cell cycle arrest. Compared with siScrambled controls, UACC 903, A375M and 1205 Lu cells nucleofected with siGSK3α #1 had 40–75% fewer proliferating cells as measured by BrdUrd incorporation assay (*P < 0.05; one-way ANOVA) (B). Propidium iodide staining followed by FACS analysis of 1 × 10⁶ UACC 903 cells nucleofected with GSK3α siRNA showed an increase in the sub-G0/G1 and G0/G1 cell population compared with control scrambled siRNA (C). Results are the averages of two independent experiments. Replicate #1 & #2 values have been shown in Table S1.
Decreasing GSK3α protein levels sensitized melanoma cells to apoptosis-inducing drugs
It is unknown whether targeting GSK3α would sensitize melanoma cells to apoptosis-inducing therapeutic agents in a manner similar to when GSK3β was inhibited (Panka et al., 2008). Therefore, GSK3α protein levels were reduced using siRNA, and after 48-h recovery in DMEM containing 10% FBS, cells were exposed to staurosporine for 24 hand IC50 values measured (Madhunapantula et al., 2007, 2012; Zhang et al., 1996). Compared with control scrambled siRNA nucleofected cells, a 60% decrease in melanoma cells viability was observed when GSK3α expression was inhibited (Figure 3A). Treating these cells with 25 nM staurosporine or 12.5 μM of the Akt inhibitor ISC-4 (Nguyen et al., 2011; Sharma et al., 2009, 2011) in combination with GSK3α inhibition decreased melanoma cell growth more effectively than exposure to staurosporine alone (staurosporine treatment; white bar versus black bar) (Figure 3A). Similarly, 12.5 μM ISC-4 treatment in combination with GSK3α inhibition reduced cell viability more effectively than ISC-4 alone (ISC-4 treatment; white bar versus black bar). Western blot analysis of protein lysates collected from cells treated with 400 nM staurosporine showed elevated expression of apoptosis indicator cleaved caspase-3 only when GSK3α was inhibited (Figure 3B), suggesting that targeting GSK3α sensitized melanoma cells to staurosporine compared with control scrambled siRNA nucleofected cells.
Figure 3.

siRNAs inhibiting GSK3α sensitized melanoma cells to apoptosis-inducing agents. (A, B) Targeting GSK3α sensitized melanoma cells to staurosporine and ISC-4. 1 × 10⁶ UACC 903 cells were nucleofected with siRNAs targeting GSK3α, Akt3, GSK3β and a scrambled control. 48 h later, 1 × 10⁴ cells were seeded in to 96-well plates and treated with increasing concentrations of staurosporine. A decrease in cell viability compared with scrambled siRNA nucleofected cells was observed when GSK3α expression was inhibited (A) and killing was enhanced when GSK3α inhibited cells were also treated with 25 nM staurosporine or 12.5 μM ISC-4. Western blotting showed decreased GSK3α protein expression following siRNA treatment and increased cleaved caspase-3 levels compared with cells nucleofected with scrambled siRNA (B). (C, D) Simultaneously targeting GSK3α and Akt3 synergistically inhibited melanoma cell viability. Dose–response curves were prepared by nucleofecting increasing amounts of siRNA targeting GSK3α and Akt3 followed by measurement of cellular viability after 3 days of growth in serum-free medium (C). For combination analysis, 100 picomoles of Akt3 was combined with increasing amounts of GSK3α siRNA. CalcuSyn analysis to calculate the combination index (CI) suggested synergism between Akt3 and GSK3α when targeted together (D). The results between single and combination treatments are significant (P < 0.05; one-way ANOVA).
As inhibiting GSK3α sensitized melanoma cells to Akt inhibitor ISC-4, inhibition of GSK3α and Akt3 together was examined to determine whether it could synergistically reduce melanoma cell growth. To test this possibility, increasing amounts of siRNA targeting GSK3α were nucleofected into UACC 903 cells alone and in combination with 100 picomoles of Akt3 siRNA. Forty-eight hours after recovery in DMEM supplemented with 10% FBS, cells were seeded into a 96-well plate and 3 days later, viable cells were measured using MTS. Compared with scrambled siRNA nucleofected cells, targeting GSK3α reduced cell viability in a dose-dependent manner (Figure 3C; P < 0.05, one-way ANOVA). Targeting Akt3 alone using 100 picomoles of siRNA had no significant effect on UACC 903 anchorage-dependent growth as reported earlier (Cheung et al., 2008). However, enhanced inhibition was observed when GSK3α and Akt3 were inhibited together (Figure 3C; P < 0.05, one-way ANOVA). Analysis of reductions in cellular proliferation using CALCUSYN software (Chang and Chou, 2000), which is a program designed to assess synergy of agent combinations, showed synergism between Akt3 and GSK3α, with CI values ranging from 0.3 to 0.8 (Figure 3D).
siRNA-mediated targeting of GSK3α inhibited xenografted melanoma tumor development
As targeting GSK3α reduced melanoma cell viability, the effect on xenografted melanoma tumor development was examined next. 1205 Lu, A375M and UACC 903 cell lines were nucleofected with siRNAs targeting GSK3α protein expression, and after a 36-h recovery in DMEM supplemented with 10% FBS, cells were injected subcutaneously into the left and right flanks above the ribcage. Analysis of the duration of protein knockdown using Western blotting showed decreased GSK3α expression up to 8 days in cultured UACC 903, A375M and 1205 Lu melanoma cells (Figure 4A), which had been reported as necessary for this type of study (Madhunapantula et al., 2007; Sharma et al., 2005). Sizes of developing tumors were measured using a caliper on alternate days for up to 17.5 days. Targeting GSK3α reduced xenografted melanoma tumor development by up to 56% compared with control cells nucleofected with buffer only or scrambled siRNA (Figure 4B). Insets show decreased protein levels in the cells injected into the mice. In contrast to the inhibitory effects observed when targeting GSK3α, only siRNA#2 to GSK3β led to a reduction in tumor growth (Figure S3).
Figure 4.

SiRNA-mediated down-regulation of GSK3α inhibited xenografted melanoma tumors growth. (A, B) Targeting GSK3α using siRNA reduced protein expression and inhibited melanoma tumor growth in mice. 1 × 10⁶ UACC 903 cells nucleofected with buffer, scrambled siRNA or siRNA targeting GSK3α #1 and #3 were plated in a 100-mm culture dish and cell lysates harvested at days 2, 4, 6, 8 and 10. Western blotting showed decreased GSK3α expression up to day 8. Targeting GSK3α had no effect on GSK3β expression confirming the specificity of siRNAs (A). 1 × 10⁶ UACC 903, A375M and 1205 Lu cells were nucleofected with 100 picomoles siRNA and 36 h later subcutaneously injected into mice above left and right flanks. Compared with cells nucleofected with buffer or control scrambled siRNA, there was up to a 56% decrease in tumor growth following GSK3α inhibition (B). Only siGSK3α #1 siRNA was tested in UACC 903 cell line as similar effects were observed in the protein knockdown studies in vitro with siGSK3α #1 and siGSK3α #3. (B) Inset shows decreased GSK3α protein expression in cells injected into mice. (C) GSK3α knockdown in xenografted melanoma tumors. 6-days after cell injection into mice, tumors were removed and protein lysates analyzed by Western blotting. An up to 78% decrease in GSK3α protein expression was observed compared with scrambled siRNA transfected controls. (D, E, F) Targeting GSK3α induced apoptosis and decreased vessel development in xenografted size- and time-matched tumors. Analysis of size- and time-matched tumors for TUNEL to assess apoptosis (D) and CD31 immunohistochemical staining to assess vessel density (E) showed increase in apoptosis and decrease in vessel density when GSK3α was inhibited. No consistent changes were observed in proliferation rates (F).
Effect of targeting GSK3α on key processes regulating melanoma tumorigenesis was examined by comparing the rates of vascular development, apoptosis and proliferation in size- and time-matched xenografted tumors as reported previously (Madhunapantula et al., 2007; Sharma et al., 2005). Analysis of protein lysates derived from tumors harvested 6 days after cell injection into nude mice showed consistently decreased GSK3α protein levels compared with controls nucleofected with buffer only or scrambled siRNA (Figure 4C). Next, formaldehyde-fixed, paraffin-embedded sections of tumors were stained with TUNEL to measure apoptotic cells (Figure 4D), CD31 to assess effect on tumor vascularization (Figure 4E) and Ki67 to measure tumor cell proliferation rates (Figure 4F) (Madhunapantula et al., 2007; Sharma et al., 2005). A significant increase in TUNEL-positive cells (an indicator of apoptosis) was observed at days 6 and 8 when GSK3α expression was inhibited by siRNAs (Figure 4D). Targeting GSK3α also reduced vessel development as measured by CD31 staining (Figure 4E), suggesting a possible role in angiogenesis (Madhunapantula et al., 2007; Sharma et al., 2005). In contrast, no consistently significant differences were observed in Ki67-positive cells between control and experimental samples (Figure 4F).
Pan-GSK3α/β inhibitor AR-A014418 inhibited melanoma cell growth by decreasing cell proliferation and inducing apoptosis
To examine whether inhibiting GSK3α/β activity using pharmacological agents would reduce melanoma cell growth in a manner similar to siRNA-mediated targeting of GSK3α, A375M and UACC 903 cells were exposed to increasing concentrations of AR-A014418 (Bhat et al., 2003), a pan-GSK3α/β-specific inhibitor, and viability measured using MTS. A dose- and time-dependent decrease in melanoma cell viability was observed when treated with AR-A014418 (Figure 5A). Compared with UACC 903, A375M cells were found to be more sensitive to the AR-A014418 treatment. IC50 values for UACC 903 cells were 67, 20 and 9 μM at 48, 72 and 96 h treatment, respectively, while IC50 for A375M cells were 57 and 8 μM at 24- and 48-h treatments, respectively.
Figure 5.

Pan-GSK3α/β inhibitor AR-A014418 retards melanoma cell growth by inhibiting cell proliferation and inducing apoptosis. (A) AR-A014418 inhibited melanoma cell viability in a dose- and time-dependent manner. 5 × 10³ UACC 903 and A375Mcells were seededina96-wellplate, after 36 h exposed to increasing concentrations of AR-A014418 for 24, 48, 72 or 96 h and viability assessed by MTS assay. A time- and dose-dependent decrease in proliferation was observed. 48-h data are shown (*P < 0.05, one-way ANOVA). (B) AR-A014418 induced apoptotic cell death in melanoma cells. 1 × 10⁶ UACC 903 cells were plated in 100-mm Petri plate and treated with increasing AR-A014418 for 48, 72 or 96 h. Protein lysates were collected and analyzed by Western blotting. The data showed an increase in cleaved caspase-3 and cleaved PARP levels in cells treated with AR-A014418. (C) AR-A014418 induced G0/G1 arrest and increased the sub-G0/G1 cell population by decreasing cyclin D1 as well as increasing cleaved PARP levels. 1 × 10⁶ UACC 903 cells were treated with increasing concentrations of AR-A014418 for 48 h and stained with propidium iodide. FACS analysis showed a dose-dependent increase in sub-G0/G1 and G0/G1 cell population. Replicate #1 & #2 values have been shown in the Table S2. (D) AR-A01448 increased apoptosis in a dose-dependent manner in melanoma cells. Western blotting showed decreased phosphoglycogen synthase (pGS(S641)), a direct substrate of GSK3 kinases, levels and an increase in amounts of cleaved PARP and cleaved caspase-3.
AR-A014418 inhibited melanoma cell proliferation and induced apoptotic cell death
The mechanistic basis for inhibition of melanoma cell survival following exposure to AR-A014418 was determined by measuring the effect on apoptosis using a caspase-3/7 activity assay kit (Madhunapantula et al., 2008). A time- and dose-dependent increase in caspase-3/7 activity was observed when UACC 903 cells were exposed to AR-A014418 (Figure S4). Furthermore, apoptosis markers cleaved PARP and caspase-3 increased in both UACC 903 and A375M cells with increasing concentration of the drug and exposure time (Figure 5B). Proliferation marker cyclin-D1 also decreased with increasing drug concentration. Consistent with siRNA-mediated reduction in GSK3α protein levels, AR-A014418 treatment increased the sub-G0-G1 population, induced a G0-G1 block and decreased the percentage of cells in the S-phase (Figure 5C, Table S2). Protein lysates of AR-A014418-treated UACC 903 and A375M cells showed a decrease in phospho glycogen synthase (pGS), a direct substrate of GSK3s, and an increase in cleaved caspase-3 and PARP levels with increasing concentration of the drug(Figure 5D).
AR-A014418 inhibited xenografted melanoma tumor development
As AR-A014418 treatment inhibited cultured melanoma cell growth similar to that occurring following siRNA-mediated reduction in GSK3α protein levels, the effect of the drug on tumor development was examined next. UACC 903 melanoma cells were subcutaneously injected above the left and right ribcages, and tumor development let occur for 6 days at which point a fully vascularized tumor had developed (Madhunapantula et al., 2008). Beginning from day 7, 10 and 30 mg/Kg body weight of AR-A014418 was intraperitoneally injected on Monday, Wednesday and Friday for 3 weeks and sizes of developing tumors measured using calipers. An up to 50% reduction in tumor volume was observed at the end of treatment (Figure 6A). Measurement of body weight during the treatment showed no observable differences between drug- and control-treated groups (Figure 6B).
Figure 6.

(A, B) Intraperitoneal administration of AR-A014418 retarded xenografted melanoma tumors without systemic toxicity. 1 × 10⁶ UACC 903 cells were subcutaneously injected at left and right flanks above ribcages, and tumor development let occur for 6 days. Beginning from day 7, 10 (AR-10) or 30 (AR-30) mg/kg body weight of AR-A014418 was intraperitoneally injected on Monday, Wednesday and Friday for 3 weeks, and sizes of developing tumors measured using calipers. Up to a 50% decrease in tumor volume was observed at the end of treatment (A). Measurement of body weight during the treatment showed no differences between control DMSO vehicle treated and AR-A014418 treated groups suggesting negligible toxicity (B).
Discussion
Despite the wide variety of clinical trials testing the efficacy of various pharmacological agents alone and in combination, the incidence and mortality rates due to malignant metastatic melanoma continue to rise (Linos et al., 2009; Siegel et al., 2012; Simard et al., 2012). Knowledge about specific kinase isoforms regulating melanoma development and inhibitors to target each specifically is needed to more effectively treat melanoma (Inamdar et al., 2010; Shao and Aplin, 2010; Solit and Rosen, 2011). Furthermore, the evolution of cells in culture can lead to misleading information about particular kinase isoforms important in the development of melanoma and might contribute to the failure of pharmacological agents in the clinic (Barretina et al., 2012). This study unravels this problem for the GSK3 isoforms, suggesting that GSK3α might be an important regulator of melanoma development.
Although GSK3α and GSK3β share >80% homology in kinase domains (Kannoji et al., 2008), they can perform isoform-specific functions (Wilson and Baldwin, 2008; Darrington et al., 2012). Specifically, GSK3α predominantly regulates pancreatic cancer cell growth mediated through NFκB activity, and knocking down GSK3α protein levels using siRNA inhibited pancreatic cancer cell line growth more effectively than siRNA targeting GSK3β (Wilson and Baldwin, 2008). For GSK3β, nuclear accumulation correlated with bladder cancer progression (Naito et al., 2010). Thus, there are isoform-specific functions for each of the GSK3 isoforms that might be cell line dependent.
In this study, GSK3α was found to be the predominantly active isoform and potentially a good therapeutic target in melanomas. Inhibiting GSK3β had a negligible effect on melanoma cell growth in culture and in animals. Prior studies using pharmacological agent DW1/2 suggested that GSK3β was the important isoform target in melanoma cell lines harboring wild-type p53 (Smalley et al., 2007), but the siRNA library screen and subsequent validation studies using clinical material in this study suggest GSK3α might play a more prominent role. This discrepancy might also be due to lack of selectivity of DW1/2 for a particular GSK3 isoform compared with siRNAs, which were more specific. DW1 had an IC50 of 2 and 2.5 nM for GSK3α and GSK3β, respectively, supporting this possibility (Smalley et al., 2007). Similarly, DW2 had an IC50 of 9 and 15 nM for GSK3α and GSK3β, respectively (Smalley et al., 2007).
Protein lysates derived from tumor in patients with melanoma showed high levels of GSK3α protein expression and activity compared with GSK3β. Thus, GSK3β protein and activity levels might be an artifact of cell culture because in contrast with tumors in patient, the majority of established melanoma cell lines have been reported to have more GSK3β than GSK3α (John et al., 2012). A recent immunohistochemical analysis has also suggested expression of GSK3β in 12–33% primary and metastatic melanomas, which is difficult to explain. The expression analysis in this report was regional, compared with total protein lysate used in this study, which might account for this difference. Thus, the levels of GSK3α in these tumors might have been higher (John et al., 2012). Therefore, cell line models may not exactly replicate what is occurring in tumors in patients.
Targeting GSK3 kinases has been reported to sensitize cancer cells including melanomas to various chemotherapeutic agents (Panka et al., 2008; Rovedo et al., 2011). GSK3β activity has been suggested to protect melanoma cells from sorafenib-induced apoptosis (Panka et al., 2008). Furthermore, targeting GSK3β using pharmacological agents or siRNA has been suggested to enhance the therapeutic efficacy of sorafenib (Panka et al., 2008). Similar results were observed for GSK3α, where siRNA-mediated targeting of GSK3α, sensitized UACC 903 melanoma cells to apoptosis-inducing staurosporine and to the Akt pathway inhibitor ISC-4 (Sharma et al., 2009; Zhang et al., 2004).
GSK3 kinases regulate expression and activities of various substrates involved in cancer cell survival, apoptosis and proliferation (Luo, 2009). GSK3 has been suggested to maintain constitutive NF-κB signaling in pancreatic cancer cells by regulating IKK activity (Wilson and Baldwin, 2008). Cells treated with the GSK3 pharmacological inhibitor AR-A014418 have been shown to decrease cellular proliferation by lowering IKK activity and increasing cleaved caspase-3 levels, an indicator of apoptosis (Wilson and Baldwin, 2008). Similarly, this study shows that targeting GSK3 kinases using AR-A014418 reduced the survival of UACC 903 and A375M melanoma cells, inhibited the expression of cyclin-D1 and increased apoptosis as measured through cleaved caspase-3 and cleaved PARP levels.
The development of resistance to single targeted agents has led to the hypothesis in the melanoma field that multiple kinases would need to be targeted together to effectively inhibit melanoma development (Pacheco et al., 2011; Smalley et al., 2006). Targeting members of different signaling pathways such as Akt3 in combination with V600EB-Raf have been shown to inhibit melanoma growth in a synergistically acting manner (Cheung et al., 2008; Greger et al., 2012; Tran et al., 2008). Furthermore combined targeting of members of the same signaling pathway was more effective. For example, inhibition of V600EB-Raf in combination with MEK1/2 (Emery et al., 2009; Werzowa et al., 2011) was more effective than targeting each protein alone (Emery et al., 2009). Similarly, inhibition of PI3K together with mTOR was more effective than targeting each kinase alone (Werzowa et al., 2011). Results from this study add to the growing body of knowledge regarding synergizing combinations by suggesting that targeting Akt3 and GSK3α might be another approach to synergistically inhibit melanoma cell survival, but this would need to be confirmed in animal models and subsequently in humans.
In conclusion, this study suggests that it is the expression and activity of GSK3α that drives melanoma tumor development. Furthermore, therapeutically targeting GSK3α would effectively decrease cell proliferation and induce apoptosis to retard melanoma tumorigenesis. Therefore, an inhibitor should be developed for patients with melanoma that would only target GSK3α, which might have an advantage over a pan-GSK3 inhibitor, such as AR-A014418, by having less off-target side effects.
Methods
Cell lines and culture conditions
The human metastatic melanoma cell lines 1205 Lu, A375M and UACC 903 were maintained in DMEM (Invitrogen, Carlsbad, CA, USA) supplemented with 10% FBS (Hyclone, Logan, UT, USA) (Robertson et al., 1998). Normal human epidermal melanocytes (NHEM) and melanoma cell lines derived from radial, WM35, WM3211, and vertical, WM98.1, WM115, WM278, growth phases were maintained as described previously (Stahl et al., 2004).
siRNA library screening
A stealth select siRNA library consisting of 3 independent siRNAs for 636 known human kinases was procured from Invitrogen Corporation. siRNAs targeting each kinase were supplied at a 20 μM concentration in DEPC water along with positive p53 and negative high, medium and low GC siRNA controls. A fluorescent siRNA transfection control was also provided to measure transfection efficiency. Additionally, each siRNA plate contains seven wells for user-defined controls (untransfected cells and cells transfected with mutant V600EB-Raf).
The screen consisted of primary, secondary and tertiary steps followed by hit validation in culture and in animal models of the disease. For each screening step, nucleofected cells were allowed to recover in DMEM supplemented with 10% FBS for 2 days, which was then replaced with DMEM lacking serum for an additional 3 days. The viability of transfected cells was determined by MTS assay and percentage decrease compared with controls nucleofected with high, medium and low calculated GC siRNAs. No significant differences were found between high, medium and low GC siRNA controls.
In the primary screen, a pool of 3 independent siRNAs for each target was transfected into UACC 903 cells using Amaxa 96-well shuttle system, CM-130 program and solution SF. These were optimal conditions for UACC 903 cells as the transfection efficiency was >90% with minimal cell death (<10% assessed by MTS assay). Hits were identified by determining the Z’ factor, a measure of statistical difference used in screening assays to judge and to identify potential hits (Birmingham et al., 2009).
Hits identified in the primary screen were subjected to a secondary screen, in which individual siRNAs were transfected into UACC 903 cells using Amaxa nucleofector-I, K-17 program and Reagent-R. In the tertiary screen, efficacy of siRNA targeting a particular gene for inhibiting melanoma survival was tested in melanoma cell lines A375M and 1205 Lu. A kinase was considered as a hit only if two independent siRNAs yielded similar effects on cellular viability.
siRNA protein knockdown studies
To determine the effect of siRNA on knockdown of the expression of the targeted protein and on cellular viability, increasing amounts of siRNA (50–200 pmol) were introduced into 1 × 10⁶ A375M, 1205 Lu or UACC 903 cells via nucleofection with an Amaxa Nucleofector using Solution R/program A-23 or program K-17, respectively. To demonstrate duration of siRNA-mediated protein knockdown, A375M, 1205 Lu and UACC 903 cells were nucleofected with 100 picomoles siRNA and protein lysates harvested at days 2, 4, 6, 8 and 10 for Western blot analysis. Cells nucleofected with a scrambled siRNA, served as control. α-Enolase served as a control for equal protein loading. Duplexed Stealth siRNA (Invitrogen) were used for these studies. The siRNA sequences used were as follows:
GSK3α #1 – CCA AGG CCA AGU UGA CCA UCC CUA U;
GSK3α #2 – GGA GUU CAA GUU CCC UCA GAU UAA A;
GSK3α #3 – CCA GGG AAC UAG UCG CCA UCA AGA A;
GSK3β #1 – CCG AGG AGA ACC CAA UGU UUC GUA U;
GSK3β #2 – GCU CCA GAU CAU GAG AAA GCU AGA U;
GSK3β #3 – GCU GUU ACU AGG ACA ACC AAU AUU U;
AKT3 – GGA CUA UCU ACA UUC CGG AAA GAU U;
V600EB-RAF – AUC GAG AUU UCU CUG UAG CUA GAC C;
SCRAMBLED – AAU UCU CCG AAC GUG UCA CGU GAG A.
Anchorage-independent growth studies
For anchorage-independent cellular growth studies, 200 pmoles of siRNA against GSK3α #1, GSK3α #2, GSK3α #3, GSK3β #1 GSK3β #2 or control siScrambled or mutant V600EB-Raf (a positive control) were nucleofected into UACC 903 cells and replated in DMEM supplemented with 10% FBS. Forty-eight hours later, cells were trypsinized and plated into polyHEMA coated 96-well plates at a density of 1 × 10⁴ cells/well in 100 μl serum-free media. Number of viable cells after 3 days of growth in serum-free media was determined by MTS assay (Promega, Madison, WI, USA). For Western blot analysis, 1 × 10⁶ cells were grown in serum-free media for 3 days after nucleofection and protein lysates collected as detailed above. Protein lysates obtained from buffer and scramble siRNA nucleofected cells served as controls.
Synergy studies
Synergy between GSK3α and Akt3 was determined as detailed previously (Cheung et al., 2008). Experimentally, 50 and 100 picomoles siRNA targeting Akt3 was introduced into 1 × 10⁶ cells alone or in combination with 25, 50 or 100 picomoles of GSK3α siRNA and 48 h later, and 1 × 10⁴ cells/well in 100 μl serum-free media were plated in to 96-well plates with eight replicate wells for each siRNA and for each control treatment. Cells transfected with 25, 50 and 100 picomoles siRNA targeting GSK3α or 200 picomoles scrambled siRNA were used as controls. After 72-h growth in serum-free medium, viability of cells was measured using MTS assay and percentage decrease in viability compared with scrambled siRNA calculated. The data were subjected to synergy analysis using CALCUSYN software and combination index (CI) values plotted against fraction affected.
Pharmacological inhibition of GSK3 activity
Activity of GSK proteins was inhibited in A375M and UACC 903 cells by treating them with 10–100 μM AR-A014418 (Sigma-Aldrich, St. Louis, MO, USA) for 24, 48, 72, 96 and 120 h. Dose–response curves at each time point were prepared and IC50 values determined using GraphPad Prism.
Measurement of cell viability, proliferation and apoptosis rates
To measure viability, apoptosis and proliferation rates of cells nucleofected with siRNAs or treated with pharmacological agent AR-A014418, the MTS, Apo-ONE homogeneous caspase-3/7 assay (Promega) and BrdU (Roche, Manheim, Germany) kits were used (Madhunapantula et al., 2007, 2008). In brief, to the growing cells (5 × 10³ for drug treatment or 20 × 104 for siRNA experiments), an aliquot of MTS-PMS (20:1) mix was added, incubated for 2–4 h before reading the developed color at 492 nm to measure cell viability. To measure cell proliferation rates, cells were treated with BrdU reagent for 4 h and the labeled cells quantified using an HRP conjugated anti-BrdU antibody. The percentage of cells undergoing apoptosis was measured by incubating with 100 μl of Apo-ONE Caspase-3/7 substrate (Z-DEVD-Rhodamine 110, diluted 100 times in Apo-ONE Caspase-3/7 buffer) for 4 h, followed by measuring the released Rhodamine-110 in a SPECTRA max M2 plate reader operating with SOFT MAX PRO version 5 software (Molecular Devices Corporation, Sunnyvale, CA, USA) at an excitation wavelength of 485 nm and an emission wavelength of 520 nm. Results were expressed as relative fluorescent units (RFU). Cells treated with vehicle DMSO control and transfected with DEPC water or a scrambled siRNA served as controls for drug and siRNA treatment experiments, respectively.
Cell cycle analysis by FACS
The effect of inhibiting GSK3α and GSK3β expression or activity using siRNAs or by treating with AR-A014418 compound on the distribution of cells in sub-G0-G1, G0-G1, S and G2-M phases of cell cycle was determined using FACS analysis (Krishan, 1975). In brief, 1.5 × 10⁶ 1205Lu, UACC 903 and A375M cells were either transfected with siRNAs targeting GSK3α and GSK3β or treated with AR-A014418 for 48–96 h. The treated cells were stained with propidium iodide staining solution for 30 m on ice and analyzed by FACS. Percentage cells in each phase of the cell cycle stage were compared to control cells that were either transfected with a scrambled siRNA or exposed to vehicle DMSO. For replicate analysis data, please refer Tables S1 and S2.
Western blot analysis
For Western blot analysis, cell lysates were collected by addition of lysis buffer containing 50 mM HEPES (pH 7.5), 150 mM NaCl, 10 mM EDTA, 10% glycerol, 1% Triton X-100, 1 mM sodium orthovanadate, 0.1 mM sodium molybdate, 1 mM phenylmethylsulfonyl fluoride, 20 μg/ml aprotinin and 5 μg/ml leupeptin. Whole-cell lysates were centrifuged (≥10 000 g) for 10 m at 4°C to remove cell debris. Protein concentrations were quantitated using the BCA assay from Pierce (Rockford, IL, USA), and 30 μg of lysate loaded per lane onto NuPage Gels from Life Technologies, Inc. (Carlsbad, CA, USA). Following electrophoresis, samples were transferred to polyvinylidene difluoride membrane (Pall Corporation, Pensacola, FL, USA). The blots were probed with antibodies according to each supplier’s recommendations: antibodies to GSK3α, GSK3β, phosphorylated-GSK3α/β, phosphorylated-Erk 1/2, cleaved PARP, caspase-3 (that detects uncleaved and cleaved fragments of caspase-3) from Cell Signaling Technology (Danvers, MA, USA). Antibodies to cyclin D1, p27, Erk2 and α-enolase were obtained from Santa Cruz Biotechnology (Santa Cruz, CA, USA). Secondary antibodies conjugated with horseradish peroxidase were obtained from Santa Cruz Biotechnology. Immunoblots were developed using the enhanced chemiluminescence detection system (Amersham Pharmacia Biotech, Piscataway, NJ, USA).
Studies involving human melanoma tumors
Melanomas from human patients were collected according to protocols approved by the Penn State Human Subjects Protection Office and Cooperative Human Tissue Network. Protein lysates were extracted from tumors containing >50% tumor material and <5% necrosis as detailed previously (Huh et al., 2010; Madhunapantula et al., 2007; Stahl et al., 2004) and analyzed by Western blotting to measure levels of GSK3α, GSK3β and phosphorylated GSK3α/β(Y279/Y216), an indicator of GSK3 kinase activity. Protein levels were normalized to α-enolase expression and three independent blots quantified using IMAGE-J to establish the average levels of expression.
Therapeutic sensitivity assessments using staurosporine, and ISC-4
UACC 903 cells (1 × 10⁶) were nucleofected with 200 picomoles of a control scrambled siRNA or siRNAs targeting GSK3α #1 or GSK3β #1. After 2 days of recovery, 5 × 10³ cells were plated in 100 μl DMEM supplemented with 10% FBS in 96-well plates. Forty-eight hours later, cells were treated with 10nM to 1 μM of staurosporine (BIOMOL International, Plymouth Meeting, PA, USA), or 0.62–50 μM SC-4 for 24 h (Madhunapantula et al., 2007; Sharma et al., 2009). Number of viable cells was estimated by MTS assay, and IC50 values compared to scrambled control siRNA or DMSO-treated cells.
Additionally, 1 × 10⁶ UACC 903 cells nucleofected with 200 picomoles of a control scrambled siRNA or siRNAs targeting, GSK3α #1 or GSK3β #1 were exposed to 0.4 μM staurosporine or DMSO vehicle for 4 h and proteins harvested for Western blotting to measure levels of apoptosis markers cleaved caspase-3 and PARP (Madhunapantula et al., 2007; Stahl et al., 2003).
Tumorigenicity assessments and measurement of rates of proliferation, apoptosis and vascular development in size- and time-matched tumors
Animal experimentation was performed according to protocols approved by the Institutional Animal Care and Use Committee at The Pennsylvania State University College of Medicine. Tumor kinetics were measured by subcutaneous injection of 1 × 10⁶ 1205Lu, A375M and UACC 903 cells nucleofected with siScrambled, siGSK3α #1, siGSK3α #3, siGSK3β #1, siGSK3β #2 in 0.2 ml of DMEM supplemented with 10% FBS above both left and right rib cage of 4- to 6-week-old female nude mice (Harlan Sprague Dawley, Indianapolis, IN, USA). Dimensions of developing tumors were measured using calipers on alternate days up to day 17.5. To measure siRNA-mediated knockdown of protein expression and determine the mechanistic basis of tumor reduction, 5 × 10⁶ UACC 903 cells nucleofected with a scrambled siRNA, or 10 × 106 cells nucleofected with siGSK3α #1, siGSK3α #3 were subcutaneously injected into nude mice. Six and eight days later, tumors were removed from euthanized mice, flash-frozen in liquid nitrogen and pulverized and protein lysates collected by the addition of 600–800 μl of protein lysis buffer [50 mM Tris-HCl, pH 7.5 containing 0.1% Triton X-100, 1 mM EDTA, 1 mM EGTA, 50 mM sodium fluoride, 10 mM sodium β-glycerol phosphate, 5 mM sodium pyrophosphate, 1 mM activated sodium orthovanadate, protease inhibitor cocktail from Sigma and 0.1% (v/v) 2-mercaptoethanol]. Protein lysates were quantitated using Bio-Rad protein assay reagent (Bio-Rad laboratories, Hercules, CA, USA) followed by Western blotting to measure levels of siGSK3α protein in tumors. For mechanistic studies, size- and time-matched tumors were harvested 6 and 8 days after cell injection. Changes in cellular proliferation and apoptosis rates were assessed in formalin-fixed, paraffin-embedded tumor sections using a purified mouse anti-human Ki-67 antibody from PharMingen (San Diego, CA, USA) and the TUNEL TMR Red Apoptosis kit from Roche (Manheim, Germany), respectively (Stahl et al., 2003, 2004). Additionally, the area occupied by blood vessels was measured by immunohistochemical analysis following CD31 antibody staining. A minimum of six different tumors with 4–6 fields per tumor was analyzed and results represented as the average ± SEM.
Statistical analysis
Statistical analysis was undertaken using the one-way and two-way ANOVA followed by Tukey’s or Bonferroni’s post hoc tests for the groupwise comparisons. Z-score analysis was performed to identify the potential hits in the siRNA screen (Birmingham et al., 2009).
Supplementary Material
Figure S1. Efficacy of individual siRNAs for inhibiting GSK3β protein levels in melanomas.
Figure S2. SiGSK3β had a negligible and inconsistent effect on the cell cycle of 1205 Lu cells.
Figure S3. Targeting GSK3β using siRNA #2 but not siRNA #1 inhibited xenografted tumor development.
Figure S4. AR-A014418 induced caspase-3/7 activity in melanoma cells.
Table S1. Targeting GSK3α inhibited melanoma cell growth by inducing a G0/G1 block in the cell cycle.
Table S2. Pan-GSK3α/β inhibitor AR-A014418 retards melanoma cell growth by inducing G0/G1 arrest and increasing the sub-G0/G1 cell population.
Significance.
Perhaps the development of more effective targeted therapeutics require identification of particular kinase isoforms regulating melanoma and an efficient approach to specifically inhibit them. To accomplish this objective, an siRNA kinase library was screened to identify particular kinase isoforms playing an important role in melanoma, which led to the discovery of GSK3α as a more prominent target than GSK3β. Elevated expression of catalytically active phosphorylated GSK3α was observed in tumors in patients with melanoma, and inhibition significantly decreased tumor development. Thus, the development of inhibitors that would specifically target GSK3α, but not GSK3β, might have significant clinical impact with fewer potential off-target side effects.
Acknowledgments
Grant support from NIH (R01 CA-136667-02, R01 CA-1138634-02 and R01CA127892-05), The Foreman Foundation for Melanoma Research (to Gavin P. Robertson), R03 - CA-142060-2 (to Arati Sharma), Geltrude Foundation, Encin Foundation, and Melanoma Research Foundation (to SubbaRao V. Madhunapantula) are acknowledged.
Footnotes
Additional Supporting Information may be found in the online version of this article
References
- Ali A, Hoeflich KP, Woodgett JR. Glycogen synthase kinase-3: properties, functions, and regulation. Chem Rev. 2001;101:2527–2540. doi: 10.1021/cr000110o. [DOI] [PubMed] [Google Scholar]
- Barretina J, Caponigro G, Stransky N, et al. The Cancer Cell Line Encyclopedia enables predictive modelling of anticancer drug sensitivity. Nature. 2012;483:603–607. doi: 10.1038/nature11003. [DOI] [PMC free article] [PubMed] [Google Scholar]
- Bellei B, Flori E, Izzo E, Maresca V, Picardo M. GSK3beta inhibition promotes melanogenesis in mouse B16 melanoma cells and normal human melanocytes. Cell Signal. 2008;20:1750–1761. doi: 10.1016/j.cellsig.2008.06.001. [DOI] [PubMed] [Google Scholar]
- Bhat R, Xue Y, Berg S, et al. Structural insights and biological effects of glycogen synthase kinase 3-specific inhibitor AR-A014418. J Biol Chem. 2003;278:45937–45945. doi: 10.1074/jbc.M306268200. [DOI] [PubMed] [Google Scholar]
- Birmingham A, Selfors LM, Forster T, et al. Statistical methods for analysis of high-throughput RNA interference screens. Nat Methods. 2009;6:569–575. doi: 10.1038/nmeth.1351. [DOI] [PMC free article] [PubMed] [Google Scholar]
- Bonet C, Giuliano S, Ohanna M, Bille K, Allegra M, Lacour JP, Bahadoran P, Rocchi S, Ballotti R, Bertolotto C. Aurora B is regulated by the mitogen-activated protein kinase/extracellular signal-regulated kinase (MAPK/ERK) signaling pathway and is a valuable potential target in melanoma cells. J Biol Chem. 2012;287:29887–29898. doi: 10.1074/jbc.M112.371682. [DOI] [PMC free article] [PubMed] [Google Scholar]
- Chang TT, Chou TC. Rational approach to the clinical protocol design for drug combinations: a review. Acta Paediatr Taiwan. 2000;41:294–302. [PubMed] [Google Scholar]
- Cheung M, Sharma A, Madhunapantula SV, Robertson GP. Akt3 and mutant V600E B-Raf cooperate to promote early melanoma development. Cancer Res. 2008;68:3429–3439. doi: 10.1158/0008-5472.CAN-07-5867. [DOI] [PMC free article] [PubMed] [Google Scholar]
- Darrington RS, Campa VM, Walker MM, Bengoa-Vergniory N, Gorrono-Etxebarria I, Uysal-Onganer P, Kawano Y, Waxman J, Kypta RM. Distinct expression and activity of GSK-3alpha and GSK-3beta in prostate cancer. Int J Caner. 2012;131:E872–883. doi: 10.1002/ijc.27620. [DOI] [PubMed] [Google Scholar]
- Dummer R, Flaherty KT. Resistance patterns with tyrosine kinase inhibitors in melanoma: new insights. Curr Opin Oncol. 2012;24:150–154. doi: 10.1097/CCO.0b013e32834fca92. [DOI] [PubMed] [Google Scholar]
- Eberle J, Spangler B, Becker JC, et al. Multicentre study on standardisation of melanoma cell culture–an initiative of the German Melanoma Research Network. Pigment Cell Melanoma Res. 2010;23:296–298. doi: 10.1111/j.1755-148X.2010.00684.x. [DOI] [PubMed] [Google Scholar]
- Emery CM, Vijayendran KG, Zipser MC, et al. MEK1 mutations confer resistance to MEK and B-RAF inhibition. Proc Natl Acad Sci USA. 2009;106:20411–20416. doi: 10.1073/pnas.0905833106. [DOI] [PMC free article] [PubMed] [Google Scholar]
- Falschlehner C, Steinbrink S, Erdmann G, Boutros M. High-throughput RNAi screening to dissect cellular pathways: a how-to guide. Biotechnol J. 2010;5:368–376. doi: 10.1002/biot.200900277. [DOI] [PubMed] [Google Scholar]
- Flaherty KT, Infante JR, Daud A, et al. Combined BRAF and MEK inhibition in melanoma with BRAF V600 mutations. N Engl J Med. 2012;367:1694–1703. doi: 10.1056/NEJMoa1210093. [DOI] [PMC free article] [PubMed] [Google Scholar]
- Force T, Woodgett JR. Unique and overlapping functions of GSK-3 isoforms in cell differentiation and proliferation and cardiovascular development. J Biol Chem. 2009;284:9643–9647. doi: 10.1074/jbc.R800077200. [DOI] [PMC free article] [PubMed] [Google Scholar]
- Forde JE, Dale TC. Glycogen synthase kinase 3: a key regulator of cellular fate. Cell Mol Life Sci. 2007;64:1930–1944. doi: 10.1007/s00018-007-7045-7. [DOI] [PMC free article] [PubMed] [Google Scholar]
- Ganesan AK, Ho H, Bodemann B, et al. Genome-wide siRNA-based functional genomics of pigmentation identifies novel genes and pathways that impact melanogenesis in human cells. PLoS Genet. 2008;4:e1000298. doi: 10.1371/journal.pgen.1000298. [DOI] [PMC free article] [PubMed] [Google Scholar]
- Garcea G, Manson MM, Neal CP, Pattenden CJ, Sutton CD, Dennison AR, Berry DP. Glycogen synthase kinase-3 beta; a new target in pancreatic cancer? Curr Cancer Drug Targets. 2007;7:209–215. doi: 10.2174/156800907780618266. [DOI] [PubMed] [Google Scholar]
- Gazdar AF, Gao B, Minna JD. Lung cancer cell lines: useless artifacts or invaluable tools for medical science? Lung Cancer. 2010;68:309–318. doi: 10.1016/j.lungcan.2009.12.005. [DOI] [PMC free article] [PubMed] [Google Scholar]
- Gray-Schopfer V, Wellbrock C, Marais R. Melanoma biology and new targeted therapy. Nature. 2007;445:851–857. doi: 10.1038/nature05661. [DOI] [PubMed] [Google Scholar]
- Greger JG, Eastman SD, Zhang V, Bleam MR, Hughes AM, Smitheman KN, Dickerson SH, Laquerre SG, Liu L, Gilmer TM. Combinations of BRAF, MEK, and PI3K/mTOR inhibitors overcome acquired resistance to the BRAF inhibitor GSK2118436 dabrafenib, mediated by NRAS or MEK mutations. Mol Cancer Ther. 2012;11:909–920. doi: 10.1158/1535-7163.MCT-11-0989. [DOI] [PubMed] [Google Scholar]
- Gremel G, Rafferty M, Lau TY, Gallagher WM. Identification and functional validation of therapeutic targets for malignant melanoma. Crit Rev Oncol Hematol. 2009;72:194–214. doi: 10.1016/j.critrevonc.2009.02.004. [DOI] [PubMed] [Google Scholar]
- Huang W, Chang HY, Fei T, Wu H, Chen YG. GSK3 beta mediates suppression of cyclin D2 expression by tumor suppressor PTEN. Oncogene. 2007;26:2471–2482. doi: 10.1038/sj.onc.1210033. [DOI] [PubMed] [Google Scholar]
- Huh SJ, Chen YL, Friedman SL, Liao J, Huang HJ, Cavenee WK, Robertson GP. KLF6 Gene and early melanoma development in a collagen I-rich extracellular environment. J Natl Cancer Inst. 2010;102:1131–1147. doi: 10.1093/jnci/djq218. [DOI] [PMC free article] [PubMed] [Google Scholar]
- Inamdar GS, Madhunapantula SV, Robertson GP. Targeting the MAPK pathway in melanoma: why some approaches succeed and other fail. Biochem Pharmacol. 2010;80:624–637. doi: 10.1016/j.bcp.2010.04.029. [DOI] [PMC free article] [PubMed] [Google Scholar]
- Iorns E, Lord CJ, Ashworth A. Parallel RNAi and compound screens identify the PDK1 pathway as a target for tamoxifen sensitization. Biochem J. 2009;417:361–370. doi: 10.1042/BJ20081682. [DOI] [PubMed] [Google Scholar]
- Johannessen CM, Boehm JS, Kim SY, et al. COT drives resistance to RAF inhibition through MAP kinase pathway reactivation. Nature. 2010;468:968–972. doi: 10.1038/nature09627. [DOI] [PMC free article] [PubMed] [Google Scholar]
- John JK, Paraiso KH, Rebecca VW, et al. GSK3beta inhibition blocks melanoma cell/host interactions by downregulating N-cadherin expression and decreasing FAK phosphorylation. J Invest Dermatol. 2012;132:2818–2827. doi: 10.1038/jid.2012.237. [DOI] [PMC free article] [PubMed] [Google Scholar]
- Kannoji A, Phukan S, Sudher Babu V, Balaji VN. GSK3beta: a master switch and a promising target. Expert Opin Ther Targets. 2008;12:1443–1455. doi: 10.1517/14728222.12.11.1443. [DOI] [PubMed] [Google Scholar]
- Katipamula R, Markovic SN. Emerging therapies for melanoma. Expert Rev Anticancer Ther. 2008;8:553–560. doi: 10.1586/14737140.8.4.553. [DOI] [PubMed] [Google Scholar]
- Kotliarova S, Pastorino S, Kovell LC, et al. Glycogen synthase kinase-3 inhibition induces glioma cell death through c-MYC, nuclear factor-kappaB, and glucose regulation. Cancer Res. 2008;68:6643–6651. doi: 10.1158/0008-5472.CAN-08-0850. [DOI] [PMC free article] [PubMed] [Google Scholar]
- Krishan A. Rapid flow cytofluorometric analysis of mammalian cell cycle by propidium iodide staining. J Cell Biol. 1975;66:188–193. doi: 10.1083/jcb.66.1.188. [DOI] [PMC free article] [PubMed] [Google Scholar]
- Linos E, Swetter SM, Cockburn MG, Colditz GA, Clarke CA. Increasing burden of melanoma in the United States. J Invest Dermatol. 2009;129:1666–1674. doi: 10.1038/jid.2008.423. [DOI] [PMC free article] [PubMed] [Google Scholar]
- Liu C, Zhao G, Liu J, Ma N, Chivukula P, Perelman L, Okada K, Chen Z, Gough D, Yu L. Novel biodegradable lipid nano complex for siRNA delivery significantly improving the chemosensitivity of human colon cancer stem cells to paclitaxel. J Control Release. 2009;140:277–283. doi: 10.1016/j.jconrel.2009.08.013. [DOI] [PubMed] [Google Scholar]
- Luo J. Glycogen synthase kinase 3beta (GSK3beta) in tumorigenesis and cancer chemotherapy. Cancer Lett. 2009;273:194–200. doi: 10.1016/j.canlet.2008.05.045. [DOI] [PMC free article] [PubMed] [Google Scholar]
- Madhunapantula SV, Robertson GP. Is B-Raf a good therapeutic target for melanoma and other malignancies? Cancer Res. 2008;68:5–8. doi: 10.1158/0008-5472.CAN-07-2038. [DOI] [PubMed] [Google Scholar]
- Madhunapantula SV, Robertson GP. The PTEN-AKT3 signaling cascade as a therapeutic target in melanoma. Pigment Cell Melanoma Res. 2009;22:400–419. doi: 10.1111/j.1755-148X.2009.00585.x. [DOI] [PMC free article] [PubMed] [Google Scholar]
- Madhunapantula SV, Sharma A, Robertson GP. PRAS40 deregulates apoptosis in malignant melanoma. Cancer Res. 2007;67:3626–3636. doi: 10.1158/0008-5472.CAN-06-4234. [DOI] [PubMed] [Google Scholar]
- Madhunapantula SV, Desai D, Sharma A, Huh S, Amin S, Robertson GP. PBIse, a novel selenium containing drug for the treatment of malignant melanoma. Mol Cancer Ther. 2008;7:1297–1308. doi: 10.1158/1535-7163.MCT-07-2267. [DOI] [PubMed] [Google Scholar]
- Madhunapantula SV, Hengst J, Gowda R, Fox TE, Yun JK, Robertson GP. Targeting sphingosine kinase-1 to inhibit melanoma. Pigment Cell Melanoma Res. 2012;25:259–274. doi: 10.1111/j.1755-148X.2012.00970.x. [DOI] [PMC free article] [PubMed] [Google Scholar]
- Mamaghani S, Patel S, Hedley DW. Glycogen synthase kinase-3 inhibition disrupts nuclear factor-kappaB activity in pancreatic cancer, but fails to sensitize to gemcitabine chemotherapy. BMC Cancer. 2009;9:132. doi: 10.1186/1471-2407-9-132. [DOI] [PMC free article] [PubMed] [Google Scholar]
- Micklem DR, Lorens JB. RNAi screening for therapeutic targets in human malignancies. Curr Pharm Biotechnol. 2007;8:337–343. doi: 10.2174/138920107783018426. [DOI] [PubMed] [Google Scholar]
- Naito S, Bilim V, Yuuki K, Ugolkov A, Motoyama T, Nagaoka A, Kato T, Tomita Y. Glycogen synthase kinase-3-beta: a prognostic marker and a potential therapeutic target in human bladder cancer. Clin Cancer Res. 2010;16:5124–5132. doi: 10.1158/1078-0432.CCR-10-0275. [DOI] [PubMed] [Google Scholar]
- Nazarian R, Shi H, Wang Q, et al. Melanomas acquire resistance to B-RAF(V600E) inhibition by RTK or N-RAS upregulation. Nature. 2010;468:973–977. doi: 10.1038/nature09626. [DOI] [PMC free article] [PubMed] [Google Scholar]
- Nguyen N, Sharma A, Sharma AK, Desai D, Huh SJ, Amin S, Meyers C, Robertson GP. Melanoma chemoprevention in skin reconstructs and mouse xenografts using isoselenocyanate-4. Cancer Prev Res (Phila) 2011;4:248–258. doi: 10.1158/1940-6207.CAPR-10-0106. [DOI] [PMC free article] [PubMed] [Google Scholar]
- Ougolkov AV, Billadeau DD. Targeting GSK-3: a promising approach for cancer therapy? Future Oncol. 2006;2:91–100. doi: 10.2217/14796694.2.1.91. [DOI] [PubMed] [Google Scholar]
- Pacheco I, Buzea C, Tron V. Towards new therapeutic approaches for malignant melanoma. Expert Rev Mol Med. 2011;13:e33. doi: 10.1017/S146239941100202X. [DOI] [PubMed] [Google Scholar]
- Panka DJ, Cho DC, Atkins MB, Mier JW. GSK-3beta inhibition enhances sorafenib-induced apoptosis in melanoma cell lines. J Biol Chem. 2008;283:726–732. doi: 10.1074/jbc.M705343200. [DOI] [PubMed] [Google Scholar]
- Rayasam GV, Tulasi VK, Sodhi R, Davis JA, Ray A. Glycogen synthase kinase 3: more than a namesake. Br J Pharmacol. 2009;156:885–898. doi: 10.1111/j.1476-5381.2008.00085.x. [DOI] [PMC free article] [PubMed] [Google Scholar]
- Robertson GP, Furnari FB, Miele ME, Glendening MJ, Welch DR, Fountain JW, Lugo TG, Huang HJ, Cavenee WK. In vitro loss of heterozygosity targets the PTEN/MMAC1 gene in melanoma. Proc Natl Acad Sci USA. 1998;95:9418–9423. doi: 10.1073/pnas.95.16.9418. [DOI] [PMC free article] [PubMed] [Google Scholar]
- Rovedo MA, Krett NL, Rosen ST. Inhibition of glycogen synthase kinase-3 increases the cytotoxicity of enzastaurin. J Invest Dermatol. 2011;131:1442–1449. doi: 10.1038/jid.2011.70. [DOI] [PMC free article] [PubMed] [Google Scholar]
- Shakoori A, Mai W, Miyashita K, Yasumoto K, Takahashi Y, Ooi A, Kawakami K, Minamoto T. Inhibition of GSK-3 beta activity attenuates proliferation of human colon cancer cells in rodents. Cancer Sci. 2007;98:1388–1393. doi: 10.1111/j.1349-7006.2007.00545.x. [DOI] [PMC free article] [PubMed] [Google Scholar]
- Shao Y, Aplin AE. Akt3-mediated resistance to apoptosis in B-RAF-targeted melanoma cells. Cancer Res. 2010;70:6670–6681. doi: 10.1158/0008-5472.CAN-09-4471. [DOI] [PMC free article] [PubMed] [Google Scholar]
- Sharma A, Trivedi NR, Zimmerman MA, Tuveson DA, Smith CD, Robertson GP. Mutant V599EB-Raf regulates growth and vascular development of malignant melanoma tumors. Cancer Res. 2005;65:2412–2421. doi: 10.1158/0008-5472.CAN-04-2423. [DOI] [PubMed] [Google Scholar]
- Sharma A, Sharma AK, Madhunapantula SV, Desai D, Huh SJ, Mosca P, Amin S, Robertson GP. Targeting Akt3 signaling in malignant melanoma using isoselenocyanates. Clin Cancer Res. 2009;15:1674–1685. doi: 10.1158/1078-0432.CCR-08-2214. [DOI] [PMC free article] [PubMed] [Google Scholar]
- Sharma AK, Kline CL, Berg A, Amin S, Irby RB. The Akt inhibitor ISC-4 activates prostate apoptosis response protein-4 and reduces colon tumor growth in a nude mouse model. Clin Cancer Res. 2011;17:4474–4483. doi: 10.1158/1078-0432.CCR-10-2370. [DOI] [PMC free article] [PubMed] [Google Scholar]
- Sharma A, Madhunapantula SV, Gowda R, Berg A, Neves RI, Robertson GP. Identification of aurora kinase B and Wee1-like protein kinase as downstream targets of (V600E)B-RAF in melanoma. Am J Pathol. 2013;182:1151–1162. doi: 10.1016/j.ajpath.2012.12.019. [DOI] [PMC free article] [PubMed] [Google Scholar]
- Siegel R, Naishadham D, Jemal A. Cancer statistics, 2012. CA Cancer J Clin. 2012;62:10–29. doi: 10.3322/caac.20138. [DOI] [PubMed] [Google Scholar]
- Simard EP, Ward EM, Siegel R, Jemal A. Cancers with increasing incidence trends in the United States: 1999 through 2008. CA Cancer J Clin. 2012;62:118–128. doi: 10.3322/caac.20141. [DOI] [PubMed] [Google Scholar]
- Smalley KS, Haass NK, Brafford PA, Lioni M, Flaherty KT, Herlyn M. Multiple signaling pathways must be targeted to overcome drug resistance in cell lines derived from melanoma metastases. Mol Cancer Ther. 2006;5:1136–1144. doi: 10.1158/1535-7163.MCT-06-0084. [DOI] [PubMed] [Google Scholar]
- Smalley KS, Contractor R, Haass NK, et al. An organometallic protein kinase inhibitor pharmacologically activates p53 and induces apoptosis in human melanoma cells. Cancer Res. 2007;67:209–217. doi: 10.1158/0008-5472.CAN-06-1538. [DOI] [PubMed] [Google Scholar]
- Solit DB, Rosen N. Resistance to BRAF inhibition in melanomas. N Engl J Med. 2011;364:772–774. doi: 10.1056/NEJMcibr1013704. [DOI] [PubMed] [Google Scholar]
- Stahl JM, Cheung M, Sharma A, Trivedi NR, Shanmugam S, Robertson GP. Loss of PTEN promotes tumor development in malignant melanoma. Cancer Res. 2003;63:2881–2890. [PubMed] [Google Scholar]
- Stahl JM, Sharma A, Cheung M, Zimmerman M, Cheng JQ, Bosenberg MW, Kester M, Sandirasegarane L, Robertson GP. Deregulated Akt3 activity promotes development of malignant melanoma. Cancer Res. 2004;64:7002–7010. doi: 10.1158/0008-5472.CAN-04-1399. [DOI] [PubMed] [Google Scholar]
- Tran MA, Gowda R, Sharma A, Park EJ, Adair J, Kester M, Smith NB, Robertson GP. Targeting V600EB-Raf and Akt3 using nanoliposomal-small interfering RNA inhibits cutaneous melanocytic lesion development. Cancer Res. 2008;68:7638–7649. doi: 10.1158/0008-5472.CAN-07-6614. [DOI] [PMC free article] [PubMed] [Google Scholar]
- Villanueva J, Vultur A, Lee JT, et al. Acquired resistance to BRAF inhibitors mediated by a RAF kinase switch in melanoma can be overcome by cotargeting MEK and IGF-1R/PI3K. Cancer Cell. 2010;18:683–695. doi: 10.1016/j.ccr.2010.11.023. [DOI] [PMC free article] [PubMed] [Google Scholar]
- Wang Z, Smith KS, Murphy M, Piloto O, Somervaille TC, Cleary ML. Glycogen synthase kinase 3 in MLL leukaemia maintenance and targeted therapy. Nature. 2008;455:1205–1209. doi: 10.1038/nature07284. [DOI] [PMC free article] [PubMed] [Google Scholar]
- Werzowa J, Koehrer S, Strommer S, Cejka D, Fuereder T, Zebedin E, Wacheck V. Vertical inhibition of the mTORC1/mTORC2/PI3K pathway shows synergistic effects against melanoma in vitro and in vivo. J Invest Dermatol. 2011;131:495–503. doi: 10.1038/jid.2010.327. [DOI] [PubMed] [Google Scholar]
- Wilson W, 3rd, Baldwin AS. Maintenance of constitutive IkappaB kinase activity by glycogen synthase kinase-3alpha/beta in pancreatic cancer. Cancer Res. 2008;68:8156–8163. doi: 10.1158/0008-5472.CAN-08-1061. [DOI] [PMC free article] [PubMed] [Google Scholar]
- Zhang H, Hoang T, Saeed B, Ng SC. Induction of apoptosis in prostatic tumor cell line DU145 by staurosporine, a potent inhibitor of protein kinases. Prostate. 1996;29:69–76. doi: 10.1002/(SICI)1097-0045(199608)29:2<69::AID-PROS1>3.0.CO;2-C. [DOI] [PubMed] [Google Scholar]
- Zhang XD, Gillespie SK, Hersey P. Staurosporine induces apoptosis of melanoma by both caspase-dependent and -independent apoptotic pathways. Mol Cancer Ther. 2004;3:187–197. [PubMed] [Google Scholar]
Associated Data
This section collects any data citations, data availability statements, or supplementary materials included in this article.
Supplementary Materials
Figure S1. Efficacy of individual siRNAs for inhibiting GSK3β protein levels in melanomas.
Figure S2. SiGSK3β had a negligible and inconsistent effect on the cell cycle of 1205 Lu cells.
Figure S3. Targeting GSK3β using siRNA #2 but not siRNA #1 inhibited xenografted tumor development.
Figure S4. AR-A014418 induced caspase-3/7 activity in melanoma cells.
Table S1. Targeting GSK3α inhibited melanoma cell growth by inducing a G0/G1 block in the cell cycle.
Table S2. Pan-GSK3α/β inhibitor AR-A014418 retards melanoma cell growth by inducing G0/G1 arrest and increasing the sub-G0/G1 cell population.