

Abstract
Bacterial cells sense external nutrient availability to regulate macromolecular synthesis and consequently their growth. In the Gram-positive bacterium Bacillus subtilis, the starvation-inducible nucleotide (p)ppGpp negatively regulates GTP levels, both to resist nutritional stress and to maintain GTP homeostasis during growth. Here, we quantitatively investigated the relationship between GTP level, survival of amino acid starvation, and growth rate when GTP synthesis is uncoupled from its major homeostatic regulator, (p)ppGpp. We analyzed growth and nucleotide levels in cells that lack (p)ppGpp and found that their survival of treatment with a nonfunctional amino acid analog negatively correlates with both growth rate and GTP level. Manipulation of GTP levels modulates the exponential growth rate of these cells in a positive dose-dependent manner, such that increasing the GTP level increases growth rate. However, accumulation of GTP levels above a threshold inhibits growth, suggesting a toxic effect. Strikingly, adenine counteracts GTP stress by preventing GTP accumulation in cells lacking (p)ppGpp. Our results emphasize the importance of maintaining appropriate levels of GTP to maximize growth: cells can survive amino acid starvation by decreasing GTP level, which comes at a cost to growth, while (p)ppGpp enables rapid adjustment to nutritional stress by adjusting GTP level, thus maximizing fitness.
INTRODUCTION
Cells sense external nutrient availability and regulate macromolecular synthesis and cellular growth rate accordingly. However, the mechanisms by which cells transduce nutritional information to regulate growth rate both differ between species and are incompletely understood (1). One mechanism by which bacteria respond to changes in nutrient availability is through the alarmone guanosine (penta)tetraphosphate, or (p)ppGpp, which is synthesized in response to nutritional or other stresses and plays an important role in bacterial stress response, virulence, persistence, and development (2, 3).
In the Gram-positive bacterium Bacillus subtilis, (p)ppGpp is synthesized by ribosome-associated RelA, which produces the majority of (p)ppGpp upon amino acid starvation (4), and the small synthetases YjbM and YwaC (5, 6). RelA is a bifunctional enzyme, which has a (p)ppGpp-hydrolase domain in addition to a synthetase domain (4). GTP levels decrease sharply upon massive (p)ppGpp synthesis in B. subtilis (7) via consumption of GTP and direct inhibition of the activities of the GTP biosynthesis enzymes HprT, Gmk, and GuaB (Fig. 1) (8, 9). Strikingly, HprT and Gmk are sensitive to low (p)ppGpp concentrations (∼10 to 20 μM) in vitro, while near-basal levels of (p)ppGpp in vivo are critical for maintenance of GTP homeostasis during growth (9). Synthesis of (p)ppGpp by YjbM and YwaC in the absence of RelA (p)ppGpp-hydrolase activity is sufficient to inhibit growth (6, 10). However, it is not known whether this is due to the corresponding decrease in GTP level, increase in (p)ppGpp level, or both.
FIG 1.

Diagram of the de novo and salvage GTP biosynthesis pathways in B. subtilis. GTP is synthesized through the de novo pathway (blue) or the salvage pathway from guanosine (GUO) or guanine (GUA) (purple). Steps common to both pathways are in green. Enzymes that are inhibited by (p)ppGpp are underlined. The de novo enzyme GuaB is moderately inhibited by (p)ppGpp, while the salvage enzyme HprT is strongly inhibited. Gmk participates in both pathways and is strongly inhibited by (p)ppGpp. GTP level affects survival of amino acid starvation, including amino acid downshift and survival of arginine hydroxamate (RHX) treatment, and cell growth.
GTP and ATP provide energy for many cellular processes, including translation, which is considered to be the main factor that determines growth rate (1, 11). Regulation of growth rate has been best characterized in Escherichia coli, where growth rate and nucleotide level (NTP) show no apparent correlation (12, 13), which suggests that E. coli cells do not regulate growth rate by modulation of energy levels per se. In contrast, (p)ppGpp is suggested to be a key growth rate determinant (14). (p)ppGpp production is negatively correlated with growth rate in E. coli (15), although others have argued that (p)ppGpp determines growth rate only under certain circumstances (11). Regardless, (p)ppGpp directly interacts with RNA polymerase (RNAP) (16) synergistically with the transcription factor DksA (17) to decrease transcription from rRNA promoters (18), which decreases growth rate by inhibiting ribosome synthesis (1, 11).
In B. subtilis, (p)ppGpp does not interact directly with RNAP to regulate transcription of rRNA, and no DksA homolog seems to play a role during growth. Instead, (p)ppGpp appears to regulate transcription by controlling GTP level. Transcription of rRNA promoters is sensitive to the concentration of the initiating nucleotide (iNTP) (19), which is GTP. Thus, decreasing GTP level reduces transcription of rRNA (19), which lowers ribosome synthesis and, presumably, growth rate. GTP also regulates transcription in B. subtilis through its interaction with the pleiotropic transcriptional regulator CodY, which is activated by GTP (20, 21) and represses many stationary-phase genes and branched-chain amino acid biosynthesis genes (22). Thus, changes in GTP level globally adjust transcription in B. subtilis (23), either through iNTP concentration or through CodY, to favor growth or stress survival. Indeed, an amino acid upshift results in an increase of growth rate, which is accompanied by a concomitant and necessary increase in the GTP pool (24), suggesting that GTP may regulate growth rate. In contrast, amino acid downshift results in decrease of GTP level and growth rate (19, 24). That GTP may serve as a signal for proliferation is therefore an intriguing possibility. However, the effects of GTP level on growth rate in the absence of other nutritional changes, like amino acid availability, and of (p)ppGpp, which tightly regulates GTP, have yet to be formally tested.
In this study, we took advantage of B. subtilis (p)ppGpp0 mutants containing mutations that affect GTP biosynthesis, which were isolated in our previous study for suppressor mutants that are able to grow on minimal medium (9). Because these mutants lack (p)ppGpp, we are able to analyze quantitatively the relationships between stress resistance, GTP level, and growth rate in these strains. While the suppressor mutants survived stress due to decreased GTP levels, we found that this comes at the expense of cell proliferation. We then manipulated GTP levels in a single suppressor mutant and observed increases in growth rate or growth inhibition, depending on the growth medium. We provide evidence that GTP regulates growth rate in a dose-dependent manner, and our results support a model in which (p)ppGpp sets the upper limit on GTP level to ensure optimal growth.
MATERIALS AND METHODS
Strains and strain construction.
Strains used in this study are listed in Table 1. B. subtilis strains were created by natural transformation, using standard techniques (27). To construct the (p)ppGpp0 guaB1 ΔcodY strain, we transformed the ΔcodY allele into AK22 with chromosomal DNA from PS37 and selected transformants on Luria-Bertani (LB) plates containing 80 μg ml−1 spectinomycin. The deletion was confirmed by PCR amplification. The ΔcodY allele is linked to a spectinomycin resistance cassette inserted into gid. We determined that this insertion does not affect growth under our conditions (data not shown).
TABLE 1.
Strains
| Strain | Genotypea | Reference |
|---|---|---|
| YB886 | trpC2 metB10 xin-1 SPβ− | 25 |
| PS37 | trpC2 gid::spc ΔcodY | 26 |
| JDW755 | YB886 ΔyjbM ΔywaC::kan ΔrelA::mls | 9 |
| AK22 (guaB1) | YB886 ΔyjbM ΔywaC::kan ΔrelA::mls guaB(−65T-C) | 9 |
| AK14 (guaB2) | YB886 ΔyjbM ΔywaC::kan ΔrelA::mls guaB(218A-G) | 9 |
| AK2 (guaB3) | YB886 ΔyjbM ΔywaC::kan ΔrelA::mls guaB(361T-C) | 9 |
| WZ7 (guaB4) | YB886 ΔyjbM ΔywaC::kan ΔrelA::mls guaB(416C-T) | 9 |
| AK9 (guaB5) | YB886 ΔyjbM ΔywaC::kan ΔrelA::mls guaB(761A-G) | 9 |
| AK31 (guaB6) | YB886 ΔyjbM ΔywaC::kan ΔrelA::mls guaB(857C-T) | 9 |
| WZ8 (guaB7) | YB886 ΔyjbM ΔywaC::kan ΔrelA::mls guaB(943G-A) | 9 |
| WZ9 (guaB8) | YB886 ΔyjbM ΔywaC::kan ΔrelA::mls guaB(1276G-A) | 9 |
| AK11 (guaB9) | YB886 ΔyjbM ΔywaC::kan ΔrelA::mls guaB(1330G-A) | 9 |
| WZ1 (guaB10) | YB886 ΔyjbM ΔywaC::kan ΔrelA::mls guaB(1448C-T) | 9 |
| AK6 (codY) | YB886 ΔyjbM ΔywaC::kan ΔrelA::mls codY(19–20insA) | 9 |
| AK1 (guaA) | YB886 ΔyjbM ΔywaC::kan ΔrelA::mls guaA(−143T-C) | 9 |
| WZ11 (gmk) | YB886 ΔyjbM ΔywaC::kan ΔrelA::mls gmk(419C-T) | 9 |
| JDW1397 | YB886 guaB::pJW305 (guaB′-lacZ erm Pspac-guaB) | 9 |
| JDW2208 | YB886 ΔyjbM ΔywaC::kan ΔrelA::mls guaB(−65T-C) gid::spc ΔcodY | This study |
In (p)ppGpp0 suppressor mutant cells, the number after the gene (guaA, guaB, gmk, or codY) indicates the position of the mutation relative to the translational start site (ATG). The precise mutation follows the position indicator.
Growth conditions.
All cultures were grown at 37°C with shaking. Cells were grown in LB broth or S7 defined medium (28), with a MOPS concentration of 50 mM rather than 100 mM, and supplemented with 0.1% glutamate, 1% glucose, 0.5% Casamino Acids (Bacto), 40 μg ml−1 tryptophan, and 40 μg ml−1 methionine (CAA medium). Tryptophan and methionine were always added to CAA medium because of the strain background auxotrophies (Table 1). In addition to the standard trace metals, S7 medium was also supplemented with 0.4 μg ml−1 copper(II) chloride hydrate, 0.06 μg ml−1 cobalt(II) chloride hexahydrate, and 0.06 μg ml−1 sodium molybdate dihydrate. Modification to CAA medium phosphate concentration (0.5 mM for low and 5 mM for standard) was used as indicated. Erythromycin and lincomycin were used at 0.25 μg ml−1 and 6.25 μg ml−1, respectively, to maintain selection of the guaBdown allele (a guaB depletion construct) during growth of JDW1397.
Growth rate measurement.
Optical density at 600 nm (OD600) was measured during growth in a Synergy 2 plate reader (BioTek). Cells were resuspended from overnight plates in the appropriate medium, and cultures were diluted to an OD600 of ∼0.005. Cultures (100 μl) were assayed in triplicate with continuous shaking at medium speed at 37°C. Doubling time was measured from the steepest section of the linear phase of the semilog growth curve and subsequently converted to growth rate (μ; doublings/hour). First, growth was measured in low-phosphate CAA medium to mimic conditions for nucleotide quantification (see Fig. 2). All other growth rates were measured in standard phosphate CAA medium or in LB.
FIG 2.

Growth rate of (p)ppGpp0 suppressor mutant cells negatively correlates with survival of amino acid downshift and survival of RHX treatment and positively correlates with GTP level. Pearson correlations of growth rate (μ) with survival of amino acid downshift (log10 of plating efficiency on minimal medium) (A) and survival of RHX treatment (% survival) (B) for (p)ppGpp0 suppressor mutants are shown (see Table 1 for suppressor mutant alleles). Wild-type and (p)ppGpp0 values are plotted for comparison. Values for survival of amino acid downshift (A) and RHX survival (B) are from the work of Kriel et al. (9). For amino acid downshift, cells were grown in CAA medium, harvested during log phase, washed, and plated on minimal medium. For RHX treatment, cells were grown in CAA medium, treated with RHX for 20 min, and plated for enumeration of CFU. (C to E) Pearson correlation of growth rate with GTP/ATP ratio (C), GTP level (D), and ATP level (E) for (p)ppGpp0 guaB suppressor mutants. Average GTP/ATP ratios (n = 4) and nucleotide levels (n = 2) are plotted. Arbitrary units (A.U.) are determined from the phosphorimager counts normalized to cell density (OD600). All growth rates were calculated from growth curves in low-phosphate CAA medium. Error for growth rates and GTP/ATP ratios for all suppressor mutants is shown in Fig. S1. Strains are YB886 (wild type), JDW755 [(p)ppGpp0], AK6 [(p)ppGpp0 codY], WZ11 [(p)ppGpp0 gmk], AK1 [(p)ppGpp0 guaA], AK22, AK14, AK2, WZ7, AK9, AK31, WZ8, WZ9, AK11, and WZ1 [(p)ppGpp0 guaB1 through (p)ppGpp0 guaB10].
Intracellular nucleotide quantification.
Quantification of GTP and ATP levels was performed using thin-layer chromatography (TLC) as previously described (29). Cells were grown in low-phosphate CAA medium, labeled with 50 μCi ml−1 32P orthophosphate (900 mCi mmol−1; Perkin-Elmer) at an OD600 of ∼0.05 and grown for an additional two to three generations before sampling. For LB samples, cells were labeled with 100 μCi ml−1 32P. Nucleotides were extracted by incubating 200 μl of sample with 40 μl 2 N formic acid on ice for at least 20 min. Samples were spotted on PEI cellulose plates (Sigma-Aldrich) and developed in 1.5 M potassium phosphate monobasic (KH2PO4) (pH 3.4). TLC plates were exposed on storage phosphor screens, which were scanned by a Typhoon scanner (GE). Nucleotides were quantified using ImageQuant software (Molecular Dynamics). Nucleotide levels are expressed as a ratio to ATP level, as phosphorimager counts normalized to cell density (OD600), or relative to the control sample. Normalizing GTP level against ATP level always yields more consistent data because it eliminates variability between samples and replicates, including extraction efficiency, cell density/number, pipetting/spotting, and labeling. However, because we detected slight changes in ATP level, we also normalized to OD600 or to a control sample, although the variability between samples in these measurements results in weaker correlations.
RESULTS
Growth rate negatively correlates with the ability to suppress (p)ppGpp0 phenotypes.
Previously, we constructed a (p)ppGpp0 strain, containing deletions of the genes encoding all three (p)ppGpp synthetases, which cannot form colonies on minimal medium, and isolated spontaneous suppressor mutants (9). These mutations map to guaB, guaA, gmk, and codY and enable (p)ppGpp0 cells to grow on minimal medium by decreasing the GTP level, which activates transcription of amino acid biosynthesis genes through initiating nucleotide or by inactivating CodY (23, 30, 31). The majority of these mutations are leaky (excepting codY frameshift mutations), since GTP synthesis is an essential process and guaB and gmk are essential genes (32). We found that these mutants vary in their ability to suppress two other (p)ppGpp0 phenotypes—failure to survive amino acid downshift and failure to survive treatment with a nonfunctional amino acid analog (arginine hydroxamate [RHX] treatment), which depletes arginine-charged tRNA. The level of GTP produced by the mutant strains was found to negatively correlate with strength of suppression (9).
However, we also noticed that these mutants grew at different rates, and all grew more slowly than wild-type cells (∼4.0 doublings h−1) (see Fig. S1A in the supplemental material). To determine whether strength of suppression associates with growth rate of (p)ppGpp0 mutants, we correlated growth rate of cells in medium supplemented with Casamino Acids (CAA medium) with survival of amino acid downshift (Fig. 2A) and survival of RHX treatment (Fig. 2B). We observed a striking negative correlation between the ability to suppress both phenotypes and growth rate (Pearson r = −0.8982 and −0.8723; P ≤ 0.0001). These results suggest that, in the absence of (p)ppGpp, lowering the growth rate might substitute for the function of (p)ppGpp in survival of amino acid downshift.
Growth rate positively correlates with GTP/ATP ratio in the absence of (p)ppGpp.
We next wanted to determine whether differential GTP levels lead to the observed growth rate of the (p)ppGpp0 suppressor mutant cells. The suppressors have blocks in different positions in the GTP biosynthesis pathway (i.e., guaB, guaA, and gmk), resulting in accumulation of different intermediates or altering global transcription in the case of codY, both of which may alter many physiological factors affecting growth rate. In order to minimize these complications, we decided to compare GTP level and growth rate in only one set of mutants, which should be directly comparable. Ten different mutations were found in the promoter or open reading frame of guaB (Table 1), which encodes IMP dehydrogenase (IMPDH; referred to here as GuaB). GuaB converts IMP to XMP, is moderately inhibited by (p)ppGpp, and executes the first committed step toward GTP biosynthesis in the de novo pathway (Fig. 1). We chose the (p)ppGpp0 guaB set because the mutants demonstrate a large range of growth rates (see Fig. S1A in the supplemental material) and should primarily differ only by the amount of GTP synthesis supported by the various leaky alleles.
To determine whether differential GTP levels correlate with the observed growth rates of (p)ppGpp0 guaB cells, we measured growth rate (see Fig. S1A in the supplemental material) and GTP level (see Fig. S1B) during exponential phase in CAA medium. GTP levels were quantified by thin-layer chromatography (TLC) and normalized to ATP to allow comparison between samples and TLC plates. We found that the pattern of growth rate was similar to the pattern in GTP/ATP ratio (see Fig. S1). We correlated growth rate with GTP/ATP ratio (Fig. 2C), GTP level (Fig. 2D), and ATP level (Fig. 2E) in the (p)ppGpp0 guaB mutants. We found a strong linear correlation with GTP/ATP ratio (Pearson r = 0.9485; P < 0.0001) and GTP level (Pearson r = 0.9259; P = 0.0001) but not ATP level (Pearson r = −0.5036; P = 0.1378), suggesting that the amount of GTP synthesized determines suppressor mutant growth rate in this medium. We do not express GTP and ATP levels as molar concentrations because this implies a quantitative knowledge beyond our measurements. Instead, we estimate that the GTP levels detected range from ∼1 mM to ∼2 mM, based on the ratio to ATP level, which was found to be near 10 mM in E. coli (33).
Growth rate of (p)ppGpp0 guaB cells in LB is increased by guanosine supplementation.
Our results showing strong correlation of growth rate with GTP level in the (p)ppGpp0 guaB mutants are consistent with a model in which the capacity for GTP synthesis can limit growth rate. Previous studies analyzing the relationship between growth rate and nucleotide level were performed with cells that could synthesize (p)ppGpp, which regulates GTP homeostasis in response to amino acid availability, and growth rate was manipulated by altering nutritional content of the growth medium (amino acids, carbon source) (13, 15, 19, 24, 34), likely altering many physiological factors. Therefore, we sought to test directly whether manipulating GTP level independently of other nutritional changes is sufficient to alter growth rate.
Our leaky (p)ppGpp0 guaB mutants provide a powerful tool for this analysis in that they lack the major GTP homeostatic mechanism effected by (p)ppGpp and have lower GTP synthesis capacity. Because guanosine (GUO) is converted to GTP through the salvage pathway, downstream of GuaB activity in the de novo pathway (Fig. 1), we hypothesized that supplementing the medium with different concentrations of guanosine would result in proportionally increasing growth rates in (p)ppGpp0 guaB mutant cells. We took advantage of one slow-growing (p)ppGpp0 guaB suppressor mutant, the guaB1 strain (−65T-C promoter mutation), which has one of the lowest GTP levels among the guaB mutants (see Fig. S1B in the supplemental material). To test whether increasing GTP level increases growth rate, we grew (p)ppGpp0 guaB1 cells in LB supplemented with increasing concentrations of guanosine (Fig. 3A). An increase of growth rate with a stepwise increase in guanosine level up to 3 mM was apparent (Fig. 3A and B). Guanosine did not alter growth rate of wild-type cells (see Fig. S2 in the supplemental material), which is expected because (p)ppGpp prevents increase in the homeostatic GTP level upon guanosine treatment (9).
FIG 3.

Guanosine modulates growth of the (p)ppGpp0 guaB1 strain in LB medium. (A) Average and standard deviation of three growth curves for AK22 [(p)ppGpp0 guaB1] in LB medium supplemented with the indicated concentrations of GUO. (B and C) Average growth rates in LB for the (p)ppGpp0 guaB1 strain (B) and the (p)ppGpp0 gmk suppressor mutant (WZ11) (C). Error bars indicate standard deviations (n ≥ 6).
While an increase in the growth rate of (p)ppGpp0 guaB1 cells could be dependent on any of a variety of guanylate nucleotides (Fig. 1), guanosine supplementation did not alter the growth rate of a (p)ppGpp0 suppressor mutant with a mutation in gmk (Fig. 3C). The gmk mutation reduces synthesis of GDP from GMP (Fig. 1) and thus prevents increases in GDP or GTP upon guanosine addition, unlike mutations in guaB (9). Finally, we quantified GTP and ATP levels in cells growing in LB with 3 mM guanosine and found that the GTP level (∼3-fold) and GTP/ATP ratio (∼4-fold) are higher than in cells growing without guanosine supplementation. Therefore, we conclude that guanosine supplementation increases the GTP (or GDP) level, which results in higher growth rates in (p)ppGpp0 guaB1 cells.
A high GTP level inhibits growth of (p)ppGpp0 cells in CAA medium.
Unlike in LB, where (p)ppGpp0 cells can grow with 3 mM added guanosine, our previous study reported that GTP levels rose to toxic levels when 1 mM guanosine was added to (p)ppGpp0 cells growing in CAA medium (9). Therefore, we tested whether the growth rate of (p)ppGpp0 guaB1 cells can be increased in CAA medium by supplying smaller concentrations of guanosine (<1 mM). While guanosine slightly promoted growth at a low concentration (1 μM), it delayed exit from lag phase at a higher concentration (10 μM) and completely inhibited growth at even higher concentration (100 μM) in CAA medium (Fig. 4A). Despite these changes in exit from lag phase, we did not detect any change in growth rate in the range of 0.1 to 10 μM (Fig. 4B). For 100 μM GUO, growth was sometimes observed after ∼1,000 min, although these may be suppressor mutants, because duplicate cultures show sporadic growth at different times (data not shown). We conclude that guanosine supplementation results in toxic levels of GTP that inhibit growth even at low concentrations in CAA medium. We note that a high GTP level renders cells more sensitive to RHX treatment (9), suggesting that growth inhibition caused by excess GTP is fundamentally different from the reduced growth rate conferred by low GTP levels. High GTP that inhibits growth also causes sensitivity to starvation.
FIG 4.

Guanosine inhibits growth of (p)ppGpp0 guaB1 cells in CAA medium. (A) Representative growth curve from three independent experiments. (p)ppGpp0 guaB1 (AK22) cells were grown in CAA medium supplemented with the indicated concentrations of GUO. (B) Average growth rates for (p)ppGpp0 guaB1 cells in CAA medium supplemented with GUO. Error bars indicate standard deviations (n ≥ 9). (C and D) (p)ppGpp+ cells containing a guaB depletion construct (JDW1397) grow at the same rate regardless of GUO concentration in CAA medium. (C) Representative growth curve of (p)ppGpp+ guaBdown (Pspac-guaB) cells in CAA medium supplemented with GUO (n ≥ 5). (D) Average growth rates of (p)ppGpp+ guaBdown cells in CAA medium supplemented with GUO. As a control for maximal growth rate when guaB is induced, cells were also grown in the same medium (without GUO) with 0.5 mM IPTG. Error bars indicate standard deviations (n ≥ 5). A comparison of growth rate and GTP level for (p)ppGpp+ guaBdown cells is shown in Fig. S1 in the supplemental material.
We performed similar growth rate experiments on a (p)ppGpp+ strain that contains a guaB depletion construct (guaBdown) to determine how cells that produce (p)ppGpp respond to GTP limitation and external guanosine concentration in CAA medium. The guaBdown construct places the wild-type guaB gene under the control of an isopropyl-β-d-thiogalactopyranoside (IPTG)-inducible promoter. In the absence of IPTG, these cells grow slowly, because de novo GTP synthesis is reduced when guaB expression is low (Fig. 4C; also, see Fig. S1 and S3 in the supplemental material). (p)ppGpp+ guaBdown cells achieve the same high growth rate when supplemented with different concentrations of guanosine or when IPTG is present to induce guaB expression (Fig. 4D), corresponding to similar GTP levels (see Fig. S1). Therefore, (p)ppGpp prevents the toxic accumulation of GTP and maintains GTP homeostasis, thus ensuring the optimal GTP level for growth.
Adenine supports growth of (p)ppGpp0 cells in the presence of guanosine by preventing GTP accumulation.
The results above suggest that components of LB, which are missing in CAA medium, eliminate the toxicity of guanosine at concentrations ≥0.1 mM for (p)ppGpp0 guaB1 cells. Possible candidates include purine and pyrimidine bases. While we found no effect of pyrimidine bases (data not shown), we found that addition of adenine inhibits guanosine-induced GTP accumulation in (p)ppGpp0 cells. Wild-type, (p)ppGpp0, and (p)ppGpp0 guaB1 cells were grown in CAA medium and treated for 20 min with 1 mM adenine, 1 mM guanosine, or both. Nucleotides were extracted before and after treatment and quantified by TLC. Consistent with previous results, we found that GTP accumulated to high levels in (p)ppGpp0 cells treated with guanosine alone (Fig. 5A and B). While the addition of adenine alone had little effect on GTP or ATP levels, we found that addition of adenine prevents GTP accumulation upon guanosine treatment in (p)ppGpp0 and (p)ppGpp0 guaB1 cells (Fig. 5A to C). ATP and GTP levels were unaffected by the addition of either adenine or guanosine in wild-type cells.
FIG 5.

Adenine prevents GTP accumulation in (p)ppGpp0 cells and restores growth in the presence of guanosine. (A) GTP/ATP ratio, (B) change in GTP level (normalized to time zero [T0]), and (C) change in ATP level (normalized to T0) in wild-type, (p)ppGpp0, and (p)ppGpp0 guaB1 cells treated with GUO and adenine (ADE). Cells were grown in low-phosphate CAA medium, sampled (T0), and then treated for 20 min with 1 mM GUO/ADE or an equivalent volume of dimethyl sulfoxide (DMSO; control). DMSO is the solvent for ADE. Nucleotide levels were quantified by TLC. Error bars indicate ranges (n = 2). Growth of wild-type (D), (p)ppGpp0 (E), and (p)ppGpp0 guaB1 (F) cells upon treatment with 1 mM GUO/ADE or DMSO (control) is shown. Cells were grown to early log phase and then treated. Addition of GUO and/or ADE is indicated with an arrow. One representative growth curve from two replicates is shown. Strains are YB886 (the wild type), JDW755 [(p)ppGpp0] and AK22 [(p)ppGpp0 guaB1].
We then tested whether changes in growth corresponded to changes in nucleotide level by monitoring growth after addition of adenine and guanosine to exponentially growing cells. Growth of wild-type cells was not affected by either adenine or guanosine (Fig. 5D). However, growth of (p)ppGpp0 cells was almost immediately inhibited by guanosine alone (Fig. 5E), which could be due to cell death (9). Strikingly, growth inhibition was prevented by the simultaneous addition of adenine, likely because it prevents accumulation of GTP (Fig. 5A and B). While we detected an increase in growth of (p)ppGpp0 guaB1 cells treated with guanosine or with guanosine plus adenine (Fig. 5F) that corresponded to an increase in GTP/ATP ratio (Fig. 5A) and GTP level (Fig. 5B), cells treated with guanosine alone eventually ceased growing, possibly because GTP accumulated to toxic levels. Taken together, our results suggest that adenine prevents a massive buildup of GTP when (p)ppGpp0 cells are treated with guanosine.
Because adenine supported growth of (p)ppGpp0 cells with guanosine, we tested the growth of (p)ppGpp0 guaB1 cells in CAA medium supplemented with both bases. In contrast to growth with 0.1 mM guanosine alone, the mutant displayed robust and fast growth in the presence of 0.1 mM adenine and 0.1 mM guanosine (see Fig. S4A in the supplemental material). Importantly, this condition restored the growth rate to near-wild-type levels compared to growth without bases or with adenine alone. We then tested whether we could alter the growth rate of (p)ppGpp0 guaB1 cells in CAA medium by supplementing with different concentrations of adenine and guanosine. We found that increasing the external adenine concentration while keeping the guanosine concentration constant decreased the growth rate and GTP/ATP ratio (see Fig. S4). The highest level of guanosine relative to adenine supported the highest growth rate, but higher levels of guanosine (>0.3 mM) were unable to further increase growth rate in this mutant (data not shown). We found that GTP level (Pearson r = 0.8232; P = 0.0034) and GTP/ATP ratio (Pearson r = 0.9694; P < 0.0001), but not ATP level (Pearson r = −0.5474; P = 0.1015), were correlated with growth rate (Fig. 6). The weaker correlation with GTP level is likely due to sampling variability (see Materials and Methods for details). We conclude that GTP level (or GTP/ATP ratio) is the rate-limiting factor for growth.
FIG 6.
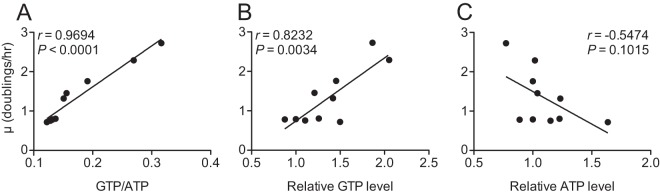
Manipulation of GTP/ATP ratio or GTP level in (p)ppGpp0 guaB1 (AK22) cells alters growth rate. Growth rate is positively correlated with GTP/ATP ratio (A) and GTP level (B) when nucleotide level is modulated by ADE and GUO concentration in CAA medium. (C) ATP level is not correlated with growth rate. GTP and ATP levels are relative to the control in medium lacking GUO or ADE. Values are Pearson correlation (r) and P value. Average values are plotted for growth rate (n ≥ 6) and nucleotide levels (n = 2 for most conditions). Details on ADE and GUO concentrations, with averages and error for all measurements, are in Fig. S4 in the supplemental material.
GTP affects growth rate even in the absence of CodY.
During growth in LB, guanosine supplementation increases growth rate of (p)ppGpp0 guaB1 cells by increasing GTP level (Fig. 3B). One possible downstream effector is the transcriptional regulator CodY. CodY is activated by GTP and branched-chain amino acids, represses stationary-phase and guanosine transporter genes, and induces expression of guaB (20, 22, 35, 36). Therefore, it is possible that the effect of guanosine/GTP level on growth rate requires CodY activity. To test this, we introduced a codY deletion allele into (p)ppGpp0 guaB1 cells and assayed growth in LB supplemented with different concentrations of guanosine. We obtained results similar to those seen with the parent strain, such that an increase in growth rate occurred with a stepwise increase in guanosine concentration (Fig. 7). Additionally, we found that overall growth rate is decreased in (p)ppGpp0 guaB1 codY cells. Absence of CodY decreases GTP level (see Fig. S1B in the supplemental material), possibly because guaB expression is reduced (22, 23). However, the ability of GTP to increase growth rate remains intact in (p)ppGpp0 guaB1 codY cells, and thus, we conclude that GTP level can adjust the growth rate independently of CodY.
FIG 7.

Guanosine modulates growth of (p)ppGpp0 guaB1 ΔcodY cells in LB medium. (A) Averages and standard deviations of three growth curves for the (p)ppGpp0 guaB1 ΔcodY mutant (JDW2208) in LB medium supplemented with the indicated concentrations of GUO. (B) Average growth rates in LB for the (p)ppGpp0 guaB1 ΔcodY mutant. Error bars indicate standard deviations (n ≥ 6).
DISCUSSION
In this study, we present evidence of a trade-off between survival of amino acid starvation and growth in B. subtilis cells that lack (p)ppGpp. We show that (p)ppGpp0 suppressor mutants grow slowly due to reduced GTP levels, and the slowest-growing strains with the lowest GTP levels are most resistant to amino acid downshift and RHX treatment. Thus, slow growth and/or low GTP level confers resistance to amino acid downshift. GTP level positively correlates with steady-state growth rate and tunes growth in a dose-dependent manner, such that decreasing GTP level reduces the growth rate. On the other hand, GTP accumulation in the absence of (p)ppGpp can also result in growth inhibition due to GTP stress, which sensitizes rather than increases resistance to amino acid downshift. Taken together, our results highlight the importance of maintaining GTP levels at the appropriate level for optimal growth, because low levels result in slow growth, and excess GTP is growth inhibitory (Fig. 8).
FIG 8.

Model of the quantitative relationship between GTP level and stress survival (dashed line) or growth (solid line) in the absence of (p)ppGpp.
Growth-survival trade-off in cells that lack (p)ppGpp.
Previously, we showed that survival of both amino acid downshift and RHX treatment negatively correlates with GTP level (9). We found that these phenotypes also negatively correlate with the growth rate of (p)ppGpp0 suppressor mutants (Fig. 2A and B). While we are unable to uncouple growth rate from GTP level in these mutants, our results suggest that different GTP levels, growth rates, or both result in the differential ability of these mutants to suppress (p)ppGpp0 phenotypes. Mutations that suppress the inability of (p)ppGpp0 cells to form colonies on minimal medium have also been isolated in E. coli (37, 38). Unlike suppressor mutations in B. subtilis, these mutations map to genes that encode RNAP, which is a direct target of (p)ppGpp in E. coli (15, 16, 39). While a correlation between growth rate and suppression has not been established for E. coli, some of these suppressor mutants also grow comparatively slowly (37). Therefore, in both E. coli and B. subtilis, there is a trade-off between survival of nutritional stress and growth in the absence of (p)ppGpp. We suggest that a decrease in GTP level (B. subtilis), like mutations in RNAP (E. coli) (38, 40), constitutively mimics the stringent state, which comes at a cost to growth.
GTP level (or GTP/ATP ratio) limits growth rate.
Here, we quantitatively assessed the effect of GTP level on growth rate in rich medium using a battery of (p)ppGpp0 guaB mutants. We found that the growth rate of these mutants is limited by ability to synthesize GTP and that increasing GTP level (or GTP/ATP ratio) increases growth rate. Taken together, our results suggest that GTP level can be limiting for growth and that it can alter growth rate in a dose-dependent manner.
Why is GTP level limiting for growth? One major effect of GTP level on growth rate is likely via translation and, more specifically, synthesis of rRNA. Previous studies have suggested that growth rate is determined by the concentration and function of ribosomes (11), and thus growth can be limited by the capacity of cells for translation of protein, or “translational capacity” (41). Transcription of rRNA can be limiting for growth in both E. coli (34) and B. subtilis (42). rRNA synthesis in B. subtilis is regulated by GTP level (19), and transcription is sensitive to GTP concentration, such that GTP is rate limiting for transcription initiation of rRNA operons (30). For instance, rapid rRNA synthesis upon amino acid upshift is inhibited in B. subtilis when the corresponding increase in GTP level is prevented by decoyinine treatment (24). Assuming that the cellular concentration of ATP in B. subtilis is similar to that in E. coli (∼9.6 mM) (33), the cellular GTP concentration of the (p)ppGpp0 guaB1 mutant is low but likely around 1 mM. rRNA promoters are sensitive in vivo to decrease in GTP level in this range (19, 43), while the in vitro KGTP of the rrnB P1 promoter is ∼172 μM (44). Thus, low GTP could limit rRNA transcription, decreasing translational capacity and growth rate. The idea that GTP could serve as a signal for amino acid sufficiency (21), regulating ribosome synthesis through rRNA transcription according to amino acid availability, is an appealing hypothesis. It is also tempting to speculate that low translational capacity may be what protects (p)ppGpp0 suppressor mutant cells from amino acid downshifts (9, 23).
Does GTP level regulate growth rate through other factors? The GTP levels in our mutants are probably above the range that would affect activity of GTPases with high affinity for GTP. For example, GTP provides energy for translation; however, the affinity of translation factors for GTP is high (Kd [dissociation constant] ≤ 10 μM) (45–48), likely making them refractory to changes that lower cellular GTP concentration to ∼1 mM. Another possibility is that GTP level affects growth rate by modulating transcription of other genes beyond rRNA, through either iNTP concentration or activity of CodY. Our results suggest that increasing GTP can increase growth rate independently of CodY (Fig. 7), although the overall growth rate is reduced in the absence of CodY, likely because deletion of codY decreases GTP level and/or because derepression of stationary-phase genes slows growth. GTP level affects transcription of many genes in B. subtilis other than rRNA genes (23, 31, 49), which could also alter growth rate.
The universal requirement for GTP during translation suggests that it could be a common control point for growth in many organisms. Even in E. coli, where the main focus has been on the direct regulation of rRNA synthesis and growth rate control by (p)ppGpp (14, 15), GTP levels decrease upon massive (p)ppGpp induction during serine hydroxamate treatment by as much as 50% (50, 51), and (p)ppGpp inhibits IMPDH (GuaB) activity (8).
(p)ppGpp fine-tunes GTP level to optimize growth.
We previously showed that GTP levels can increase unchecked in the absence of (p)ppGpp, resulting in cell death (9). Here we extend our prior observations and demonstrate that supplementation of CAA medium with guanosine, even at relatively low concentrations (10 and 100 μM), inhibits growth of (p)ppGpp0 guaB1 cells (Fig. 4A). In contrast, (p)ppGpp+ cells containing a guaB depletion construct that decreases de novo GTP synthesis achieve the same high growth rate and GTP level regardless of external guanosine concentration (Fig. 4C and D; also, see Fig. S1 in the supplemental material). This suggests that (p)ppGpp maintains GTP levels in the range for optimal growth. There may be a threshold level of GTP that tips the scale from rapid proliferation to growth inhibition from GTP stress (Fig. 8), and future work will be required to delineate this threshold.
Adenine protects (p)ppGpp0 cells from GTP stress.
Growth of (p)ppGpp0 guaB1 cells is not inhibited in LB medium supplemented with even higher concentrations of guanosine than those that inhibit growth in CAA medium. The GTP/ATP ratio observed during exponential-phase growth in LB with 3 mM guanosine is much lower than after addition of 1 mM guanosine to CAA medium (0.78 versus 13.1), suggesting that a component of LB inhibits GTP buildup. We found that the purine base adenine prevents (p)ppGpp0 cells from accumulating high levels of GTP in the presence of guanosine. This mechanism is presumably (p)ppGpp independent for the following reasons: (i) we found an effect for (p)ppGpp+ guaBdown cells during growth in LB supplemented with guanosine similar to that for (p)ppGpp0 guaB1 cells (compare Fig. S3 in the supplemental material with Fig. 3A and B), and (ii) adenine prevents growth of a (p)ppGpp+ guaA mutant strain on medium containing guanosine (52). Possibly adenine is converted to hypoxanthine in vivo, which competes with guanine for access to the salvage enzyme HprT (52), thus inhibiting GTP synthesis through the salvage pathway. Alternatively, adenine salvage might consume phosphoribosyl pyrophosphate (PRPP) (53), which is required for synthesis of GMP from guanine, or intermediates generated in the synthesis of ATP might inhibit enzymes in the GTP biosynthesis pathway (54). Finally, the presence of adenine in the medium might inhibit guanosine uptake, similar to the effect of adenine on guanine uptake (52).
Conclusions.
In this study, we quantitatively characterized the relationship between stress survival, growth rate, and GTP level in B. subtilis using cells that lack (p)ppGpp, and our results suggest that (p)ppGpp0 suppressor mutants are able to survive stress at the expense of cell proliferation. Our results indicate that GTP level is a limiting factor for growth rate, which we predict is through altering cellular translational capacity. Elevated GTP levels become detrimental to growth when they cross a certain threshold, causing GTP stress that inhibits growth, and (p)ppGpp is crucial for maintaining GTP levels below this threshold (Fig. 8). Intriguingly, growth inhibition by GTP stress also occurs in Enterococcus faecalis (p)ppGpp0 cells, suggesting that this phenomenon may be conserved at least among the Firmicutes (55). Importantly, the genetic tools developed in this and our previous study (9) will allow us to resolve the apparent GTP-mediated life-death dichotomy and to determine how GTP level affects growth.
Supplementary Material
ACKNOWLEDGMENTS
We are grateful to members of the Wang and Gourse labs for helpful discussions and to Richard Gourse, Michael Cashel, Jessica DeNapoli, Sabari Thirupathy, and Kuanqing Liu for critical reading of the manuscript. We thank Lina Alsamsam for assistance with strain construction.
This work was supported by NIH grant GM084003 to J.D.W., and A.N.B. was supported by a fellowship from the GCC (T90 DA022885-05).
Footnotes
Published ahead of print 28 March 2014
Supplemental material for this article may be found at http://dx.doi.org/10.1128/JB.01471-14.
REFERENCES
- 1.Bremer H, Dennis PP. 7 October 2008. Chapter 5.2.3, Modulation of chemical composition and other parameters of the cell at different exponential growth rates. In Böck A, Curtiss R, III, Kaper JB, Karp PD, Neidhardt FC, Nyström T, Slauch JM, Squires CL, Ussery D. (ed), EcoSal—Escherichia coli and Salmonella: cellular and molecular biology. ASM Press, Washington, DC. 10.1128/ecosal.5.2.4 [DOI] [PubMed] [Google Scholar]
- 2.Dalebroux ZD, Swanson MS. 2012. ppGpp: magic beyond RNA polymerase. Nat. Rev. Microbiol. 10:203–212. 10.1038/nrmicro2720 [DOI] [PubMed] [Google Scholar]
- 3.Potrykus K, Cashel M. 2008. (p)ppGpp: still magical? Annu. Rev. Microbiol. 62:35–51. 10.1146/annurev.micro.62.081307.162903 [DOI] [PubMed] [Google Scholar]
- 4.Wendrich TM, Marahiel MA. 1997. Cloning and characterization of a relA/spoT homologue from Bacillus subtilis. Mol. Microbiol. 26:65–79. 10.1046/j.1365-2958.1997.5511919.x [DOI] [PubMed] [Google Scholar]
- 5.Nanamiya H, Kasai K, Nozawa A, Yun CS, Narisawa T, Murakami K, Natori Y, Kawamura F, Tozawa Y. 2008. Identification and functional analysis of novel (p)ppGpp synthetase genes in Bacillus subtilis. Mol. Microbiol. 67:291–304. 10.1111/j.1365-2958.2007.06018.x [DOI] [PubMed] [Google Scholar]
- 6.Srivatsan A, Han Y, Peng J, Tehranchi AK, Gibbs R, Wang JD, Chen R. 2008. High-precision, whole-genome sequencing of laboratory strains facilitates genetic studies. PLoS Genet. 4:e1000139. 10.1371/journal.pgen.1000139 [DOI] [PMC free article] [PubMed] [Google Scholar]
- 7.Lopez JM, Dromerick A, Freese E. 1981. Response of guanosine 5′-triphosphate concentration to nutritional changes and its significance for Bacillus subtilis sporulation. J. Bacteriol. 146:605–613 [DOI] [PMC free article] [PubMed] [Google Scholar]
- 8.Gallant J, Irr J, Cashel M. 1971. The mechanism of amino acid control of guanylate and adenylate biosynthesis. J. Biol. Chem. 246:5812–5816 [PubMed] [Google Scholar]
- 9.Kriel A, Bittner AN, Kim SH, Liu K, Tehranchi AK, Zou WY, Rendon S, Chen R, Tu BP, Wang JD. 2012. Direct regulation of GTP homeostasis by (p)ppGpp: a critical component of viability and stress resistance. Mol. Cell 48:231–241. 10.1016/j.molcel.2012.08.009 [DOI] [PMC free article] [PubMed] [Google Scholar]
- 10.Tagami K, Nanamiya H, Kazo Y, Maehashi M, Suzuki S, Namba E, Hoshiya M, Hanai R, Tozawa Y, Morimoto T, Ogasawara N, Kageyama Y, Ara K, Ozaki K, Yoshida M, Kuroiwa H, Kuroiwa T, Ohashi Y, Kawamura F. 2012. Expression of a small (p)ppGpp synthetase, YwaC, in the (p)ppGpp(0) mutant of Bacillus subtilis triggers YvyD-dependent dimerization of ribosome. Microbiologyopen 1:115–134. 10.1002/mbo3.16 [DOI] [PMC free article] [PubMed] [Google Scholar]
- 11.Ehrenberg M, Bremer H, Dennis PP. 2013. Medium-dependent control of the bacterial growth rate. Biochimie 95:643–658. 10.1016/j.biochi.2012.11.012 [DOI] [PubMed] [Google Scholar]
- 12.Petersen C, Moller LB. 2000. Invariance of the nucleoside triphosphate pools of Escherichia coli with growth rate. J. Biol. Chem. 275:3931–3935. 10.1074/jbc.275.6.3931 [DOI] [PubMed] [Google Scholar]
- 13.Schneider DA, Gourse RL. 2004. Relationship between growth rate and ATP concentration in Escherichia coli: a bioassay for available cellular ATP. J. Biol. Chem. 279:8262–8268. 10.1074/jbc.M311996200 [DOI] [PubMed] [Google Scholar]
- 14.Potrykus K, Murphy H, Philippe N, Cashel M. 2011. ppGpp is the major source of growth rate control in E. coli. Environ. Microbiol. 13:563–575. 10.1111/j.1462-2920.2010.02357.x [DOI] [PMC free article] [PubMed] [Google Scholar]
- 15.Mechold U, Potrykus K, Murphy H, Murakami KS, Cashel M. 2013. Differential regulation by ppGpp versus pppGpp in Escherichia coli. Nucleic Acids Res. 41:6175–6189. 10.1093/nar/gkt302 [DOI] [PMC free article] [PubMed] [Google Scholar]
- 16.Ross W, Vrentas CE, Sanchez-Vazquez P, Gaal T, Gourse RL. 2013. The magic spot: a ppGpp binding site on E. coli RNA polymerase responsible for regulation of transcription initiation. Mol. Cell 50:420–429. 10.1016/j.molcel.2013.03.021 [DOI] [PMC free article] [PubMed] [Google Scholar]
- 17.Paul BJ, Barker MM, Ross W, Schneider DA, Webb C, Foster JW, Gourse RL. 2004. DksA: a critical component of the transcription initiation machinery that potentiates the regulation of rRNA promoters by ppGpp and the initiating NTP. Cell 118:311–322. 10.1016/j.cell.2004.07.009 [DOI] [PubMed] [Google Scholar]
- 18.Barker MM, Gaal T, Josaitis CA, Gourse RL. 2001. Mechanism of regulation of transcription initiation by ppGpp. I. Effects of ppGpp on transcription initiation in vivo and in vitro. J. Mol. Biol. 305:673–688. 10.1006/jmbi.2000.4327 [DOI] [PubMed] [Google Scholar]
- 19.Krásný L, Gourse RL. 2004. An alternative strategy for bacterial ribosome synthesis: Bacillus subtilis rRNA transcription regulation. EMBO J. 23:4473–4483. 10.1038/sj.emboj.7600423 [DOI] [PMC free article] [PubMed] [Google Scholar]
- 20.Brinsmade SR, Sonenshein AL. 2011. Dissecting complex metabolic integration provides direct genetic evidence for CodY activation by guanine nucleotides. J. Bacteriol. 193:5637–5648. 10.1128/JB.05510-11 [DOI] [PMC free article] [PubMed] [Google Scholar]
- 21.Ratnayake-Lecamwasam M, Serror P, Wong KW, Sonenshein AL. 2001. Bacillus subtilis CodY represses early-stationary-phase genes by sensing GTP levels. Genes Dev. 15:1093–1103. 10.1101/gad.874201 [DOI] [PMC free article] [PubMed] [Google Scholar]
- 22.Molle V, Nakaura Y, Shivers RP, Yamaguchi H, Losick R, Fujita Y, Sonenshein AL. 2003. Additional targets of the Bacillus subtilis global regulator CodY identified by chromatin immunoprecipitation and genome-wide transcript analysis. J. Bacteriol. 185:1911–1922. 10.1128/JB.185.6.1911-1922.2003 [DOI] [PMC free article] [PubMed] [Google Scholar]
- 23.Kriel A, Brinsmade SR, Tse JL, Tehranchi AK, Bittner AN, Sonenshein AL, Wang JD. 2014. GTP dysregulation in Bacillus subtilis cells lacking (p)ppGpp results in phenotypic amino acid auxotrophy and failure to adapt to nutrient downshift and regulate biosynthesis genes. J. Bacteriol. 196:189–201. 10.1128/JB.00918-13 [DOI] [PMC free article] [PubMed] [Google Scholar]
- 24.Lopez JM. 1982. GTP pool expansion is necessary for the growth rate increase occurring in Bacillus subtilis after amino acids shift-up. Arch. Microbiol. 131:247–251. 10.1007/BF00405887 [DOI] [PubMed] [Google Scholar]
- 25.Yasbin RE, Fields PI, Andersen BJ. 1980. Properties of Bacillus subtilis 168 derivatives freed of their natural prophages. Gene 12:155–159. 10.1016/0378-1119(80)90026-8 [DOI] [PubMed] [Google Scholar]
- 26.Serror P, Sonenshein AL. 1996. CodY is required for nutritional repression of Bacillus subtilis genetic competence. J. Bacteriol. 178:5910–5915 [DOI] [PMC free article] [PubMed] [Google Scholar]
- 27.Harwood CR, Cutting SM. 1990. Molecular biological methods for Bacillus. John Wiley & Sons, Chichester, England [Google Scholar]
- 28.Vasantha N, Freese E. 1980. Enzyme changes during Bacillus subtilis sporulation caused by deprivation of guanine nucleotides. J. Bacteriol. 144:1119–1125 [DOI] [PMC free article] [PubMed] [Google Scholar]
- 29.Schneider DA, Murray HD, Gourse RL. 2003. Measuring control of transcription initiation by changing concentrations of nucleotides and their derivatives. Methods Enzymol. 370:606–617. 10.1016/S0076-6879(03)70051-2 [DOI] [PubMed] [Google Scholar]
- 30.Krásný L, Tišerová H, Jonák J, Rejman D, HŠanderová 2008. The identity of the transcription +1 position is crucial for changes in gene expression in response to amino acid starvation in Bacillus subtilis. Mol. Microbiol. 69:42–54. 10.1111/j.1365-2958.2008.06256.x [DOI] [PubMed] [Google Scholar]
- 31.Tojo S, Satomura T, Kumamoto K, Hirooka K, Fujita Y. 2008. Molecular mechanisms underlying the positive stringent response of the Bacillus subtilis ilv-leu operon, involved in the biosynthesis of branched-chain amino acids. J. Bacteriol. 190:6134–6147. 10.1128/JB.00606-08 [DOI] [PMC free article] [PubMed] [Google Scholar]
- 32.Kobayashi K, Ehrlich SD, Albertini A, Amati G, Andersen KK, Arnaud M, Asai K, Ashikaga S, Aymerich S, Bessieres P, Boland F, Brignell SC, Bron S, Bunai K, Chapuis J, Christiansen LC, Danchin A, Debarbouille M, Dervyn E, Deuerling E, Devine K, Devine SK, Dreesen O, Errington J, Fillinger S, Foster SJ, Fujita Y, Galizzi A, Gardan R, Eschevins C, Fukushima T, Haga K, Harwood CR, Hecker M, Hosoya D, Hullo MF, Kakeshita H, Karamata D, Kasahara Y, Kawamura F, Koga K, Koski P, Kuwana R, Imamura D, Ishimaru M, Ishikawa S, Ishio I, Le Coq D, Masson A, Mauel C, Meima R, et al. 2003. Essential Bacillus subtilis genes. Proc. Natl. Acad. Sci. U. S. A. 100:4678–4683. 10.1073/pnas.0730515100 [DOI] [PMC free article] [PubMed] [Google Scholar]
- 33.Bennett BD, Kimball EH, Gao M, Osterhout R, Van Dien SJ, Rabinowitz JD. 2009. Absolute metabolite concentrations and implied enzyme active site occupancy in Escherichia coli. Nat. Chem. Biol. 5:593–599. 10.1038/nchembio.186 [DOI] [PMC free article] [PubMed] [Google Scholar]
- 34.Paul BJ, Ross W, Gaal T, Gourse RL. 2004. rRNA transcription in Escherichia coli. Annu. Rev. Genet. 38:749–770. 10.1146/annurev.genet.38.072902.091347 [DOI] [PubMed] [Google Scholar]
- 35.Belitsky BR, Sonenshein AL. 2011. CodY-mediated regulation of guanosine uptake in Bacillus subtilis. J. Bacteriol. 193:6276–6287. 10.1128/JB.05899-11 [DOI] [PMC free article] [PubMed] [Google Scholar]
- 36.Shivers RP, Sonenshein AL. 2004. Activation of the Bacillus subtilis global regulator CodY by direct interaction with branched-chain amino acids. Mol. Microbiol. 53:599–611. 10.1111/j.1365-2958.2004.04135.x [DOI] [PubMed] [Google Scholar]
- 37.Bartlett MS, Gaal T, Ross W, Gourse RL. 1998. RNA polymerase mutants that destabilize RNA polymerase-promoter complexes alter NTP-sensing by rrn P1 promoters. J. Mol. Biol. 279:331–345. 10.1006/jmbi.1998.1779 [DOI] [PubMed] [Google Scholar]
- 38.Murphy H, Cashel M. 2003. Isolation of RNA polymerase suppressors of a (p)ppGpp deficiency. Methods Enzymol. 371:596–601. 10.1016/S0076-6879(03)71044-1 [DOI] [PubMed] [Google Scholar]
- 39.Zuo Y, Wang Y, Steitz TA. 2013. The mechanism of E. coli RNA polymerase regulation by ppGpp is suggested by the structure of their complex. Mol. Cell 50:430–436. 10.1016/j.molcel.2013.03.020 [DOI] [PMC free article] [PubMed] [Google Scholar]
- 40.Zhou YN, Jin DJ. 1998. The rpoB mutants destabilizing initiation complexes at stringently controlled promoters behave like “stringent” RNA polymerases in Escherichia coli. Proc. Natl. Acad. Sci. U. S. A. 95:2908–2913. 10.1073/pnas.95.6.2908 [DOI] [PMC free article] [PubMed] [Google Scholar]
- 41.Scott M, Gunderson CW, Mateescu EM, Zhang Z, Hwa T. 2010. Interdependence of cell growth and gene expression: origins and consequences. Science 330:1099–1102. 10.1126/science.1192588 [DOI] [PubMed] [Google Scholar]
- 42.Henkin TM. 2002. Ribosomes, protein synthesis factors, and tRNA synthetases, p 313–322 In Sonenshein AL. (ed), Bacillus subtilis and its closest relatives: from genes to cells. ASM Press, Washington, DC [Google Scholar]
- 43.Samarrai W, Liu DX, White AM, Studamire B, Edelstein J, Srivastava A, Widom RL, Rudner R. 2011. Specificity and control of uptake of purines and other compounds in Bacillus subtilis. J. Bacteriol. 193:723–733. 10.1128/JB.00708-10 [DOI] [PMC free article] [PubMed] [Google Scholar]
- 44.Sojka L, Kouba T, Barvík I, Šanderová H, Maderová Z, Jonák J, Krásný L. 2011. Rapid changes in gene expression: DNA determinants of promoter regulation by the concentration of the transcription initiating NTP in Bacillus subtilis. Nucleic Acids Res. 39:4598–4611. 10.1093/nar/gkr032 [DOI] [PMC free article] [PubMed] [Google Scholar]
- 45.Antoun A, Pavlov MY, Andersson K, Tenson T, Ehrenberg M. 2003. The roles of initiation factor 2 and guanosine triphosphate in initiation of protein synthesis. EMBO J. 22:5593–5601. 10.1093/emboj/cdg525 [DOI] [PMC free article] [PubMed] [Google Scholar]
- 46.Gromadski KB, Wieden HJ, Rodnina MV. 2002. Kinetic mechanism of elongation factor Ts-catalyzed nucleotide exchange in elongation factor Tu. Biochemistry 41:162–169. 10.1021/bi015712w [DOI] [PubMed] [Google Scholar]
- 47.Katunin VI, Savelsbergh A, Rodnina MV, Wintermeyer W. 2002. Coupling of GTP hydrolysis by elongation factor G to translocation and factor recycling on the ribosome. Biochemistry 41:12806–12812. 10.1021/bi0264871 [DOI] [PubMed] [Google Scholar]
- 48.Zavialov AV, Buckingham RH, Ehrenberg M. 2001. A posttermination ribosomal complex is the guanine nucleotide exchange factor for peptide release factor RF3. Cell 107:115–124. 10.1016/S0092-8674(01)00508-6 [DOI] [PubMed] [Google Scholar]
- 49.Tojo S, Kumamoto K, Hirooka K, Fujita Y. 2010. Heavy involvement of stringent transcription control depending on the adenine or guanine species of the transcription initiation site in glucose and pyruvate metabolism in Bacillus subtilis. J. Bacteriol. 192:1573–1585. 10.1128/JB.01394-09 [DOI] [PMC free article] [PubMed] [Google Scholar]
- 50.Denapoli J, Tehranchi AK, Wang JD. 2013. Dose-dependent reduction of replication elongation rate by (p)ppGpp in Escherichia coli and Bacillus subtilis. Mol. Microbiol. 88:93–104. 10.1111/mmi.12172 [DOI] [PMC free article] [PubMed] [Google Scholar]
- 51.Gallant J, Harada B. 1969. The control of ribonucleic acid synthesis in Escherichia coli. 3. The functional relationship between purine ribonucleoside triphosphate pool sizes and the rate of ribonucleic acid accumulation. J. Biol. Chem. 244:3125–3132 [PubMed] [Google Scholar]
- 52.Beaman TC, Hitchins AD, Ochi K, Vasantha N, Endo T, Freese E. 1983. Specificity and control of uptake of purines and other compounds in Bacillus subtilis. J. Bacteriol. 156:1107–1117 [DOI] [PMC free article] [PubMed] [Google Scholar]
- 53.Saxild HH, Nygaard P. 1991. Regulation of levels of purine biosynthetic enzymes in Bacillus subtilis: effects of changing purine nucleotide pools. J. Gen. Microbiol. 137:2387–2394. 10.1099/00221287-137-10-2387 [DOI] [PubMed] [Google Scholar]
- 54.Lehninger AL, Nelson DL, Cox MM. 2000. Principles of Biochemistry. Worth Publisher Inc., New York, NY [Google Scholar]
- 55.Gaca AO, Kajfasz JK, Miller JH, Liu K, Wang JD, Abranches J, Lemos JA. 2013. Basal levels of (p)ppGpp in Enterococcus faecalis: the magic beyond the stringent response. mBio 4:e00646–13. 10.1128/mBio.00646-13 [DOI] [PMC free article] [PubMed] [Google Scholar]
Associated Data
This section collects any data citations, data availability statements, or supplementary materials included in this article.