Summary
Quantifying protein and RNA expression within specific cell populations in vivo is an essential step in unraveling the complex mechanisms of neurological disease. The challenges associated with studying human brain tissue is commonly compounded by variations in post-mortem interval, formalin fixation time, and tissue processing among others. The result is a sample population that is inherently heterogeneous, requiring a single protocol that is sensitive to low levels of antigen while minimizing background and non-specific staining. Here, we describe a single immunohistochemistry (IHC) protocol on formalin fixed paraffin embedded human cortex which can be adapted to 1) quantify the relative protein expression of the chemokine receptor, CXCR4, using multispectral image (MSI) or 2) isolate neuronal RNA through automated laser capture microdissection (LCM).
Keywords: chemokine, CXCR4, multispectral imaging, immunohistochemistry, human cortex, neuron, quantitative, LCM, laser capture microdissection
1. Introduction
The protocol described is designed to measure protein and RNA expression of the chemokine receptor, CXCR4, using multispectral imaging and automated laser capture microdissection, respectively. Both protocols are based on a an immunohistochemistry protocol designed for optimal antigen retrieval and minimal non-specific staining among 20 human tissue samples stained and analyzed within a single batch. Because of the variability, both inherent to a human population and introduced by differing fixation protocols, particular attention is taken to thoroughly block all sources of non-specific staining and cross reaction between antibodies and respective chromogens (1–3). Depending on the specific samples used, incubation and wash times may be reduced without affecting staining quality. The following protocol should be optimized according to the specific tissue and antibodies used.
2. Materials
2.1 Reagents
All solutions, unless otherwise specified, are prepared using purified deionized water with a resistance of 18 MΩ cm and <5ppb TOC (total oxidizable content) at 25°C. Phosphate buffered saline (PBS) is a commonly used diluent in immunohistochemistry (IHC), however, because phosphate containing buffers should not be used with alkaline-phosphatase conjugated antibodies tris buffered saline TBS is used instead. All uses of TBS refer to the working concentration of Tris buffered saline, pH 7.4, described in IHC reagents. Many of the reagents used, particularly chromogens, are toxic and must be handled and disposed of properly. All IHC techniques, unless otherwise specified, should be carried out in a well-ventilated chemical fume hood.
2.2 Equipment & software
Nuance® multispectral imaging system with Nuance® version 2.1 software (Cri, Woburn, MA, USA).
Zeiss MicroBeam IV with RoboSoftware version 4.2 Pro SP2 and AxioVision Release 4.8.1 (Carl Zeiss Microscopy, Thornwood, NY, USA).
2.3 Immunohistochemistry
Coplin jars & slide rack, (Tissue-Tek®).
Shandon xylene substitute, (Thermo-Scientific) (see Note 1).
Ethyl Alcohol, 200 proof (see Note 2).
Target retrieval solution,10X concentrate, (Dako).
PAP hydrophobic barrier pen, (VWR).
Avidin/Biotin blocking kit, (Vector Labs).
Normal donkey serum (NDS), (Jackson ImmunoResearch) (see Note 3).
Mouse monoclonal anti-MAP2A/B, clone AP20, IgG1, (Chemicon/Millipore).
Mouse monoclonal anti-CXCR4, clone 12G5, IgG2A, (R&D Systems).
Biotin-SP-conjugated AffiniPure Donkey Anti-mouse IgG (H+L) secondary antibody, (Jackson ImmunoResearch).
Avidin biotin complex amplification solution horseradish peroxidase (ABC), (Vector Labs).
Avidin biotin complex amplification solution alkaline phosphatase, ABC-AP, (Vector Labs).
Levomisole, (Vector Labs).
Vector® NovaRED™ substrate kit for peroxidase, (Vector Labs) (see Note 4).
Vector®Blue alkaline phosphatase substrate kit III, (Vector Labs).
VectaMount™ permanent mounting medium, (Vector Labs).
Tris-buffered saline (TBS) pH 7.4 (10X stock solution): Add about 950ml of water to a 1 L beaker and place on a stir plate with a stir bar. Slowly add 60.6g of Trizma® hydrochloride, 13.9g of Trizma® base and 87.7g of NaCl and allow to mix into solution. Adjust pH to 7.4 with HCl and add additional water to a final volume of 1 Liter. Store at RT and dilute 1:10 with water for working solution.
Endogenous peroxide quenching solution (H2O2/MeOH): 25ml MeOH, 25ml 30% hydrogen peroxide, 200ml TBS.
Blocking buffer: 900ul TBS, 100ul NDS, 20mg non-fat dry milk, 20mg bovine serum albumin.
3. Methods
Carry out all procedures at room temperature unless otherwise specified. Perform dehydration, rehydration and coverslip mounting steps in a properly ventilated fume hood. Label slides with pencil or a solvent resistant marker. Once the tissue specimen has been rehydrated, ensure that it does not dry out between washes or incubations. Include additional, single stain slides, as controls for each individual chromogen and appropriate negative controls to determine non-specific binding.
3.1 Immunohistochemistry-MAP2 staining
-
Fill seven coplin jars with 250 ml with respective solution (two jars with xylene, four jars with ethanol of decreasing concentrations (100%, 95%, 90%, 70%) and the final jar with TBS. Perform a series of sequential incubations as indicated. Take care to minimize carryover of solution from one coplin jar to the next (see Note 5):
xylene - 30 min
xylene - 5 min
100% EtOH – 5 min
95% EtOH – 5 min
90% EtOH – 5 min
70% EtOH – 5 min
TBS – 5 min
Prepare H2O2/MeOH shortly before use and incubate slides for 30 min followed by a 5 minute incubation in TBS (see Note 6).
Prepare the heat induced antigen retrieval by adding 25 ml of target retrieval solution solution and 225 ml of H2O to a coplin jar. Submerge the slide rack into the coplin jar and cover with lid. Carefully place the coplin jar into a hot water bath at 95°C, ensuring no water is able to enter the jar. Incubate in hot water bath for 1 hour, then remove jar and let stand at room temperature for an additional 30 min. Next, perform three, 5 minute washes in TBS.
Apply a hydrophobic barrier around the tissue specimen on each slide using a PAP pen (see Note 7).
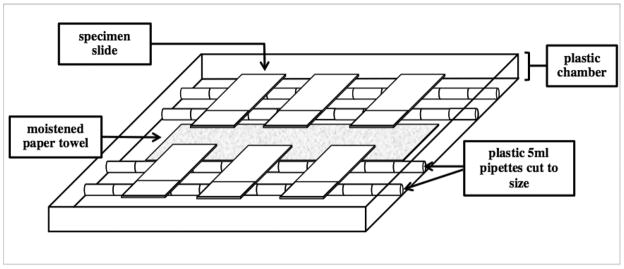
Remove slides from the slide rack and place in the humidity chamber. Humidity chambers can be purchased through commercial vendors (ie Fisher Scientific) or self assembled (Figure 1). Add avidin blocking solution dropwise until the entire specimen surface is covered. Incubate for 20–30 min. Briefly rinse samples in TBS and add biotin blocking solution dropwise until the entire specimen is covered. Incubate for 20–30 min.
Remove biotin blocking solution by gently tapping the slide in a plastic surface and add blocking buffer without a wash between incubations. Ensure the volume of blocking buffer is sufficient to cover entire surface of the tissue specimen (approximately 250 μl). Incubate for 1 hour at room temperature in the humidity chamber.
Remove blocking buffer by gently tapping and add primary antibody (anti-MAP2, Chemicon), diluted 1:250 in blocking buffer without a wash between incubations.
Ensure the humidity chamber has adequate moisture by adding additional water if necessary then cover with lid and seal with Parafilm. Incubate overnight at 4°C.
Place slides in rack and submerge in TBS for 5 min. Repeat twice. During washes, dilute biotinylated secondary antibody in TBS at 1:250.
Apply diluted secondary antibody and incubate for 1–2 hours @ room temperature in humidity chamber.
Prior to the end of the secondary antibody incubation, begin preparation of the avidin-biotin complex (ABC) according to the manufacturers instructions (see Note 8). Let ABC reagent incubate at room temperature for 20–30 minutes at room temperature.
After the secondary incubation, place slides back in the rack and submerge in TBS for 5 minutes. Repeat 2 more times. Return slides to the humidity chamber and add approximately 250ul of ABC to each slide, careful to cover entire specimen surface. Incubate for 20–30 minutes at room temperature in humidity chamber. Place slides into rack and wash in TBS for 5 minutes at room temperature. Repeat 2 more times.
Prepare the NovaRED chromogen immediately prior to use according to the manufacturers instructions (see Note 9). Place slides in the humidity chamber and apply 250 μl of NovaRED to each sample. It is important to work quickly and accurately time the chromogen development. Depending of the antigen of interest, development times will vary. In our hands, a 3–5 minute development of NovaRED results in detection in all samples without over-staining.
Return slides to rack and submerge in water for 3 minutes. Repeat once. After the first stain is completed, the slides are ready to begin the blocking steps before the second primary antibody. Importantly, do not dehydrate the slides or wash with ethanol.
Figure 1.
3.2 Immunohistochemistry-CXCR4 staining
-
1
Remove slides from the slide rack and place in the humidity chamber. Add Avidin blocking solution dropwise until the entire specimen surface is covered. Incubate for 20–30 min. Briefly rinse samples in TBS and add Biotin blocking solution dropwise until the entire specimen is covered. Incubate for 20–30 min.
-
2
Remove biotin blocking solution by gently tapping the slide in a plastic surface and add blocking buffer without a wash between incubations. Ensure the volume of blocking buffer is sufficient to cover entire surface of the tissue specimen (approximately 250 μl). Incubate for 1 hour at room temperature in the humidity chamber.
-
3
Remove blocking buffer by gently tapping and add the second primary antibody (anti-CXCR4), diluted in blocking buffer without a wash between incubations.
-
8
Ensure the humidity chamber has adequate moisture by adding additional water if necessary then cover with lid and seal with Parafilm. Incubate overnight at 4°C.
-
9
Place slides in rack and submerge in TBS for 5 min. Repeat twice. During washes, dilute biotinylated secondary antibody (Donkey anti-mouse) in TBS at 1:250.
-
10
Apply diluted secondary antibody and incubate for 1–2 hours @ room temperature in humidity chamber.
-
11
Prior to the end of the secondary antibody incubation, begin preparation of the avidin-biotin complex (ABC-AP) according to the manufacturers instructions. Let ABC-AP reagent incubate at room temperature for 20–30 minutes at room temperature in the dark.
-
12
Prepare the VectorBlue chromogen immediately prior to use according to the manufacturers instructions, ensuring the developing is protected from light (see Note 10). Place slides in the humidity chamber and apply 250 μl of VectorBlue to each sample. It is important to work quickly and accurately time the chromogen development. Depending of the antigen of interest, development times will vary. In our hands, a 10 minute development of VectorBlue results in detection in all samples without over-staining.
-
13
Return slides to rack and submerge in water for 3 minutes. Repeat once. The slides can then be de-hydrated and cleansed through a series of ethanol and xylene incubations as indicated below (see Note 11):
70% EtOH – 5 min
80% EtOH – 5 min
90% EtOH – 5 min
100% EtOH – 10 min
100% EtOH – 20 min
xylene– 5 min
xylene – 5 min
-
14
Remove slides from rack and wipe residual xylene from the bottom surface with a kimwipe and tilt slide to allow excess xylene on the top of the slide to bead at a corner and absorb it with a kimwipe (see Note 12).
-
15
Apply a drop of an aqueous mounting media such as VectaMount to the center of the tissue specimen. Gently lower the coverslip onto the surface to prevent air bubbles from forming under the glass. Allow slides to air-dry overnight before the mounting media dries (see Note 13).
3.3 Multispectral Imaging
The theory behind multispectral imaging and a comprehensive description of the Nuance 2.1 software can be found at the manufacturers site (www.cri.com). The authors will provide instructions for this specific protocol and advise users to modify the protocol accordingly, as required by their specific purpose. Briefly, each antibody chromogen complex has a specific color (i.e. blue or red) and that color has a characteristic absorption spectrum. When two chromogens are used simultaneously in a single stain (with proper blocking) the discrete absorption spectra of each antibody-chromogen complex can be digitally separated or unmixed from one another. This allows one to accurately measure and quantify the degree of co-localization as well as determine the relative amount of each respective protein.
The basic use of the Nuance system is covered thoroughly by the manufacturer and will not be repeated here. Instead, we will describe the particular camera settings and steps that are used to provide a relative measure of CXCR4 expression within cortical neurons using this protocol.
-
Initial camera settings for Nuance camera are the following:
Acquire Tab: Brightfield
Binning: 1×1, Region of Interest: Full
Use Custom Wavelengths and Exposers: Activated
Filter/Wavelength Selection: Start: 420, Step:20, End: 720; Narrow: Activated
Convert to Optical Density (OD): Activated
Using the 40X objective, find a representative area of tissue on the dual stained slide and take a picture using the “Autoexpose Cube” function. Once completed, position objective over an area of the slide with no tissue and use the “Acquire Reference” function.
Next, place the single stained MAP2 slide in the microscope and focus on the area of interest, select “Acquire Cube.” Under the “Spectra” tab, sample the absorption spectra and label it “MAP2/NovaRed”.
Repeat the process with the single stained CXCR4 slide and label the absorption spectra “CXCR4/VectorBlue.” Save the spectral library as “NovaRed/Vector Blue Library,” and protocol settings. (see Note 14)
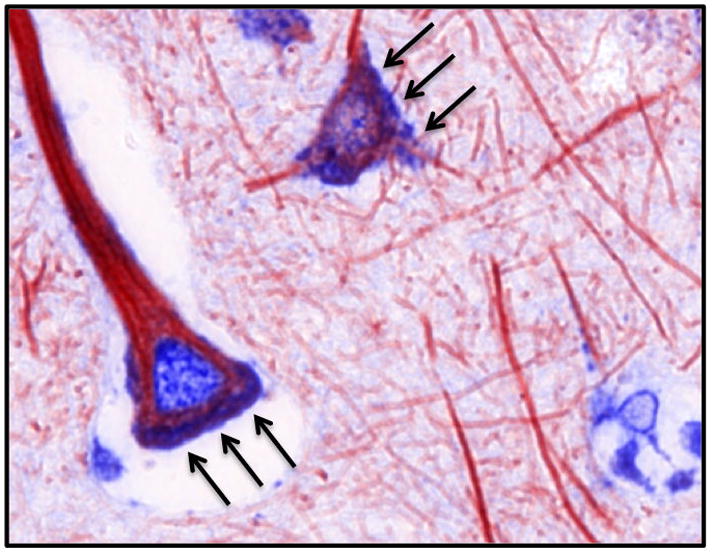
Once completed, the dual stained slides can be imaged using the “Acquire Cube” function and unmixed using the spectral library (Figure 2).
Once the image cube is unmixed four images will be present, the unmixed image cube (Figure 3A), a grey scale image of the unmixed NovaRed MAP2 spectrum (Figure 3B), a grey scale image of the unmixed VectorBlue CXCR4 spectrum (Figure 3D) and a composite, pseudo-color image of the two unmixed spectra (Figure 3F).
Select the NovaRed MAP2 spectrum window (Figure 3A), and open the measure tab of the Nuance software. Set the minimum connected pixel value to 1000. Using the optical density for MAP2, set the threshold (automatically or my hand) to identify the regions of interest, (i.e. cortical neurons). The result will be a digital cropping of the MAP2+ cortical neurons (Figure 3C) (see Note 15).
Once the neurons have been digitally cropped as regions of interest, save measurement regions (using a right mouse click pulldown command list). Open the VectorBlue CXCR4 spectum window (Figure 3D) and paste the saved measurement regions.
Now, the regions of interest, which correspond to the neurons, are superimposed over the VectorBlue CXCR4 spectrum (Figure 3E). Each ROI is now represented with a series of region measurements (Table 1). A portion of the region measurements are presented below (adapted from Cri users manual for Nuance 2.1.).
Figure 2.
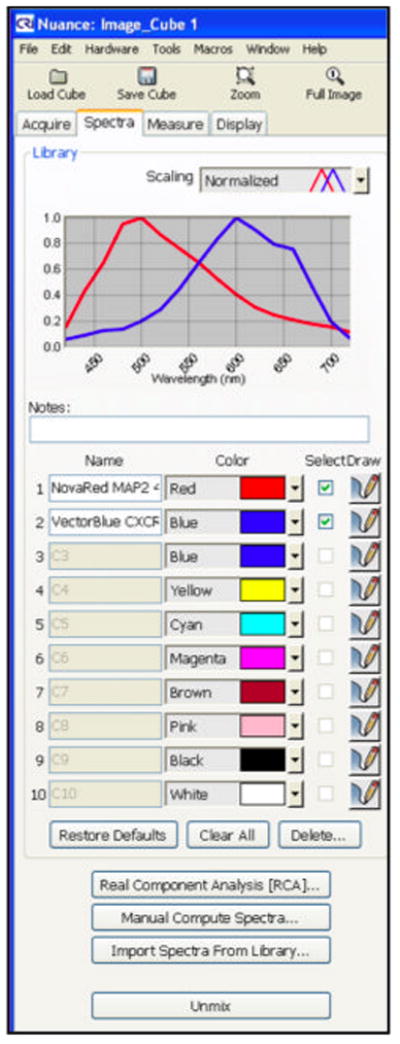
Figure 3.
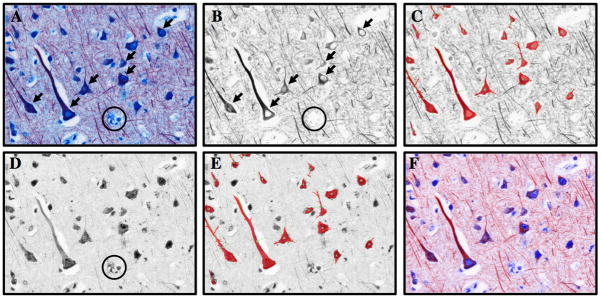
Table 1.
| ROI # | Total Signal (OD) |
Avg. Signal (OD) |
Standard Deviation (OD) |
Max Signal (OD) |
Area (Pixels) |
Area (μm2) | Major Axis |
Minor Axis |
X Location | Y location | Spectrum ID | Threshold | Min Connected |
|---|---|---|---|---|---|---|---|---|---|---|---|---|---|
| 1 | 4552.29 | 0.268873 | 0.0935855 | 0.562295 | 16931 | 65093.91 | 598.726 | 96.724 | 383.43 | 644.019 | VectorBlue CXCR4 40X | 0 | 1000 |
| 2 | 2218.21 | 0.237623 | 0.111994 | 0.53121 | 9335 | 35889.89 | 399.819 | 81.406 | 131.259 | 687.221 | VectorBlue CXCR4 40X | 0 | 1000 |
| 3 | 1487.03 | 0.282597 | 0.100695 | 0.488881 | 5262 | 20230.59 | 141.88 | 137.55 | 583.211 | 621.952 | VectorBlue CXCR4 40X | 0 | 1000 |
| 4 | 1580.72 | 0.318116 | 0.1125 | 0.58583 | 4969 | 19104.11 | 105.064 | 81.3826 | 864.734 | 545.146 | VectorBlue CXCR4 40X | 0 | 1000 |
| 5 | 1543.66 | 0.35131 | 0.0771617 | 0.536753 | 4394 | 16893.43 | 107.716 | 65.3602 | 932.881 | 296.536 | VectorBlue CXCR4 40X | 0 | 1000 |
| 6 | 636.222 | 0.189296 | 0.101757 | 0.444176 | 3361 | 12921.9 | 214.286 | 84.966 | 852.98 | 390.393 | VectorBlue CXCR4 40X | 0 | 1000 |
| 7 | 1184.04 | 0.378651 | 0.114355 | 0.603569 | 3127 | 12022.25 | 83.2953 | 54.8585 | 1149.97 | 197.181 | VectorBlue CXCR4 40X | 0 | 1000 |
| 8 | 1030.03 | 0.423358 | 0.118829 | 0.605729 | 2433 | 9354.054 | 84.3596 | 56.4143 | 1208.73 | 667.386 | VectorBlue CXCR4 40X | 0 | 1000 |
| 9 | 796.435 | 0.329242 | 0.0712924 | 0.489915 | 2419 | 9300.229 | 76.7109 | 50.346 | 27.5308 | 405.687 | VectorBlue CXCR4 40X | 0 | 1000 |
| 10 | 973.827 | 0.408827 | 0.11675 | 0.612854 | 2382 | 9157.977 | 89.9736 | 52.6041 | 969.739 | 749.785 | VectorBlue CXCR4 40X | 0 | 1000 |
| 11 | 514.622 | 0.252885 | 0.103562 | 0.50358 | 2035 | 7823.88 | 117.308 | 36.9643 | 74.6747 | 195.713 | VectorBlue CXCR4 40X | 0 | 1000 |
| 12 | 698.828 | 0.364163 | 0.0738177 | 0.551445 | 1919 | 7377.899 | 72.7532 | 45.882 | 724.166 | 227.858 | VectorBlue CXCR4 40X | 0 | 1000 |
| 13 | 506.677 | 0.296997 | 0.0987565 | 0.483302 | 1706 | 6558.987 | 99.7813 | 32.7905 | 422.746 | 187.652 | VectorBlue CXCR4 40X | 0 | 1000 |
| 14 | 438.033 | 0.26261 | 0.151042 | 0.521978 | 1668 | 6412.89 | 109.748 | 63.541 | 214.25 | 63.503 | VectorBlue CXCR4 40X | 0 | 1000 |
| 15 | 362.871 | 0.238574 | 0.0991011 | 0.424898 | 1521 | 5847.726 | 103.633 | 52.8815 | 778.871 | 110.283 | VectorBlue CXCR4 40X | 0 | 1000 |
| 16 | 452.315 | 0.307071 | 0.0752889 | 0.452115 | 1473 | 5663.182 | 65.0203 | 42.9909 | 766.887 | 416.155 | VectorBlue CXCR4 40X | 0 | 1000 |
| 17 | 361.788 | 0.293183 | 0.123844 | 0.485235 | 1234 | 4744.309 | 113.935 | 24.1783 | 51.4733 | 919.497 | VectorBlue CXCR4 40X | 0 | 1000 |
| 18 | 347.232 | 0.31114 | 0.128388 | 0.475731 | 1116 | 4290.639 | 82.6132 | 37.5555 | 294.694 | 9.87007 | VectorBlue CXCR4 40X | 0 | 1000 |
Region Measurements
Region of interest: The numerical label assigned to each object (1, 2, 3, …)
Total Signal (OD): The sum of optical density values for each pixel within a region of interest.
Average Signal (OD): The average optical density per pixel within a region of interest.
Standard Deviation (OD): A measure of variation in optical density within a region of interest.
Max Signal (OD): The greatest optical density value within a single region of interest.
Area (pixels): The number of pixels within a region of interest.
Area (μm2): The number of square microns within a region of interest. This requires additional calibration.
Major Axis: The length of the minimum area bounding box enclosing the region.
Minor Axis: The width of the minimum area bounding box enclosing the region.
X Location: Is the center of gravity’s x coordinate.
Y Location: Is the center of gravities y coordinate.
Spectrum ID: The spectrum (from the spectral library) used to unmix the image.
Threshold: Pixels with an OD value below the set threshold will be ignored. We generate our measurements using a threshold value of zero and compared the fold difference between OD values between two conditions.
Min. Connected: A size threshold set by the user on the smallest number of continuous pixels allowed into the analysis. No region of interest will have a area (pixels) below the minimum connected threshold. This is a useful way to eliminated small artifacts within the visual field.
-
10
We use Average Signal (OD) of CXCR4 (or other protein of interest) as the primary measurement endpoint, but other measures such as Max. Signal or Total Signal may be more appropriate depending on the specific question of interest.
-
11
A pseudo colored composite of the dual staining demonstrates strong, punctate neuronal CXCR4 staining in the cell body.
3.4 Laser Capture Microdissection
Laser capture microdissection has become an important technique for harvesting specific tissue regions or cell populations for protein or RNA isolation. When applying this technology to large-scale studies however, automation becomes a necessary component. We have developed one strategy for automated neuron identification and capture and present the guidelines for adapting our technique to fit broader applications. Importantly, this protocol assumes the user has a working knowledge of laser capture microdissection, the software interface, and routine functions such as laser and stage calibration. Our purpose is to detail the process of automating object identification and capture, using the common neuronal marker, MAP2.
Slides are prepared according to step 3.1 IHC-MAP2. Following development with NovaRed, rinse slides thoroughly in RNAse free water.
Open PALMRobo Software, select appropriate camera (AxioCamICc1) and set light intensity to 3200K (see Note 16). Ensure the light aperture is centered and fully opened before setting the White Balance and Shading Control. Light intensity can be adjusted with polarized filters or Analog Gain without changing the relative color composition and should be used in place of Light Intensity %.
Take a standard RGB image of a representative slide preparation in the PALMRobo Software suite at the appropriate magnification. (see Note 17). Save this file to the desktop as it will be used to fine tune the script outlined in Figure 5. For this protocol, we will name this image “Novared MAP2+ 20X” to indicate the chromogen, marker of interest and the magnification.
Open AxioVision software and enter the Script Editor. Enter the commands, thresholds and parameters outlined in Figure 5. The script is applied to a single neuron in Figure 6 or a collection of neurons in Figure 7. The ability to eliminate extraneous regions, based on color intensity or region size is essential to prevent glial contamination. The script can be tested and modified by the user in the software, depending on slight variation in protocol or specific interests of the user. Indicate the chromogen, marker of interest and the magnification to prevent confusion with other scripts. Save the script as “Capture NovaRed MAP2+ 20X.ziscrpit”. Close Axiovision.
Open PalmRobo software and import “Capture NovaRed MAP2+ 20X.ziscrpit” into the Field of View Analysis pull-down menu by accessing Adjustments menu -> PalmRobo… -> FoV Script Assignment. The Field of View (FoV) Script Assignment allows you to assign the custom script “Capture NovaRed MAP2+ 20X.ziscrpit”.
Enter the PalmRobo Navigator function and define the rectangular region of interest using the Set ROI-top-left & Set ROI bottom-right functions. Under AxioVision Analyze tab, use the Analyze scripts pulldown tab to select “Capture NovaRed MAP2+ 20X”. Select Analyze ROI to begin the scan. Depending on the area of the region of interest, magnification and number of objects, the scan can last multiple hours. This step can be scaled up, or down depending on the amount of RNA needed. An example of a completed scan, with pseudo colored objects (ie MAP2+ neurons) is seen in Figure 8.
(Optional RNA amplification) The amount of RNA collected can vary greatly depending on the condition of the material used. In cases where the yield is insufficient, we have used a commercially available mRNA amplification kit (SMART mRNA Amplification Kit, Clontech).
Figure 5.
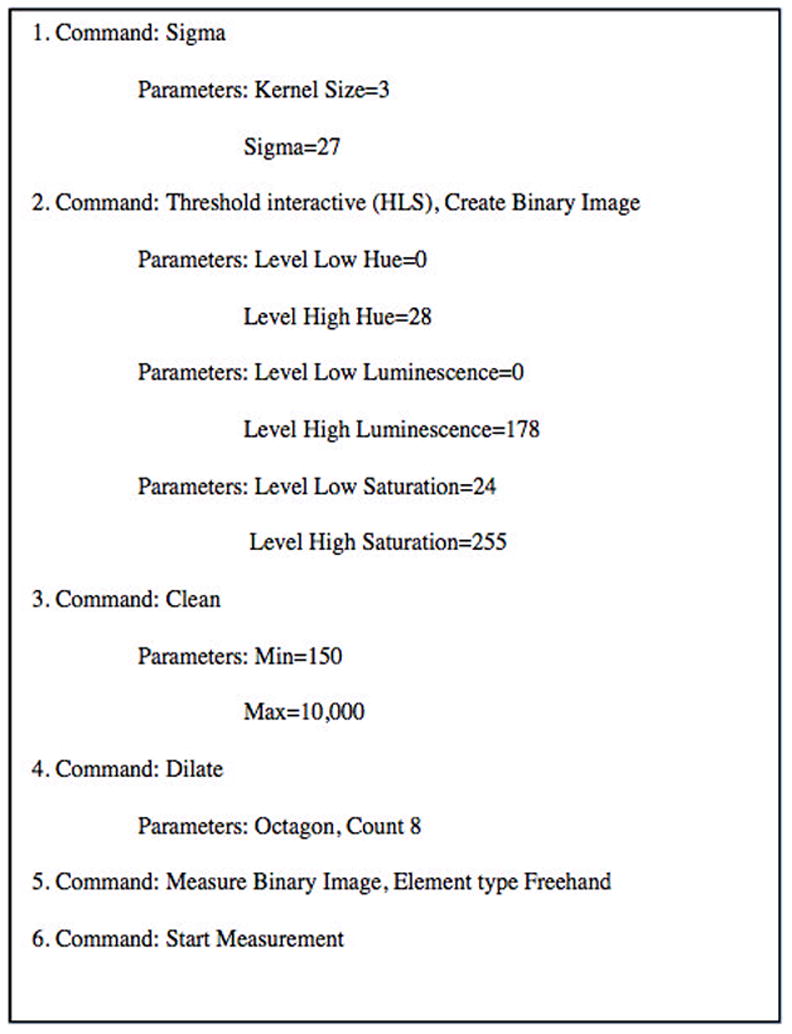
Figure 6.

Figure 7.
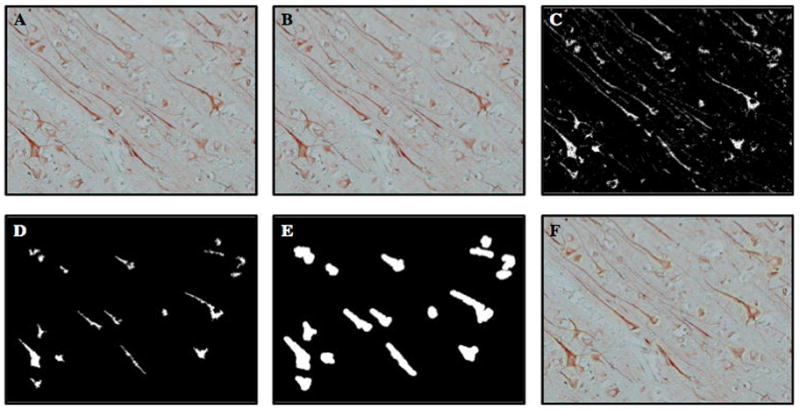
Figure 8.
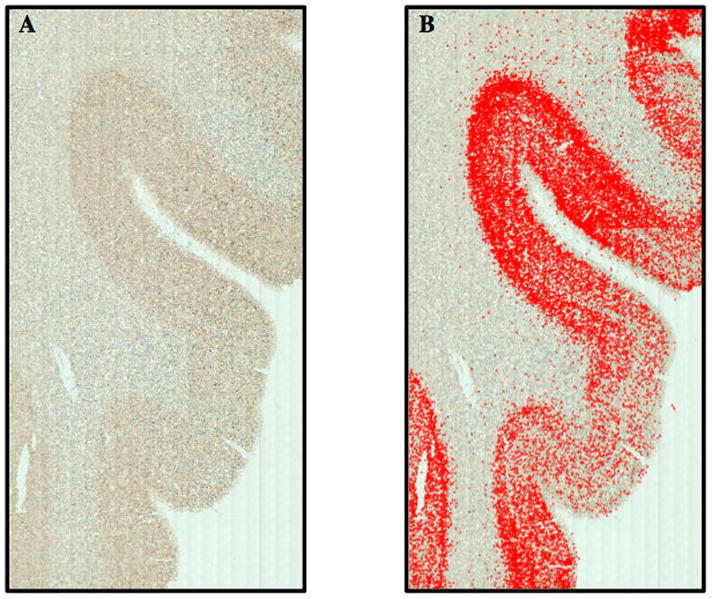
Figure 4.
Acknowledgments
This work was supported by National Institute of Health-National Institute on Drug Abuse Grants DA15014 and DA19808 (OM). Jonathan Pitcher was a student fellow of the neuroAIDS training grant Interdisciplinary and Translational Research Training Program in neuroAIDS (T32MH078795).
Footnotes
Xylene substitutes (i.e. Histosolve) are commonly used petroleum-based solvents that have a reduced risk of inhalation toxicity. For the sake of clarity, we refer to xylene substitutes simply as xylene.
Denatured ethanol may contain additives capable of interfering with some staining protocols or down stream applications. If using denatured alcohol, check the specific additive to ensure it is compatible.
The serum used in the blocking buffer should be from the same species used to create the secondary antibody. Therefore, we use normal donkey serum and a biotin conjugated donkey anti-mouse secondary antibody.
Select chromogens to prevent overlap in the absorbance spectrum. The broad absorption spectra can overlap and introduce error during multispectral image analysis. Because of the broad absorption spectra of chromogens, the number of chromogens that can be used simultaneously within a single slide preparation is considered to be three. In our hands, the error introduced by adding a third chromogen negates any added benefit. We strongly recommend limiting chromogens to two in most instances. Importantly, treat all chromogens as carcinogenic and dispose of accordingly.
Xylene substitute and EtOH solutions can be reused (depending on the number of samples and time between uses) but the authors recommend using fresh solutions each time for optimal results.
Endogenous peroxidase within the tissue may non-specifically catalyze the precipitation of chromogen. The “quenching” of endogenous peroxidase can be performed with an incubation of H2O2 and methanol is added to enhance the reaction. The concentration of H2O2 and methanol can be increased to shorten incubation time, but may result in damage to fragile tissues.
To prevent specimens from drying while applying the hydrophobic barrier, each slide can be individually pulled (using forceps) from the slide rack during the step #3 washes. After pulling the slide, gently tap it on a plastic surface to quickly remove excess TBS. Apply the PAP pen to the dry glass surface, while the tissue still retains moisture and return to the slide rack. Ensure the hydrophobic barrier is dry before submerging in TBS.
The ABC greatly increases sensitivity of antigen detection; therefore it is recommended but not required depending on the abundance and retrieval of a given antigen. In order to prevent cross-reaction between the two avidin-biotin amplifications steps (ABC and ABC-AP) we use a hydrogen peroxidase based ABC for the first antigen and an alkaline phosphatase based ABC for the second antigen. Hydrogen peroxidase based ABC is more sensitive and results in a sharper chromogen precipitate, while the alkaline phosphatase is less sensitive and results in a more diffuse precipitate. We use the hydrogen peroxidase ABC first, to amplify the more abundant antigen, because some precipitate will be washed away during the remaining washes and incubations. Importantly, some chromogen substrates, most notably DAB, form a shell around the antigen of interest that “shields” it from antibodies. The shielding is a result of the unusually small pore size of precipitated substrate. For this reason, DAB should not be used first in a dual stain protocol where co-localization might occur.
The water used to make the working solution of nova red must be free of oxidizable content. This can vary within a lab over time and from lab to lab even if identical water purification systems are used. To prevent interference with the oxidization and variability between batches we do not use the on site water purification system when making hydrogen peroxidase substrate. Instead, we use a single source of purified, distilled water from a commercial source (i.e. Gibco).
The ABC-AP complex is for use with alkaline phosphatase (AP) chromogens only. The AP chromogens require levamisole in the working solution to act as a competitive inhibitor of endogenous phosphatases within the CNS. Adding 0.1% Tween 20 can improve the staining clarity.
Using fresh stocks of ethanol and xylene is particularly important during the dehydration and cleansing steps. The appearance of small “bubbles” uniformly present under magnification suggests that the ethanol needs to be changed.
Do not use paper towels or other absorbent materials that leave fibers or debris on the slide surface. In our experience, Kimwipes work best.
VectaMount is a permanent mounting media, but some chromogens require aqueous-based mounting media such as VectaMount AQ. The coverslip of a dried slide can be removed by submerging in xylene overnight without damaging the tissue.
These settings are specific for the 40X objective and camera parameters used while generating the library. If something is changed in the software, such as wavelength range, then the library will not be able to load. The spectral library can only be used to un-mix images of the same magnification. If you want to unmix images at a 20X and 5X for example, then you must use a 20X and 5X library, respectively.
The criteria used to define the regions of interest should be as consistent as possible. We use the optical density of the MAP2 spectrum and neuronal morphology to ensure only neurons are selected. Occasionally, blood vessels, connective tissue or artifacts of fixation can result in extremely high optical density. These cases can be filtered out individually by hand or based on size, by eliminating all regions of interest with a minimum number of connected pixels.
We use a set color temperature of 3200 Kelvin to maintain consistency across image analyses. The script parameters for Threshold Interactive (HLS) described in Figure 5 are calibrated to 3200 Kelvin but can be adjusted independently with the PALMRobo software directly using the Field of View Analysis.
Script parameters for Sigma, Clean and Dilate are influenced by magnification and must be modified for each different magnification. If you will be working at a 20X magnification and a 40X magnification, you will need two separate scripts.
References
- 1.Cattoretti G, Pileri S, Paravicini C, Becker MH, Poggi S, Bifulco C, Key G, D’Amato L, Sabattin E, Feudale E. Antigen unmasking on formalin-fixed, paraffin-embedded tissue sections. J Pathol. 1993;171:83–98. doi: 10.1002/path.1711710205. [DOI] [PubMed] [Google Scholar]
- 2.Boenisch T. Effect of heat induced antigen retrieval following inconsistent formalin fixation. Appl Immunohistochem Mol Morphol. 2005;13:283–286. doi: 10.1097/01.0000146524.74402.a4. [DOI] [PubMed] [Google Scholar]
- 3.Buchwalow Igor, Bocker Werner. Immunohistochemistry: Basics and Methods. Springer-Verlag; Berlin Heidelberg: 2010. [Google Scholar]


