

Abstract
The architecture and morphogenetic properties of tissues are founded in the tissue-specific regulation of cell behaviors. In endochondral bones, the growth plate cartilage promotes bone elongation via regulated chondrocyte maturation within an ordered, three-dimensional cell array. A key event in the process that generates this cell array is the transformation of disordered resting chondrocytes into clonal columns of discoid proliferative cells aligned with the primary growth vector. Previous analysis showed that column-forming chondrocytes display planar cell divisions, and the resulting daughter cells rearrange by ∼90° to align with the lengthening column. However, these previous studies provided limited information about the mechanisms underlying this dynamic process. Here we present new mechanistic insights generated by application of a novel time-lapse confocal microscopy method along with immunofluorescence and electron microscopy. We show that, during cell division, daughter chondrocytes establish a cell-cell adhesion surface enriched in cadherins and β-catenin. Rearrangement into columns occurs concomitant with expansion of this adhesion surface in a process more similar to cell spreading than to migration. Column formation requires cell-cell adhesion, as reducing cadherin binding via chelation of extracellular calcium inhibits chondrocyte rearrangement. Importantly, physical indicators of cell polarity, such as cell body alignment, are not prerequisites for oriented cell behavior. Our results support a model in which regulation of adhesive surface dynamics and cortical tension by extrinsic signaling modifies the thermodynamic landscape to promote organization of daughter cells in the context of the three-dimensional growth plate tissue.
Keywords: Adhesion, Chondrogenesis, Polarity, Mouse
INTRODUCTION
The human skeleton contains 206 bones that display distinct morphologies ranging from the tiny, intricately shaped bones of the inner ear to the plate-like bones of the skull and the long bones of the limbs. Many of these skeletal elements form through the highly conserved process of endochondral ossification, in which cartilage functions as both a template for bone formation and a master regulator of bone growth (Dodds, 1930; Hunziker and Schenk, 1989). Controlled bone growth is achieved by spatial and temporal regulation of cell proliferation, chondrocyte maturation and matrix deposition. Although much is known about the regulation of skeletal morphogenesis by signaling pathways, the integration of specific cellular processes and matrix structure to generate growth vectors and tissue architecture is not well understood.
In the development of long bones, these processes are united in the growth plate cartilage, a unique structure in which short- and long-range signals control the rate of endochondral ossification within an ordered array of chondrocytes (Karsenty and Wagner, 2002; Kronenberg, 2003; Yang, 2009; Romereim and Dudley, 2011). The resting zone is a reservoir of rounded chondrocytes that are dispersed in the cartilage matrix (Fig. 1A). Chondrocytes are gradually displaced from this region by tissue growth and then recruited to a proliferative phase. This proliferative zone exhibits altered cell morphology, clonal expansion, and cell rearrangement that result in the formation of columns of discoid chondrocytes (Fig. 1A). Following this transient proliferative phase, chondrocytes withdraw from the cell cycle and enter a terminal hypertrophic phase in which cartilage matrix is prepared for mineralization.
Fig. 1.

Experimental design for a novel application of time-lapse confocal microscopy. (A) In long bone growth plate, the transition between the first two maturation states (resting zone to proliferative zone) is accompanied by the establishment of clonal columns of flattened, disc-like chondrocytes. (B) This column formation occurs via planar cytokinesis followed by a ∼90° rearrangement of the daughter cells. (C) An endochondral growth plate amenable to confocal microscopy is the presphenoidal synchondrosis (PSS) on the ventral side of the mouse cranium (arrow). (D) The PSS contains a mirror image growth plate with a central resting zone flanked by two sets of maturation zones, creating bone growth in two opposing directions simultaneously. The zones, in order of increasing maturity, are the resting [R], proliferative [P], prehypertrophic [PH] and hypertrophic [H] zones. This is confirmed with histology and fluorescence in situ hybridization against collagen type 2, collagen 10, indian hedgehog (IHH) and prelp. (E) In order to create mosaic expression of myristoylated eGFP, the tdTomato reporter line was crossed with a tissue-specific, tamoxifen-inducible Cre recombinase line, Col2CreERT. (F) Injection of a single 4 mg dose at E13.5-14.5 resulted in 30-40% recombination, allowing individual dividing chondrocytes to be optically resolved.
The unique columnar architecture established in the proliferative zone is crucial for specifying the primary direction of growth in long bones. Mature columns of the proliferative zone are aligned with the growth vector, and this characteristic alignment persists into the hypertrophic stages during which cell enlargement drives tissue elongation (Dodds, 1930; Hunziker, 1994; Wilsman et al., 1996). Moreover, there are well-demonstrated causal links between genetic disruption of column formation and morphological defects in chick, mouse and human (Yang et al., 2003; Ahrens et al., 2009; Campos-Xavier et al., 2009; Li and Dudley, 2009; Gao et al., 2011). However, despite the importance of column formation to skeletal development, the mechanism that converts arbitrarily arranged resting chondrocytes into highly organized columns of proliferative chondrocytes remains poorly understood.
The foundation of current understanding is the detailed description of column formation presented by G. S. Dodds in 1930. These studies, based on standard histological methods using fixed tissue, define four main features of proliferative chondrocytes undergoing mitosis and rearrangement. Together, these four observations encompass the major changes in cell behavior that accompany the resting-to-proliferative chondrocyte transition (Dodds, 1930). Thus, in proliferative chondrocytes: (1) mitotic figures are oriented in a common plane, (2) daughter cells remain close following division, (3) daughter cells convert from an immature, rounded form to a flattened, discoid morphology, and (4) pairs of flattened cells display planar alignment such that the cell diameter is perpendicular to the long axis of the bone (Fig. 1B).
Subsequent technological advances that allow semi-quantitative analysis of histological images have largely confirmed the initial observations by Dodds and have also extended our understanding of the signaling pathways regulating these characteristics (Ahrens et al., 2009; Li and Dudley, 2009). These recent studies revealed a link between specific cell behaviors (orientation of the division plane and column formation) and signaling pathways known to regulate growth plate cartilage morphogenesis. In particular, signaling via a noncanonical, β-catenin-independent, wingless/int-1 (Wnt) signaling pathway is crucial to align division planes and to promote column formation in proliferative chondrocytes (Topczewski et al., 2001; Ahrens et al., 2009; Li and Dudley, 2009). A strong candidate for the noncanonical Wnt signaling pathway involved is the planar cell polarity (PCP) pathway (Gao et al., 2011).
In PCP signaling, frizzled receptors for Wnt ligands and the seven- pass transmembrane Vangl molecules interact with intracellular mediators to generate molecularly distinct cell surfaces (e.g. cell-cell interfaces), thus generating intrinsic polarity within each cell (Peng and Axelrod, 2012; Singh and Mlodzik, 2012). Communication between planar polarized cells via signaling feedback loops results in cooperative alignment of polarity, such that cells most often display polarity identical to that of neighboring cells. PCP signaling is also essential to the process of convergent extension in which coordinated cell shape change and polarized cell movement drives tissue narrowing and coincident extension along a midline (Keller et al., 2000; Wallingford et al., 2002; Yin et al., 2009). Determining that chondrocyte rearrangement is associated with noncanonical Wnt/PCP signaling led to the model that, following division, daughter chondrocytes rearrange via convergent-extension-like cell migration movements (Ahrens et al., 2009; Li and Dudley, 2009).
Prior observation of organized, directional chondrocyte cell behaviors combined with recent studies of signaling pathway regulation hint at a mechanistic role for polarity in establishing cartilage architecture, but methodological limitations have prevented deeper understanding for three main reasons. First, previous experiments were predicated on the untested assumption that anisotropy in cell shape indicates cell polarity. Thus, it was assumed that cell behaviors lacked directionality in round resting chondrocytes, whereas it was thought that the cell alignment, positioning of the division plane, and cell rearrangement of the discoid proliferative chondrocytes were linked via a common cell polarity mechanism. Second, cell division and cell rearrangement are inherently dynamic processes that cannot be described completely by analyzing fixed tissue sections. Previous observations of proliferative chondrocytes did indeed provide solid information about the starting and ending points in division and rearrangement, but the proposed intervening events were largely extrapolations based on similarities to other biological processes such as convergent extension. Third, the fact that only the starting point of cytokinesis and the ending point of columnar alignment can be accurately analyzed by histological methods reduces the diversity of experimental outcomes, which, in turn, decreases the resolution of genetic studies. For example, expression of a dominant-negative Frizzled-7 receptor in proliferative chondrocytes interfered with the orientation of cell division (Li and Dudley, 2009). Because cell division misalignment might directly result in the failure to form columns, it was not possible to determine whether additional defects in either cell body alignment or cell rearrangement were also present.
To address the limitations of fixed tissue methods and to expand the depth of mechanistic inquiry, we developed a novel explant culture-based system to generate three-dimensional time-lapse movies of chondrocytes in living growth plate cartilage. Using this method, we first confirmed many of the previous observations of column formation obtained with histology. Importantly, we also present new evidence that chondrocyte rearrangement occurs via a smooth, non-episodic process that involves a cadherin/catenin-dependent expansion of a daughter cell adhesion surface. Moreover, and unexpectedly, we show that although anisotropy in cell morphology predicts the division plane in all chondrocytes, cell shape fails to predict the extent of rearrangement in a subset of chondrocytes at the resting-to-proliferative zone transition. We propose that these events, which could not have been observed using previous methods, represent the initial division of newly recruited proliferative chondrocytes. Collectively, these new data support a model in which chondrocyte rearrangement occurs via a cell adhesion-dependent process in which cell orientation is initially defined by extrinsic factors and is independent of cell shape.
RESULTS
A novel approach for live imaging of growth plate chondrocytes
There are many obstacles to deep tissue imaging of intact organisms. Therefore, as a starting point, we took advantage of the fact that growth plate cartilage explants lengthen and maintain appropriate architecture in vitro (Li et al., 2011). Combining explant culture and time-lapse confocal microscopy offered the potential for high-resolution image acquisition of living chondrocytes. However, there initially remained several technical limitations that obscured observation of individual chondrocytes. First, the dense extracellular matrix scatters light, which limits penetration into the tissue and increases the amount of out-of-focus light detected. Second, the typically convex surface of cartilage elements places most chondrocytes beyond the working distance of higher magnification objective lenses. Third, high cell density in the proliferative zone of limb growth plate cartilage obscures the resolution of individual boundaries, particularly in the z-axis.
We largely circumvented these issues by imaging the presphenoidal synchondrosis (PSS), a relatively flat, less dense cartilage growth plate harvested from the base of the cranium in neonatal mice (Fig. 1C). The cranial base PSS is a true endochondral growth plate, but the tissue is of neural crest origin and the chondrocyte maturation zones are arranged as a mirror image with a central resting zone flanked by two proliferative zones and two hypertrophic zones (McBratney-Owen et al., 2008). Thus, an individual PSS generates longitudinal bone growth in opposite directions simultaneously (Fig. 1D). Despite these differences, the PSS displays the tissue architecture, gene expression domains, and responses to morphogens consistent with growth plate cartilage in long bones (Fig. 1D) (Chen et al., 1999; Eswarakumar et al., 2002; Shum et al., 2003; Young et al., 2006; Koyama et al., 2007; Nagayama et al., 2008).
An additional modification that greatly improved imaging of cells in explants at single-cell resolution was the use of two transgenic mouse lines, the cartilage-specific col2a1::creERT cre recombinase driver and a ROSA locus-targeted, switchable, double fluorescent protein reporter, that together permit mosaic activation of an indelible fluorescent lineage marker in chondrocytes (Feil et al., 1997; Nakamura et al., 2006; Muzumdar et al., 2007). Thus, tamoxifen injection generates a pulse of cre activity in the growth plate cartilage that recombines the reporter locus and thereby switches the membrane-localized fluorescent protein tag from tdTomato to eGFP (Fig. 1E,F). Because eGFP is the more photostable of the two fluorescent proteins, we used non-recombined tdTomato-expressing cells as a dark background against which eGFP-expressing chondrocytes were imaged (Fig. 1F). The resultant decrease in signal density and noise allowed high-resolution imaging of the dynamic behaviors of individual chondrocytes in a native cartilage microenvironment.
Dynamic behaviors of live growth plate chondrocytes
Consistent with previous findings from tissue sections, resting chondrocytes displayed arbitrary orientation of the division plane relative to the growth plate as a whole, whereas the division planes of proliferative chondrocytes were aligned with the longitudinal axis of the associated column and the primary vector of growth (Fig. 2B,F) (Li and Dudley, 2009). Following division, daughter chondrocytes in the resting zone largely remained stationary. Some resting chondrocytes pivoted slightly around one or more axes, but this movement neither resulted in cell stacking nor appeared coordinated with movements in neighboring chondrocyte pairs (Fig. 2A-D; supplementary material Movie 1). By contrast, daughter chondrocytes in the proliferative zone displayed a ∼90° rotation around the z-axis (i.e. clockwise or counterclockwise within the plane of the optical section) or the x-axis (i.e. rotations into and out of the plane of optical section) (Fig. 2E-L; supplementary material Movie 2). Thus, daughter chondrocytes that were initially laterally associated following division undergo rearrangement to create vertical columns. Therefore, unlike resting chondrocytes, proliferative chondrocytes display planar alignment of cell bodies at both cytokinesis and following rotation, observations that validate previous results (Fig. 2K,L) (Li and Dudley, 2009).
Fig. 2.
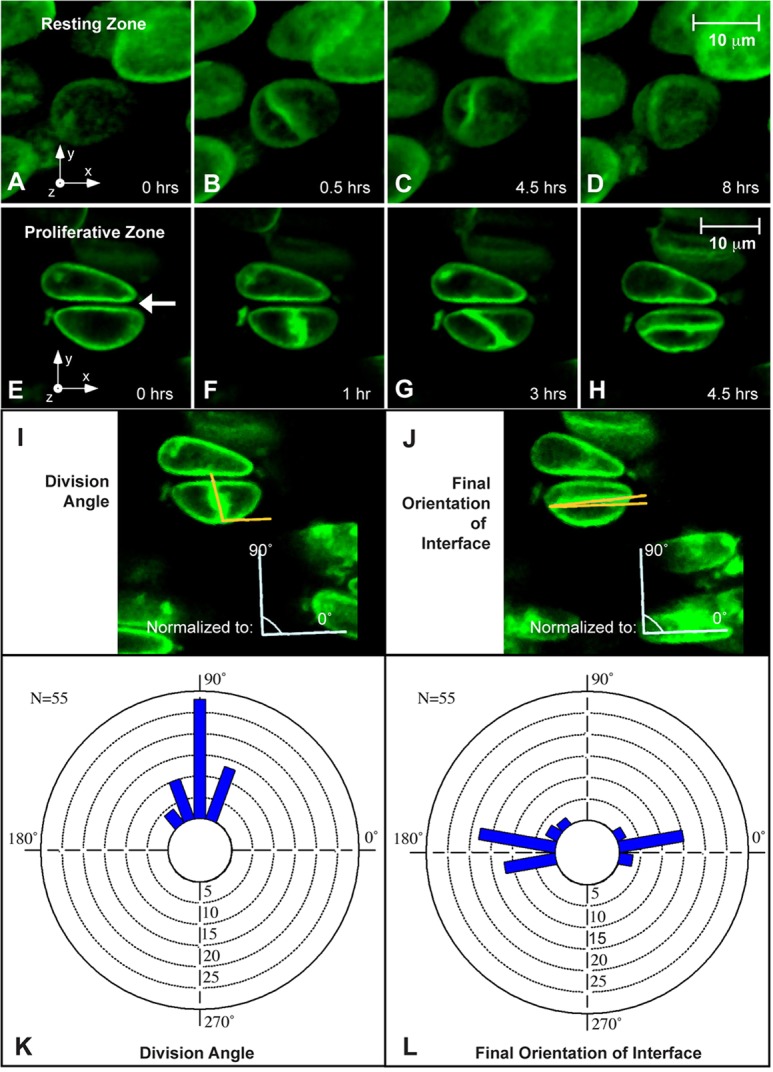
Time-lapse imaging uncovers rotation of the daughter cell interface during column formation. Time-lapse movies of three-dimensional reconstructions of dividing chondrocytes show differential behavior in the resting and proliferative zones. (A-D) In the resting zone, mitosis is oriented perpendicular to the long axis of the cell (B), and the rotation of the mitotic plane (when any occurs) is slight and disoriented (C,D). (E-H) In the proliferative zone, time-lapse movies confirm the previously demonstrated mitotic division bias parallel to the long axis of the growth plate (F). The daughter cells then remain closely associated with one another while their junction rotates to stack the cells into the expanding clonal column (G,H). The arrow in E indicates the gap between two cells in the same column created by the buildup of the pericellular matrix prior to imaging. (I,J) The angles of division and the final orientation of the interface between daughter cells were quantified by defining the x-axis as perpendicular to nearby, already-formed columns. (K,L) A strong division angle bias towards 90° was observed, and the final orientation demonstrated a bimodal distribution biased towards either 0° or 180° shown by circular histograms.
Although many of the key features of chondrocyte behavior were observed previously in tissue sections, live imaging yielded several important new observations. First, it was intriguing that together the dimensions of the daughter cells remained unchanged compared with the mother chondrocyte, which indicates that cell and matrix growth are restricted to the post-rotation period (supplementary material Fig. S1). This observation also suggests that strong cell-matrix adhesion is likely to be maintained during cell movement, a finding not easily reconciled with models of rearrangement based on cell contraction. Second, rotation of the interface of daughter proliferative chondrocytes was smooth and non-episodic, requiring from 3 to 6 h to complete (Fig. 2; supplementary material Movie 2). Rotation was a continuous, unidirectional process that, once stopped, did not restart even when rotation was incomplete. Importantly, incomplete rotation of a given proliferative chondrocyte pair occurred autonomously, as division and rotation of neighboring pairs were unaffected (data not shown). Third, we were surprised that daughter chondrocytes in both the resting and the proliferative zones did not separate immediately following cell division. Instead, the newly formed cell membranes at the division plane remained tightly associated and, in the case of proliferative chondrocytes, the entirety of the newly formed membranes between the daughter cells appeared to rotate together (Fig. 2A-H). In both resting and proliferative chondrocytes, separation of daughter cells was not observed within the period of the imaging session (i.e. 18-24 h). However, in columns that formed before imaging, we observed separation as dark regions ranging from thin lines to wide spaces between daughter cell membranes (Fig. 2E, arrow). Together, these data suggest that intra-daughter matrix deposition occurs progressively after rotation terminates.
Cell shape and chondrocyte behavior
Cell morphology strongly influences certain cellular events, such as mitosis. For example, it is common for the division plane to bisect the long axis of the cell (Hertwig's rule), as observed for proliferative chondrocytes in both past and present studies (Wilson, 1900; Dodds, 1930). In histological sections of long bones, most resting chondrocytes appear round and display arbitrary alignment of cell division planes (Li and Dudley, 2009). By contrast, in live PSS explants, many resting chondrocytes were ellipsoidal and these cells divided as predicted by Hertwig's rule (Fig. 2B; data not shown). However, unlike proliferative chondrocytes, ellipsoidal resting chondrocytes did not show planar alignment of cell bodies. Thus, identical mechanisms linked to cell shape probably position the division plane in both resting and proliferative chondrocytes.
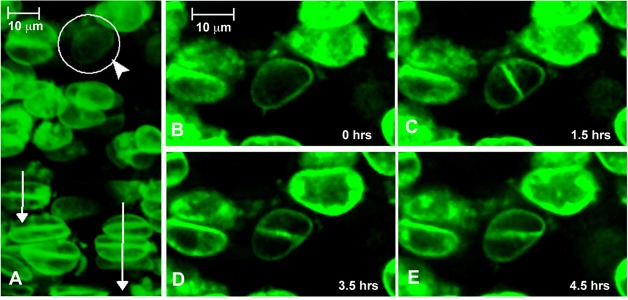
After confirming that cell shape is an important factor in alignment of cell division, we sought to determine whether cell morphology might also influence chondrocyte rearrangement. Cell shape could either act directly by defining the stopping point of the rotation (i.e. when the daughter cell interface aligns with the long axis of the cell) or indirectly by defining the division plane (assuming fixed rotation of ∼90°). Either model could explain the prevailing finding that the final orientation of the daughter cell interface is parallel to the long axis of the original cell (Dodds, 1930; Li and Dudley, 2009). However, a rare but important observation in early proliferative chondrocytes demonstrates that the final orientation of the daughter interface occurs independently of cell shape (Fig. 3). At the border between the resting and proliferative zones, chondrocytes displayed the ellipsoidal shape of resting chondrocytes, but most cells showed planar alignment to nearby columns. However, we observed instances in which two chondrocytes in this transition zone had long axes that were not aligned with neighboring chondrocytes (one example highlighted in Fig. 3A). In these cells, the division plane was positioned according to Hertwig's rule, but rearrangement ceased when the daughter chondrocytes were vertically stacked and aligned with nearby columns (Fig. 3B-E; supplementary material Movie 3). Thus, the daughter cell interface does not simply orient to the longest axis of the cell, suggesting that the initial cell rearrangement event that establishes a new column is regulated by extrinsic factors.
Fig. 3.
The final orientation of the daughter cell interface is independent of cell shape. (A) The indicated cell is an early proliferative chondrocyte that lacks the oriented disc shape of more mature chondrocyte (circle with arrowhead). The arrows indicate orientation of nearby columns. (B-E) Time-lapse analysis shows that mitosis in this cell occurs perpendicular to the long axis of the cell (C), but the final orientation of the rotation aligns perpendicular to the long axis of the growth plate rather than in a cell-shape-dependent manner (E).
Evidence for a functional cell adhesion surface between daughter chondrocytes
Close association of daughter chondrocytes following cell division and during rearrangement suggested the existence of an adhesion surface. Transmission electron microscopy was used to demonstrate tight apposition of daughter cell plasma membranes along the entire interface (Fig. 4A,B). The proximity of the two cell membranes and the absence of detectable interposed extracellular matrix are most consistent with a cell-cell adhesion surface. One common cell-cell adhesion complex contains cadherins, a superfamily of homotypic cell-cell adhesion molecules, and β-catenin, an intracellular signaling mediator that associates with the cytoplasmic tail of cadherins. Immunofluorescence analysis of tissue sections against β-catenin and cadherins (using an antibody that shows strongest affinity to N-cadherin in western blots) demonstrated plasma membrane localization in both resting and proliferative chondrocytes with specific enrichment at the interface between daughter cells (Fig. 4C,D). Similar localization was also observed in monolayer cultures of primary chondrocytes and in rat chondrosarcoma (RCS) cells (Fig. 4E-G) (Mukhopadhyay et al., 1995; King and Kimura, 2003). Interestingly, in RCS cells, both β-catenin and cadherins are enriched at future cell interfaces prior to completion of cytokinesis, suggesting cooperation between the terminal mitotic process of cytokinesis and establishment of the daughter cell adhesion surface.
Fig. 4.

Chondrocyte mitotic junctions form a transient adhesion interface. (A,B) Transmission electron microscopy (TEM) of cranial base sections demonstrates that daughter cell membranes are tightly associated (≤20 nm) in cells undergoing rotation (interface highlighted by arrows in B). The asterisk indicates a slight crease in the formvar of the TEM support grid. (C-G) Immunofluorescence of fixed tissue sections from cranial base growth plates (C,D) as well as in cultured primary chondrocytes (E) and rat chondrosarcoma cells (F,G) shows an increased localization of β-catenin and total cadherins at the junction between recently divided daughter cells (arrowheads). This localization persists during the rotation phase of column formation (C,D).
The observation that cell-cell adhesion is a general property of daughter chondrocytes does not reveal whether the adhesion surface is required for column formation. The relevant cadherins that comprise the adhesion surface are not known, because antibodies against individual cadherins that provide reliable immunofluorescence signals in cartilage were not identified. Therefore, we addressed the role of cadherin proteins as a group using two chemical methods. First, we interfered with cadherin function by chelating extracellular calcium with EGTA, a method that decreases cadherin adhesive strength and promotes internalization of cadherins (Volk and Geiger, 1986; Kim et al., 2011). As a second test, we incubated the cranial base cartilage in cadmium, a known competitive inhibitor of calcium binding to the extracellular cadherin domains, which disrupts both E-cadherin- and N-cadherin-containing adhesion junctions (Contreras et al., 1992; Prozialeck and Lamar, 1999; Prozialeck et al., 2003). The mechanism of action of cadmium has not been completely elucidated; however, dissolution of epithelial junctions is preceded by loss of β-catenin localization to the cell membrane and disruption of the junction-associated actin cytoskeleton (Prozialeck and Niewenhuis, 1991; Thompson et al., 2008; Chakraborty et al., 2010). In these cells, maintenance of cadherins at the cell surface might reflect a cadmium-induced change in protein conformation that decreases turnover (Troyanovsky et al., 2007). As expected, in cranial base explants, calcium chelation promotes loss of both cadherin and β-catenin from the plasma membrane (supplementary material Fig. S2A-D), whereas cadmium treatment resulted in diffuse localization of β-catenin near the daughter interface without an obvious concomitant change in cadherin localization (supplementary material Fig. S2E-H). Neither treatment significantly affected total cellular cadherin or β-catenin (supplementary material Fig. S2I,J).
Both EGTA and cadmium treatments interfere with chondrocyte rearrangement (Fig. 5; P<0.0001; supplementary material Movies 4, 5). In treated cultures, individual proliferative chondrocytes divide and begin to rotate, similar to untreated controls, but then prematurely cease rotation. Despite these aborted rearrangements, neighboring chondrocytes subsequently divided as expected, indicating that the chemical treatments do not broadly compromise cellular functions within the time frame of the experiments. Importantly, although the daughter cell interface appeared intact at the resolution of live-cell imaging, we consistently observed physical disruption at the periphery of the adhesion surface using transmission electron microscopy (Fig. 6A-F). Specifically, compared with untreated controls, the distance between neighboring cell membranes at the margin was substantially increased and discontinuities, such as membrane protrusions, were observed in EGTA- and cadmium-treated explants (Fig. 6D,F). However, except at the periphery, neither EGTA nor cadmium treatment grossly affected the ultrastructure of the adhesion surface. It is not known whether maintenance of the interior regions of the adhesion surface results from the action of molecules other than cadherins or from calcium-insensitive cadherin conformations (Kim et al., 2011). Together, these data demonstrate that cadherin-dependent cell adhesion is required for interface growth and for concomitant rearrangement of daughter chondrocytes into columns (Fig. 6G).
Fig. 5.

Cadherin adhesion is required for chondrocyte rotation. (A-H) When cadherin binding is inhibited by chelation of extracellular calcium by EGTA, daughter cell rearrangement is terminated prematurely, resulting in misalignment with respect to surrounding columns (A-D). The same phenotype is observed via competitive inhibition of calcium-cadherin binding by cadmium (E-H). (I-L) With both treatments, cells continue to divide as expected with a strong bias towards 90° (I,K), but an incomplete rotation occurs (J,L) causing disrupted daughter cell stacking. (M) A statistically significant decrease in the distance the mitotic junction rotates is seen after EGTA or cadmium addition to growth plate explant culture during time-lapse imaging (***P<0.0001).
Fig. 6.

Treatment with EGTA or cadmium chloride physically disrupts daughter cell adhesion. (A-F) Transmission electron micrographs of recently divided untreated (A,B), EGTA-treated (C,D) and cadmium chloride-treated (E,F) chondrocytes show that treatments increase the distance between neighboring cell membranes at the edges of the interface (arrows; compare B with D and F). Arrowheads indicate cellular protrusions between neighboring cells not found in untreated chondrocytes. Red boxes in A, C and E indicate the area shown at higher magnification in B, D and F, respectively. (G) Based on the data presented here, the old model of division, separation and intercalation to form columns is replaced by a transient adhesion interface (red line) that is required for column formation.
DISCUSSION
Histomorphometric analysis (quantitative measurement of shape via histological data) is a cornerstone of studies of tissue growth and architecture. However, this approach only provides limited snapshots of tissue development that often fail to completely capture the dynamic cell biological processes underlying tissue morphogenesis. Here, we describe a system that enables high-resolution live cell imaging of growth plate chondrocytes in cartilage explants via confocal microscopy. This novel system is sufficiently robust for quantitative analysis of the fundamental processes that underlie the generation of growth plate architecture and is compatible with genetic and chemical-genetic methods of investigation. In addition to confirming many of the basic conclusions generated from histological studies, these methods yielded several new observations that could only be obtained from live cell imaging and which suggest important refinements to the original model of chondrocyte column formation.
Unexpected behaviors in resting chondrocytes
Current models are founded on several striking differences in cell behavior between resting and proliferative chondrocytes that were inferred from observations of fixed tissue. Live cell imaging revealed that two of these inferences are invalid. One key assumption was that resting chondrocytes remain stationary after cell division. However, we observed that a substantial minority of resting chondrocytes showed limited movement of the daughter cell interface following cell division, suggesting that resting chondrocytes are competent to undergo rearrangement. Unlike in proliferative chondrocytes, movement of the interface neither resulted in column formation nor appeared coordinated with neighboring daughter pairs. A second assumption is that the failure to align division planes among resting chondrocytes results from arbitrary orientation of division planes within each cell. By contrast, we show that the division plane in ellipsoidal resting zone cells bisects the long cell axis, consistent with Hertwig's rule. Thus, the common orientation of division planes in proliferative chondrocytes may be a consequence of the planar alignment of the cell bodies and not the acquisition of a mechanism that orients the mitotic spindle, as previously assumed. Together, these data suggest that chondrocytes primarily acquire the properties that promote alignment of cell bodies and coordinated rearrangement of daughter cells into columns in the transition from the resting to the proliferative zone.
Cell shape does not drive chondrocyte rearrangement
Although the position of the division plane appears to be strongly influenced by cell shape, the subsequent rearrangement of daughter chondrocytes is not. This conclusion was not obvious from previous analyses in which only chondrocytes in columns were considered proliferative chondrocytes (Dodds, 1930; Li and Dudley, 2009). In these cases, the division plane appeared to rotate 90° to align with the long cell axis. However, we directly observed two ellipsoidal cells at the resting-proliferative zone border that display unaligned axes typical of resting chondrocytes. These cells divide according to Hertwig's rule, but then surprisingly rearrange to align with previously generated columns in the nearby proliferative zone. We propose that these rare events represent the initial cell division of a recently recruited proliferative chondrocyte that establishes a new column. In these cells, columnar alignment of daughter cells occurs prior to planar alignment of mother cell axes. Thus, cell shape is not a dominant factor in cell rearrangement. Collectively, these data strongly suggest that extrinsic signals acting independently of cell shape determine the terminal orientation of cells after rearrangement. An important conclusion from these data is that positional information and cell polarity cannot always be inferred from analysis of cell shape, and therefore histomorphometric methods alone are insufficient for mechanistic studies of cartilage architecture.
Adhesion-dependent cell spreading promotes chondrocyte rearrangement
Another key finding of this work is the presence of a novel, transient cell adhesion surface linking daughter chondrocytes. Following cell division, daughter chondrocytes establish an interface enriched in β-catenin and cadherins. Cadherin function is required for surface expansion and concomitantly for chondrocyte rearrangement. Interestingly, non-rearranging resting chondrocytes also establish cell-cell interfaces and cadmium blocks proliferative chondrocyte rearrangement without altering cadherin localization. Together, these data demonstrate that the adhesion surface alone is insufficient to confer the property of rearrangement to chondrocytes. One caveat is that the chemical reagents used to disrupt cell adhesion are not specific to cadherins and therefore the phenotype could include off-target effects. However, similarities in the effects of EGTA and cadmium, despite distinct mechanisms of action, strongly suggest that the phenotype is adhesion specific.
Observations of this dynamic cell adhesion surface challenge key aspects of previous models based on active cell migration mechanisms. We have shown by live cell imaging that during column formation the uninterrupted daughter cell adhesion surface expands two- to fivefold in area (estimated from the aspect ratio) in a smooth, non-episodic process. In addition, plasma membrane not involved in the adhesion surface appears to remain tightly associated with the cell matrix as the combined perimeter of daughter cells does not perceptibly change during rearrangement (i.e. the total area of the cell-matrix adhesion surface remains constant). The net result is that each daughter chondrocyte, which initially occupies either the right or left half of the lacuna, elongates to fill either the top or the bottom half in a process in which the lateral edge of each cell remains fixed. In this manner, chondrocyte elongation closely resembles a cell spreading event. By contrast, we did not observe cell separation prior to rearrangement, cell body contraction, or a putative leading edge as predicted by previous models based on a convergent extension-like cell migration process driving mediolateral intercalation of chondrocytes into columns (Topczewski et al., 2001; Ahrens et al., 2009; Li and Dudley, 2009). Although the data presented here do not directly rule out certain aspects of active migration, the new results are more compatible with alternative models, such as dynamic cell spreading.
Spreading is the net result of energy dynamics at interaction surfaces, and two cellular models describe this process (Foty and Steinberg, 2004, 2005). First, the differential adhesion hypothesis (DAH) proposes that surface tension generated by cell-cell and/or cell-matrix adhesion events drives changes in cell morphology and tissue organization (Duguay et al., 2003; Thery et al., 2006a, b). Consistent with this model, altering cadherin density on specific adhesion surfaces in the Drosophila eye is sufficient to change both the area and angle of cell contact, thereby changing cell morphology (Gemp et al., 2011). Interestingly, the altered cell shapes mimic the stable geometry of soap bubble clusters, suggesting that cell-cell adhesion modifies surface free energy (Hayashi and Carthew, 2004; Besson and Debregeas, 2007). Thus, the link between adhesion, surface energy and cell morphology is well established.
In proliferative chondrocytes, two dynamic cell adhesion surfaces exist following cytokinesis: a cadherin-dependent cell-cell interface and a cell-matrix adhesion surface. Given that the area of the cell-matrix adhesion surface does not appear to change during column formation, the DAH model would predict that increased cadherin-dependent adhesion at the daughter cell interface drives chondrocyte rearrangement. However, both cadherin- and integrin-dependent adhesion complexes are linked to a cortical actin cytoskeleton upon which myosin can act to generate tension (Kovacs et al., 2002; Thery et al., 2006b; Manning et al., 2010). Indeed, the importance of the cytoskeleton might explain how cadmium affects rearrangement without obviously altering cadherin levels at the daughter cell adhesion surface. The differential interfacial tension hypothesis (DITH) accounts for the contribution of cytoskeletal tension to surface energy dynamics. In the DITH model, tension would vary in response to changes in number or strength of adhesion complex-cytoskeleton interactions as well as changes in cell morphology (Harris, 1976; Graner, 1993; Brodland, 2003). Thus, although the number of cell-matrix contacts is unlikely to change substantially, contribution of cortical tension to cell rearrangement could be modulated as proliferative chondrocytes flatten (Liu et al., 2010; Maruthamuthu et al., 2011). Moreover, the DITH model might explain how defects in both cadherin- and integrin-based adhesion affect column formation, because decreased function of either adhesion surface would alter cortical tension (Aszodi et al., 2003). Regardless, both models would predict that balance of interface and cortical energy/forces in resting chondrocytes would prevent rearrangement, whereas anisotropy in forces would promote column formation in proliferative chondrocytes.
A role for cell polarity?
Previous studies demonstrate a role for cell polarity pathways, in particular planar cell polarity, in generating and maintaining the columnar architecture of the growth plate cartilage (Li and Dudley, 2009; Gao et al., 2011; Randall et al., 2012). The data presented here narrow the field of possible roles for cell polarity signaling in growth plate cartilage. The observation that normal column formation can occur in the absence of prior cell body alignment suggests that the relevant cell polarity pathway(s) act following cell division to control the initiation of rearrangement and/or the terminal position. Wnt/PCP signaling might control both processes via regulation of cadherin- and integrin-based cell adhesion as well as cortical tension (Dzamba et al., 2009). In a similar context, the Fzd receptor has been shown to modulate interactions between competing adhesion complexes containing C-cadherin and PAPC during convergent extension (Kraft et al., 2012). In this manner, fine-tuning chondrocyte adhesion could introduce anisotropy in surface energy and/or cortical tension, and the resulting force imbalance could drive rearrangement. Rearrangement would then terminate in a zone defined by polarity signaling that prevents adherens junction maturation. In this manner, by defining surface properties, cell polarity signaling could generate a thermodynamic slope that rearranges chondrocytes into a precise columnar array.
MATERIALS AND METHODS
Mouse (Mus musculus) genetics, breeding and tamoxifen injections
For all matings, noon on the day of the postcoital plug was designated as embryonic day (E) 0.5. Swiss Webster mice (Jackson Laboratories) were used for histology, immunofluorescence and in situ hybridization experiments. For live cell imaging, female mice homozygous for the reporter allele [Gt(ROSA)26Sortm4(ACTB-tdTomato,-EGFP)Luo/J; Jackson Laboratories] (Muzumdar et al., 2007) were mated with homozygous col2a1::creERT males [FVB-Tg(Col2a1-cre/ERT)KA3Smac/J; Jackson Laboratories] (Feil et al., 1997; Nakamura et al., 2006). Pregnant females were injected intraperitoneally with one 4 mg dose of tamoxifen (20 mg/ml in 90% corn oil, 10% ethanol) on either E13.5 or E14.5 to generate a pulse of cre activity in a mosaic pattern to switch reporter allele expression from myristoylated tdTomato to myristoylated eGFP. All procedures performed on animals were consistent with regulatory agency policies and were approved by the Institutional Care and Use Committee at University of Nebraska Medical Center.
Explant cultures
Neonatal mice at postnatal day (P) 1-4 (with P0 being the day of birth) were euthanized and the cranial base growth plate cartilage including a small amount of attached bone was rapidly harvested into PBS then transferred into cartilage culture media: MEM alpha medium without Phenol Red (Invitrogen, #41061-029) supplemented with 50 μg/ml penicillin-streptomycin-glutamine (Invitrogen, #10378-016), 10 mM β-glycerophosphate, 50 μg/ml ascorbic acid and 10 nM β-mercaptoethanol. Cartilage explants were maintained briefly in a passively humidified incubator at 37°C and 8% CO2, then explants were embedded in 1% agarose in a LabTek 35 mm glass-bottom culture dish and an 18×18 mm glass coverslip was gently placed on top. After gelation, 5 ml of medium was added to the dish and the culture was equilibrated to the microscope environmental chamber.
Confocal imaging setup and image acquisition
Ex vivo imaging was performed using a Zeiss 710 laser scanning confocal microscope equipped with a 37°C heated chamber and a stage-mounted Pecon environmental control system (passive humidity, 37°C, 8% CO2). Optical sections (line averaging of 2, scan speed of 4 or 5, and typical resolution of 1024×1024) were collected at 1.8 μm intervals for between 15 and 25 sections (total depth of 30-40 μm) every 30 min for up to 24 h with manual focus adjustments and occasional increases in z-stack size to compensate for thermal fluctuations and tissue growth. For some experiments, image tiling with 10% overlap and subsequent stitching of adjacent images was performed to visualize a greater area of the explant. For EGTA or cadmium treatments, imaging was first performed for 6-8 h in regular cartilage culture media to establish a baseline for untreated cell behavior, then media was replaced with cartilage culture media containing either 4.5 mM EGTA or 40 μM cadmium chloride, and imaging was resumed.
Image processing, quantification and biostatistics
Volocity by Perkin Elmer was used to remove noise and assemble z-stacks into movies of 3D reconstructions. Cell shape/size measurements were performed with manual assignment of points in Volocity for distance and angle measurement. The division angle was defined with respect to a horizontal 0° defined to be perpendicular to the long axis of surrounding columns. The final orientation angle was measured with respect to that same 0° horizontal, with clockwise movement decreasing the angle and counterclockwise movement increasing the angle. The raw angle data was plotted as circular histograms using Oriana version 4 software (Kovach Computing Services).
Descriptive statistics of the data were summarized using means and standard deviations as shown in the box plots. Angular differences were defined as the absolute value of the final orientation angle minus the division angle. A paired t-test was used to compare the initial and final difference and analysis of variance (ANOVA) was used to compare the four treatment groups followed by Tukey's adjustment for multiple comparisons. A significance level of 0.05 was considered to be statistically significant.
Cell culture
Primary murine growth plate chondrocyte cultures were prepared from the resting and proliferative zones of the base of the femur and head of the tibia by digestion with 0.25% collagenase. RCS cells were maintained in DMEM (Invitrogen, #11965-092) supplemented with 10% fetal bovine serum and 1% penicillin-streptomycin-glutamine (Invitrogen, #10378-016). RCS cells and primary chondrocytes were plated onto poly-L-lysine-coated glass coverslips for 24-36 h prior to immunofluorescence staining.
In situ hybridization and immunofluorescence
For analysis of tissue, cartilage was harvested, fixed in 4% paraformaldehyde in PBS overnight at 4°C, decalcified in 0.5 M EDTA, pH 8, and embedded for cryosectioning or paraffin sectioning as previously described (Ahrens and Dudley, 2011). Fluorescence in situ hybridization was performed according to product instructions (TSA Plus, Perkin Elmer) using RNA probes generated as described (Ahrens et al., 2009). Immunofluorescence was performed as described (Ahrens and Dudley, 2011), with the following pretreatments: autofluorescence quenching in 0.25% ammonia/70% ethanol for one hour; 2 mg/ml hyaluronidase in 100 mM NaCl, 10 mM sodium acetate, pH 5.6, 0.1% Triton X-100 at 37°C for 30 min; antigen retrieval in boiling 10 mM sodium citrate; and permeabilization in 0.5% Triton X-100/PBS for 20 min.
For immunofluorescence analysis of cultures, cells were fixed with 4% paraformaldehyde for 5 min, permeabilized with 1×TBS plus 0.1% Triton X-100 (1×TBST), and blocked with 20% sheep serum. Cells were then incubated with gentle rocking at room temperature in primary antibody for two hours followed by secondary antibody for one hour, then the nuclei were stained with DAPI (5 ng/ml in PBS), and the coverslips were mounted with gelvatol or with Prolong Gold (Invitrogen, P36935). The antibodies used were BD Biosciences Transduction Laboratories mouse anti β-catenin (1:500; BD Biosciences Transduction Laboratories; 610153) and mouse monoclonal anti pan-cadherin antibody (1:500; Sigma-Aldrich; C1821), with the anti-mouse Alexa Fluor 697 secondary antibody (1:1000; Invitrogen; A-20990). Untreated growth plates, n=6 explants; EGTA treated, n=4 explants; cadmium treated, n=1 explant; RCS cells, n=2; cultured chondrocytes, n=1.
Western blot analysis
Cartilage harvested from P3 neonates or explant cultures was lysed in RIPA buffer containing cOmplete EDTA-free protease inhibitors (Roche, 05892791001). Proteins were separated on NuPAGE gels and transferred to nitrocellulose membrane according to the manufacturer's instructions (Life Technologies). Membranes were blocked (LI-COR Blocking Buffer), incubated sequentially with primary and secondary antibodies, and imaged using the LI-COR Odyssey CLx. The following antibodies were used: mouse anti β-catenin (1:500; BD Biosciences Transduction Laboratories; 610153), mouse monoclonal anti pan-cadherin antibody (1:500; Sigma-Aldrich; C1821), mouse anti-actin (1:1000; Developmental Studies Hybridoma Bank, University of Iowa; JLA20), anti-mouse IRDye 680 (1:10,000; LI-COR; 926-68072) and anti-mouse IRDye 800 (1:10,000; LI-COR; 926-32213).
Transmission electron microscopy analysis
Cranial base cartilage was harvested from neonatal mice at P3. The tissue was fixed in a modified Karnovsky's fixative containing 2.5% glutaraldehyde, 2% paraformaldehyde, 0.1 M sodium cacodylate and 0.7% (w/v) safranin O (Wilson et al., 2010). The addition of safranin O served to preserve the proteoglycan network of the pericellular matrix, which proved to be crucial in maintaining proper cell morphology. Samples were then post-fixed with 1% osmium tetroxide for 1 h, dehydrated, and embedded in Araldite resin (Electron Microscopy Sciences). Thick sections (1 μm) were taken in order to identify regions of interest within the tissue. Once identified, thin sections (100 nm) were collected on tri-slotted, carbon-coated Formvar grids (Ted Pella) and incubated at 65°C overnight to promote section adherence. Thin sections were contrast stained with 2% uranyl acetate and Reynold's lead citrate. Imaging was performed on a FEI Tecnai G2 Spirit transmission electron microscope equipped with a LAB6 crystal operating at an accelerating voltage of 80 kV. Untreated growth plates, n=5 explants; EGTA-treated, n=2; cadmium treated, n=2.
Supplementary Material
Acknowledgements
We thank Susan Mackem (NIH) for the col2a1::creERTmice; Bill Russin (Biological Imaging Facility, Northwestern University), Janice Taylor and James Talaska (Confocal Laser Microscope Core, University of Nebraska Medical Center) for microscopy assistance; Tom Bargar and Gordon Todd (Electron Microscopy Core, UNMC) for TEM assistance; Richard Carthew, Robert Holmgren and Lonnie Shea (Northwestern University) for advice; and Alek Erickson and Krishna Sarma for critical reading of the manuscript.
Footnotes
Competing interests
The authors declare no competing financial interests.
Author contributions
S.M.R. and A.T.D. developed the concepts and approach for these studies and wrote the manuscript; S.M.R., A.T.D. and N.H.C. reviewed and edited the manuscript; S.M.R. performed the experiments and data analysis, except for the FISH and TEM studies (performed by N.H.C.) and the biostatistical analysis (performed by B.C.).
Funding
This work was supported by the National Institute of Arthritis and Musculoskeletal and Skin Diseases [R01 AR054857; ATD]; the National Institute of Dental and Craniofacial Research [F31 DE022511 to S.M.R.]; and the Cellular and Molecular Basis of Disease Training Grant at Northwestern University [T32 GM08061 to S.M.R.]. Additional support was provided by the University of Nebraska Medical Center (UNMC) and the Mary and Dick Holland Program in Regenerative Medicine. Core facilities at UNMC are supported by the Nebraska Research Initiative (Confocal and Electron Microscopy) and the Eppley Science Center (Confocal). Deposited in PMC for release after 12 months.
Supplementary material
Supplementary material available online at http://dev.biologists.org/lookup/suppl/doi:10.1242/dev.105452/-/DC1
References
- Ahrens M. J., Dudley A. T. (2011). Chemical pretreatment of growth plate cartilage increases immunofluorescence sensitivity. J. Histochem. Cytochem. 59, 408-418 10.1369/0022155411400869 [DOI] [PMC free article] [PubMed] [Google Scholar]
- Ahrens M. J., Li Y., Jiang H., Dudley A. T. (2009). Convergent extension movements in growth plate chondrocytes require gpi-anchored cell surface proteins. Development 136, 3463-3474 10.1242/dev.040592 [DOI] [PMC free article] [PubMed] [Google Scholar]
- Aszodi A., Hunziker E. B., Brakebusch C., Fässler R. (2003). Beta1 integrins regulate chondrocyte rotation, G1 progression, and cytokinesis. Genes Dev. 17, 2465-2479 10.1101/gad.277003 [DOI] [PMC free article] [PubMed] [Google Scholar]
- Besson S., Debrégeas G. (2007). Statics and dynamics of adhesion between two soap bubbles. Eur. Phys. J. E. Soft Matter 24, 109-117 10.1140/epje/i2007-10219-y [DOI] [PubMed] [Google Scholar]
- Brodland G. W. (2003). New information from cell aggregate compression tests and its implications for theories of cell sorting. Biorheology 40, 273-277 [PubMed] [Google Scholar]
- Campos-Xavier A. B., Martinet D., Bateman J., Belluoccio D., Rowley L., Tan T. Y., Baxová A., Gustavson K.-H., Borochowitz Z. U., Innes A. M., et al. (2009). Mutations in the heparan-sulfate proteoglycan glypican 6 (GPC6) impair endochondral ossification and cause recessive omodysplasia. Am. J. Hum. Genet. 84, 760-770 10.1016/j.ajhg.2009.05.002 [DOI] [PMC free article] [PubMed] [Google Scholar]
- Chakraborty P. K., Lee W.-K., Molitor M., Wolff N. A., Thévenod F. (2010). Cadmium induces Wnt signaling to upregulate proliferation and survival genes in sub-confluent kidney proximal tubule cells. Mol. Cancer 9, 102 10.1186/1476-4598-9-102 [DOI] [PMC free article] [PubMed] [Google Scholar]
- Chen L., Adar R., Yang X., Monsonego E. O., Li C., Hauschka P. V., Yayon A., Deng C.-X. (1999). Gly369Cys mutation in mouse FGFR3 causes achondroplasia by affecting both chondrogenesis and osteogenesis. J. Clin. Invest. 104, 1517-1525 10.1172/JCI6690 [DOI] [PMC free article] [PubMed] [Google Scholar]
- Contreras R. G., Miller J. H., Zamora M., Gonzalez-Mariscal L., Cereijido M. (1992). Interaction of calcium with plasma membrane of epithelial (MDCK) cells during junction formation. Am. J. Physiol. 263, C313-C318 [DOI] [PubMed] [Google Scholar]
- Dodds G. S. (1930). Row formation and other types of arrangement of cartilage cells in endochondral ossification. Anat. Rec. 46, 385-399 10.1002/ar.1090460409 [DOI] [Google Scholar]
- Duguay D., Foty R. A., Steinberg M. S. (2003). Cadherin-mediated cell adhesion and tissue segregation: qualitative and quantitative determinants. Dev. Biol. 253, 309-323 10.1016/S0012-1606(02)00016-7 [DOI] [PubMed] [Google Scholar]
- Dzamba B. J., Jakab K. R., Marsden M., Schwartz M. A., DeSimone D. W. (2009). Cadherin adhesion, tissue tension, and noncanonical Wnt signaling regulate fibronectin matrix organization. Dev. Cell. 16, 421-432 10.1016/j.devcel.2009.01.008 [DOI] [PMC free article] [PubMed] [Google Scholar]
- Eswarakumar V. P., Monsonego-Ornan E., Pines M., Antonopoulou I., Morriss-Kay G. M., Lonai P. (2002). The IIIc alternative of Fgfr2 is a positive regulator of bone formation. Development 129, 3783-3793 [DOI] [PubMed] [Google Scholar]
- Feil R., Wagner J., Metzger D., Chambon P. (1997). Regulation of Cre recombinase activity by mutated estrogen receptor ligand-binding domains. Biochem. Biophys. Res. Commun. 237, 752-757 10.1006/bbrc.1997.7124 [DOI] [PubMed] [Google Scholar]
- Foty R. A., Steinberg M. S. (2004). Cadherin-mediated cell-cell adhesion and tissue segregation in relation to malignancy. Int. J. Dev. Biol. 48, 397-409 10.1387/ijdb.041810rf [DOI] [PubMed] [Google Scholar]
- Foty R. A., Steinberg M. S. (2005). The differential adhesion hypothesis: a direct evaluation. Dev. Biol. 278, 255-263 10.1016/j.ydbio.2004.11.012 [DOI] [PubMed] [Google Scholar]
- Gao B., Song H., Bishop K., Elliot G., Garrett L., English M. A., Andre P., Robinson J., Sood R., Minami Y., et al. (2011). Wnt signaling gradients establish planar cell polarity by inducing Vangl2 phosphorylation through Ror2. Dev. Cell 20, 163-176 10.1016/j.devcel.2011.01.001 [DOI] [PMC free article] [PubMed] [Google Scholar]
- Gemp I. M., Carthew R. W., Hilgenfeldt S. (2011). Cadherin-dependent cell morphology in an epithelium: constructing a quantitative dynamical model. PLoS Comput. Biol. 7, e1002115 10.1371/journal.pcbi.1002115 [DOI] [PMC free article] [PubMed] [Google Scholar]
- Graner F. (1993). Can surface adhesion drive cell-rearrangement? Part I: biological cell-sorting. J. Theor. Biol. 164, 455-476 10.1006/jtbi.1993.1167 [DOI] [Google Scholar]
- Harris A. K. (1976). Is Cell sorting caused by differences in the work of intercellular adhesion? A critique of the Steinberg hypothesis. J. Theor. Biol. 61, 267-285 10.1016/0022-5193(76)90019-9 [DOI] [PubMed] [Google Scholar]
- Hayashi T., Carthew R. W. (2004). Surface mechanics mediate pattern formation in the developing retina. Nature 431, 647-652 10.1038/nature02952 [DOI] [PubMed] [Google Scholar]
- Hunziker E. B. (1994). Mechanism of longitudinal bone growth and its regulation by growth plate chondrocytes. Microsc. Res. Tech. 28, 505-519 10.1002/jemt.1070280606 [DOI] [PubMed] [Google Scholar]
- Hunziker E. B., Schenk R. K. (1989). Physiological mechanisms adopted by chondrocytes in regulating longitudinal bone growth in rats. J. Physiol. 414, 55-71 [DOI] [PMC free article] [PubMed] [Google Scholar]
- Karsenty G., Wagner E. F. (2002). Reaching a genetic and molecular understanding of skeletal development. Dev. Cell 2, 389-406 10.1016/S1534-5807(02)00157-0 [DOI] [PubMed] [Google Scholar]
- Keller R., Davidson L., Edlund A., Elul T., Ezin M., Shook D., Skoglund P. (2000). Mechanisms of convergence and extension by cell intercalation. Philos. Trans. R. Soc. Lond. B Biol. Sci. 355, 897-922 10.1098/rstb.2000.0626 [DOI] [PMC free article] [PubMed] [Google Scholar]
- Kim S. A., Tai C.-Y., Mok L.-P., Mosser E. A., Schuman E. M. (2011). Calcium-dependent dynamics of cadherin interactions at cell-cell junctions. Proc. Natl. Acad. Sci. U.S.A. 108, 9857-9862 10.1073/pnas.1019003108 [DOI] [PMC free article] [PubMed] [Google Scholar]
- King K. B., Kimura J. H. (2003). The establishment and characterization of an immortal cell line with a stable chondrocytic phenotype. J. Cell Biochem. 89, 992-1004 10.1002/jcb.10571 [DOI] [PubMed] [Google Scholar]
- Kovacs E. M., Goodwin M., Ali R. G., Paterson A. D., Yap A. S. (2002). Cadherin-directed actin assembly: E-cadherin physically associates with the Arp2/3 complex to direct actin assembly in nascent adhesive contacts. Curr. Biol. 12, 379-382 10.1016/S0960-9822(02)00661-9 [DOI] [PubMed] [Google Scholar]
- Koyama E., Young B., Nagayama M., Shibukawa Y., Enomoto-Iwamoto M., Iwamoto M., Maeda Y., Lanske B., Song B., Serra R., et al. (2007). Conditional Kif3a ablation causes abnormal hedgehog signaling topography, growth plate dysfunction, and excessive bone and cartilage formation during mouse skeletogenesis. Development 134, 2159-2169 10.1242/dev.001586 [DOI] [PMC free article] [PubMed] [Google Scholar]
- Kraft B., Berger C. D., Wallkamm V., Steinbeisser H., Wedlich D. (2012). Wnt-11 and Fz7 reduce cell adhesion in convergent extension by sequestration of PAPC and C-cadherin. J. Cell Biol. 198, 695-709 10.1083/jcb.201110076 [DOI] [PMC free article] [PubMed] [Google Scholar]
- Kronenberg H. M. (2003). Developmental regulation of the growth plate. Nature 423, 332-336 10.1038/nature01657 [DOI] [PubMed] [Google Scholar]
- Li Y., Dudley A. T. (2009). Noncanonical frizzled signaling regulates cell polarity of growth plate chondrocytes. Development 136, 1083-1092 10.1242/dev.023820 [DOI] [PMC free article] [PubMed] [Google Scholar]
- Li Y., Ahrens M. J., Wu A., Liu J., Dudley A. T. (2011). Calcium/calmodulin-dependent protein kinase II activity regulates the proliferative potential of growth plate chondrocytes. Development 138, 359-370 10.1242/dev.052324 [DOI] [PMC free article] [PubMed] [Google Scholar]
- Liu Z., Tan J. L., Cohen D. M., Yang M. T., Sniadecki N. J., Ruiz S. A., Nelson C. M., Chen C. S. (2010). Mechanical tugging force regulates the size of cell-cell junctions. Proc. Natl. Acad. Sci. U.S.A. 107, 9944-9949 10.1073/pnas.0914547107 [DOI] [PMC free article] [PubMed] [Google Scholar]
- Manning M. L., Foty R. A., Steinberg M. S., Schoetz E.-M. (2010). Coaction of intercellular adhesion and cortical tension specifies tissue surface tension. Proc. Natl. Acad. Sci. U.S.A. 107, 12517-12522 10.1073/pnas.1003743107 [DOI] [PMC free article] [PubMed] [Google Scholar]
- Maruthamuthu V., Sabass B., Schwarz U. S., Gardel M. L. (2011). Cell-ECM traction force modulates endogenous tension at cell-cell contacts. Proc. Natl. Acad. Sci. U.S.A. 108, 4708-4713 10.1073/pnas.1011123108 [DOI] [PMC free article] [PubMed] [Google Scholar]
- McBratney-Owen B., Iseki S., Bamforth S. D., Olsen B. R., Morriss-Kay G. M. (2008). Development and tissue origins of the mammalian cranial base. Dev. Biol. 322, 121-132 10.1016/j.ydbio.2008.07.016 [DOI] [PMC free article] [PubMed] [Google Scholar]
- Mukhopadhyay K., Lefebvre V., Zhou G., Garofalo S., Kimura J. H., de Crombrugghe B. (1995). Use of a new rat chondrosarcoma cell line to delineate a 119-base pair chondrocyte-specific enhancer element and to define active promoter segments in the mouse pro-alpha 1(II) collagen gene. J. Biol. Chem. 270, 27711-27719 10.1074/jbc.270.46.27711 [DOI] [PubMed] [Google Scholar]
- Muzumdar M. D., Tasic B., Miyamichi K., Li L., Luo L. (2007). A global double-fluorescent Cre reporter mouse. Genesis 45, 593-605 10.1002/dvg.20335 [DOI] [PubMed] [Google Scholar]
- Nagayama M., Iwamoto M., Hargett A., Kamiya N., Tamamura Y., Young B., Morrison T., Takeuchi H., Pacifici M., Enomoto-Iwamoto M., et al. (2008). Wnt/beta-catenin signaling regulates cranial base development and growth. J. Dent. Res. 87, 244-249 10.1177/154405910808700309 [DOI] [PubMed] [Google Scholar]
- Nakamura E., Nguyen M.-T., Mackem S. (2006). Kinetics of tamoxifen-regulated Cre activity in mice using a cartilage-specific CreER(T) to assay temporal activity windows along the proximodistal limb skeleton. Dev. Dyn. 235, 2603-2612 10.1002/dvdy.20892 [DOI] [PubMed] [Google Scholar]
- Peng Y., Axelrod J. D. (2012). Asymmetric protein localization in planar cell polarity: mechanisms, puzzles, and challenges. Curr. Top. Dev. Biol. 101, 33-53 10.1016/B978-0-12-394592-1.00002-8 [DOI] [PMC free article] [PubMed] [Google Scholar]
- Prozialeck W. C., Lamar P. C. (1999). Interaction of cadmium (Cd(2+)) with a 13-residue polypeptide analog of a putative calcium-binding motif of E-cadherin. Biochim. Biophys. Acta 1451, 93-100 10.1016/S0167-4889(99)00077-4 [DOI] [PubMed] [Google Scholar]
- Prozialeck W. C., Niewenhuis R. J. (1991). Cadmium (Cd2+) disrupts Ca(2+)-dependent cell-cell junctions and alters the pattern of E-cadherin immunofluorescence in LLC-PK1 cells. Biochem. Biophys. Res. Commun. 181, 1118-1124 10.1016/0006-291X(91)92054-N [DOI] [PubMed] [Google Scholar]
- Prozialeck W. C., Lamar P. C., Lynch S. M. (2003). Cadmium alters the localization of N-cadherin, E-cadherin, and beta-catenin in the proximal tubule epithelium. Toxicol. Appl. Pharmacol. 189, 180-195 10.1016/S0041-008X(03)00130-3 [DOI] [PubMed] [Google Scholar]
- Randall R. M., Shao Y. Y., Wang L., Ballock R. T. (2012). Activation of Wnt Planar Cell Polarity (PCP) signaling promotes growth plate column formation in vitro. J. Orthop. Res. 30, 1906-1914 10.1002/jor.22152 [DOI] [PubMed] [Google Scholar]
- Romereim S. M., Dudley A. T. (2011). Cell polarity: the missing link in skeletal morphogenesis? Organogenesis 7, 217-228 10.4161/org.7.3.18583 [DOI] [PMC free article] [PubMed] [Google Scholar]
- Shum L., Wang X., Kane A. A., Nuckolls G. H. (2003). BMP4 promotes chondrocyte proliferation and hypertrophy in the endochondral cranial base. Int. J. Dev. Biol. 47, 423-431 [PubMed] [Google Scholar]
- Singh J., Mlodzik M. (2012). Planar cell polarity signaling: coordination of cellular orientation across tissues. Wiley Interdiscip. Rev. Dev. Biol. 1, 479-499 10.1002/wdev.32 [DOI] [PMC free article] [PubMed] [Google Scholar]
- Théry M., Pépin A., Dressaire E., Chen Y., Bornens M. (2006a). Cell distribution of stress fibres in response to the geometry of the adhesive environment. Cell Motil. Cytoskeleton 63, 341-355 10.1002/cm.20126 [DOI] [PubMed] [Google Scholar]
- Théry M., Racine V., Piel M., Pepin A., Dimitrov A., Chen Y., Sibarita J.-B., Bornens M. (2006b). Anisotropy of cell adhesive microenvironment governs cell internal organization and orientation of polarity. Proc. Natl. Acad. Sci. U.S.A. 103, 19771-19776 10.1073/pnas.0609267103 [DOI] [PMC free article] [PubMed] [Google Scholar]
- Thompson J., Wong L., Lau P. S., Bannigan J. (2008). Adherens junction breakdown in the periderm following cadmium administration in the chick embryo: distribution of cadherins and associated molecules. Reprod. Toxicol. 25, 39-46 10.1016/j.reprotox.2007.10.003 [DOI] [PubMed] [Google Scholar]
- Topczewski J., Sepich D. S., Myers D. C., Walker C., Amores A., Lele Z., Hammerschmidt M., Postlethwait J., Solnica-Krezel L. (2001). The zebrafish glypican knypek controls cell polarity during gastrulation movements of convergent extension. Dev. Cell 1, 251-264 10.1016/S1534-5807(01)00005-3 [DOI] [PubMed] [Google Scholar]
- Troyanovsky R. B., Laur O., Troyanovsky S. M. (2007). Stable and unstable cadherin dimers: mechanisms of formation and roles in cell adhesion. Mol. Biol. Cell 18, 4343-4352 10.1091/mbc.E07-01-0084 [DOI] [PMC free article] [PubMed] [Google Scholar]
- Volk T., Geiger B. (1986). A-CAM: a 135-kD receptor of intercellular adherens junctions. II. Antibody-mediated modulation of junction formation. J. Cell Biol. 103, 1451-1464 10.1083/jcb.103.4.1451 [DOI] [PMC free article] [PubMed] [Google Scholar]
- Wallingford J. B., Fraser S. E., Harland R. M. (2002). Convergent extension: the molecular control of polarized cell movement during embryonic development. Dev. Cell 2, 695-706 10.1016/S1534-5807(02)00197-1 [DOI] [PubMed] [Google Scholar]
- Wilsman N. J., Farnum C. E., Green E. M., Lieferman E. M., Clayton M. K. (1996). Cell cycle analysis of proliferative zone chondrocytes in growth plates elongating at different rates. J. Orthop. Res. 14, 562-572 10.1002/jor.1100140410 [DOI] [PubMed] [Google Scholar]
- Wilson E. B. (1900). The Cell in Development and Inheritance. Norwood, MA: The Macmillan Company, Norwood Press [Google Scholar]
- Wilson R., Diseberg A. F., Gordon L., Zivkovic S., Tatarczuch L., Mackie E. J., Gorman J. J., Bateman J. F. (2010). Comprehensive profiling of cartilage extracellular matrix formation and maturation using sequential extraction and label-free quantitative proteomics. Mol. Cell. Proteomics 9, 1296-1313 10.1074/mcp.M000014-MCP201 [DOI] [PMC free article] [PubMed] [Google Scholar]
- Yang Y. (2009). Growth and patterning in the limb: signaling gradients make the decision. Sci. Signal. 2, p e3 10.1126/scisignal.253pe3 [DOI] [PubMed] [Google Scholar]
- Yang Y., Topol L., Lee H., Wu J. (2003). Wnt5a and Wnt5b exhibit distinct activities in coordinating chondrocyte proliferation and differentiation. Development 130, 1003-1015 10.1242/dev.00324 [DOI] [PubMed] [Google Scholar]
- Yin C., Ciruna B., Solnica-Krezel L. (2009). Convergence and extension movements during vertebrate gastrulation. Curr. Top. Dev. Biol. 89, 163-192 10.1016/S0070-2153(09)89007-8 [DOI] [PubMed] [Google Scholar]
- Young B., Minugh-Purvis N., Shimo T., St-Jacques B., Iwamoto M., Enomoto-Iwamoto M., Koyama E., Pacifici M. (2006). Indian and sonic hedgehogs regulate synchondrosis growth plate and cranial base development and function. Dev. Biol. 299, 272-282 10.1016/j.ydbio.2006.07.028 [DOI] [PubMed] [Google Scholar]
Associated Data
This section collects any data citations, data availability statements, or supplementary materials included in this article.