 We present the chemical and structural study of the inframolecular aspects of Ins(1,3,4,5,6)P
5 protonation and complexation equilibria with biological cations.
Abstract
The myo-inositol phosphates (InsPs) are specific signalling metabolites ubiquitous in eukaryotic cells. Although Ins(1,3,4,5,6)P 5 is the second most abundant member of the InsPs family, its certain biological roles are far from being elucidated, in part due to the large number of species formed by Ins(1,3,4,5,6)P 5 in the presence of metal ions. In light of this, we have strived in the past to make a complete and at the same time “biological-user-friendly” description of the Ins(1,3,4,5,6)P 5 chemistry with mono and multivalent cations. In this work we expand these studies focusing on the inframolecular aspects of its protonation equilibria and the microscopic details of its coordination behaviour towards biologically relevant metal ions. We present here a systematic study of the Ins(1,3,4,5,6)P 5 intrinsic acid–base processes, in a non-interacting medium, and over a wide pH range, analyzing the 31P NMR curves by means of a model based on the Cluster Expansion Method. In addition, we have used a computational approach to analyse the energetic and structural features of the protonation and conformational changes of Ins(1,3,4,5,6)P 5, and how they are influenced by the presence of two physiologically relevant cations, Na+ and Mg2+.
Introduction
The phosphorylation of the myo-inositol ring gives rise in nature to a large family of metabolically and physiologically related biomolecules: the myo-inositol phosphates (InsPs). An interesting aspect is that, although the InsPs are ubiquitous and abundant in eukaryotic cells, most of them are still poorly explored from a chemical point of view.1 Research into the biological roles of InsPs has been hampered from the beginning by the enormous number of interconnected chemical processes that they undergo, which also support many of their biological actions at the intracellular level. However, the potential benefit of these studies is immense, since it is believed that myo-inositol phosphates play an important role in the development of many human diseases. This makes the study of the chemistry, biology and biochemistry of InsPs a very fertile field of work, with diverse applications.2–5
Previously, we have performed systematic studies, under physiological conditions, of the intricate chemical behaviour displayed by the highly charged species of the most important InsPs, namely InsP 6, Ins(1,3,4,5,6)P 5 and Ins(1,2,3)P 3.6–11 Our efforts have been devoted so far to providing a thorough understanding of the stoichiometry, charge, solubility and relative stability of the biologically relevant InsPs species. Nevertheless, the study of the InsPs–H+/Mn+ interaction from a structural point of view is also an important issue to address. It provides essential information about the structural details related to the cellular roles of each inositol phosphate. Going a step further, this information will be a useful tool in establishing rational synthesis strategies of related compounds, with potential application in the prevention and/or therapy of various diseases.
At the moment, most of the equilibrium constants reported for InsPs-containing systems are macroconstants, which refer to the species as a whole. However, the inframolecular acid–base properties and the microscopic details of inositol phosphate–metal ion interactions are expected to have a great influence on the biological activity of these compounds, by altering the structural determinants of the InsPs–protein adduct. There are few studies that focus on the protonation and complexation abilities of InsPs at the inframolecular level, and only a few reports on InsPs analyzed from a structural point of view, with InsP 3 and InsP 6 being the most studied so far.12–18
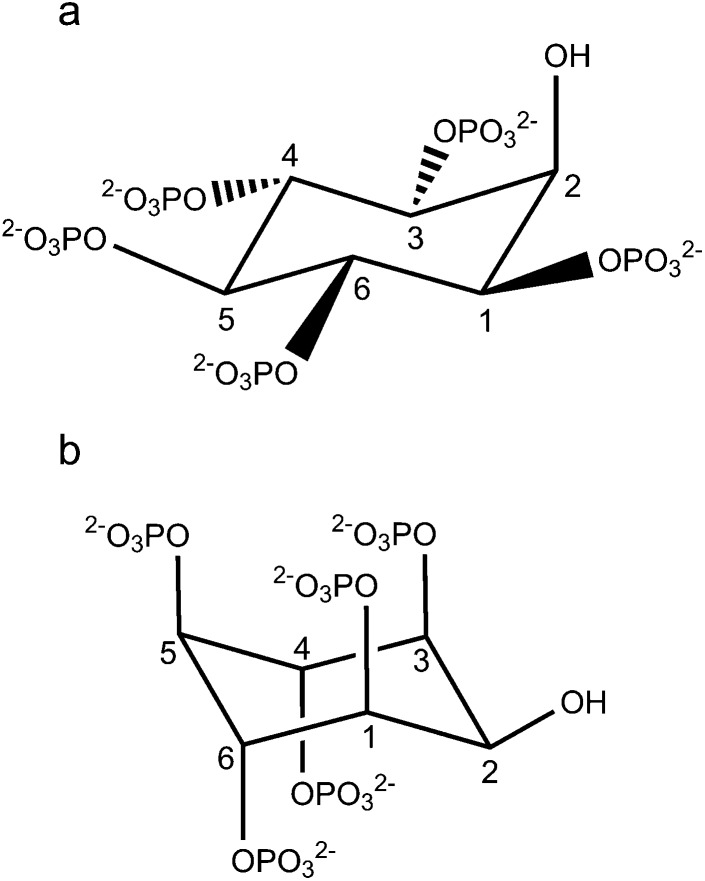
For the second most abundant member of the InsPs family, myo-inositol 1,3,4,5,6-pentakisphosphate (Ins(1,3,4,5,6)P 5, Fig. 1), the structural information published is still scarce. Ins(1,3,4,5,6)P 5, having intracellular concentrations between 15 and 50 μM,19–22 has been possibly related to cellular proliferation, apoptosis, viral assembly, chromatin remodelling and the activity of L-type Ca2+ channels (see references in ref. 16). For this biomolecule, Volkman et al.18 have reported a conformational change operating in the pH range 10.5–10.7, between the 1 axial–5 equatorial (1a5e) and 5 axial–1 equatorial (5a1e) conformations (Fig. 1). The authors also suggested that the group at C2 would have some influence on the conformational transition, but this phenomenon is still unclear. Later, the same conformational change as a function of pH and the ligand protonation pattern at pH = 7.5 was reported.16 However, since those experiments were performed under an excess of potassium cations (0.2 M KCl at 37 °C), the strong K+–Ins(1,3,4,5,6)P 5 interaction is expected to have an effect on the resulting protonation microconstants, due to the formation of “hidden” [Kx(HyL)](10–x–y)– metal complexes.6
Fig. 1. Structure of Ins(1,3,4,5,6)P 5 (L10–), for the two possible conformations: (a) 1 axial–5 equatorial (1a5e) and (b) 5 axial–1 equatorial (5a1e).
With this in mind, we follow our previous work on the protonation and ion-interactions of InsP 3 23,24 and present a structural account of Ins(1,3,4,5,6)P 5 in the absence and presence of Na+ and Mg2+. These metal ions were selected as models for mono and divalent ions, taking into account their relevance in biological systems. The analysis is focused on the biologically relevant forms of Ins(1,3,4,5,6)P 5 and allow further insights into the structural and energetic factors associated with the microprotonation sequence, the conformational change and the coordination properties displayed by this InsP 5.
Experimental
Chemicals
All laboratory chemicals used throughout this work were reagent grade, purchased from commercial sources and used without further purification. NaCl and MgCl2 were used as metal sources. All solutions were prepared with ultrapure water obtained from a Millipore-MilliQ plus system, were 0.15 M in NMe4Cl (Fluka), and used immediately after preparation. The hexaammonium salt of Ins(1,3,4,5,6)P 5, (NH4)6H4L, where L denotes the fully deprotonated form of the molecule, was prepared as previously reported.6 Ins(1,3,4,5,6)P 5 solutions were prepared by weighing the appropriate amount of the salt. Standard HCl and NMe4OH (Merck) solutions were prepared and standardised according to standard techniques.
31P NMR determinations
The chemical behaviour of Ins(1,3,4,5,6)P 5 was analyzed at 37.0 °C in 0.15 M NMe4Cl. In order to do this, the 31P NMR spectra of a 10.6 mM Ins(1,3,4,5,6)P 5 solution at 11 different pH values (0.95, 1.77, 2.93, 3.77, 5.15, 6.19, 7.23, 8.38, 9.52, 10.37, 11.44, 11.66, 13.13) were recorded. The interaction of Ins(1,3,4,5,6)P 5 with Na+ and Mg2+ was then studied under conditions that according to previous potentiometric measurements led to significant concentrations of the relevant species and satisfactory signal-to-noise ratios: Ins(1,3,4,5,6)P 5–Na+ ([InsP 5] = 4.8 mM, [Na+] = 500 mM) and Ins(1,3,4,5,6)P 5–Mg2+ ([InsP 5] = 2.5 mM, [Mg2+] = 1.00 mM). pH was adjusted also in order to have the predominance of a given species (4 and 6 different pH values, for Na and Mg systems respectively), by means of the information we reported previously.6
One-dimensional 31P NMR spectra were recorded on a Bruker Avance 400 MHz instrument (161.98 MHz). All spectra were referenced externally to 80% H3PO4 (0.0 ppm) with downfield shifts represented by positive values. A field-frequency lock was achieved using D2O insets with the aim of not altering the aqueous samples by the addition of D2O. Spectra were recorded over a spectral width of 400 ppm using a 1 s relaxation delay. The temperature was controlled at 37.0 °C through the measurement of proton chemical shifts in a standard of 80% ethylene glycol in deuterated DMSO-d6. The phosphorus resonances for Ins(1,3,4,5,6)P 5 were assigned according to a previous report.16 In the presence of Na+ and Mg2+, the signals were identified by comparison with the ligand spectra and the integration of the peaks.
Macro and micro acid–base studies
The 31P NMRexperimental dataversus pH were analyzed using the HypNMR 2006 software.25 This allowed us to determine the macroscopic protonation and the stability constants for every system in addition to the individual phosphorus chemical shifts for all species. In all cases, the fit of the values predicted by the model to the experimental data was estimated on the basis of the parameter σ, corresponding to the scaled sum of square differences between predicted and experimental values. The Cluster Expansion Method17 was used to determine the microscopic protonation patterns from NMR data.
Calculations
All geometry optimizations were performed according to previous reports on similar systems.23,24 The modified GDIIS26 algorithm was used throughout this work, and the calculations were run in the gas phase and by means of the methods described below as implemented in Gaussian 03, Revision B.01 package.27 The final structures obtained were all minima in the potential energy surface, the nature of the stationary points being verified through vibrational analysis. For the computational study on the Ins(1,3,4,5,6)P 5 protonation process, restricted Hartree–Fock (RHF) geometry optimization runs were carried out using a 3-21+G* split valence basis set.28 In order to obtain the initial inputs for L10–, HL9–, H2L8–, H3L7–, H4L6–, H5L5– and H10L species, in the 1 axial–5 equatorial (1a5e) and 5 axial–1 equatorial (5a1e) conformations (Fig. 1), we started from the optimized fully deprotonated structure. Then, one proton was added at a time according to the particular protonation pattern determined in this report and all the systems were optimized. The minimum energy structure was selected for each species. On the basis of the optimized geometries, single point RB3LYP29/3-21+G* calculations were run on them. In order to determine the energy of those RHF structures in solution, two methods were implemented: the isodensity polarized continuum method (IPCM30) and the conductor-like polarisable continuum method (CPCM31). For the former, the isodensity value was set independently in each case to allow convergence in the calculation. In the second method, the solvent cavity was built up using the United Atom Topological Model applied on radii optimized for the HF/6-31G* level of theory (UAHF).
For the molecular modelling approach to biologically relevant metal–Ins(1,3,4,5,6)P 5 species, molecular mechanics and density functional theory (DFT) geometry optimization runs were performed. The initial geometries for Na+ and Mg2+ complexes were built from the optimized Ins(1,3,4,5,6)P 5 geometries, using also the information given by the 31P NMR spectra and the ligand electrostatic potential. Those inputs were then optimized, in the gas phase, by means of a molecular mechanics method (MM+ as implemented in HyperChem software32) and a DFT method (RB3LYP/LANL2DZ33,34 for Na+ species and RB3LYP/6-31+G* for Mg2+ species). The effect of the solvent was studied through a discrete model including two (for Na+ complexes), three ([Mg(H3L)]5– complex) and four ([Mg4(H2L)] complex) water molecules per metal ion. For the polymetallic Mg–Ins(1,3,4,5,6)P 5 complex the Mg2+cations were located between adjacent phosphate groups, while the two protons associated with the ligand were situated as far as possible from the metal cations. This procedure was applied to the two possible ligand conformations (1a5e and 5a1e) in the cases of all sodium complexes and [Mg4(H2L)].
Results and discussion
Protonation equilibria: a thermodynamic 31P NMR study
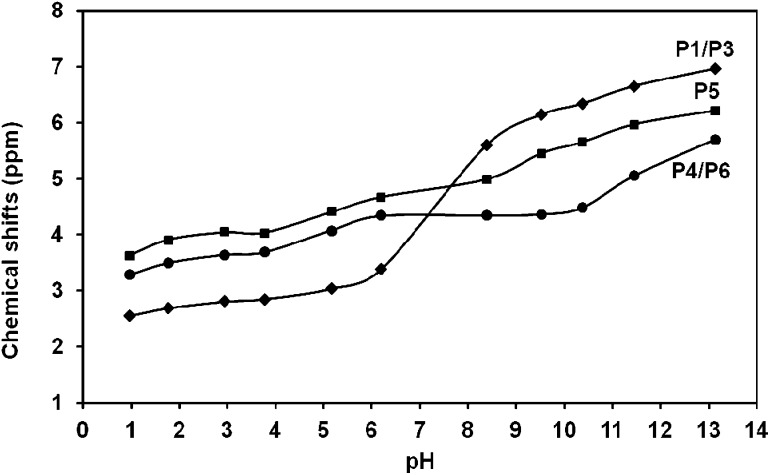
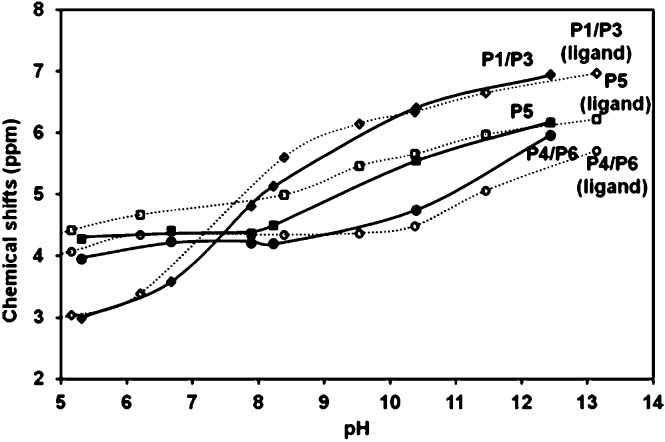
The 31P NMR titration curves for Ins(1,3,4,5,6)P 5 are depicted in Fig. 2. The symmetry of the system leads to three peaks associated with phosphate groups at positions 1 and 3 (P1/P3), 4 and 6 (P4/P6) and at position 5 (P5), as was reported earlier.16 These signals move downfield as the pH increases, an effect already described in previous references.35
Fig. 2. 31P NMR chemical shifts for Ins(1,3,4,5,6)P 5 as a function of pH in 0.15 M NMe4Cl at 37.0 °C. [Ins(1,3,4,5,6)P 5] = 10.6 mM. The solid lines show the HypNMR expected trend, according to the protonation constants given in Table 1.
Ins(1,3,4,5,6)P 5 can be considered as a polyprotic acid H10L, having ten ionisable protons. As shown in Table 1, the first seven out of ten protonation constants of L10– could be measured accurately. The other three constants were not determined due to the strong acidity of the species H10L, H9L– and H8L2–. Although the log K values determined by NMR are usually not as precise as the potentiometric ones, in this case the results are very close to those reported by potentiometry under identical experimental conditions (Table 1).6
Table 1. Logarithms of the protonation and formation constants of Ins(1,3,4,5,6)P 5 measured in 0.15 M NMe4Cl at 37.0 °C.
| log K
|
||
| 31P NMR a | Potentiometry b | |
| L10– + H+ ↔ HL9– | 12.41(4) | 11.62(5) |
| L10– + 2H+ ↔ H2L8– | 23.58(4) | 23.02(3) |
| L10– + 3H+ ↔ H3L7– | 32.53(4) | 32.39(7) |
| L10– + 4H+ ↔ H4L6– | 39.62(4) | 39.81(7) |
| L10– + 5H+ ↔ H5L5– | 44.63(5) | 45.2(1) |
| L10– + 6H+ ↔ H6L4– | 47.6(1) | 47.8(1) |
| L10– + 7H+ ↔ H7L3– | 49.0(1) | 48.9(2) |
| 4Na+ + L10– ↔ [Na4L]6– | 6.58(3) | 7.91(4) |
| 3Na+ + HL9– ↔ [Na3(HL)]6– | 4.73(2) | 5.33(4) |
| 2Na+ + H2L8– ↔ [Na2(H2L)]6– | 2.41(1) | 2.67(5) |
| Mg2+ + HL9– ↔ [Mg(HL)]7– | 5.3(1) | — |
| Mg2+ + H2L8– ↔ [Mg(H2L)]6– | 4.18(4) | 4.43(4) |
| Mg2+ + H3L7– ↔ [Mg(H3L)]5– | 3.1(2) | 3.32(5) |
| Mg2+ + H4L6– ↔ [Mg(H4L)]4– | 2.06(7) | 2.33(9) |
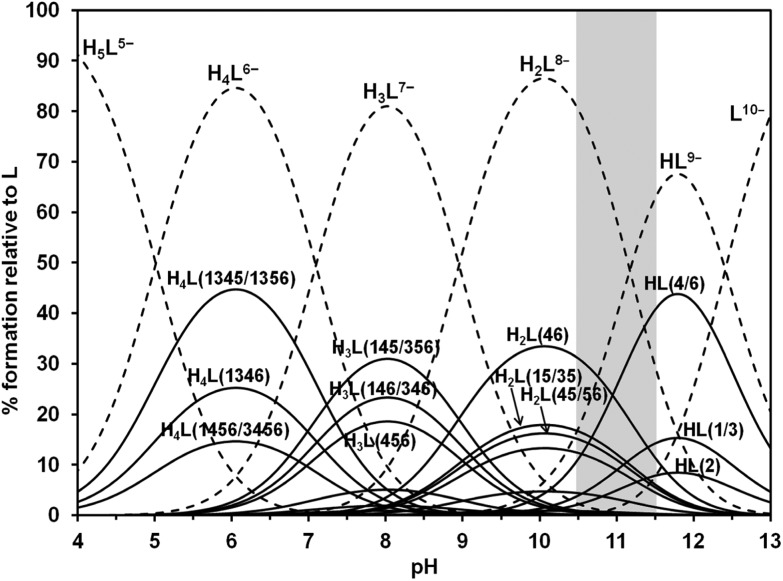
Based on the fit of the experimental data, the solid lines in Fig. 2 represent the expected calculated trend for P1/P3, P4/P6 and P5 chemical shifts, showing a very good fit to the experimental values. Fig. 3 depicts in dashed lines the species distribution for a 10.6 mM solution of the ligand. The predominant species near the physiological pH value (7.4) are H4L6– and H3L7–.
Fig. 3. Macro and microspecies distribution diagram for Ins(1,3,4,5,6)P 5 in the absence of interacting cations, in 0.15 M NMe4Cl and 37.0 °C. The positions of the protonated phosphates are in brackets. Also, the pH range where the ligand conformational change takes place is highlighted.
Looking into the Ins(1,3,4,5,6)P 5 protonation sequence
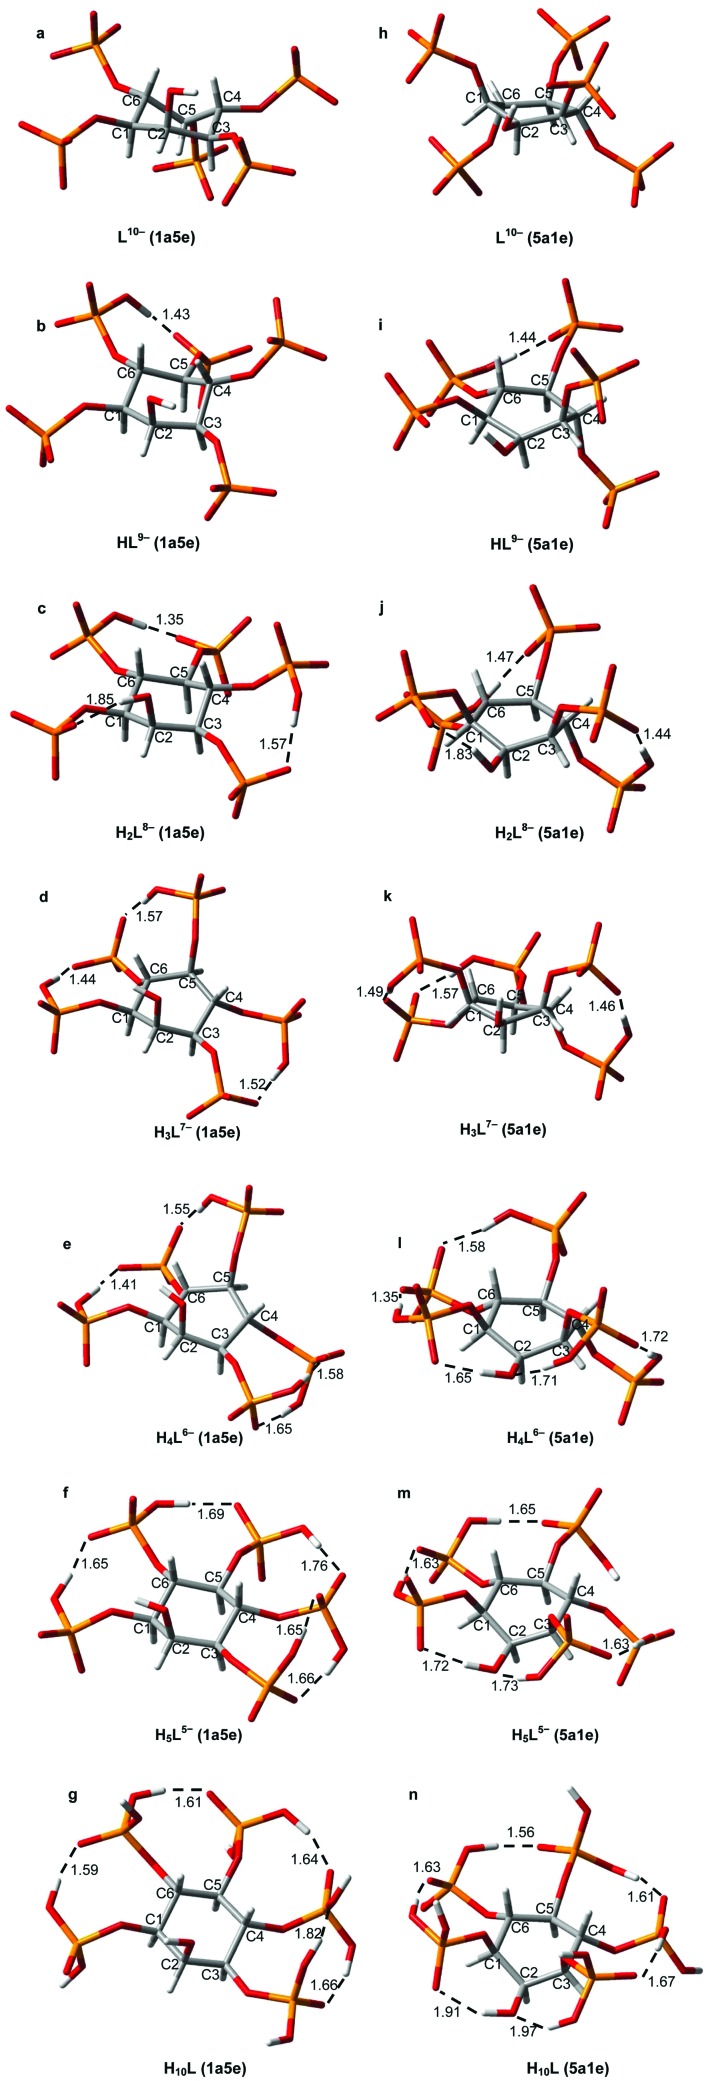
Table 2 lists the calculated 31P NMR individual chemical shifts for the detected Ins(1,3,4,5,6)P 5 protonated forms. They are derived from the thermodynamic analysis shown previously. All signals are significantly affected upon protonation, suggesting extensive proton sharing between the phosphate groups through hydrogen bonds. It is possible to determine the order in which each phosphate group is protonated, using the variation of the chemical shifts while the L10– species is successively protonated (Δδ p, Table 2). In addition, to assist in the analysis of the spatial requirements related to the protonation sequence, Fig. 4 shows the optimised HF/3-21+G* geometries for both conformational states of the Ins(1,3,4,5,6)P 5 species listed in Table 2.
Table 2. Calculated 31P NMR chemical shifts (HypNMR software25) for Ins(1,3,4,5,6)P 5 in the absence and presence of Na+ or Mg2+, in 0.15 M NMe4Cl, at 37.0 °C a .
| Cation | species | Calculated chemical shifts (ppm) |
Δδ
p (ppm) |
Δδ
c (ppm) |
||||||
| P1/P3 | P4/P6 | P5 | P1/P3 | P4/P6 | P5 | P1/P3 | P4/P6 | P5 | ||
| H+ | L10– | 7.001 | 5.777 | 6.236 | — | — | — | — | — | — |
| HL9– | 6.807 | 5.355 | 6.141 | –0.195 | –0.422 | –0.095 | — | — | — | |
| H2L8– | 6.298 | 4.352 | 5.607 | –0.509 | –1.003 | –0.535 | — | — | — | |
| H3L7– | 5.539 | 4.341 | 4.842 | –0.759 | –0.011 | –0.764 | — | — | — | |
| H4L6– | 3.147 | 4.383 | 4.698 | –2.392 | 0.042 | –0.144 | — | — | — | |
| H5L5– | 2.847 | 3.661 | 3.992 | –0.300 | –0.722 | –0.707 | — | — | — | |
| H6L4– | 2.777 | 3.639 | 4.104 | –0.070 | –0.023 | 0.112 | — | — | — | |
| H7L3– | 2.464 | 3.158 | 3.459 | –0.313 | –0.481 | –0.645 | — | — | — | |
| Na+ | [Na4L]6– | 7.395 | 6.598 | 6.868 | — | — | — | 0.394 | 0.821 | 0.632 |
| [Na3(HL)]6– | 7.364 | 6.688 | 6.813 | –0.031 | 0.090 | –0.055 | 0.557 | 1.333 | 0.672 | |
| [Na2(H2L)]6– | 6.481 | 4.680 | 5.588 | –0.883 | –2.008 | –1.225 | 0.183 | 0.328 | –0.019 | |
| Mg2+ | [Mg(HL)]7– | 7.031 | 6.665 | 6.181 | — | — | — | 0.224 | 1.310 | 0.039 |
| [Mg(H2L)]6– | 5.850 | 3.195 | 4.217 | –1.181 | –3.470 | –1.964 | –0.448 | –1.157 | –1.390 | |
| [Mg(H3L)]5– | 2.718 | 4.275 | 2.564 | –3.132 | 1.080 | –1.653 | –2.821 | –0.066 | –2.278 | |
| [Mg(H4L)]4– | 2.128 | 2.034 | 2.728 | –0.589 | –2.240 | 0.163 | –1.018 | –2.349 | –1.971 | |
aThe change in the chemical shifts due only to the protonation (Δδ p) or complexation (Δδ c) processes are included.
Fig. 4. RHF/3-21+G* geometries for both conformers of each Ins(1,3,4,5,6)P 5 species. L10– (a,h), HL9– (b,i), H2L8– (c,j), H3L7– (d,k), H4L6– (e,l), H5L5– (f,m) and H10L (g,n). The relevant intramolecular hydrogen bonds are shown as dashed lines with H···O distances in Å. Color code: C (grey), H (white), O (red), P (orange).
For the first protonation step, the values in Table 2 show that Δδ p is more negative for P4/P6. This indicates that the first H+ binds to the phosphate at position 4 or 6. Since the other phosphate groups are affected to a lesser extent, the incoming proton may associate with P1/P3 and P5 by a hydrogen bond (Fig. 4b and 4i). The second proton also links to P4/P6 (low value of Δδ p), indicating that both P4 and P6 are protonated in H2L8–. It is highly probable that these two protons are shared between neighbouring phosphate groups, somehow affecting P1/P3 and P5 signals as well (Fig. 4c and 4j). The formation of H3L7– is associated with a significant decrease in the chemical shift of P1/P3 and P5 signals. Interestingly, the P4/P6 signal is only slightly affected. According to the results of the molecular modelling study (Fig. 4d and 4k), this would be consistent with the protonation of P1/P3 or P5 and the subsequent rearrangement of the protons, so that in the final state the groups P1/P3, P5 and P4/P6 would be linked to a single proton each. In this process, P4/P6 loses one proton and begins to share two H+ by hydrogen bonds with the adjacent groups, which partially cancels the associated effects on δ. The next protonation step results in the formation of H4L6– (Fig. 4e and 4l), where the Δδ p values suggest that the incoming H+ is likely bound to P1/P3. Here, the rest of the phosphate groups are slightly affected. The process H4L6– → H5L5– involves the sharing of the fifth proton between P4/P6 and P5 (Fig. 4f and 4m), as indicated by the low Δδ p values for these groups. For the rest of the species the analysis becomes quite complex, since all signals are affected similarly. It is feasible that the absence of “free spaces” between adjacent phosphates would lead to continuous and dynamic rearrangements of the protons. Despite that, given the data in Table 2, the sixth proton could bind mainly to P1/P3, while the seventh would mostly be shared between P5 and P4/6.
We also carried out a quantitative approach to the protonation sequence, through the application of the Cluster Expansion Method.17 Ins(1,3,4,5,6)P 5 has five phosphate groups, and the only assumption required by the Cluster Expansion Method is that each site binds a single proton. Therefore, we analyzed the data above pH 3.7, taking into account the formation of the species H5L5–, H4L6–, H3L7–, H2L8–, HL9– and L10–. The calculation procedure is presented as ESI (Table S1†). Once the cluster parameters Δ lm and π({S i}) of the microscopic equilibria are known, the microscopic protonation constants can be calculated. The distribution of the protonated microspecies, shown in Fig. 3, is in agreement with the previous discussion based on the Δδ p values.
Our results are in agreement with those previously reported at pH 7.5 (0.2 M KCl at 37.0 °C).16 Some slight to moderate differences among them can be explained by the formation, under metal ion excess, of [Kx(HyL)](10–x–y)– species. Despite that, it seems clear in both cases that H3L7–(145/356) and H3L7–(146/346) are the predominant Ins(1,3,4,5,6)P 5 microspecies at physiological pH (Fig. 4d and 4k). In addition, our results allow us to extend the study towards more acidic conditions, like those found in some cellular vesicular compartments. In the pH range 4.5–6.5 the most abundant microspecies are H4L6–(1345/1356) and H5L5–, whose structures are depicted in Fig. 4e, 4l, 4f and 4m.
Conformational change in solution: energetic and structural analysis
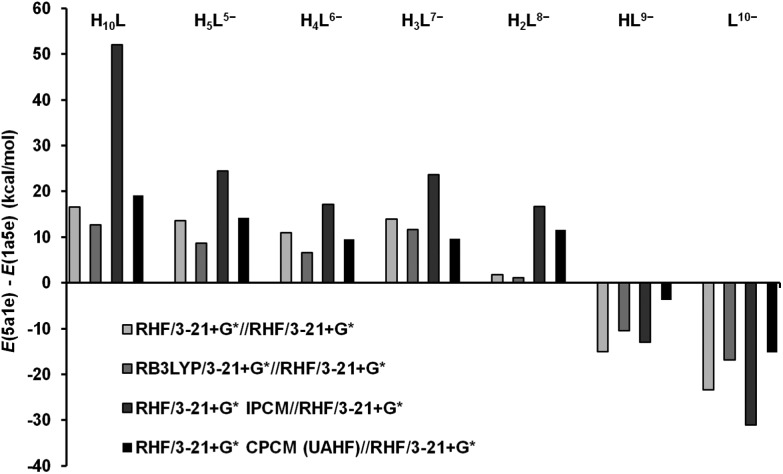
Ins(1,3,4,5,6)P 5 is known to experience a conformational inversion in aqueous solution at high pH, from the 1a5e to the 5a1e conformation.18 Starting from the optimised geometries depicted in Fig. 4, it is worth analyzing the energy difference between 5a1e and 1a5e Ins(1,3,4,5,6)P 5 conformers, ΔE, as the successive species become more protonated. The results are shown in Fig. 5. Overall, the values obtained in the absence of a solvent indicate that the most deprotonated species (L10– and HL9–) have a preference for the 5a1e conformation. In contrast, for those species with a medium to high degree of protonation (from H3L7– to H10L), the most stable state is 1a5e. In the case of H2L8–, its behaviour in the gas phase involves the coexistence of two nearly isoenergetic conformational states. The consideration of the electron correlation energy gives rise to the same conclusions, as the results are similar for both RHF and DFT methods. A closer look at the structures depicted in Fig. 4 can give a possible explanation for this trend. The most stable geometry seems to be determined by three factors, and the predominance of each of them depends on the degree of ligand protonation: (a) the electrostatic and steric repulsion among the phosphate groups, (b) the intramolecular hydrogen bonds, and (c) the constraint imposed on the carbon ring. Table 3 lists three parameters, X P–P, X O–H and Δθ axial–axial, related to these structural characteristics. The average separation of the phosphorus atoms (X P–P) is always greater for the 5a1e conformation. This fact indicates that the ionisable groups are more distant from one another when all are arranged in axial orientations. This effect is expected to be significant only when the ligand is highly deprotonated, as the negatively charged groups tend to repel one another. Hence, the 5a1e state is preferred for L10– and HL9–.
Fig. 5. Energy difference for the Ins(1,3,4,5,6)P 5 conformers as a function of the protonation state (RHF/3-21+G* geometries).
Table 3. Structural parameters for Ins(1,3,4,5,6)P 5 species in the presence and absence of Na+ .
| Cation | Species | Intramolecular hydrogen bonds |
P–P distance |
Ring deformation |
|||
|
X
O–H (Å)
a
|
X
P–P (Å)
b
|
Δθ
axial–axial (°)
c
|
|||||
| (1a5e) | (5a1e) | (1a5e) | (5a1e) | (1a5e) | (5a1e) | ||
| H+ | L10– | — | — | 5.52 | 5.89 | 20 | 39 |
| HL9– | 1.43 | 1.44 | 5.19 | 5.55 | 14 | 47 | |
| H2L8– | 1.59 | 1.58 | 4.87 | 5.39 | 8 | 44 | |
| H3L7– | 1.51 | 1.51 | 4.95 | 5.07 | 34 | 45 | |
| H4L6– | 1.55 | 1.60 | 4.85 | 5.05 | 36 | 46 | |
| H5L5– | 1.68 | 1.67 | 4.27 | 4.79 | 6 | 56 | |
| H10L | 1.66 | 1.73 | 4.10 | 4.54 | 4 | 53 | |
| Na+ | [Na4L]6– | — | — | 5.19 | 5.94 | 15 | 14 |
| [Na3(HL)]6– | 1.46 | 1.55 | — | — | 15 | 13 | |
| [Na2(H2L)]6– | 1.31 | 1.61 | — | — | 7 | 15 | |
a X O–H represents the average intramolecular hydrogen bond distance.
b X P–P corresponds to the average distance between the phosphorus atoms of the phosphate group located in adjacent carbons.
cΔθ axial–axial is the average deviation, from the expected value of 180°, of the dihedral angles formed by the axial groups situated in adjacent carbons.
With the addition of more protons, the phosphate groups begin to interact with one another through the formation of multiple hydrogen bonds (Fig. 4). According to Table 3, the average intramolecular hydrogen bond distance (X O–H) varies erratically, being similar for both conformations. Even though this behaviour does not explain the observed conformational change, this phenomenon leads to the approach of the negatively charged groups, causing some tension in the carbon ring. The deformation of the chair is more pronounced for the 5a1e state, as deduced from the average deviation of the dihedral angles formed by the axial groups (Δθ axial–axial). This is due to the great structural alteration required for the establishment of strong intramolecular hydrogen bonds between axial groups. Since this phenomenon depends on the formation of hydrogen bonds, it becomes increasingly important with decreasing pH. Thus, for protonated species, the 1a5e conformation is more stable, providing an appropriate spatial arrangement of the ionisable groups, which allows a favorable phosphate–proton–phosphate interaction, with minimum structural deformation. Finally, it is interesting to estimate the contribution of the solvent to the conformational change process. It is worth mentioning that for those highly charged species the relaxing effect given by the geometry optimization in the presence of a dielectric may not be negligible.
In spite of this, we consider that these gas phase geometries are a suitable representation of the structures in solution and also the relaxing effect is partially cancelled in the ΔE values. ΔE values in water, determined by two different methods, IPCM and CPCM, are summarized in Fig. 5. Both are in accordance with the results in the gas phase. It seems that the hydration of the species does not significantly alter the relative stability of the conformers. However, the ligand–solvent interaction appears to be critical for defining the pH range in which the conformational change occurs: while in the gas phase the transition is activated by the H3L7––HL9– transformation, the hydration of the species restricts this process to the second protonation of the ligand. The signal broadening in the Ins(1,3,4,5,6)P 5 31P NMR spectra has been previously related to the conformational change of this ligand in solution.16 Under our experimental conditions, the pH range associated with this phenomenon is 10.4–11.7 (see Fig. S1a†). This zone is highlighted in the species distribution diagram of Fig. 3, where it can be seen that HL9– and H2L8– coexist, in agreement with the computational results discussed above.
The same conformational change was reported at a lower pH interval under conditions of K+ excess.16 The difference with the results reported here is rationalized by the high concentration of K+ used in that report (0.2 M). As discussed below, the presence of an excess of the alkali ion influences the acid–base properties of the ligand to a large extent.
Coordination properties of Ins(1,3,4,5,6)P 5 towards Na+
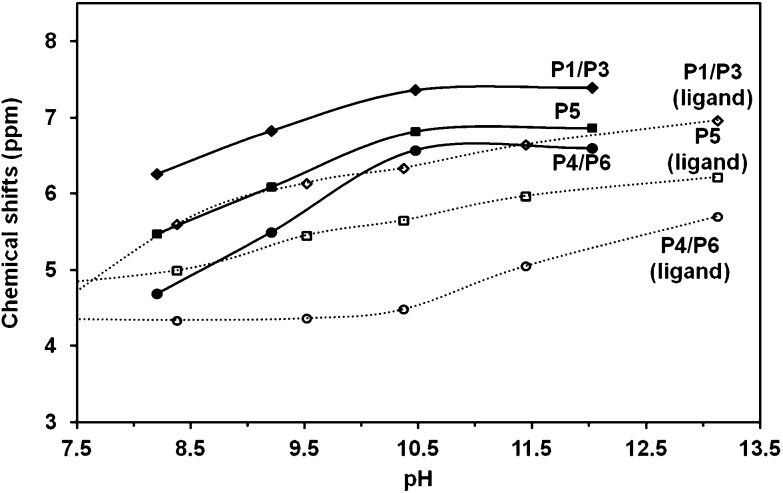
Fig. 6 shows the 31P NMR chemical shifts as a function of pH for the Na+–Ins(1,3,4,5,6)P 5 system. The curves are considerably affected by the presence of the alkali ion, as can be seen from the comparison of the curves of the ligand in the absence and presence of the metal ion. The stoichiometry and the stability constants of the corresponding complexes are shown in Table 1. Although other models of chemical species were assayed, the results obtained were unsatisfactory. All three of the sodium complexes are essential for a good fitting of the 31P NMR data (see Fig. S3 in the ESI†).
Fig. 6. 31P NMR chemical shifts for the Na+–Ins(1,3,4,5,6)P 5 system as a function of pH in 0.15 M NMe4Cl at 37.0 °C. [Ins(1,3,4,5,6)P 5] = 4.8 mM, [Na+] = 0.5 M. The solid lines show the HypNMR expected chemical shifts, according to the adjusted constants given in Table 1. For comparison, the chemical shifts for the ligand in the absence of cations are also shown.
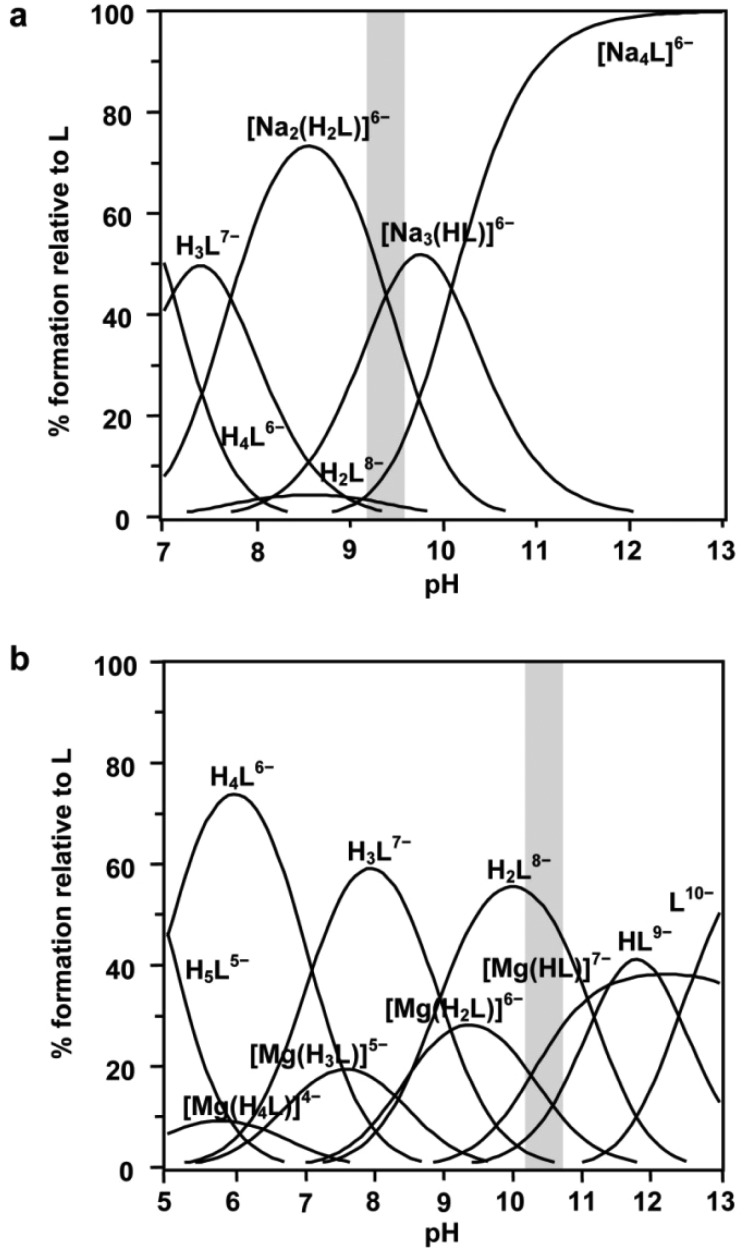
All of the Na+ complexes are polynuclear: [Na2(H2L)]6–, [Na3(HL)]6– and [Na4L]6–. The equilibrium constants are similar to those determined potentiometrically.6 Although they are not high in absolute terms they are exceptionally high for complexes involving alkali metal ions. For this reason, the Na+–Ins(1,3,4,5,6)P 5 species are very important for understanding the chemical behaviour of Ins(1,3,4,5,6)P 5 in extracellular compartments, where the Na+ concentration is high. The calculated chemical shifts for Na+–Ins(1,3,4,5,6)P 5 species are listed in Table 2. Apart from Δδ p, the variation of the chemical shifts for the respective ligand species owing only to the metal complexation, Δδ c, is also listed. There are two main trends. First, in most cases Δδ c values are positive. This implies a deshielding of the phosphorus atom through the polarization of phosphate electron density towards the sodium cations. Secondly, Δδ p values are mostly negative. This is explained by the change observed in the stoichiometry and the charge of the species as the pH decreases (Fig. 7a). From basic to acidic media, not only are the species progressively protonated, but they also gradually lose Na+cations.
Fig. 7. Species distribution diagram for Ins(1,3,4,5,6)P 5 in the presence of Na+ (a) or Mg2+ (b). Predictions are for [Ins(1,3,4,5,6)P 5] = 4.8 mM, [Na+] = 0.5 M (a) or [Ins(1,3,4,5,6)P 5] = 2.5 mM, [Mg2+] = 1.0 mM (b), in 0.15 M NMe4Cl and 37.0 °C. The pH range in which the ligand conformational change takes place is highlighted in each case.
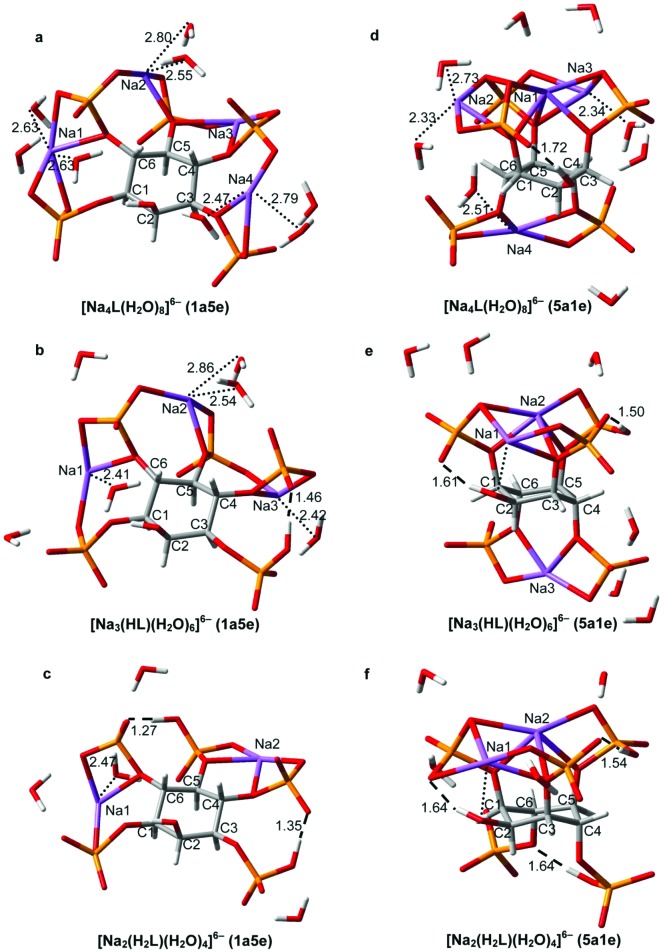
The optimized DFT geometries for 1a5e and 5a1e conformations of these Na+ complexes are presented in Fig. 8.
Fig. 8. RB3LYP/LANL2DZ geometries for both conformations of Na+–Ins(1,3,4,5,6)P 5 complexes. [Na4L]6– (a,d), [Na3(HL)]6– (b,e), [Na2(H2L)]6– (c,f). The strongest intramolecular hydrogen bonds are shown as dashed lines, with H···O distances in Å. The sodium-coordinated H2O bonds are depicted as dotted lines, with the associated Na···OH2 distances given in Å. Color code: C (grey), H (white), O (red), P (orange), Na (violet).
All of them resemble ionic-pair like species. In these complexes, the phosphate groups are linked to various Na+cations, giving priority to the electrostatic cation–anion attraction against the completion of all the positions in the metal coordination sphere. Water molecules hydrate the anionic species as a whole.
For [Na4L]6–, the Δδ c values are all different, which is consistent with a complex coordination pattern involving Na+cations being linked to more than one phosphate group (Fig. 8a and 8d). Additionally, only in the 5a1e conformation of the ligand the phosphates at C4 and C6 are far from the other phosphate groups. This seems to be more consistent with the higher deshielding of P4/P6 with respect to P1/P3 and P5 (Table 2). The addition of the first proton gives rise to the loss of one Na+, leading to [Na3(HL)]6–. According to the Δδ p, it is feasible that the Na+–H+ interchange takes place between P1/P3 and P5 (Fig. 8b and 8e). Again, it is the 5a1e state which allows better agreement between experimental and computational results. Only in this conformation are P1/P3 and P5 near enough to interact through an intramolecular H-bond. Moreover, the sodium–proton interchange generates, in the axial state, a rearrangement of the Na+ ion which operates above the ring (Fig. 8d and 8e). This internal redistribution would partially neutralize the effect of protonation, making Δδ p for P1/3 and P5 close to zero (Table 2). What is more, the modelling of the axial conformation of [Na3(HL)]6– predicts a complete proton transfer from P4/P6 to P1/3–P5, being completely in accordance with the high Δδ c value for P4/P6 observed in the process HL9– → [Na3(HL)]6–. The second protonation is triggered by another Na+–H+ exchange, resulting in [Na2(H2L)]6– (Fig. 8c and 8f). Following the Δδ p values, the protonation would be on P4/P6, so it is expected that the metal cation they shared is released. Interestingly, the P1/P3 and P5 signals are greatly affected in this process, which suggests a spatial connection between them and P4/P6. Since this can occur easily if all groups are equatorial, the 1a5e conformation would be preferred for [Na2(H2L)]6–. This fact would also explain why the |Δδ p| values, calculated for 5a1e [Na3(HL)]6– → 1a5e [Na2(H2L)]6–, are much higher than those for |Δδ c|, determined for 1a5e H2L8– → 1a5e [Na2(H2L)]6–, as the former process implies a much more drastic structural change.
This conformational change seems to operate, according to the broadening of the NMR signals (Fig. S1b†), near pH = 9.2, where, in line with the distribution of the species, both complexes [Na2(H2L)]6– and [Na3(HL)]6– coexist (Fig. 7a).
Na+ influence on the ligand conformational change
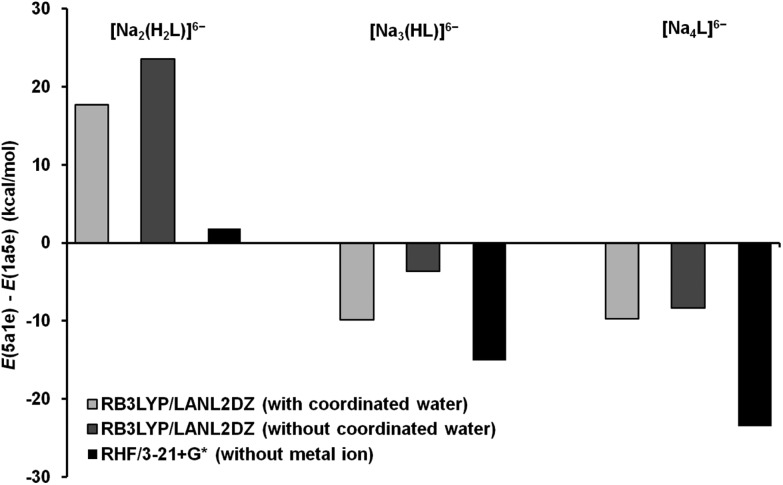
So as to analyse the influence of Na+ complexation on the stability of both conformational states, the conformational energy difference values (ΔE), for the ligand and the Ins(1,3,4,5,6)P 5–Na+ complexes, are depicted in Fig. 9. According to the computational results, the ligand conformational transition is predicted, under an excess of sodium cations, between [Na2(H2L)]6– and [Na3(HL)]6–. This completely agrees with the NMR data.
Fig. 9. Conformational energy difference for the Na+–Ins(1,3,4,5,6)P 5 complexes with and without coordinated water (RB3LYP/LANL2DZ geometries). The ΔE values for the ligand are shown for comparison.
At pH values just above 7, the ligand is associated with two sodium ions and two protons, stabilizing the 1a5e state. The 1a5e conformation allows the [Na2(H2L)]6– complex to minimize the average distance of the intramolecular H-bonds with a minimum constraint imposed on the carbon ring (see Fig. 8c and 8f, and X O–H and Δθ axial–axial values in Table 3). The two alkali ions seem to simply relieve the phosphate–phosphate repulsion. As the ligand is deprotonated, it associates with additional Na+ ions. With only one proton, the formation of strong hydrogen bonds becomes less important, while the phosphate–Na+ electrostatic interactions become more relevant. In line with this, the 5a1e conformation has a suitable geometry to complex all the Na cations, keeping the negatively charged groups far enough apart without a drastic change in the structure (higher value of X P–P and slightly lower value of Δθ axial–axial, Table 3). In particular, the space between P4 and P6 is very appropriate for metal binding; indeed, this is where the alkali ion locates, triggering the conformational change toward the axial state in the [Na2(H2L)]6– → [Na3(HL)]6– process. According to the ΔE values in Fig. 9, it can be seen that the complexation, whether in gas phase or in solution, favours the 1a5e state. The equatorial conformation compels all the phosphate groups to be closer, being stabilized when two or more protons are bound to the ligand. The Na+–Ins(1,3,4,5,6)P 5 association alleviates the inter-phosphate repulsion to a much greater extent in the 1a5e than in the 5a1e conformation. On the other hand, the inclusion of the solvent favours the axial state moderately. Looking at the structures in Fig. 8, in the 1a5e conformation the Na+–H2O affinity seems to be higher than in the 5a1e state, leaving the cations more exposed to the solution and lowering the Na+–phosphate interaction energy.
The complexation performance of Ins(1,3,4,5,6)P 5 in the presence of Mg2+
Fig. 10 shows the 31P NMR chemical shifts as a function of pH for the Mg2+–Ins(1,3,4,5,6)P 5 system. In comparison to the curves in the absence of metal ions, the addition of Mg2+ produces an additional chemical shift due to coordination, which is either positive or negative depending on the pH value. This behaviour has been reported earlier with other metal ions, and is related to the multiple complexation and deprotonation processes established in solution, which inversely affects the chemical shifts.36
Fig. 10. 31P NMR chemical shifts for the Mg2+–Ins(1,3,4,5,6)P 5 system as a function of pH in 0.15 M NMe4Cl at 37.0 °C. [Ins(1,3,4,5,6)P 5] = 2.5 mM, [Mg2+] = 1.0 mM. The solid lines show the HypNMR expected chemical shifts, according to the adjusted constants given in Table 1. For comparison, the chemical shifts for the ligand in the absence of cations are also shown.
Table 1 shows the formation constants of the complexes between Ins(1,3,4,5,6)P 5 and Mg2+ obtained from the 31P NMR data. All the detected species are highly stable and have the same 1 : 1 stoichiometry, differing only in the extent of ligand protonation: [Mg(HL)]7–, [Mg(H2L)]6–, [Mg(H3L)]5– and [Mg(H4L)]4–. The values determined are close to those obtained by potentiometry,6 with the exception of the polynuclear [Mg4(H2L)] species, which are not abundant enough to be detectable under our ligand-excess conditions. According to Fig. 7b, in a 2.5 mM Ins(1,3,4,5,6)P 5 and 0.99 mM Mg2+ solution, the metal species become detectable above pH 4, being predominantly [Mg(H3L)]5–, H4L6– and H3L7– near the physiological pH value.
In Table 2 the calculated individual chemical shifts for Mg–Ins(1,3,4,5,6)P 5 species are listed. Fig. S2† shows a scheme of the most probable H+ and Na+ location on the ligand. Interestingly, [Mg(HL)]7– has a high Δδ c value for P4/P6. This could be explained by a proton shift from P4/P6 in HL9– to P1/3 and P5 in [Mg(HL)]7–. Since δ decreases with complexation and protonation processes, it is likely that P4/P6 are not involved in any of them. Then, a feasible structure for this complex would imply the 5a1e conformation, and would involve the groups P1/P3 and P5 sharing one Mg2+ and one H+ above the ring.
In the [Mg(HL)]7– → [Mg(H2L)]6– process, P4/P6 and P5 are strongly affected (Table 2). In addition, for the process H2L6– → [Mg(H2L)]6–, the associated Δδ c values are also lower for these groups. This evidence suggests that the magnesium ion would be linked to P4/P6 and P5 (Fig. S2†), while one of the two H+ in H2L2– (located on P4 and P6, Fig. 3) would be shifted to P1/P3 (Δδ c < 0). Thus, our model predicts a conformational change between [Mg(HL)]7– and [Mg(H2L)]6–, both predominant under pH values in the range 10–11 (Fig. 7b). Experimentally, these facts are in accordance with the broadening of the signal registered for the NMR spectrum at pH = 10.39 (Fig. S1c†).
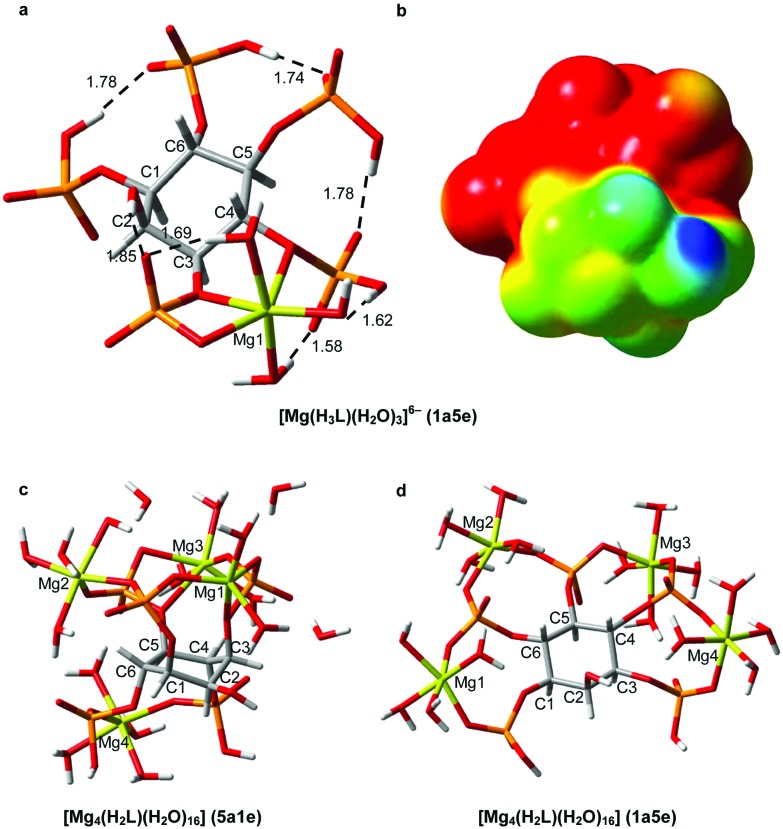
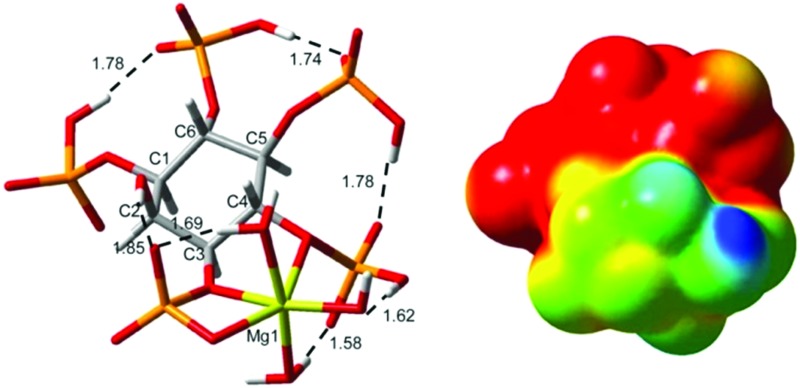
The formation of [Mg(H3L)]5– leads to negative Δδ p values for P1/P3 and P5, while the P4/P6 group is deshielded. A possible justification for this behaviour arises from the computational modelling of this complex (Fig. 11a). The results show a rearrangement of the cations over the ligand, triggered by the incoming H+, possibly bound to P5 (Δδ p < 0, Table 2). The resulting geometry has its protons shared among P5, P4/P6 and P1/P3, while the Mg cation would be linked mainly by P1/P3 (very low Δδ p and Δδ c values) with minor assistance from P4/P6. As can be seen, P4/P6 tends to move away from the metal ion, explaining its high Δδ p and small Δδ c values. This effect is quite noticeable; the P1–Mg distance is 2.8 Å, while the P6–Mg distance is 3.4 Å.
Fig. 11. RB3LYP/6-31+G* geometries for the Mg2+–Ins(1,3,4,5,6)P 5 species predominant under simulated cellular conditions. [Mg(H3L)]6– (a), [Mg4(H2L)] (c,d). In (a), the relevant intramolecular hydrogen bonds are shown as dashed lines with H···O distances in Å. In (b), the electrostatic potential of (a) is mapped onto an isodensity surface (isodensity value = 0.0004 e). Color code: C (grey), H (white), O (red), P (orange), Mg (yellow).
The next H+ would be shared between P4/P6 and P1/P3 (low Δδ p, see Table 2 and Fig. S2†). Nevertheless, since there are a large number of protons apart from the metal ion in [Mg(H4L)]4–, a thorough analysis is not straightforward. As expected, all the phosphate groups are affected by the protonation and complexation processes through the net of intramolecular hydrogen bonds.
Biologically relevant Ins(1,3,4,5,6)P 5 species
Since acquiring more structural information on Ins(1,3,4,5,6)P 5 is one of the main issues in gaining reliable knowledge of the biological roles of this InsP 5, it is worth addressing some pressing points associated with the structural data presented here for those biologically relevant Ins(1,3,4,5,6)P 5 species.
Most Ins(1,3,4,5,6)P 5 in mammalian cells is thought to be present in the cytosolic and/or nuclear compartments,37 and its concentration can reach values as high as 7 mM.1 Besides, concentrations of InsP 5 in the 10–20 nM range have been reported in rat plasma.38 Generally, under conditions corresponding to those biological systems the Ins(1,3,4,5,6)P 5 is partly associated with Mg2+, Ca2+, K+ and/or Na+.6
The free Ins(1,3,4,5,6)P 5 is predicted to exist predominantly as the highly charged species [H4L]6– and [H3L]7–, whose optimized geometries are depicted in Fig. 4d and 4e. The computational and experimental data agree that the 1a5e conformation is the preferred state. In contrast to what was reported for Ins(1,2,3)P 3,7 the electrostatic potential analysis shows that the negative charge is not localized towards one side of the ligand (not shown), but is extended over all the phosphate groups. The high charge of these anionic species will lead to strong electrostatic interactions with cations, a significant feature under the Na+/K+-excess condition found in physiological media.
A small proportion of Ins(1,3,4,5,6)P 5 is predicted to be associated with K+ (intracellular media) or Na+ (extracellular media). In this sense, since the interaction between Ins(1,3,4,5,6)P 5 and K+ or Na+ is analogous,6 the structures depicted in Fig. 8 shed light on the most important structural characteristics of M+–Ins(1,3,4,5,6)P 5 relevant species. The ideal site for the metal ion will be between adjacent phosphate groups, while the M+–H2O affinity would be low. This coordination pattern would give rise to a local neutralization of the negative charge, allowing the repulsion among the phosphate groups to decrease. For Na+/K+–Ins(1,3,4,5,6)P 5 species, the protonation, complexation and hydration processes modulate the conformational change of the ligand. At pH = 7.4, though, the 1a5e conformation is predicted as the only possibility, with [M2(H2L)]6– being the predominant M+–Ins(1,3,4,5,6)P 5 species.
With respect to the M2+–Ins(1,3,4,5,6)P 5 species, those predominant under intra and extracellular conditions are [Mg(H3L)]5–, [Mg4(H2L)] and [Ca4(H2L)]. For the 1 : 1 InsP 5–Mg complex, the optimized structure is shown in Fig. 11a. The magnesium ion is expected to be coordinated in a distorted octahedral environment involving two phosphate groups and three coordinating waters. As discussed above, the P4/P6 group moves away from the Mg2+ ion, which would lead to the deprotonation of a coordinated water molecule. To study both polynuclear Mg/Ca-species, we carried out 6-31+G* geometry optimization runs for both conformational states of [Mg4(H2L)]. The results are given in Fig. 11c and 11d. Each magnesium ion binds to several phosphate groups and vice versa, in a structure where all Mg2+cations are strongly anchored to pairs of phosphates, which act as negatively charged “clamps”. Although this coordination pattern allows Ins(1,3,4,5,6)P 5 to have great sequestering ability towards metal ions, the complexation process involves an adaptation of these “clamps” to the size of the cation, explaining the fact that this InsP 5 is selective only to the charge of the Mn+ ions.6
A search of the Protein Databank (PDB) using the keyword “inositol” produced 13 hits concerning the Ins(1,3,4,5,6)P 5 2-kinase and its complexes with various molecules, including this InsP 5.39 This protein catalyses the synthesis of InsP 6 from Ins(1,3,4,5,6)P 5 and ATP, being unique in nature. The high charge and the spatial requirements involved in the substrate–protein interaction are important, as Ins(1,3,4,5,6)P 5 is tightly bound to the enzyme through all the phosphate groups, and there is a specific zone responsible for the recognition of the axial 2-OH. In addition, the presence of metal ions seems to be vital. In fact, in the process of phosphate transfer the Mg2+ ion plays an essential role in binding the substrates and the products. This information leads to the suggestion that Ins(1,3,4,5,6)P 5 could be docked to the active site of the protein also as a metal complex. The majority of the metal–Ins(1,3,4,5,6)P 5 complexes are highly charged, making the whole charge of the species and its distribution an important issue in modulating InsPs–protein interactions. As an example of this, Fig. 11b shows, on an isodensity surface, the distribution of the molecular electrostatic potential for [Mg(H3L)]5–. The first consequence of the metal binding is the decrease in the negative charge of the ligand. In addition, the electrostatic metal–ligand attraction and the repulsion among the ionisable groups drive the cation directly between two adjacent phosphate groups. Therefore, the charge distribution of the ligand is then drastically affected. Consequently, if the Ins(1,3,4,5,6)P 5 2-kinase or another protein is biochemically related to this Ins(1,3,4,5,6)P 5 metal complex, it must display an active site whose electrostatic features recognize the biphasic behaviour exhibited by the [Mg(H3L)]5– electrostatic potential.
Conclusions
In this work we have presented, for the first time, the study of the inframolecular aspects of Ins(1,3,4,5,6)P 5 protonation equilibria and the analysis of the microscopic details of its coordination behaviour towards biologically relevant metal ions. Our results predict that the predominant species at physiological pH are H4L6– and H3L7–. The ligand protonation sequence and the probabilities of each of the microspecies in solution indicate that H3L7–(145/356) and H3L7–(146/346) are the predominant Ins(1,3,4,5,6)P 5 microspecies at physiological pH, while under acidic conditions found in some vesicular compartments the most abundant microspecies are H4L6–(1345/1356) and H5L5–. We have also confirmed, both experimentally and computationally, that the conformational change suffered by this InsP 5 is triggered by the reaction involving HL9– and H2L10–. The fit of the spectroscopic data allowed us to detect polynuclear complexes with Na+ of general formula [Nai(HjL)](10–i–j)– with i : j = (2 : 2), (3 : 1) and (4 : 0). Under conditions close to the cytosol and nucleus, the present species with sodium is [Na2(H2L)]6–. In the presence of Mg2+, species of general stoichiometry [Mg(HjL)](10–2–j)– with 1 ≤ j ≤ 4 were detected. By means of the spectroscopic data and the information provided by molecular modelling tools, we characterized the structure of the species and analyzed the topological details of the protonation and complexation processes.
Acknowledgments
N.V. is indebted to PEDECIBA-Química, to CSIC (Programa de Apoyo a Grupos de Investigación) and to ANII (Agencia Nacional de Investigación e Innovación) for a scholarship. We thank the Wellcome Trust for Programme Grant Support (082837 to A.M.R. and B.V.L.P).
Footnotes
References
- Irvine R. F., Schell M. J. Nat. Rev. Mol. Cell Biol. 2001;2:327–338. doi: 10.1038/35073015. [DOI] [PubMed] [Google Scholar]
- Sands S. H., Biskobing S. J. and Olson R. M., in Phytic Acid: Chemistry and Applications, Pilatus Press, 1986, pp. 119–125 [Google Scholar]
- Kaufman H. W., in Phytic Acid: Chemistry and Applications, Pilatus Press, 1986, pp. 303–320 [Google Scholar]
- Graf E., in Phytic Acid: Chemistry and Applications, Pilatus Press, 1986, pp. 1–21 [Google Scholar]
- Yang L., Liu H., Hu N. Electrochem. Commun. 2007;9:1057–1061. [Google Scholar]
- Veiga N., Torres J., Godage H. Y., Riley A. M., Domínguez S., Potter B. V. L., Díaz A., Kremer C. J. Biol. Inorg. Chem. 2009;14:1001–1013. doi: 10.1007/s00775-009-0510-z. [DOI] [PMC free article] [PubMed] [Google Scholar]
- Veiga N., Torres J., Mansell D., Freeman S., Domínguez S., Barker C. J., Díaz A., Kremer C. J. Biol. Inorg. Chem. 2009;14:51–59. doi: 10.1007/s00775-008-0423-2. [DOI] [PubMed] [Google Scholar]
- Torres J., Veiga N., Gancheff J. S., Domínguez S., Mederos A., Sundberg M., Sánchez A., Castiglioni J., Díaz A., Kremer C. J. Mol. Struct. 2008;874:77–88. [Google Scholar]
- Casaravilla C., Brearley C., Soulé S., Fontana C., Veiga N., Bessio M. I., Ferreira F., Kremer C., Díaz A. FEBS J. 2006;273:3192–3203. doi: 10.1111/j.1742-4658.2006.05328.x. [DOI] [PubMed] [Google Scholar]
- Veiga N., Torres J., Domínguez S., Mederos A., Irvine R. F., Díaz A., Kremer C. J. Inorg. Biochem. 2006;100:1800–1810. doi: 10.1016/j.jinorgbio.2006.06.016. [DOI] [PMC free article] [PubMed] [Google Scholar]
- Torres J., Domínguez S., Cerdá M. F., Obal G., Mederos A., Irvine R. F., Díaz A., Kremer C. J. Inorg. Biochem. 2005;99:828–840. doi: 10.1016/j.jinorgbio.2004.12.011. [DOI] [PubMed] [Google Scholar]
- Mernissi-Arifi K., Wehrer C., Schlewer G., Spiess B. J. Inorg. Biochem. 1994;55:263–277. [Google Scholar]
- Felemez M., Ballereau S., Schlewer G., Spiess B. New J. Chem. 2000;24:631–638. [Google Scholar]
- Felemez M., Marwood R. D., Potter B. V. L., Spiess B. Biochem. Biophys. Res. Commun. 1999;266:334–340. doi: 10.1006/bbrc.1999.1832. [DOI] [PubMed] [Google Scholar]
- Dozol H., Blum-Held C., Guedat P., Maechling C., Lanners S., Schlewer G., Spiess B. J. Mol. Struct. 2002;643:171–181. [Google Scholar]
- Riley A. M., Trusselle M., Kuad P., Borkovec M., Cho J., Choi J. H., Qian X., Shears S. B., Spiess B., Potter B. V. L. ChemBioChem. 2006;7:1114–1122. doi: 10.1002/cbic.200600037. [DOI] [PMC free article] [PubMed] [Google Scholar]
- Borkovec M., Koper G. J. M. Anal. Chem. 2000;72:3272–3279. doi: 10.1021/ac991494p. [DOI] [PubMed] [Google Scholar]
- Volkmann C. J., Chateauneuf G. M., Pradhan J., Bauman A. T., Brown R. E., Murthy P. P. N. Tetrahedron Lett. 2002;43:4853–4856. [Google Scholar]
- Johnson L. F., Tate M. E. Can. J. Chem. 1969;47:63–73. [Google Scholar]
- Stephens L. R., Hawkins P. T., Stanley A. F., Moore T., Poyner D. R., Morris P. J., Hanley M. R., Kay R. R., Irvine R. F. Biochem. J. 1991;275:485–499. doi: 10.1042/bj2750485. [DOI] [PMC free article] [PubMed] [Google Scholar]
- Guse A. H., Emmrich F. J. Biol. Chem. 1991;266:24498–24502. [PubMed] [Google Scholar]
- McConnell F. M., Stephens L. R., Shears S. B. Biochem. J. 1991;280:323–329. doi: 10.1042/bj2800323. [DOI] [PMC free article] [PubMed] [Google Scholar]
- Veiga N., Torres J., González G., Gómez K., Mansell D., Freeman S., Domínguez S., Kremer C. J. Mol. Struct. 2011;986:75–85. [Google Scholar]
- Veiga N., Torres J., Cerdá M. F., González G., Gómez K., Mansell D., Freeman S., Domínguez S., Kremer C. J. Mol. Struct. 2011;994:343–349. [Google Scholar]
- Frassineti C., Ghelli S., Gans P., Sabatini A., Moruzzi M. S., Vacca A. Anal. Biochem. 1995;231:374–382. doi: 10.1006/abio.1995.9984. [DOI] [PubMed] [Google Scholar]
- Farkas O., Schlegel H. B. J. Chem. Phys. 1999;111:10806–10814. [Google Scholar]
- Fritsch J., Trucks G. W., Schlegel H. B., Scuseria G. E., Robb M. A., Cheeseman J. R., Montgomery, Jr. J. A., Vreven T., Kudin K. N., Burant J. C., Millam J. M., Iyengar S. S., Tomasi J., Barone V., Mennucci B., Cossi M., Scalmani G., Rega N., Petersson G. A., Nakatsuji H., Hada M., Ehara M., Toyota K., Fukuda R., Hasegawa J., Ishida M., Nakajima T., Honda Y., Kitao O., Nakai H., Klene M., Li X., Knox J. E., Hratchian H. P., Cross J. B., Adamo C., Jaramillo J., Gomperts R., Stratmann R. E., Yazyev O., Austin A. J., Cammi R., Pomelli C., Ochterski J. W., Ayala P. Y., Morokuma K., Voth G. A., Salvador P., Dannenberg J. J., Zakrzewski V. G., Dapprich S., Daniels A. D., Strain M. C., Farkas O., Malick D. K., Rabuck A. D., Raghavachari K., Foresman J. B., Ortiz J. V., Cui Q., Baboul A. G., Clifford S., Cioslowski J., Stefanov B. B., Liu G., Liashenko A., Piskorz P., Komaromi I., Martin R. L., Fox D. J., Keith T., Al-Laham M. A., Peng C. Y., Nanayakkara A., Challacombe M., Gill P. M. W., Johnson B., Chen W., Wong M. W., Gonzalez C. and Pople J. A., Gaussian, Inc., Pittsburgh PA, 2003
- Dobbs K. D., Hehre W. J. J. Comput. Chem. 1987;8:880–893. [Google Scholar]
- Becke A. D. J. Chem. Phys. 1993;98:1372–1377. [Google Scholar]
- Foresman J. B., Keith T. A., Wiberg K. B., Snoonian J., Frisch M. J. J. Chem. Phys. 1996;100:16098–16104. [Google Scholar]
- Tomasi J., Mennuci B., Cancés E. Chem. Rev. 2005;105:2999–3093. doi: 10.1021/cr9904009. [DOI] [PubMed] [Google Scholar]
- Hypercube, Hyperchem 7.5 for Windows Molecular Modeling System, 2002
- Dunning Jr. T. H. and Hay P. J., in Modern Theoretical Chemistry, Plenum, 1976, pp. 1–28 [Google Scholar]
- Hay P. J., Wadt W. R. J. Chem. Phys. 1985;82:299–310. [Google Scholar]
- Moedritzer K. Inorg. Chem. 1967;6:936–939. [Google Scholar]
- Bebot-Brigaud A., Dange G., Fauconnier N., Gérard C. J. Inorg. Biochem. 1999;75:71–78. [Google Scholar]
- Stuart J. A., Anderson K. L., French P. J., Kirk C. J., Michell R. H. Biochem. J. 1994;303:517–525. doi: 10.1042/bj3030517. [DOI] [PMC free article] [PubMed] [Google Scholar]
- Grases F., Simonet B. M., Prieto R. M., March J. G. J. Nutr. Biochem. 2001;12:595–601. doi: 10.1016/s0955-2863(01)00178-4. [DOI] [PubMed] [Google Scholar]
- González B., Baños-Sanz J. I., Villate M., Brearley C. A., Sanz-Aparicio J. Proc. Natl. Acad. Sci. U. S. A. 2010;107:9608–9613. doi: 10.1073/pnas.0912979107. [DOI] [PMC free article] [PubMed] [Google Scholar]
Associated Data
This section collects any data citations, data availability statements, or supplementary materials included in this article.


