Abstract
The C1858T single nucleotide polymorphism in PTPN22, which is the gene encoding lymphoid tyrosine phosphatase (LYP), confers increased risk for various autoimmune disorders in Caucasians. Although the disease-associated LYP allele (LYP*W620) is a gain-of-function variant that has higher catalytic activity than the major allele (LYP*R620), it is still unclear how LYP*W620 predisposes for autoimmunity. Here, we compared both T cell signaling and T cell function in healthy human donors homozygous for either LYP*R620 or LYP*W620. Generally, the presence of LYP*W620 caused reduced proximal T cell antigen receptor-mediated signaling (e.g. ζ chain phosphorylation) but augmented CD28-associated signaling (e.g. AKT activation). Altered ligand binding properties of the two LYP variants could explain these findings since LYP*R620 interacted more strongly with the p85 subunit of PI3K. Variation in signaling between cells expressing either LYP*R620 or LYP*W620 also affected the differentiation of conventional CD4+ T cells. For example, LYP*W620 homozygous donors displayed exaggerated Th1 responses (e.g. IFNγ production) and reduced Th17 responses (e.g. IL-17 production). Importantly, while regulatory T cells normally suppressed Th1-mediated IFNγ production in LYP*R620 homozygous individuals, such suppression was lost in LYP*W620 homozygous individuals. Altogether, these findings provide a molecular and cellular explanation for the autoimmune phenotype associated with LYP*W620.
Keywords: LYP, PTPN22, TCR, autoimmunity
1. Introduction
Lymphoid tyrosine phosphatase (LYP)1, which is encoded by the gene PTPN22, is a protein tyrosine phosphatase (PTP) mainly expressed in hematopoietic cells [1]. From the N to the C terminus, LYP consists of a PTP domain, a mid portion with poorly defined function, and a C-terminal part containing four proline-rich regions termed P1–P4 [1]. The best characterized binding partner of LYP is C-terminal SRC kinase (CSK); the SH3 domain of CSK interacts dynamically with P1 in LYP [2–4]. In T cells, LYP acts as a negative regulator of signaling downstream of the T cell antigen receptor (TCR) [1]. The main substrates for LYP in T cells are LCK, FYN, ZAP-70, the CD3/ζ subunits of the TCR complex, and VAV [5].
In Caucasians, the C1858T single nucleotide polymorphism (SNP) in PTPN22 confers increased risk for the autoimmune diseases classically characterized by autoantibody production [1,6]. The C1858T SNP leads to alteration of amino acid 620 in LYP from arginine in the normal version of the protein (LYP*R620) to tryptophan in the disease-associated allele (LYP*W620). Residue 620 is located in P1, and the R620W mutation affects the structure of P1 so that LYP*W620 is unable to bind the SH3 domain of CSK [3,7]. Although residue 620 is more than 300 amino acids away from the PTP domain in the primary structure of LYP, LYP*W620 has approximately 50% higher PTP activity than LYP*R620 [8]. A molecular explanation for this finding is still lacking, but it has been proposed that the PTP activity of LYP*R620 is more easily down-regulated through phosphorylation of Y536 [9]. Compared to LYP*R620, LYP*W620 is also a more potent inhibitor of both TCR signaling in T cells [8,10] and B cell receptor (BCR) signaling in B cells [10,11]. Altogether, these data suggest that LYP*W620 is a gain-of-function variant.
The mouse ortholog of LYP is called Pep. LYP and Pep are 89% sequence identical in their PTP domains, but only 61% sequence identical in their non-catalytic portions. Studies of mice with a mutation corresponding to the LYP-R620W variant (Pep-R619W knock-in mice) have revealed that Pep-R619W is an unstable protein compared to wild-type Pep [12]. However, LYP expression studies with primary human T cells derived from genotyped healthy individuals (homozygous for either LYP*R620 or LYP*W620) have clearly demonstrated comparable expression of the two LYP variants [4]. Thus, findings with Pep in the mouse system seem to be of little relevance for LYP-related human diseases. This notion is further supported by experiments with Pep-R619W knock-in mice, which fail to replicate the autoimmune phenotype associated with LYP*W620 [12]. In fact, apart from slightly enlarged thymi and spleens, Pep-R619W mice do not show any signs of autoimmunity or organ pathology.
A detailed explanation for how LYP*W620 predisposes for autoimmunity is lacking. Given the crucial role for CD4+ T cells in the pathogenesis of most autoimmune disorders, and to better understand the effects of the LYP-R620W mutation, we conducted a systematic analysis of primary human CD4+ T cells from healthy blood donors homozygous for either LYP*R620 or LYP*W620 (hereafter referred to as RR and WW T cells, respectively, while RW T cells are from heterozygous individuals). Here, we report that LYP*W620 cannot simply be considered a gain-of-function variant. More specifically, the presence of LYP*W620 causes a combination of reduced proximal TCR-mediated signaling and enhanced CD28-coupled signaling. At the cellular level, this skewing in signals eventually leads to exaggerated Th1 responses that cannot be properly controlled by regulatory T cells (Tregs).
2. Materials and Methods
2.1 Reagents, constructs, and antibodies
Reagents, constructs, and most antibodies have been described elsewhere [4,8,13–15]. All antibodies used for T cell subset analyses and detection of intracellular cytokines were from BD Biosciences, as were phospho-specific antibodies against ζ-chain (Y142) and SLP-76 (Y128). Phospho-specific antibodies against AKT (S473), ERK (T202/Y204), S6-RP (S235/S236), Histone-3 (S10), and IKKα (S176/S180) were from Cell Signaling Technology, VAV (T174) from Santa Cruz. Antibodies against PI3K p85α were from Upstate/Millipore.
2.2 Blood donors, genotyping, and T cell purification
With approvals from the Regional Ethics Committee, the Privacy Ombudsman for Research and the Norwegian Directorate of Health, healthy female and male blood donors (age span 35–59 years) with known PTPN22 genotypes were recruited from the Norwegian Bone Marrow Donor Registry. The PTPN22 C1858T (rs2476601) alleles were assigned by both sequencing and allele discrimination genotyping [16]. All donors included in the present study were homozygous for the major allele of the PTPN22 G788A SNP (R263Q, rs33996649). T cells (pan T cells or CD4+ T cells) were purified from blood by negative selection (RosetteSep Enrichment, StemCell Technologies) and gradient centrifugation (Lymphoprep).
2.3 Phospho-flow cytometry
Purified T cells were pre-equilibrated at 37 °C for 5 min. Thereafter, biotinylated antibodies against CD3ε (clone OKT3) and CD28 (eBioscience, cat. no. 13-0289) were added (0.5 µg/ml of each) and incubations continued for 2 min, followed by cross-linking with avidin (25 µg/ml) for various periods of times (1–5–15 min). Reactions were stopped (BD Phosflow Fix Buffer I) and cells were permeabilized (BD Phosflow Perm Buffer III), fluorescently bar coded, stained, and analyzed (BD FACSCanto II) [15]. CD45RA+/CD45RO− and CD45RA−/CD45RO+ T cells were considered naive and effector/memory T cells, respectively, while CD4+/CD25+/CD25++ or CD4+/FoxP3+ T cells were considered Tregs. Alterations in phosphorylation of signaling proteins were calculated as described [17], using the inverse hyperbolic sine (arcsinh) of the median fluorescence intensity of stimulated versus unstimulated cells. Each experiment included T cells from one donor pair (one RR and one WW donor), for each pair data were normalized relative to the phospho-specific signals for the RR naive CD4+ T cells (signals at 0 and 1 min stimulation were set to 0 and 100, respectively).
2.4 Cytokine assays
For assays on secreted cytokines, purified CD4+ T cells were incubated with T cell expander beads (anti-CD3/anti-CD28 coated beads from Invitrogen, bead:cell ratio 1:1 unless otherwise stated) for 20 hours. Collected supernatants were subsequently analyzed with regard to cytokine content using Quantikine ELISA kits (R&D Systems). For detection of intracellular cytokines, purified T cells were stimulated with PMA/ionomycin (40 nM and 10 µM, respectively) for 5 hours, the last 4 hours in presence of Brefeldin A (10 µg/ml). Thereafter, cells were fixed, permeabilized, stained, and analyzed (BD FACS Canto II).
2.5 Treg-mediated suppression of T cell proliferation
Purified CD4+ T cells were stained with anti-CD45RA-PE, anti-CD25-PECy7 and anti-CD127-PECy5. Based on CD45RA and CD25 staining, the five CD4+ T cell fractions described by Miyara et al. [18] were defined. Thereafter, naive conventional CD4+ T cells (CD45RA+CD25−) and activated Tregs (CD45RA−CD25++CD127−) were sorted (BD FACS Aria II). Addition of CD127-negativity as a Treg marker was necessary to obtain a cell population with consistent suppressive capability (data not shown). For evaluation of Treg-mediated suppression of T cell proliferation, non-CFSE-stained cells (either naive conventional CD4+ T cells or activated Tregs) were mixed at a 1:1 ratio with CFSE-labeled (2 µM) naive conventional CD4+ T cells from the same donor. Thereafter, cells were stimulated with T cell expander beads (bead:cell ratios ranging from 1:2.5 to 1:20) for 90 hours. CFSE dilution was then analyzed (BD FACS Calibur). Similar assays were conducted with resting Tregs (CD45RA+CD25+CD127−), which displayed negligible suppressive capabilities in these assays ([19] and data not shown).
2.6 Treg-mediated suppression of cytokine secretion from conventional T cells
Conventional CD4+ T cells (CD45RA+CD25− and CD45RA−CD25−) and activated Tregs (CD45RA−CD25++CD127−) were sorted as described in section 2.5. Conventional CD4+ T cells or activated Tregs were mixed with conventional CD4+ T cells (1:1 ratio) from the same donor and stimulated with T cell expander beads (bead:cell ratio 1:10) for 20 hours, then supernatants were harvested and subsequently analyzed with regard to cytokine content.
2.7 LYP expression, transfections, immunoprecipitations, and SH3 domain arrays
Assessment of LYP expression was conducted as described [4]. Lipofectamine 2000 (Invitrogen) were used for transfection of HEK cells. Lysis of cells and subsequent immunoprecipitation were conducted as before [13]. SH3 domain array filters (Panomics) were incubated with lysates from Jurkat TAg T cells (lysed in 50 mM HEPES pH 7.4, 150 mM NaCl, 0.2% Tween-20, 5 mM EDTA, 1 mM PMSF) transfected with plasmids encoding either HA-tagged LYP*R620 or LYP*W620 [13], followed by detection of HA-reactivity.
2.8 Software and statistical analysis
FACS data were analyzed with FlowJo and Cytobank (http://www.cytobank.org/). Statistical analyses were performed using Sigma-Plot and Microsoft Excel. Data sets were tested with the Shapiro-Wilk Normality Test. When this test failed, Mann-Whitney Rank Sum Test was used. Otherwise, t-test was carried out. Level for statistical significance was set to 0.05.
3. Results
3.1 Weaker ζ-chain phosphorylation and stronger AKT activation in WW T cells
To explore the differences between LYP*R620 and LYP*W620 in an unbiased manner, we used fluorescent cell bar coding and phospho-flow cytometry to simultaneously analyze signaling in human T cells from homozygous donors (either RR or WW). As seen in Fig. 1A, TCR/CD28-induced ζ-chain phosphorylation tended to be lower in CD3+ WW T cells 1 min after activation and sustained at later time points such as 15 min. In contrast, AKT activation was elevated in WW T cells 15 min after activation, and there was also a tendency towards augmented AKT activation in resting WW T cells. The pattern of sustained TCR/CD28-mediated signaling in WW T cells was also seen for more downstream signaling molecules such as SLP-76 and ERK, but not for S6 ribosomal protein and histone 3. Interestingly, TCR-mediated protein kinase A (PKA) activation, which is probably dependent on LCK activity [20], was significantly reduced in WW T cells, while CD28-mediated responses other than AKT activation also tended to be elevated (VAV phosphorylation, Fig. 1B) or were enhanced (IKKα activation, Fig. 1B). Altogether, this suggested that LYP*W620 may lead to a reduction in the TCR signal at early time points and a more sustained TCR signal at later time points. In contrast, the signal downstream of CD28 could generally be enhanced.
FIGURE 1.
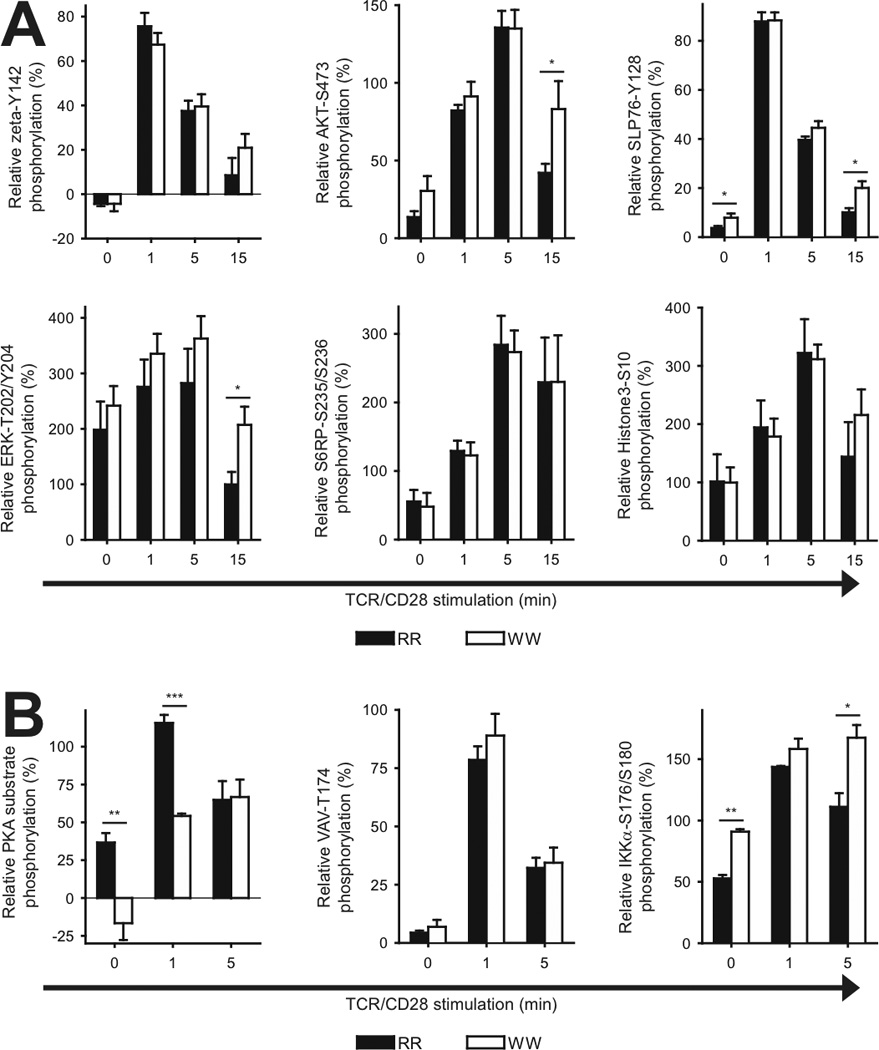
Phosphorylation of T cell signaling proteins in T cells from RR and WW donors. A, Purified T cells from genotyped donors were stimulated by cross-linking of CD3/CD28 for various periods of times, followed by phospho-flow analysis. Data from three to six donor pairs each consisting of one RR and one WW donor were included in each panel. For each pair, data were normalized relative to the phospho-specific signals for the RR naive CD4+ T cells (signals at 0 and 1 min stimulation were set to 0 and 100, respectively). Data are presented as average ± SEM (RR; black, WW; white); *P < 0.05, determined by unpaired t-test. B, Experiments as in A, but with additional phospho-proteins being analyzed. Data are derived from three or four donor pairs. *P < 0.05, **P < 0.01, ***P < 0.001, determined by unpaired t-test.
Since the above-mentioned experiments were performed with CD3+ T cells, the observed differences could be due to variation in T cell subset sizes between RR and WW individuals. When CD3+ T cells were analyzed, the ratio of CD4+ versus CD8+ cells appeared higher in WW than RR individuals, although not statistically significant (Table I). These experiments also revealed a tendency towards an expansion of the effector/memory CD4+ T cell subset in WW individuals. We also investigated the sizes of different CD4+ T cell subsets. According to Sakaguchi and co-workers [18], CD4+ T cells can be divided into five different fractions based on CD45RA and FoxP3 expression (Supplementary Fig. 1): i) resting Tregs (rTregs, Fraction I, CD45RA+FoxP3+), ii) activated Tregs (aTregs, Fraction II, CD45RA−FoxP3++), iii) cytokine-producing FoxP3+ T cells; (cpf T cells, Fraction III, CD45RA−FoxP3+), iv) naive conventional CD4+ T cells (CD45RA+FoxP3−) and v) effector/memory conventional CD4+ T cells (CD45RA−FoxP3−). Using this definition for CD4+ T cell subsets, we found no statistically significant differences in subset sizes between RR and WW individuals (Table II).
Table I.
Comparison of CD3+ T cell subsets between RR and WW individuals.
| RR | WW | P value | |
|---|---|---|---|
| Total CD4+ | 64.5 ± 3.5 | 70.0 ± 2.0 | 0.096 |
| Naive CD4+ | 34.1 ± 5.7 | 32.9 ± 3.5 | 0.431 |
| Effector/memory CD4+ | 30.4 ± 3.0 | 37.1 ± 2.8 | 0.063 |
| Total CD8+ | 35.5 ± 3.5 | 30.0 ± 2.0 | 0.096 |
| Naive CD8+ | 24.9 ± 3.1 | 20.5 ± 1.4 | 0.108 |
| Effector/memory CD8+ | 10.6 ± 1.9 | 9.5 ± 1.4 | 0.331 |
T cells purified from genotyped donors were categorized based on FACS analysis of CD3/CD4/CD45RA reactivity. Numbers represent % of total CD3+ cells and are given as average ± SEM (seven donors in each group). Unpaired student t-test was used to compare numbers between the two groups, the corresponding P values are indicated.
Table II.
Comparison of CD4+ T cell subsets between RR and WW individuals.
| RR | WW | P value | |
|---|---|---|---|
| rTregs (Fr. I) | 1.7 ± 0.4 | 1.2 ± 0.1 | 0.140 |
| aTregs Fr. II) | 1.7 ± 0.3 | 1.9 ± 0.3 | 0.358 |
| cpf T cells (Fr. III) | 3.4 ± 0.5 | 3.2 ± 0.3 | 0.405 |
| Naive CD4+ Tconvs | 44.2 ± 5.5 | 39.3 ± 3.0 | 0.220 |
| Effector/memory CD4+ Tconvs | 49.0 ± 5.3 | 54.3 ± 2.7 | 0.190 |
T cells (CD3+CD4+) purified from genotyped donors were categorized based on FACS analysis of CD3/CD4/CD45RA/FoxP3 reactivity. Numbers represent % of total CD3+CD4+ cells and are given as average ± SEM (10 donors in each group). Unpaired student t-test was used to compare numbers between the two groups, the corresponding P values are indicated.
Next, we enhanced the resolution of our phospho-flow experiments by specifically studying signaling in various T cell subsets (Fig. 2). Relative to cells from RR donors, naive conventional CD4+ T cells from WW donors displayed reduced TCR/CD28-induced ζ-chain phosphorylation at early time points and augmented activation of AKT/SLP-76/ERK at later time points. A similar increase was seen for effector/memory conventional CD4+ T cells from WW donors for AKT/SLP-76 but not for ERK. In effector/memory conventional CD4+ T cells from WW donors there was also a tendency towards lower ζ-chain phosphorylation at early time points and sustained phosphorylation at later time points. Noteworthy, activation of PKA was also reduced at early time points in effector/memory conventional CD4+ T cells from WW donors relative to RR donors (Supplementary Fig. 2), suggesting lower LCK activity in these cells.
FIGURE 2.
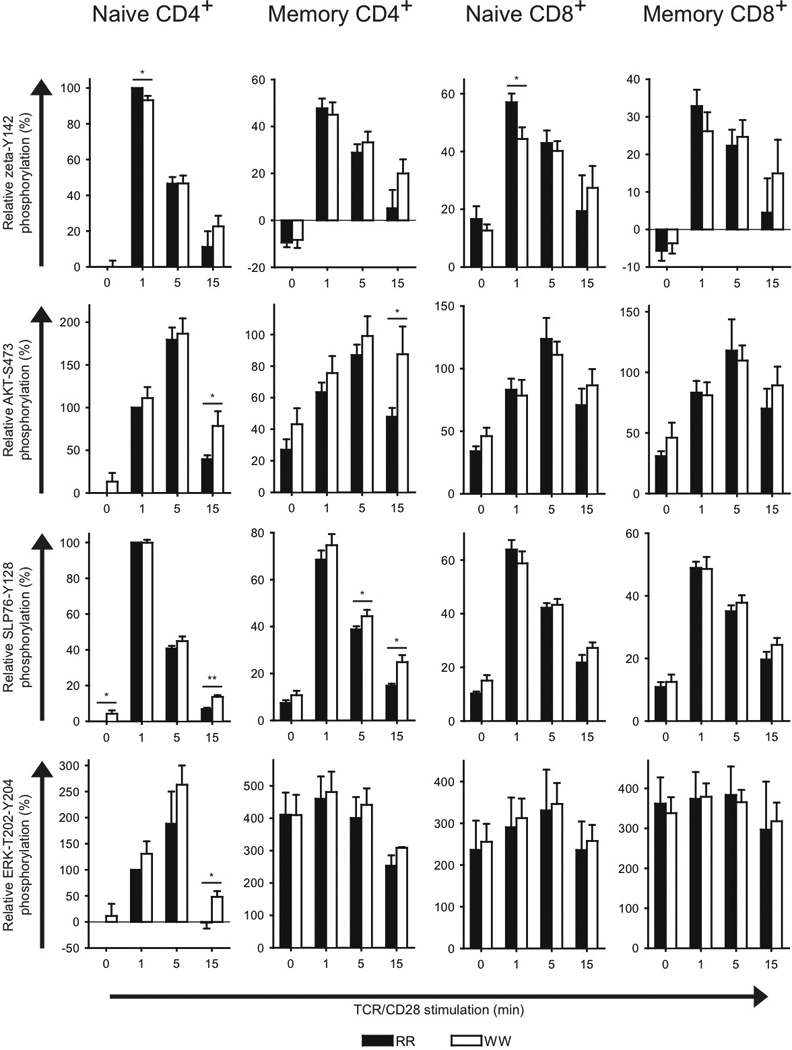
Phosphorylation of T cell signaling proteins in conventional T cell subsets from RR and WW donors. Purified T cells from genotyped donors were stimulated by cross-linking of CD3/CD28 for the indicated periods of time, followed by phospho-flow analysis of different conventional T cell subsets. Data from three to six donor pairs each consisting of one RR and one WW donor were included in each panel. For each pair, data were normalized relative to the phospho-specific signals for the RR naive CD4+ T cells (signals at 0 and 1 min stimulation were set to 0 and 100, respectively). Data are presented as average ± SEM (RR; black, WW; white); *P < 0.05, **P < 0.01, determined by unpaired t-test.
Naive conventional CD8+ T cells from WW donors also displayed reduced TCR/CD28-induced ζ-chain phosphorylation, otherwise we found no signaling differences between RR and WW donors regarding both naive and effector/memory conventional CD8+ T cells.
We also analyzed TCR/CD28-induced signaling in Tregs from RR and WW donors (Fig. 3). When all Tregs were tested, WW cells displayed reduced ζ-chain phosphorylation at early time points and augmented activation of AKT and SLP-76 but not ERK at later time points. When only rTregs were analyzed, negligible differences were seen between RR and WW cells with regard to ζ-chain phosphorylation and activation of AKT and SLP-76, but ERK activation was clearly enhanced in WW cells. In contrast, aTregs from WW donors displayed reduced ζ-chain phosphorylation and enhanced activation of both AKT and SLP-76 but not ERK. Since PKA activation was sustained in WW aTregs relative to RR aTregs (Supplementary Fig. 3), this suggested that LCK activity was down-regulated in aTregs in the basal state and during the initial course of TCR/CD28 stimulation, but more sustained at later time points.
FIGURE 3.
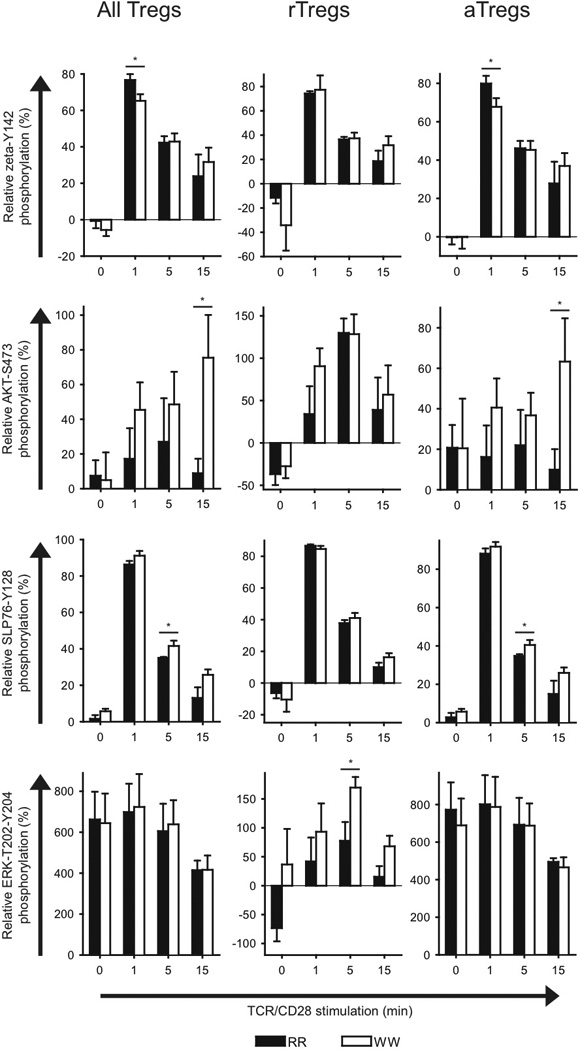
Phosphorylation of T cell signaling proteins in different regulatory T cell subsets from RR and WW donors. Purified T cells from genotyped donors were stimulated by cross-linking of CD3/CD28 for the indicated periods of time, followed by phospho-flow analysis of different regulatory T cell subsets. Data from three to six donor pairs each consisting of one RR and one WW donor were included in each panel. For each pair, data were normalized relative to the phospho-specific signals for the RR naive CD4+ T cells (signals at 0 and 1 min stimulation were set to 0 and 100, respectively). Data are presented as average ± SEM (RR; black, WW; white); *P < 0.05, determined by unpaired t-test.
3.2 Augmented IFNγ production and reduced IL-17 production in WW individuals
We next analyzed how different PTPN22 genotypes influenced the production of various cytokines from CD4+ T cells. We were especially interested in the Th1 cytokine IFNγ and the Th17 cytokine IL-17 due to their involvement in autoimmunity. Compared to RR CD4+ T cells, both WW and RW cells produced significantly higher amounts of IFNγ and TNFα (Fig. 4A). Interestingly, such significantly elevated IFNγ levels but not TNFα levels were also seen when suboptimal stimuli were applied (Fig. 4B). Noteworthy, WW CD4+ T cells produced significantly lower amounts of IL-17 compared to RR cells, while IL-2 was produced in higher amounts in WW cells (Fig. 4A). Since there were no statistically significant differences between RR and WW donors regarding the sizes of the five CD4+ T cell subsets defined by Sakaguchi (Table II), the skewing in IFNγ and IL-17 profiles between RR and WW donors was probably due to variations within the effector/memory CD4+ T cell subset. To test this, we stimulated CD4+ T cells with PMA/ionomycin to assess the cytokine-producing potential in the five CD4+ T cell subsets of RR and WW donors (Fig. 4C). A higher fraction of the effector/memory CD4+ T cells in WW donors produced IFNγ, while the opposite was observed for IL-17. Altogether, this suggested that LYP*W620 causes altered differentiation of conventional CD4+ T cells, ultimately leading to augmented IFNγ production and reduced IL-17 production.
FIGURE 4.
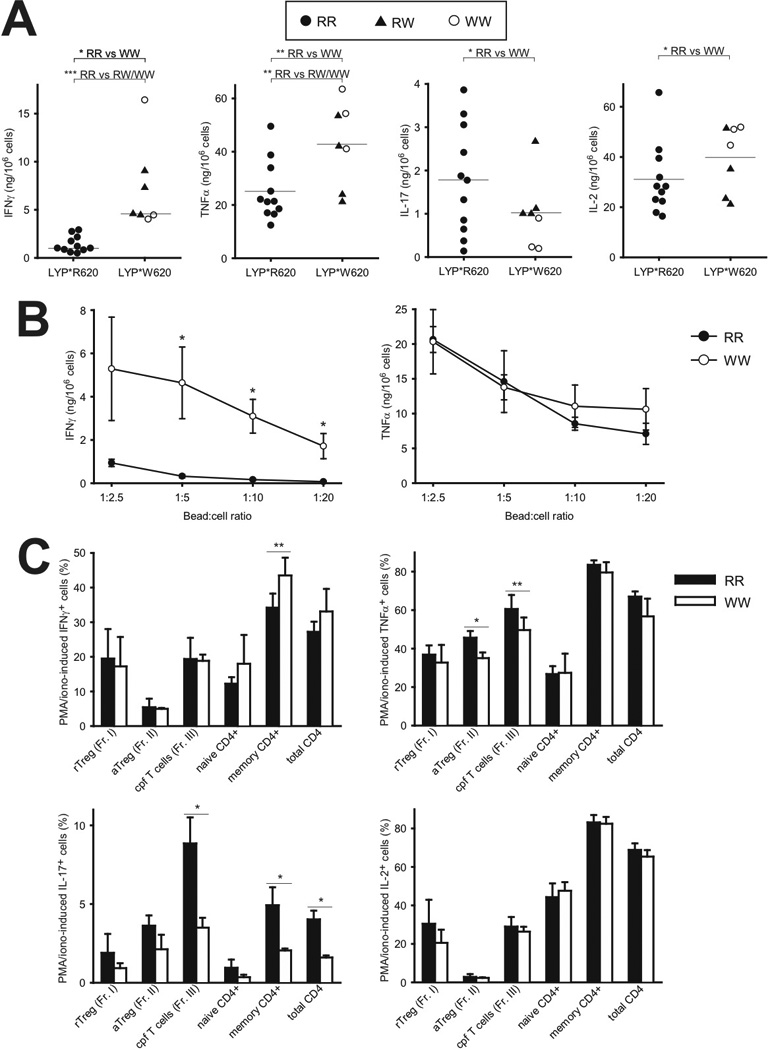
Augmented IFNγ production and reduced IL-17 production in T cells from WW donors. A, Purified CD4+ T cells from donors with indicated genotypes were stimulated with T cell expander beads (bead:cell ratio 1:1) for 20 hours, followed by measurement of various cytokines in the supernatants (RR; filled circles, RW; filled triangles, WW; open circles); *P < 0.05, **P < 0.01, ***P < 0.001, determined by t-test or Mann-Whitney Rank Sum Test. B, Experiment as in A, but with different bead:cell ratios. Data are presented as average ± SEM (three donors of each genotype, RR; filled circles, WW; open circles). C, Purified T cells were stimulated for five hours with PMA/ionomycin, the last four hours in presence of Brefeldin A. Later, levels of intracellular cytokines in various CD4+ subsets were assessed by FACS analysis. Data are presented as average ± SEM (RR; black, WW; white). One donor pair (consisting of one RR donor and one WW donor) was analyzed in each experiment and a total of four experiments were conducted. Due to variation in staining with cytokine-specific antibodies from one day to another, paired t-test was used for statistical analysis; *P < 0.05, **P < 0.01, determined by t-test.
3.3 Lack of Treg-mediated suppression of IFNγ production in WW individuals
To further explore the effects of the LYP-R620W mutation in CD4+ T cells, we analyzed the proliferation of naive conventional CD4+ T cells from RR and WW donors. Over a broad range of TCR/CD28-stimulatory conditions, we found no differences in proliferation (measured as CFSE-dilution) between RR and WW naive conventional CD4+ T cells (Fig. 5). When these experiments were conducted in presence of aTregs with matched genotypes, proliferation of naive conventional CD4+ T cells was suppressed to the same level for RR and WW donors (Fig. 5). Importantly, in RR individuals aTregs also strongly suppressed IFNγ and TNFα secretion from conventional CD4+ T cells (Fig. 6). In contrast, such suppression was absent for IFNγ secretion in WW individuals, suggesting a selective disruption in the axis between aTregs and effector/memory conventional CD4+ T cells in these individuals.
FIGURE 5.
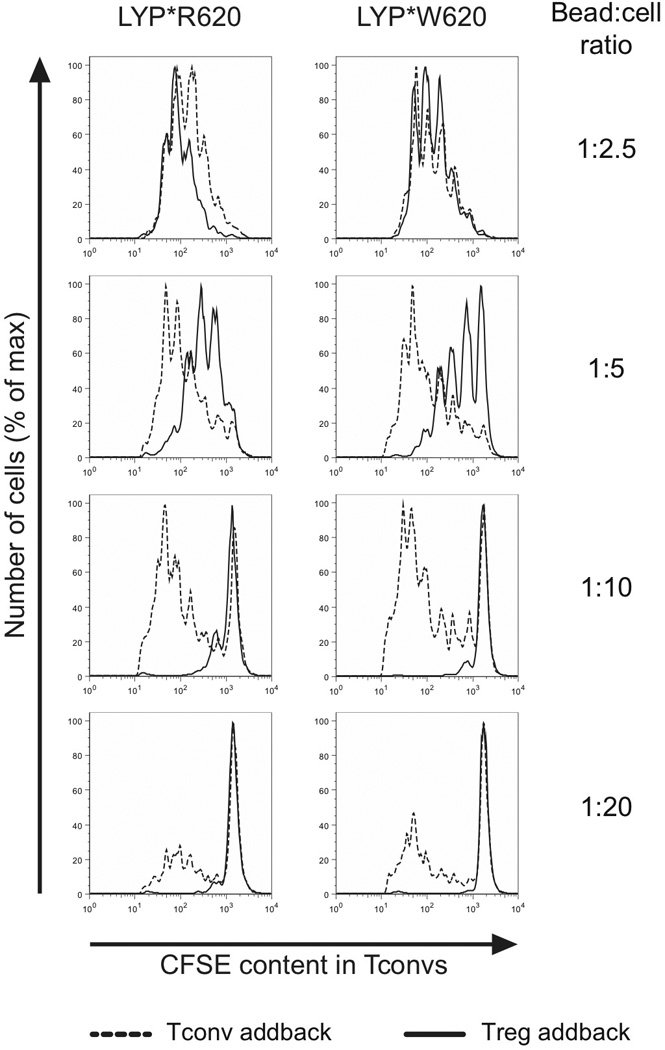
Naive T cell proliferation and aTreg-mediated suppression of naive T cell proliferation are comparable between RR and WW individuals. General setup: CFSE-stained naive conventional CD4+ T cells from a genotyped donor were mixed at 1:1 ratio with either unlabeled naive conventional CD4+ T cells or aTregs from the same donor. Cell mixtures were then stimulated with T cell expander beads at the indicated bead:cell ratios for 90 hours, followed by assessment of CFSE dilution in the CFSE-stained naive conventional CD4+ T cells (addback of naive conventional CD4+ T cells; dashed line, addback of aTregs; full line). Data are representative of six donors.
FIGURE 6.
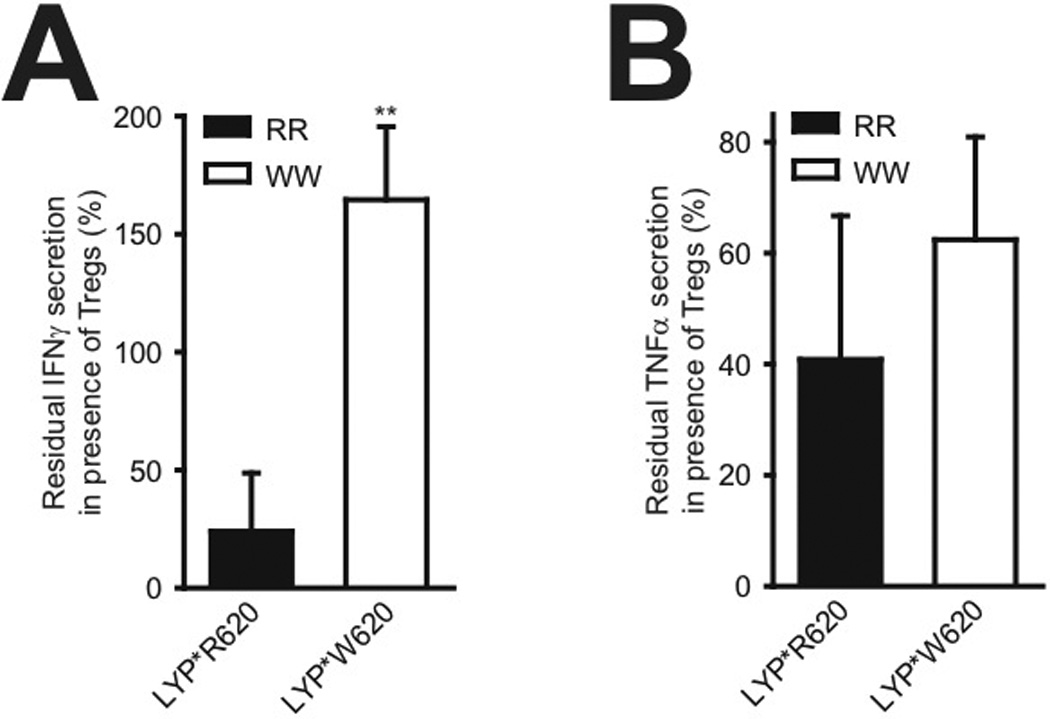
IFNγ production in conventional T cells is maintained in presence of aTregs in WW individuals. A, General setup for each reaction: Conventional CD4+ T cells from a genotyped donor were stimulated through the TCR/CD28 in presence or absence of aTregs from the same donor, followed by measurement of secreted IFNγ. Bars (average ± SD, five RR donors; black bar, three WW donors; white bar) represent residual IFNγ production in presence of aTregs relative to absence of aTregs; **P < 0.01 determined by t-test. B, As in A but with TNFα instead of IFNγ; P = 0.111 determined by t-test.
3.4 Comparable expression of LYP*R620 and LYP*W620 in CD4+ T cell subsets
At the molecular level, the observed differences between RR and WW CD4+ T cells could potentially be due to alterations in LYP protein stability and hence expression levels, as suggested in one study [12] but challenged by us in a subsequent study [4]. Therefore, we compared LYP expression levels in various CD4+ T cell subsets from RR and WW individuals (Fig. 7 and Supplementary Fig. 4). These experiments revealed no differences in LYP*R620 and LYP*W620 expression in most CD4+ T cell subsets tested. The only exception was naive conventional CD4+ T cells, where we found slightly lower expression of LYP*W620 than LYP*R620 (9% reduction in expression, statistically significant). Importantly, both LYP variants were expressed in significantly higher amounts in activated/differentiated cells compared to resting/naive cells, this was observed for both conventional (naive vs. effector/memory cells) and regulatory (resting vs. activated) CD4+ T cells.
FIGURE 7.
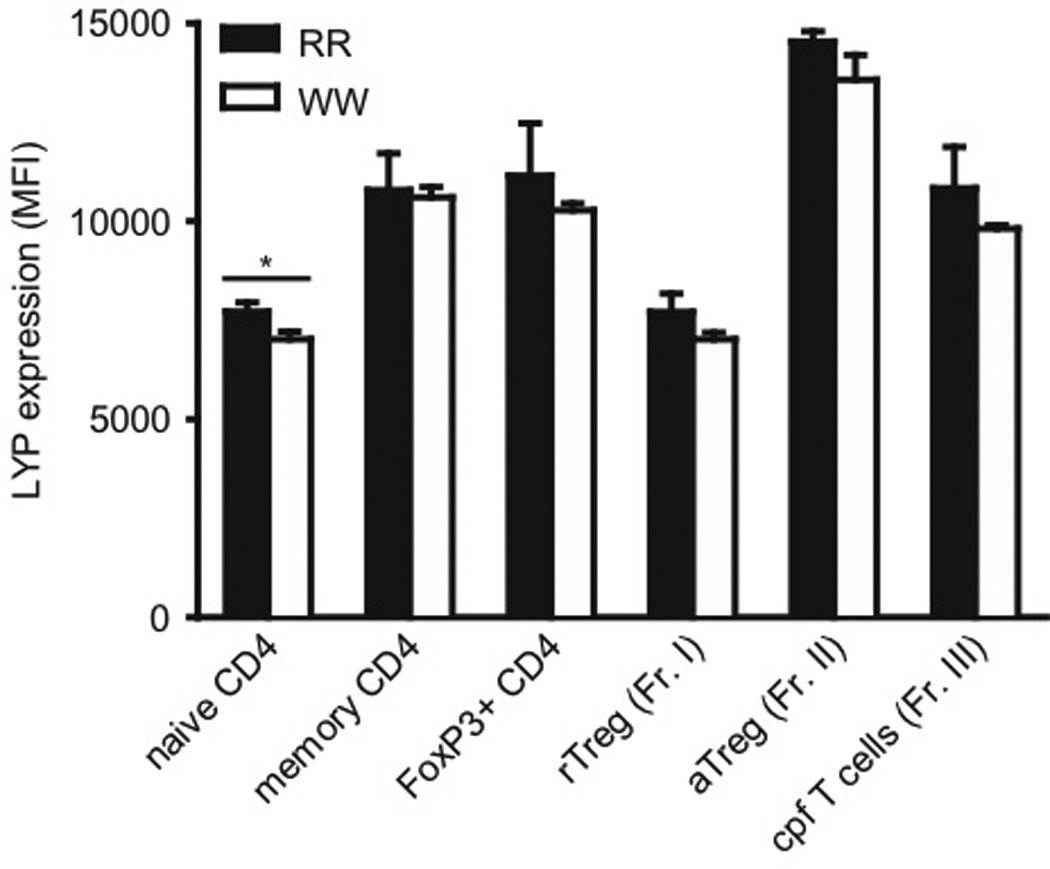
Expression of LYP*R620 and LYP*W620 in various CD4+ T cell subsets from RR and WW individuals. Purified CD4+ T cells from genotyped donors (three individuals in each group) were stained with fluorescently labeled antibodies and analyzed by FACS to evaluate LYP expression in various subsets. Bars represent average ± SD (RR; black, WW; white); *P < 0.05, determined by t-test.
3.5 PI3K interacts more strongly with LYP*R620 than LYP*W620
The R620W mutation in LYP is located in P1 in LYP and abrogates the ability of LYP to bind firmly to the CSK SH3 domain [2–4]. In a search for novel interaction partners for LYP*R620 and LYP*W620, we used SH3 domains arrays from Panomics (Fig. 8A). Briefly, these arrays contained various SH3 domains from signaling proteins and were tested with regard to binding of either HA-tagged LYP*R620 or LYP*W620 using a far-Western approach. Expectedly, these experiments revealed that LYP*R620 but not LYP*W620 interacted with CSK. Generally, LYP*W620 appeared to bind more strongly than LYP*R620 to the SH3 domains of Nephrocystin 1 (NPHP1) as well as several SRC family kinases (e.g. LCK and FYN). In contrast, some adaptor proteins (e.g. NCK and FYB) and regulatory molecules (e.g. the regulatory p85 subunit of PI3K) interacted better with LYP*R620 than LYP*W620.
FIGURE 8.
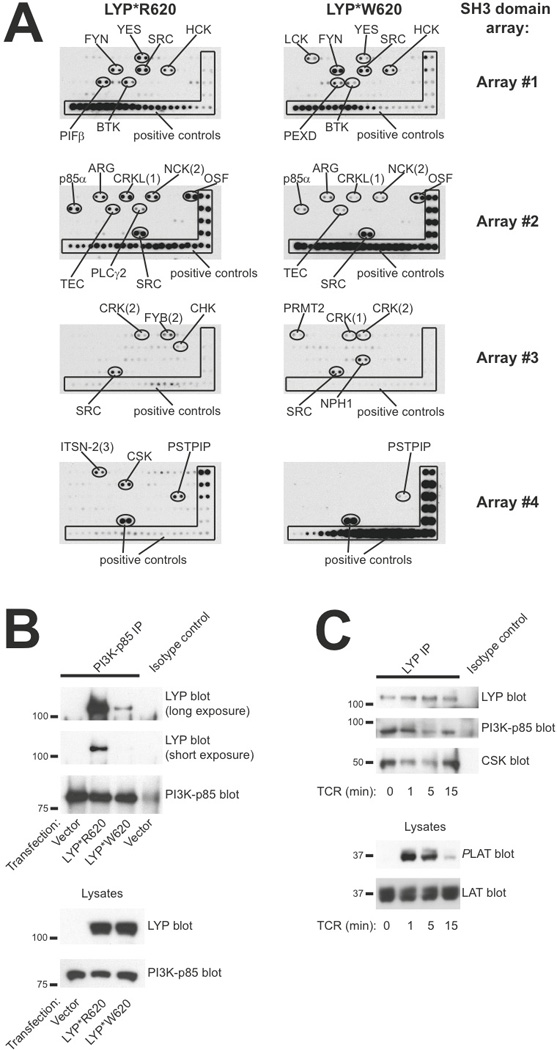
PI3K p85 subunit interacts more strongly with LYP*R620 than LYP*W620. A, Filters containing SH3 domains from various proteins were incubated with lysates from cells expressing either HA-tagged LYP*R620 or LYP*W620. Thereafter, HA-reactivity was assessed by immunoblotting. B, PI3K p85 subunit was immunoprecipitated from HEK cells transfected with either empty vector or plasmids encoding LYP*R620 or LYP*W620. Later, immunoprecipitates and lysates were subjected to immunoblotting with the indicated antibodies. C, Purified CD4+ T cells (LYP*R620 homozygous) were stimulated by cross-linking of CD3 for the indicated time periods, followed by immunoprecipitation of LYP. Later, immunoprecipitates and lysates were subjected to immunoblotting with the indicated antibodies.
Since interaction studies with proteins immobilized on solid phase do not provide quantitative kinetic data and immobilization of isolated SH3 domains in some cases may display altered binding properties compared to full-length proteins, we also performed co-immunoprecipitation studies from cells. Here, NPHP1 interacted equally well with both allelic variants of LYP (data not shown), suggesting that NPHP1 is not a unique binding partner for LYP*W620. Additional co-immunoprecipitation studies revealed that, relative to LYP*R620, LYP*W620 bound more strongly to both LCK and FYN (data not shown). However, the interaction between the two allelic forms of LYP and SRC family kinases seemed to be of relatively low stoichiometry, and the observed differences in SRC family kinase binding could potentially also be explained by enhanced substrate binding by LYP*W620. Interestingly, immunoprecipitation of PI3K p85 consistently co-immunoprecipitated higher amounts of LYP*R620 than LYP*W620 (Fig. 8B), and these differences in stoichiometry were negatively correlated with alterations in AKT activation (elevated AKT activation in WW T cells). Finally, LYP*R620 interacted dynamically with p85 in response to TCR stimulation of primary T cells. This interaction was reminiscent of the recently described dynamic interaction between LYP*R620 and CSK [4], but with slightly slower kinetics (Fig. 8C).
4. Discussion
Genetic alterations such as SNPs contribute to differential immune responses between individuals. Here, we report that LYP*W620 causes a combination of reduced proximal TCR-mediated signaling and augmented CD28-associated signaling. At the cellular level, these shifts in signaling affect the differentiation and function of CD4+ T cells ultimately leading to exaggerated Th1 responses. Our findings can explain why carriers of LYP*W620 are relatively resistant to intracellular infections (e.g. tuberculosis), but also are more prone to autoimmunity.
LYP*W620 was originally found a gain-of-function variant. This notion was supported by findings with human T and B cells indicating that LYP*W620 is a more potent inhibitor of both TCR and BCR signaling [8,10,11]. Furthermore, the PTP activity of LYP*W620 is approximately 50% higher than that of LYP*R620 [8]. Two recent studies have challenged this model by suggesting that LYP*W620 acts as a hypomorph (i.e. a loss-of-function allele). The first one of these studies described the effects of overexpression of the two LYP variants in Jurkat T cells [21]. Importantly, the authors based their conclusions on data from cells with high (and most probably supra-physiological) levels of LYP. In fact, when cells with modest overexpression of LYP (i.e. closer to physiological levels) were analyzed, LYP*W620 was a stronger inhibitor of TCR signaling. These observations are also in agreement with our previously published observations [8]. The second study described characterization of Pep-R619W knockin mice (mutation corresponding to the LYP-R620W mutation) and suggested that Pep-R619W is an unstable protein compared to wild-type Pep [12]. The authors extended these findings to LYP*W620 and concluded that LYP*W620 is a hypomorph. In contrast, we previously found comparable expression of the two LYP variants in CD4+ T cells from healthy human donors homozygous for either LYP*R620 or LYP*W620 [4]. Furthermore, in the present study we demonstrate similar expression of the two LYP variants in all CD4+ T cell subsets tested, with the exception of naive conventional CD4+ T cells where LYP*W620 expression was slightly lower (approximately 9%) than LYP*R620 expression. The only explanation we can offer for the above-mentioned discrepancies regarding LYP stability is differences in reagents used to determine LYP expression.
Given the data presented in this paper, we now propose that the autoimmune-inducing capabilities of LYP*W620 cannot simply be explained by a gain-of-function model. This is based on several observations. First, our phospho-flow cytometry analysis of TCR/CD28-stimulated primary T cells indicated that WW cells displayed weaker TCR-proximal signaling and augmented CD28-associated signaling. Second, the LYP-R620W mutation led to altered ligand binding properties, e.g. LYP*R620 interacted more efficiently with PI3K. Third, we have previously shown that the sub-cellular localization of LYP*W620 was different from that of LYP*R620, more specifically, in resting cells LYP*W620 partitioned more efficiently into lipid rafts [4]. Here, it should be added that several findings presented in this paper can also be explained by a gain-of-function mechanism, e.g. reduced TCR-induced ζ-chain phosphorylation due to elevated LYP catalytic activity.
The main substrates for LYP in T cells are LCK, FYN, ZAP-70, the CD3/ζ subunits of the TCR complex, and VAV [5]. While LCK, FYN, ZAP-70 and CD3/ζ subunits are signaling proteins downstream of the TCR, VAV is involved in CD28-mediated signaling. The fact that LYP*W620 lead to reduced TCR-coupled signaling and augmented CD28-associated signaling suggested that LYP*W620 relative to LYP*R620 preferred the substrates LCK and CD3/ ζ subunits over VAV. Here, it should be added that the evidence involving VAV is partly circumstantial; although we did not see significant alterations in VAV phosphorylation in WW T cells (there was only a tendency towards higher VAV phosphorylation in WW CD4+ T cells), we did make significant findings with other (and more downstream) signaling molecules associated with CD28 (e.g. activation of AKT and IKKα). Lastly, the observed signaling differences between LYP*R620 and LYP*W620 could be explained by differences in catalytic activity and/or sub-cellular localization.
A recent study demonstrated that LYP is overexpressed in chronic lymphocytic leukemia B cells that are homozygous for LYP*R620, and that such overexpression promotes cellular survival through activation of AKT [22]. Interestingly, the authors propose that the effects of LYP overexpression are two-fold: LYP down-modulates both positive and negative regulatory signaling pathways, and the net result is a shift in the signaling balance, eventually leading to diverse outcomes such as reduced BCR signaling and yet elevated AKT activity. There are currently no data indicating that the same mechanisms are operative in T cells. Although we suggest that augmented AKT activation in WW T cells may be explained by altered ligand binding properties for LYP*W620, additional mechanisms can be involved. One such mechanism is elevated LYP activity since LYP*W620 is a more active PTP than LYP*R620.
In this study, we analyzed T cells derived from peripheral blood donated by healthy individuals. The functional properties of these cells are a result of several processes including development in thymus, antigenic challenges in lymphoid organs, and homeostatic mechanisms in the periphery. For disease-mechanistic purposes it is tempting to compare our findings with those obtained with established animal models. Based on the immunological analyses presented here and published epidemiological studies, the phenotype of individuals homozygous for LYP*W620 is characterized by: i) T cells with elevated AKT activity, ii) a shift in the balance between conventional and regulatory T cells resulting in exaggerated Th1 responses, and iii) higher risk for autoimmune diseases. Interestingly, this phenotype is reminiscent of the phenotype observed for mice with Foxo1 or combined Foxo1/Foxo3 deficiencies in T cells [23–25]. These animals display defective Treg cell development in thymus (but normal numbers of Tregs in the periphery), enhanced Th1 responses, and severe autoimmune manifestations. Although our study in human could not include analysis of T cell development in thymus, it is tempting to speculate that the elevated AKT activation observed in peripheral WW T cells is also taking place in developing T cells. Such a scenario would lead to defective Treg cell development and function, but homeostatic mechanisms would ensure normal Treg cell numbers in the periphery.
Epidemiological data have indicated that carriers of LYP*W620 are less likely to contract tuberculosis, and that if they do, the disease will be less severe compared to RR individuals [26,27]. Our findings provide a cellular and molecular explanation for these data; carriers of LYP*W620 display exaggerated Th1 responses (e.g. augmented IFNγ production), which offer increased protection against tuberculosis. From an evolutionary perspective, carriers of LYP*W620 probably had a survival advantage since tuberculosis has been a common and serious disease throughout history. Thus, our findings may explain why evolution has kept the C1858T SNP in PTPN22. This is further supported by the fact that WW donors also produced higher amounts of TNFα, which is also a major pro-inflammatory mediator. Given our data, we also speculate that carriers of LYP*W620 may be better protected from other intracellular infections, although this remains to be shown. In this study we also found that production/secretion of the Th17 cytokine IL-17 was reduced in WW donors. This is an interesting finding and may suggest that Th17 responses are not that important in humans with regard to induction of autoimmunity or control of tuberculosis. Finally, we found that healthy WW donors also produced higher amounts of IL-2. In contrast, we previously reported that WW individuals with type 1 diabetes produced lower amounts of IL-2 [8]. One possible explanation for this discrepancy may be the ongoing immune processes in type 1 diabetes patients.
In conclusion, we provide evidence that the autoimmune-associated version of LYP, LYP*W620, causes reduced proximal TCR-mediated signaling but augmented CD28-coupled signaling. This imbalance in signaling ultimately affects T cell differentiation, which is skewed favoring Th1 responses.
Supplementary Material
Acknowledgements
We thank Scott Williams, Matthew Cato, Siri T. Flåm, Hanne S. Sæther, Gladys Tjørhom, and Jorun Solheim for technical assistance, Yan Zhang for help with cell sorting, and the Norwegian Bone Marrow Donor Registry for access to healthy donors. This work was supported by grants from the Norwegian Cancer Society (TV, KT), the Oxnard Foundation (TV, TM and RCR), the Research Council of Norway (BAL, KT), and Abbott (TV, BAL, KT).
Footnotes
Abbreviations: aTregs, activated regulatory T cells; BCR, B cell receptor; cpf T cells, cytokine-producing FoxP3+ T cells; CSK, C-terminal SRC kinase; LYP, lymphoid tyrosine phosphatase; PKA, protein kinase A; PTP, protein tyrosine phosphatase; rTregs, resting regulatory T cells; SNP, single nucleotide polymorphism; TCR, T cell antigen receptor; Tregs, regulatory T cells.
Contributions
TV and TM conceived the project. TV, TM, LT, RCR, and BAL designed research and planned experiments. TV, JL, MKV, NO, KMT, and BAL conducted experiments. TV, JL, MKV, NO, TM, RCR, and BAL analyzed the data. All authors contributed in the discussion of the data. TV, TM, KT, LT, RCR, and BAL contributed materials and reagents. TV, RCR, and BAL wrote the paper.
References
- 1.Vang T, Miletic AV, Arimura Y, Tautz L, Rickert RC, Mustelin T. Protein tyrosine phosphatases in autoimmunity. Ann Rev Immunol. 2008;26:29–55. doi: 10.1146/annurev.immunol.26.021607.090418. [DOI] [PubMed] [Google Scholar]
- 2.Cloutier JF, Veillette A. Association of inhibitory protein tyrosine kinase p50csk with protein tyrosine phosphatase PEP in T cells and other hematopoietic cells. EMBO J. 1996;15:4909–4918. [PMC free article] [PubMed] [Google Scholar]
- 3.Bottini N, Musumeci L, Alonso A, Rahmouni S, Nika K, Rostamkhani M, et al. A functional variant of lymphoid tyrosine phosphatase is associated with type I diabetes. Nat Genet. 2004;36:337–338. doi: 10.1038/ng1323. [DOI] [PubMed] [Google Scholar]
- 4.Vang T, Liu WH, Delacroix L, Wu S, Vasile S, Dahl R, et al. LYP inhibits T-cell activation when dissociated from CSK. Nat Chem Biol. 2012;8:437–446. doi: 10.1038/nchembio.916. [DOI] [PMC free article] [PubMed] [Google Scholar]
- 5.Wu J, Cantor RM, Graham DS, Lingren CM, Farwell L, Jager PL, et al. Identification of substrates of human protein-tyrosine phosphatase PTPN22. J Biol Chem. 2006;281:11002–11010. doi: 10.1074/jbc.M600498200. [DOI] [PubMed] [Google Scholar]
- 6.Gregersen PK, Olsson LM. Recent advances in the genetics of autoimmune diseases. Ann Rev Immunol. 2009;27:363–391. doi: 10.1146/annurev.immunol.021908.132653. [DOI] [PMC free article] [PubMed] [Google Scholar]
- 7.Ghose R, Shektman A, Goger MJ, Ji H, Cowburn D. A novel, specific interaction involving the Csk SH3 domain and its natural ligand. Nat Struct Biol. 2001;8:998–1004. doi: 10.1038/nsb1101-998. [DOI] [PMC free article] [PubMed] [Google Scholar]
- 8.Vang T, Congia M, Macis MD, Musumeci L, Orru V, Zavattari P, et al. Autoimmune-associated lymphoid tyrosine phosphatase is a gain-of-function variant. Nat Genet. 2005;37:1317–1319. doi: 10.1038/ng1673. [DOI] [PubMed] [Google Scholar]
- 9.Fiorillo E, Orru V, Stanford SM, Liu Y, Salek M, Rapini N, et al. Autoimmune-associated PTPN22 R620W variation reduces phosphorylation of lymphoid tyrosine phosphatase on an inhibitory tyrosine residue. J Biol Chem. 2010;285:26505–26518. doi: 10.1074/jbc.M110.111104. [DOI] [PMC free article] [PubMed] [Google Scholar]
- 10.Rieck MA, Arechiga A, Onengut-Gumuscu S, Greenbaum C, Concannon P, Buckner JH. Genetic variation in PTPN22 corresponds to altered function of T and B lymphocytes. J Immunol. 2007;179:4704–4710. doi: 10.4049/jimmunol.179.7.4704. [DOI] [PubMed] [Google Scholar]
- 11.Arechiga AF, Habib T, He Y, Zhang X, Zhang ZY, Funk A, et al. Cutting edge: the PTPN22 allelic variant associated with autoimmunity impairs B cell signaling. J Immunol. 2009;182:3343–3347. doi: 10.4049/jimmunol.0713370. [DOI] [PMC free article] [PubMed] [Google Scholar]
- 12.Zhang J, Zahir N, Jiang Q, Miliotis H, Heyraud S, Meng X, et al. The autoimmune disease-associated PTPN22 variant promotes calpain-mediated Lyp/Pep degradation associated with lymphocyte and dendritic cell hyperresponsiveness. Nat Genet. 2011;43:902–907. doi: 10.1038/ng.904. [DOI] [PubMed] [Google Scholar]
- 13.Vang T, Torgersen KM, Sundvold V, Saxena M, Levy FO, Skalhegg BS, et al. Activation of the COOH-terminal Src kinase (Csk) by cAMP-dependent protein kinase inhibits signaling through the T cell receptor. J Exp Med. 2001;193:497–507. doi: 10.1084/jem.193.4.497. [DOI] [PMC free article] [PubMed] [Google Scholar]
- 14.Vang T, Abrahamsen H, Myklebust S, Enserink J, Prydz H, Mustelin T, et al. Knockdown of C-terminal Src kinase by siRNA-mediated RNA interference augments T cell receptor signaling in mature T cells. Eur J Immunol. 2004;34:2191–2199. doi: 10.1002/eji.200425036. [DOI] [PubMed] [Google Scholar]
- 15.Oberprieler NG, Lemeer S, Kalland ME, Torgersen KM, Heck AJ, Tasken K. High resolution mapping of prostaglandin E2-dependent signaling networks identifies a constitutively active PKA signaling node in CD8+CD45RO+ T cells. Blood. 2010;116:2253–2265. doi: 10.1182/blood-2010-01-266650. [DOI] [PubMed] [Google Scholar]
- 16.Viken MK, Olsson M, Flam ST, Forre O, Kvien TK, Thorsby E, et al. The PTPN22 promoter polymorphism −1123G>C association cannot be distinguished from the 1858C>T association in a Norwegian rheumatoid arthritis material. Tissue Antigens. 2007;70:190–197. doi: 10.1111/j.1399-0039.2007.00871.x. [DOI] [PubMed] [Google Scholar]
- 17.Irish JM, Myklebust JH, Alizadeh AA, Houot R, Sharman JP, Czerwinski DK, et al. B-cell signaling networks reveal a negative prognostic human lymphoma cell subset that emerges during tumor progression. Proc Natl Acad Sci USA. 2010;107:12747–12754. doi: 10.1073/pnas.1002057107. [DOI] [PMC free article] [PubMed] [Google Scholar]
- 18.Miyara M, Yoshioka Y, Kitoh A, Shima T, Wing K, Niwa A, et al. Functional delineation and differentiation dynamics of human CD4+ T cells expressing the FoxP3 transcription factor. Immunity. 2009;30:899–911. doi: 10.1016/j.immuni.2009.03.019. [DOI] [PubMed] [Google Scholar]
- 19.Kalland ME, Oberprieler NG, Vang T, Tasken K, Torgersen KM. T cell-signaling network analysis reveals distinct differences between CD28 and CD2 costimulation responses in various subsets and in the MAPK pathway between resting and activated regulatory T cells. J Immunol. 2011;187:5233–5245. doi: 10.4049/jimmunol.1101804. [DOI] [PubMed] [Google Scholar]
- 20.Becker C, Taube C, Bopp T, Becker C, Michel K, Kubach J, et al. Protection from graft-versus-host disease by HIV-1 envelope protein gp120-mediated activation of human CD4+CD25+ regulatory T cells. Blood. 2009;114:1263–1269. doi: 10.1182/blood-2009-02-206730. [DOI] [PubMed] [Google Scholar]
- 21.Zikherman J, Hermiston M, Steiner D, Hasegawa K, Chan A, Weiss A. PTPN22 deficiency cooperates with the CD45 E613R allele to break tolerance on a non-autoimmune background. J Immunol. 2009;182:4093–4106. doi: 10.4049/jimmunol.0803317. [DOI] [PMC free article] [PubMed] [Google Scholar]
- 22.Negro R, Gobessi S, Longo PG, He Y, Zhang ZY, Laurenti L, et al. Overexpression of the autoimmunity-associated phosphatase PTPN22 promotes survival of antigen-stimulated CLL cells by selectively activating AKT. Blood. 2012;119:6278–6287. doi: 10.1182/blood-2012-01-403162. [DOI] [PMC free article] [PubMed] [Google Scholar]
- 23.Harada Y, Harada Y, Elly C, Ying G, Paik J, DePinho RA, et al. Transcription factors Foxo3A and Foxo1 couple the E3 ligase Cbl-b to the induction of Foxp3 expression in induced regulatory T cells. J Exp Med. 2010;207:1381–1391. doi: 10.1084/jem.20100004. [DOI] [PMC free article] [PubMed] [Google Scholar]
- 24.Ouyang W, Beckett O, Ma Q, Paik J, DePinho RA, Li MO. Foxo proteins cooperatively control the differentiation of Foxp3+ regulatory T cells. Nat Immunol. 2010;11:618–627. doi: 10.1038/ni.1884. [DOI] [PubMed] [Google Scholar]
- 25.Kerdiles YM, Stone EL, Beisner DL, McGargill MA, Ch’en IL, Stockmann C, et al. Foxo transcription factors control regulatory T cell development and function. Immunity. 2010;33:890–904. doi: 10.1016/j.immuni.2010.12.002. [DOI] [PMC free article] [PubMed] [Google Scholar]
- 26.Gomez LM, Anaya JM, Martin J. Genetic influence of PTPN22 R620W polymorphism in tuberculosis. Hum Immunol. 2005;66:1242–1247. doi: 10.1016/j.humimm.2005.11.008. [DOI] [PubMed] [Google Scholar]
- 27.Lamsyah HB, Rueda B, Baassi L, Elaouad R, Bottini N, Sadki K, et al. Association of PTPN22 gene functional variants with development of pulmonary tuberculosis in Moroccan population. Tissue Antigens. 2009;74:228–232. doi: 10.1111/j.1399-0039.2009.01304.x. [DOI] [PubMed] [Google Scholar]
Associated Data
This section collects any data citations, data availability statements, or supplementary materials included in this article.


