Fertility in sub-Saharan Africa (“Africa”) stood at 5.1 births per woman in 2005–10 (United Nations 2011), more than double the replacement level. This high fertility combined with declining mortality has resulted in rapid population growth—2.5 percent per year—and the UN projects the sub-Saharan population to grow from 0.86 billion in 2010 to 1.96 billion in 2050 and 3.36 billion in 2100. Such unprecedented expansion of human numbers creates a range of social, economic, and environmental challenges and makes it more difficult for the continent to raise living standards. Hence the growing interest in demographic trends in Africa among policymakers.
According to conventional demographic theory, high fertility in the early stages of the demographic transition is the consequence of high desired family size. Couples want many children to assist with family enterprises such as farming and for security in old age. In addition, high child mortality leads parents to have additional children to protect against loss or to replace losses. Fertility decline occurs once rising levels of urbanization and education, changes in the economy, and declining mortality lead parents to desire a smaller number of births. To implement these desires, parents rely on contraception or abortion, and family planning programs in many countries accelerate their adoption (Notestein 1945; Easterlin 1975, 1978; Lee and Bulatao 1983).
This theory is widely accepted as a broad outline of the forces that shape fertility transitions and is consistent with much empirical evidence (Bryant 2007). As countries develop, fertility generally falls and there is a strong inverse correlation between development indicators and fertility in contemporary societies (with Africa characterized by relatively low levels of social and economic development and, accordingly, high fertility). The theory is not without its critics, however, who claim that fertility change can be brought about by ideational change and the diffusion of ideas (Bongaarts and Watkins 1996; Casterline 2001a, 2001b; Coale and Watkins 1986; Cleland and Wilson 1987; Knodel and van de Walle 1979; Watkins 1986, 1987).
Instead of contributing directly to this longstanding debate, our aim is to add to our understanding of the transition from high to low fertility by examining whether countries or regions differ in their patterns of reproductive behavior at a given stage of the transition. In particular we compare recent patterns in Africa—with most countries at early-transition (or even pre-transition) stage—with patterns in other regions. A motivation for this analysis is to assess the validity of the arguments for what might be termed “African exceptionalism” that have been made by John Caldwell and others (Caldwell and Caldwell 1987, 1988; Caldwell, Orubuloye, and Caldwell 1992; Bledsoe, Banja, and Hill 1998).
We begin by reviewing levels and trends in overall fertility and in the age pattern of fertility by region. Next we examine evidence on family size preferences and their role in shaping reproductive behavior. The last section discusses trends in the demand for and use of contraception. The conclusion comments on policy options and the potential role of family planning programs.
Throughout this analysis we rely on data from Demographic and Health Surveys (DHS) and World Fertility Surveys (WFS). Surveys from all major regions are examined, with surveys in Latin America and in Asia and North Africa providing comparison with the African experience to date. The selection of surveys (and therefore countries) varies according to the purposes of the analysis, in particular whether we are examining onset of transition or mid-transition and whether we are examining levels or trends.
Fertility levels and trends
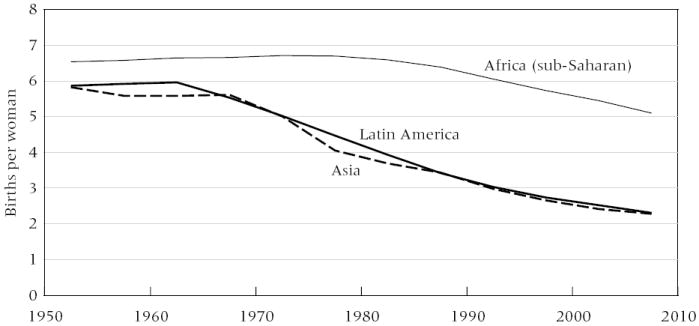
Figure 1 plots trends in the total fertility rates (TFR) of Africa, Asia, and Latin America from 1950 to 2010. In the early 1950s fertility levels were high and nearly stable in all three regions, suggesting all these societies were pre-transitional, that is, there was little deliberate effort to reduce fertility through the use of contraception or abortion. It is notable that the pre-transitional TFR was significantly higher in Africa (6.5) than in the other regions (5.8). This indicates that the pre-transition reproductive regime in Africa was more pronatalist (consistent with pre-transition regional differences in fertility desires, as we document below).
FIGURE 1. Regional trends in TFR.
SOURCE: United Nations 2011.
Fertility decline began in the mid-1960s in Latin America and slightly later in Asia. In both regions decline proceeded steadily and rapidly. The trends in these two regions followed roughly similar paths, reaching 2.3 births per woman in 2005–10. In contrast the fertility transition in Africa did not begin until the late 1980s, and the TFR in 2005–10 (5.1) was still more than double the level observed in the other two regions.
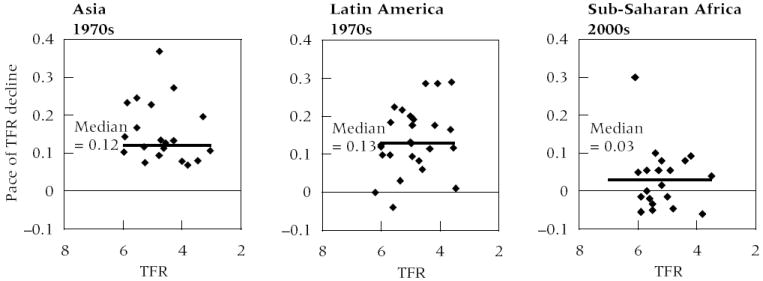
The trends in Figure 1 also suggest that the recent pace of fertility decline in Africa is slower than the pace observed in Asia and Latin America in the 1970s. In the 1970s Asia and Latin America were at approximately the same early to middle stages of the transition, as Africa is today. To examine this issue more closely, Figure 2 plots the pace (i.e., the annual change) in the TFR by country. For Asia and Latin America the pace estimates for the 1970s are calculated from UN estimates of the TFR for 1970–75 and 1975–80 (United Nations 2011). For sub-Saharan Africa the pace estimates are the rate of change between the two most recent DHS surveys. Note that in many countries the most recent survey did not figure into the most recent round of UN estimates and projections released in early 2011. Figure 2 excludes countries that are pre-transitional (i.e., TFR at the beginning of the historical interval has not yet declined 10 percent below the maximum value in the UN estimates for 1950–2000).
FIGURE 2. Pace of fertility decline within countries, by region.
SOURCES: United Nations 2011; DHS surveys.
The results show substantial variation among countries within regions, which is not unexpected: the pace of decline is known to vary considerably across countries (Casterline 2001). The most important finding in Figure 2 is that the median pace of change in sub-Saharan Africa (0.03 per year) is less than one-third the pace in the other regions (0.12 and 0.13, respectively). In all but one African country, the pace of decline is lower than the median pace in Asia and Latin America. To be sure, some of the faster African declines resemble the slower declines in other regions (especially Latin America). More striking is the fact that the estimated TFR was unchanged or rose between the two most recent surveys in 9 of the 20 African countries where fertility had already fallen by at least 10 percent. Some of these apparent stalls may prove to be artifacts of measurement error, as has been common during the past decade (Machiyama 2010). But without doubt these African countries are experiencing a pace of decline that is slow in comparative perspective. A clear exception in Africa is Rwanda (the outlier in the right-hand panel of Figure 2), which experienced extremely rapid fertility decline between 2005 and 2010 (we discuss Rwanda in more detail below). Clearly, Africa’s transitions are on average much slower than past transitions elsewhere in the developing world.
A new type of fertility transition?
A widely cited study by Caldwell, Orubuloye, and Caldwell (1992) argues that the fertility decline in sub-Saharan Africa represents “a new type of transition” (p. 211). This African pattern “will be one of similar fertility declines across all age groups” (p. 237), which would be in contrast to “the greater declines among older women that characterized the non-African transitions” (p. 237). In other words, the African pattern would be different because it would “not be dominated by changes among older women” (p. 220).
We begin an examination of this provocative argument by comparing average age patterns of sub-Saharan Africa’s fertility with those of other regions in the developing world (Figure 3). This figure is limited to surveys in which the TFR ranged between 4.5 and 5.5 at the time of the survey;1 this controls for variation in the age pattern that occurs over the course of the transition.
FIGURE 3. Age patterns of fertility, by region, when TFR >4.5 and <5.5.
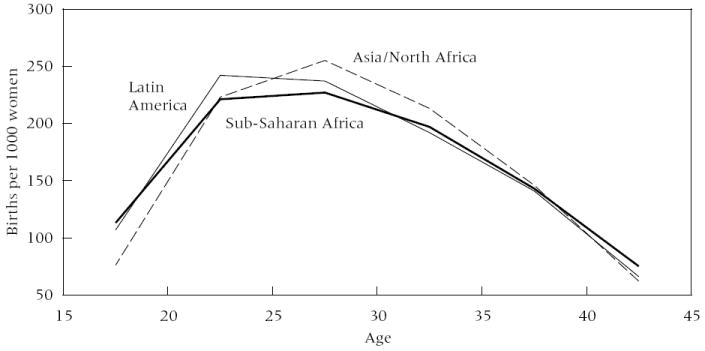
NOTE: Sample is one survey per country, TFR closest to 5.0. Age-specific rates adjusted to sum to TFR = 5.0. n = 38 countries.
Although regional differences are not large, the age pattern of Africa is clearly flatter than the corresponding age patterns in Asia and Latin America. That is, compared with other regions, African fertility is slightly lower at intermediate ages and slightly higher at younger and older ages.
Differences in age patterns are related to differences in the duration of inter-birth intervals. According to Caldwell, Orubuloye, and Caldwell (1992) long birth intervals are a key feature of African childbearing: “Traditionally, long periods of postpartum sexual abstinence were probably standard over most of sub-Saharan Africa, and the practice is still adhered to in much of West, Middle, and Southern Africa” (p. 217).
To examine this issue further, Figure 4 plots the median duration of birth intervals at birth order two for Africa and the other two major regions, as estimated from surveys yielding moderately high levels of fertility (TFR near 5.0). Most of the median intervals in the African countries range between 30 and 40 months, centered around 35 months (almost three years), whereas the median intervals in the other two regions range from 20 to 30 months and are centered around 25–26 months (a bit over two years). Thus, birth intervals in Africa tend to be roughly one year longer than in other regions at this level of fertility (which can be regarded as early transition). These regional differences in birth-interval duration are consistent with the age patterns of fertility observed in Figure 3: longer intervals are associated with flatter patterns. An important inference from Figure 4 is that the potential for fertility decline due to lengthening of inter-birth intervals is less in Africa at present than it was in the other two regions at the equivalent stage of decline.
FIGURE 4. Median second birth interval, when TFR >4.5 and <5.5.
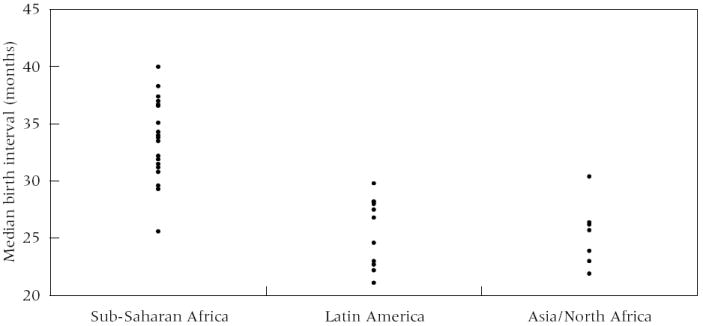
NOTE: Median length of preceding interval for all births in months 0–59 before survey. n = 38 countries.
These findings confirm a key difference in childbearing patterns between Africa and non-African countries. But Figures 3 and 4 shed no direct light on Caldwell’s hypothesis that fertility declines at older ages in Africa are less dominant contributors to the overall decline than elsewhere in the developing world. An assessment of this issue requires the measurement of fertility declines at different ages. In particular we compare the decline in TFR at ages 30+ with the overall decline in the TFR between successive surveys. The results from this exercise are plotted in Figure 5, which shows the ratio of the percentage decline among women ages 30+ to the percentage decline in the TFR. (The percentages are plotted against TFR, to control for stage of fertility decline.) According to Caldwell’s hypothesis this ratio should be near 1 in African countries (indicating similar declines at all ages) and above 1 in countries in Asia and Latin America. In the event, the data in Figure 5 do not confirm this; the majority of median ratios are above 1 in Africa and Latin America and near 1 in Asia at TFRs above 4.5. We therefore do not find support for Caldwell’s hypothesis that African declines are distinctive in this respect.
FIGURE 5. Age pattern of fertility decline, by TFR [percent decline at ages 30+]/[Percent decline all ages].
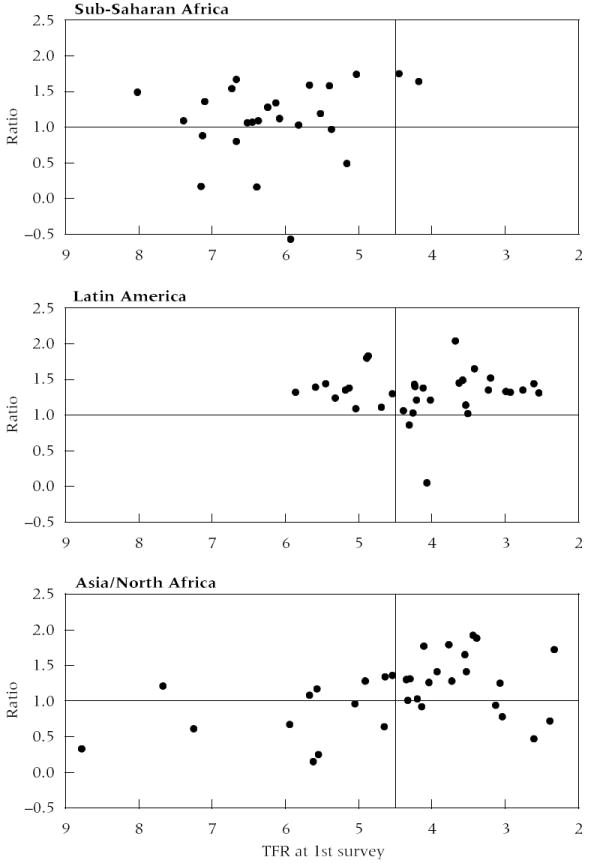
NOTE: n = 49 countries and 92 inter-survey periods; minimum TFR decline = 0.4 births; minimum inter-survey period = 4 years.
Fertility preferences
Fertility preferences represent a key link in the chain of causation between fertility and its socioeconomic determinants. In low-income agricultural societies, parents tend to want relatively large numbers of children while in higher-income societies with more developed secondary and tertiary sectors, women typically want only about two children. The decline in preferences that accompanies development in turn leads to a decline in actual fertility with adoption of birth control (induced abortion and/or contraception).
A standard indicator of lifetime fertility goals is the ideal family size (IFS). In the DHS women are asked, “If you could go back to the time you did not have any children and could choose exactly the number of children to have in your whole life, how many would that be?” Estimates based on this type of question are widely used because they are straightforward to interpret. There are, however, two potential sources of bias: nonresponse and rationalization (Bongaarts 1990). The fraction of women who report a non-numeric response (e.g., up to God) was substantial in some countries in the past but in general has declined over time; in a majority of DHS surveys it is now less than 5 percent. The stated ideal number of children can also be subject to “rationalization bias” when a woman gives an ideal family size that is inflated because she is reluctant to provide a number smaller than her current number of living children. Rationalization and nonresponse are typically higher among older women who have been married many years and have large numbers of living children. To minimize these sources of bias, we present IFS estimates for women who are in their first ten years of marriage.
To describe regional trends in IFS over time, we first examine preference levels at the beginning of the transition. Figure 6 plots IFS as reported in surveys with TFRs above 5.5. While differences between countries are substantial, there are clear and marked inter-regional differences, with the IFS higher in Africa (above 5 in almost all countries, and above 6 in a majority of countries) than in Asia or Latin America, where the IFS exceeds 5 in just a few countries and is below 4 in one-half the countries (combining both regions). In addition, while not shown explicitly in Figure 6, looking separately at countries in East and Southern Africa and countries in Central and West Africa reveals that the IFS is especially high in the latter sub-region.
FIGURE 6. Ideal number of children at onset of transition among women married <10 years.
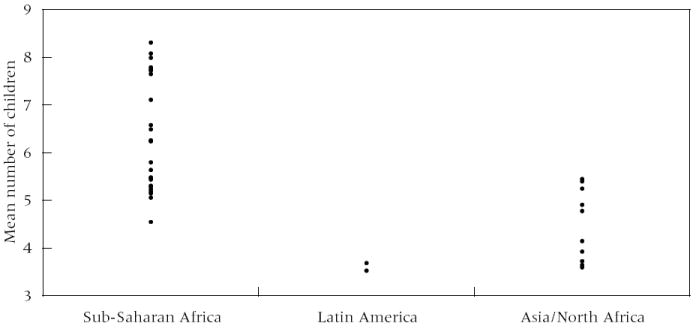
NOTE: Earliest survey, TFR >5.5. n = 37 countries.
Trends in IFS are plotted in Figure 7. Each country is represented by one line connecting IFS at the first and last available survey. The two estimates of IFS are cross-classified by TFR (x-axis). Several conclusions can be drawn. First, over time the IFS and the TFR decline in almost all countries and, as expected, these two indicators are strongly correlated. Second, at any given level of the TFR, the IFS is higher in Africa than in the other two regions. As countries proceed through the fertility transition, however, the African trends in IFS tend to converge on those of Asia and Latin America. Third, despite substantial declines in fertility desires in Africa, the most recent levels of IFS (i.e., the endpoints of the lines in Figure 7) are still relatively high, with a median of 4.6 children per woman. This level is slightly higher than the median IFS of 4.5 for Asia at the beginning of the transition (see Figure 6). These findings suggest that to this point in the fertility transition Africa remains distinctive in its pronatalism, a finding consistent with past literature (e.g., Caldwell and Caldwell 1988).
FIGURE 7. Trends in ideal number of children by total fertility rate.
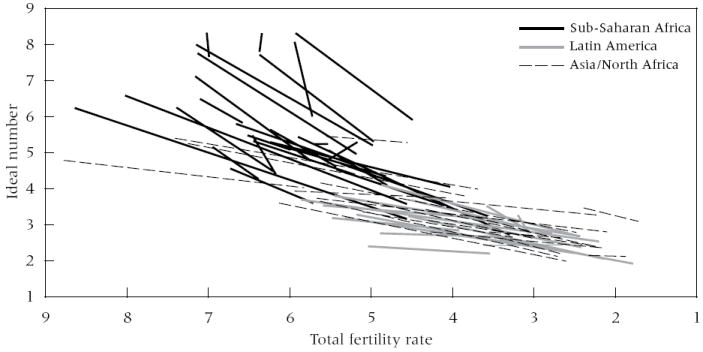
NOTE: Earliest and most recent survey in each country, n = 63 countries.
Preference implementation
In order for declining fertility preferences to have their intended effect of reducing actual fertility, sexually active women must use contraception and/or abortion to prevent unplanned pregnancies. Throughout the developing world a substantial proportion of women who do not want to get pregnant are not using contraception. The reason for this “unmet need” for contraception is that women encounter multiple obstacles to the use of contraception (Bongaarts and Bruce 1995; Cleland et al. 2006; Casterline and Sinding 2000; Casterline, Sathar, and Haque 2001; Westoff and Bankole 1995). These include lack of knowledge of contraceptive methods and sources of supply; low quality and limited availability of family planning services; cost of method, services, travel, and time; health concerns and side effects; objections from husbands or other family members; and concerns about moral and social acceptability.
These obstacles lead some women to forgo contraceptive use despite their wish not to get pregnant. As a result, each year about 80 million unintended pregnancies2 occur in the developing world, which amount to 40 percent of all pregnancies. These unintended pregnancies end in abortions (40 million), unintended births (30 million), or miscarriages (10 million), with detrimental health and economic effects for many women and their families (Singh and Darroch 2012). Unintended births can be further divided into mistimed and unwanted births; the former occur before women reach their desired family size and the latter occur after.
The DHS surveys have developed a standard procedure for estimating the level of unmet need in a population and, indirectly, the total demand for contraception. The latter has two components: demand = current use + unmet need. All elements in this equation are proportions of women currently in union. The proportion currently using contraception is obtained directly from responses to straightforward survey items. Unmet need is the proportion of in-union women who are fecund and do not wish to become pregnant soon but are not using contraception. It is estimated through a complicated algorithm that has been refined over time (Westoff and Ochoa 1991; Bradley et al. 2012). Estimates of demand, current use, and unmet need include both women who state that they want no children in the near term (“spacers”) and women who have reached their desired family size (“limiters”).
We begin our analysis of levels and trends in demand, use, and unmet need by examining patterns in a set of African countries (Figure 8). The time series for demand and unmet need are available only for dates after 1990 because earlier surveys did not collect comparable data. Three key patterns are evident in Figure 8:
Demand rises over time in most countries, as is expected from declines in ideal family size, but the pace of increase is typically not rapid and in some countries demand has stalled since the mid-1990s (e.g., Ghana, Kenya, Niger, Senegal, Zimbabwe).
Contraceptive use generally follows a trajectory that is parallel to demand, but at a lower level.
The trend in unmet need (the difference between demand and use) differs among countries, increasing in some and declining in others. Where unmet need has hardly changed, this is a consequence of parallel trends in demand and use. Even when use is rising rapidly (e.g., in Namibia), unmet need can remain unchanged because demand is rising at the same pace (which increases the fraction of women at risk of unmet need).
FIGURE 8. Historical trends in contraceptive demand and use.
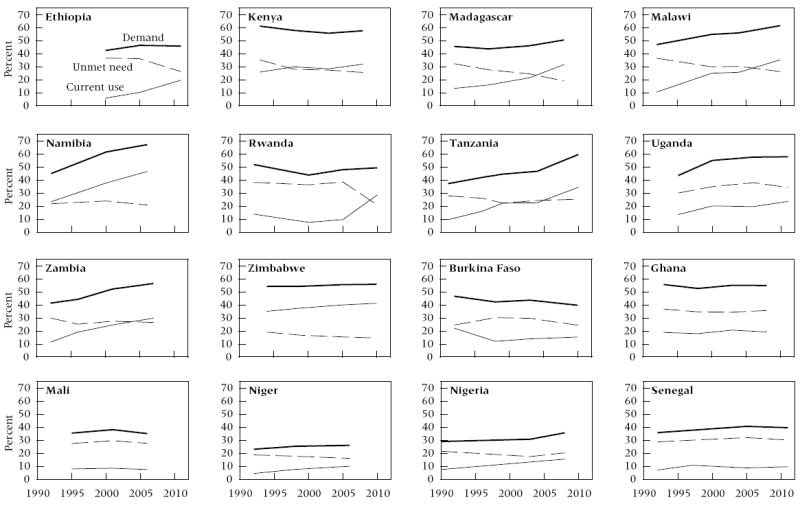
There are also notable differences between sub-regions of Africa. Countries in East and Southern Africa are presented in the upper portion of Figure 8, and countries in Central and West Africa in the lower portion. Demand and use are generally higher in East and Southern than in Central and West Africa, which is consistent with the generally lower levels of fertility and IFS in the former. In addition, in most countries in East and Southern Africa use is increasing and unmet need is falling, and often the two lines cross in the period under observation. In contrast, in the countries of West and Central Africa, the slope of the lines is rather similar and unmet need generally exceeds use.
Rwanda shows the most unusual pattern of change in Figure 8. Before 2005 trends were essentially flat but between 2005 and 2010 demand rose, contraceptive use more than doubled, and unmet need declined by nearly half. A plausible explanation for this rapid increase in use is the impact of a family planning program that has been reinvigorated since the mid-2000s (Solo 2008). The accompanying rise in demand is probably attributable to a combination of two factors:
Rapid socioeconomic change (a booming economy, rising school enrollment, and declining infant and child mortality) since the early 2000s, following a period of political instability and civil war in the 1990s.
The information and education messages from Rwanda’s family planning program. In addition to making contraceptive services more widely available, the program has a well-funded and active country-wide media campaign that provides information about the benefits of contraception and smaller families. Such campaigns can have a substantial impact on reproductive behavior and preferences (Bongaarts 2011; Cleland et al. 2006).
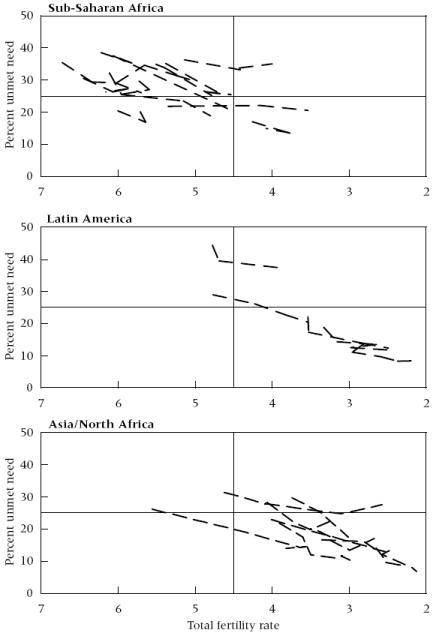
Stepping back and considering regional patterns, Figure 9 plots trends in unmet need for contraception by TFR for each of the three major regions. This figure is limited to experience after the onset of fertility decline.3 Each country is represented by one line connecting unmet need estimates. As was evident in Figure 8, the African results show a mixed pattern, with a few countries experiencing periods of little or no change and others showing decline. The dominant pattern is a decline in unmet need in countries in which fertility is declining.4 In this respect Africa resembles the other two major regions, which are characterized by downward trends in most countries and periods.
FIGURE 9. Trends in unmet need for contraception, by region.
NOTE: Sample is onset of fertility decline as of earliest survey. n = 27 countries.
A further important feature of Figure 9 is that unmet need on average is higher in Africa than in Asia and Latin America. These two non-African regions are more developed and further advanced in their fertility transitions. As a result, women have more knowledge about and access to contraception, and they are more motivated to avoid unplanned pregnancies.
Figure 9 does not provide a sufficient basis for assessing regional differences in the level of unmet need controlling for level of fertility. The overlap between the regions is greatest around a TFR of 4.5 (see vertical line), but even at this level of fertility there are too few observations in each of the three regions from which to draw firm conclusions about either levels or trends. It is too early, therefore, to determine whether unmet need behaves differently in Africa over the course of the fertility transition.
Conclusion
Our analysis reveals several important differences in reproductive behavior between African and non-African countries. Most obviously, current fertility is substantially higher in Africa than elsewhere. Africa is still in the early stages of the fertility transition, while Asia and Latin America are approaching replacement fertility. This difference is not surprising in view of Africa’s lower level of social and economic development and weaker family planning programs.
But an examination of trends and patterns in fertility, family size preferences, and preference implementation reveals other key differences. First, the recent pace of fertility decline in Africa is substantially slower than the pace of decline in Asia and Latin America during the 1970s. In fact, in several African countries the fertility transition appears to have stalled with a TFR near 5. This is a highly unusual event because non-African countries typically experienced an acceleration of the pace of decline in the early stages of their transitions during the 1970s. Second, birth intervals are longer in Africa. The main reason is the well-documented postpartum behaviors (abstinence and breastfeeding) that make African periods of postpartum infecundability longer than elsewhere. Third, ideal family size is higher in Africa. This is expected in part because Africa is still early in its transition, but in fact African societies show a higher ideal family size controlling for stage of the transition. These patterns of ideal family size suggest distinctive pronatalist features of African societies, as argued by Caldwell and his collaborators (1987 (1988). Interestingly, despite its high ideal family size Africa also has a higher unmet need for contraception than other regions. This combination of high ideal family size and high unmet need is the consequence of a low level of preference implementation (i.e., only a relatively small proportion of women who do not want to get pregnant are using contraception), which in turn is the result of multiple obstacles women face in attempting to control their fertility.
We are unable, however, to confirm Caldwell’s hypothesis that sub-Saharan Africa is experiencing a new type of transition in which declines in fertility in the early stages of transition are not due disproportionately to declining age-specific rates at older ages (as is thought to have been the case in Asia and Latin America). Our examination of changes in age-specific fertility rates between successive surveys suggests that Africa does not differ from the other regions—and Asia in particular—in the manner posited by Caldwell.
Several policy implications follow from these findings. The high unmet need for contraception in Africa is indicative of frustrated demand for contraception. The solution to this problem is the implementation of family planning programs. Commitments to family planning in several countries (Ethiopia, Madagascar, Malawi, Namibia, Rwanda) have had the expected result of rising use and declining unmet need. Resource constraints faced by African governments are being addressed with new funding (amounting to $4.6 billion) pledged at the London Family Planning summit in London in July 2012,
Even in the unlikely event that all unmet need could be eliminated, however, Africa’s fertility would remain substantially above contemporary Asian or Latin American levels. The reason is Africa’s high ideal family size, which is clearly an obstacle to rapid fertility decline. In fact, it is one of the main reasons why the current pace of fertility decline is so slow. The conventional view on how to reduce preferences is to invest in social and economic development. There is no doubt that such investments would have a fertility-reducing effect, but this process is likely to take many decades, during which rapid population growth would continue. Fortunately, family planning programs can also bring about changes in preferences through information campaigns that present evidence on the health and socioeconomic benefits of contraception and smaller families. Such messages are particularly effective when they have the support of political leaders.
The most important step required to make progress in addressing high and unwanted childbearing and rapid population growth is for policymakers in Africa to realize that the current demographic trajectory is a major obstacle to their countries’ development. National and international attention to demographic and family planning issues has increased in recent years, following a period of neglect in the 1990s and early 2000s. These concerns have moved higher on the global development agenda because fertility decline provides not only important health benefits but also economic benefits that improve the lives of women and children and their communities.
Acknowledgments
This research was supported in part by grant R24-HD058484 from the Eunice Kennedy Shriver National Institute of Child Health & Human Development awarded to the Ohio State University Institute for Population Research.
Footnotes
Age-specific fertility rates within the group of countries with TFRs between 4.5 and 5.5 are adjusted so that the average TFR for each region equals 5.
Includes pregnancies following contraceptive failure.
Surveys are included if the TFR is 90 percent or less of the country’s maximum TFR as estimated by the United Nations (UN 2011).
Note that Figure 8 includes pre-transition countries, which explains the lesser dominance of decline in unmet need in that figure.
References
- Bledsoe Caroline, Banja Fatoumatta, Hill Allan G. Reproductive mishaps and Western contraception: An African challenge to fertility theory. Population and Development Review. 1998;24(1):15–57. [Google Scholar]
- Bongaarts John. The measurement of wanted fertility. Population and Development Review. 1990;16(3):487–506. [Google Scholar]
- Bongaarts John. Can family planning programs affect high desired family size in sub-Saharan Africa? International Perspectives on Sexual and Reproductive Health. 2011;37(4):209–216. doi: 10.1363/3720911. [DOI] [PubMed] [Google Scholar]
- Bongaarts John, Bruce Judith. The causes of unmet need for contraception and the social content of services. Studies in Family Planning. 1995;26(2):57–75. [PubMed] [Google Scholar]
- Bongaarts John, Watkins Susan Cotts. Social interactions and contemporary fertility transitions. Population and Development Review. 1996;22(4):639–682. [Google Scholar]
- Bradley Sarah EK, Croft Trevor N, Fishel Joy D, Westoff Charles F. DHS Analytical Studies No 25. Calverton, MD: CFI International; 2012. Revising unmet need for family planning. [Google Scholar]
- Bryant John. Theories of fertility decline and the evidence from development indicators. Population and Development Review. 2007;33(1):101–127. [Google Scholar]
- Caldwell John C, Caldwell Pat. The cultural context of high fertility in sub-Saharan Africa. Population and Development Review. 1987;13(3):409–437. [Google Scholar]
- Caldwell John C, Caldwell Pat. Is the Asian family planning program model suited to Africa? Studies in Family Planning. 1988;19(1):19–28. [PubMed] [Google Scholar]
- Caldwell John C, Orubuloye IO, Caldwell Pat. Fertility decline in Africa: A new type of transition? Population and Development Review. 1992;18(2):211–242. [Google Scholar]
- Casterline John. Diffusion processes and fertility transition: Introduction. In: Casterline John., editor. Diffusion Processes and Fertility Transition: Selected Perspectives, Committee on Population, Division of Behavioral and Social Sciences and Education, National Research Council. Washington, DC: National Academy Press; 2001a. [PubMed] [Google Scholar]
- Casterline John., editor. Diffusion Processes and Fertility Transition: Selected Perspectives, Committee on Population, Division of Behavioral and Social Sciences and Education, National Research Council. Washington, DC: National Academy Press; 2001b. [PubMed] [Google Scholar]
- Casterline John B, Perez Aurora E, Biddlecom Ann E. Factors underlying unmet need for family planning in the Philippines. Studies in Family Planning. 1997;28(3):173–191. [PubMed] [Google Scholar]
- Casterline John B, Sathar Zeba A, ul Haque Minhaj. Obstacles to contraceptive use in Pakistan: A study in Punjab. Studies in Family Planning. 2001;32(2):95–110. doi: 10.1111/j.1728-4465.2001.00095.x. [DOI] [PubMed] [Google Scholar]
- Casterline John B, Sinding Steven W. Unmet need for family planning in developing countries and implications for population policy. Population and Development Review. 2000;26(4):691–723. [Google Scholar]
- Cleland John, Wilson Christopher. Demand theories of the fertility decline: An iconoclastic view. Population Studies. 1987;41:5–30. [Google Scholar]
- Cleland John, et al. Family planning: The unfinished agenda. The Lancet. 2006;368(9549):1810–1827. doi: 10.1016/S0140-6736(06)69480-4. [DOI] [PubMed] [Google Scholar]
- Coale Ansley J, Watkins Susan Cotts. The Decline of Fertility in Europe. Princeton University Press; 1986. [Google Scholar]
- Easterlin Richard A. An economic framework for fertility analysis. Studies in Family Planning. 1975;6(3):54–63. [PubMed] [Google Scholar]
- Easterlin Richard A. The economics and sociology of fertility: A synthesis. In: Tilly Charles., editor. Historical Studies of Changing Fertility Princeton University Press. 1978. pp. 57–113. [Google Scholar]
- Knodel John, van de Walle Etienne. Lessons from the past: Policy implications of historical fertility studies. Population and Development Review. 1979;5(2):217–245. [Google Scholar]
- Lee Ronald D, Bulatao Rodolfo A. The demand for children: A critical essay. In: Bulatao Rodolfo A, Lee Ronald D., editors. Determinants of Fertility in Developing Countries: A Summary of Knowledge. New York: Academic Press; 1983. [Google Scholar]
- Machiyama Kazuyo. DHS Working Papers No 68. Calverton, MD: ICF Macro; 2010. A re-examination of recent fertility declines in sub-Saharan Africa. [Google Scholar]
- Notestein Frank. Population—the long view. In: Schultz Theodore W., editor. Food for the World. Chicago University Press; 1945. pp. 36–57. [Google Scholar]
- Notestein Frank. Economic problems of population change. Proceedings of the Eighth International Conference of Agricultural Economists; London: Oxford University Press; 1953. pp. 13–31. [Google Scholar]
- Singh Susheela, Darroch Jacqueline. Adding It Up: Costs and Benefits of Contraceptive Services—Estimates for 2012. New York: Guttmacher Institute and United Nations Population Fund (UNFPA); 2012. [Google Scholar]
- Solo Julie. Family planning in Rwanda: How a taboo topic became priority number one. IntraHealth International; Chapel Hill, NC: 2008. [Google Scholar]
- United Nations (UN) World Population Prospects: The 2010 Revision. New York: Department of Social Affairs, Population Division, United Nations; 2011. [Google Scholar]
- Watkins Susan Cotts. Conclusions. In: Coale Ansley J, Watkins Susan Cotts., editors. The Decline of Fertility in Europe. Princeton University Press; 1986. [Google Scholar]
- Watkins Susan Cotts. The fertility transition: Europe and the third world compared. Sociological Forum. 1987;2(4):645–673. [Google Scholar]
- Westoff Charles F, Bankole Akinrinola. Demographic and Health Surveys Comparative Studies No 16. Calverton, MD: Macro International; 1995. Unmet need: 1990–1994. [Google Scholar]
- Westoff Charles F, Ochoa Luis Hernando. Demographic and Health Surveys Comparative Studies No 5. Columbia: Institute for Resource Development; 1991. Unmet need and the demand for family planning. [Google Scholar]


